Abstract
The large amount of carbon stored in trees and soils of the Amazon rain forest is under pressure from land use as well as climate change. Therefore, various efforts to monitor greenhouse gas exchange between the Amazon forest and the atmosphere are now ongoing, including regular vertical profile (surface to 4.5 km) greenhouse gas measurements across the Amazon. These profile measurements can be used to calculate fluxes to and from the rain forest to the atmosphere at large spatial scales by considering the enhancement or depletion relative to the mole fraction of air entering the Amazon basin from the Atlantic, providing an important diagnostic of the state, changes and sensitivities of the forests. Previous studies have estimated greenhouse gas mole fractions of incoming air (‘background’) as a weighted mean of mole fractions measured at two background sites, Barbados (Northern Hemisphere) and Ascension (Southern hemisphere) in the Tropical Atlantic, where the weights were based on sulphur hexafluoride (SF6) measured locally (in the Amazon vertical profiles) and at the two background sites. However, this method requires the accuracy and precision of SF6 measurements to be significantly better than 0.1 parts per trillion (picomole mole−1), which is near the limit for the best SF6 measurements and assumes that there are no SF6 sources in the Amazon basin. We therefore present here an alternative method. Instead of using SF6, we use the geographical position of each air-mass back-trajectory when it intersects the limit connecting these two sites to estimate contributions from Barbados versus Ascension. We furthermore extend the approach to include an observation site further south, Cape Point, South Africa. We evaluate our method using CO2 vertical profile measurements at a coastal site in Brazil comparing with values obtained using this method where we find a high correlation (r2 = 0.77). Similarly, we obtain good agreement for CO2 background when comparing our results with those based on SF6, for the period 2010–2011 when the SF6 measurements had excellent precision and accuracy. We also found high correspondence between the methods for background values of CO, N2O and CH4. Finally, flux estimates based on our new method agree well with the CO2 flux estimates for 2010 and 2011 estimated using the SF6-based method. Together, our findings suggest that our trajectory-based method is a robust new way to derive background air concentrations for the purpose of greenhouse gas flux estimation using vertical profile data.
1. Introduction
The Amazon basin hosts the largest tropical rainforests by area, containing 10–20% of global biomass in aboveground biomass and soils [1] and on the order of 25% of its area is seasonally flooded. It is thus an important component of both the global carbon dioxide (CO2) and methane (CH4) cycles. Amazon forests and ecosystems are under threat from land use and potentially from increasingly hotter and more variable climate, which may for example promote increased feedbacks between fire and forest composition. Amazon greenhouse gas (GHG) balances provide a diagnostic of the state, changes and sensitivities of the Amazon forest and wetlands [2]. Considering the amount of stored carbon in the Amazon and the capacity for rapid carbon release, there have been few efforts to make long-term sustained GHG observations representative of large regions in this area.
In recognition of this need, several measurement programs are now in operation. One particular program measures regular vertical profiles (surface to 4.5 km height above sea level) at four sites to characterize the Amazon lower tropospheric CO2, CH4, nitrous oxide (N2O) and carbon monoxide (CO) distribution over time [3]. One possibility to estimate greenhouse gas balances using these data is a Lagrangian (air-mass following) column budgeting approach known as Column Integration Technique (CIT) [3,4,5,6]. In this framework, the air entering the Amazon accumulates flux from the surface along its path. Thus, the difference between the site measurements and the background (BKG), should be directly related to terrestrial GHG fluxes from all source and sink processes [4,6]. Hence, the determination of BKG concentrations is as important as the vertical profile measurement.
Given the lack of a ‘fence’ of measurement sites along the Atlantic coast where air enters the Amazon, alternative approaches need to be used to estimate BKG air concentrations. One approach successfully applied is a weighted mean of GHG mole fractions measured from National Oceanic and Atmospheric Administration (NOAA) Global Monitoring Laboratory (GML) global air-sampling network at the remote sampling sites at Ascension Island (ASC; 7.9 S, 14.4 W) and Barbados (RPB; 13.2 N, 59.4 W), and to estimate the weights from locally measured sulphur hexafluoride (SF6) and SF6 measured at these two Atlantic sites [3,4,5,6,7]. The use of SF6 as an air-mass tracer essentially requires no emissions of SF6 to occur between the coast and the measurement sites. SF6 is a synthetic GHG, thus there are no natural sources, however, due to the use of SF6 as an electrical isolator in high voltage systems [8] and the building of several hydropower plants such as the Belo Monte at Xingu river and Santo Antônio at Madeira river, this requirement could be compromised. Most importantly, the SF6 method requires extraordinary measurement precision, of order 0.05 parts per trillion (ppt), as well as accuracy of the same order. In the particular case of estimating background values for Amazonian vertical profiles, biases between SF6 measured by NOAA at its tropical Atlantic sites Barbados (RPB) and Ascension Island (ASC) and SF6 measured from Amazonian vertical profiles as small as 0.1 ppt can result in CO2 background errors as large as 3 ppm. BKG errors this large can result in substantial CO2 flux errors of order 0.9 mol m−2 s−1.
To create a more reliable technique to estimate BKG concentrations we therefore have developed the Air-Mass Back-Trajectories Method (AMBaM) which does not require a direct GHG measurement as an air-mass tracer, instead replacing it with the Hybrid Single-particle Lagrangian Integrated Trajectory (Hysplit) transport and dispersion model air-mass back-trajectories. We first introduce the new approach and then evaluate our method in different ways: we compare our BKG estimates with 105 samples obtained in vertical profiles performed at a coastal site in Brazil. In addition, we compare our new BKG approach results for CO2, CH4, N2O and CO with the results obtained using the SF6-based method, obtained in vertical profiles during the years 2010 and 2011. Furthermore, to analyse the impact of our new approach on flux estimates, we applied the same Lagrangian column budgeting approach presented in Gatti et al. (2014) [3] and compared the results.
2. Results and Discussion
AMBaM Validation
We illustrate and test the new BKG method using data from vertical profiles obtained at four sites over the Amazon during the years of 2010 and 2011: Alta Floresta (ALF; 8.80 S, 56.75 W), Rio Branco (RBA; 9.38 S, 64.8 W), Santarém (SAN; 2.86 S, 54.95 W) and Tabatinga (TAB; 5.96 S, 70.06 W). Furthermore, since the main purpose of BKG calculations is to determine the air masses GHG concentrations that enters to Brazil towards to Amazon, we applied the AMBaM to simulate and compare the CO2 concentrations with 22 aircraft vertical profiles performed at the coastal site Salinópolis (SAH; 0.76 S, 47.8 W) in 2013 and 2014.
To compare the AMBaM BKG results with measurements obtained in SAH, the BKG was simulated using the same sampling date, time, height and, to avoid surface influence, we excluded the samples taken bellow 4 km of altitude. We found a coefficient of determination (r2) of 0.77 and a slope () of 1.02 (Figure 1), showing consistency between the BKG predicted by AMBaM and the column integral of CO2 at the coast. The same approach was presented by Gatti et al. (2010) [6] to validate the BKG predicted by the SF6-based method. The authors simulated the CO2 BKG concentration using 11 vertical profiles measured at the coastal site called Fortaleza, presenting a coefficient of determination (r2) of 0.7.
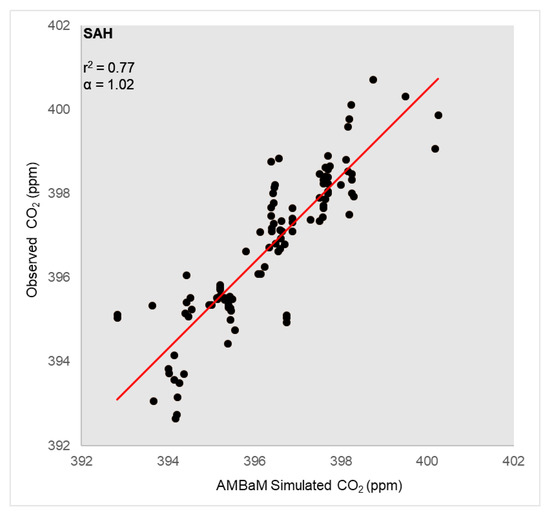
Figure 1.
Correlation between CO2 background (BKG) predicted by Air-Mass Back-Trajectories Method (AMBaM) and CO2 samples profiles above 4 km altitude taken at SAH.
We also applied two statistical tests, the F-test and the T-test, to test whether BKG determined from the SAH samples are equal to the AMBaM BKG.
To test the variances, the F-test was applied, showing the ratios of variances equal to 0.73, inside of the 95% confidence interval (0.49–1.06) and, analyzing the p-value (0.103), it was possible to conclude there was no significant difference between the variances of the two sets of data. Therefore, the classic t-test was applied assuming equality of the two variances and the results showed a level of significance higher than 5% (0.113), which lead us to accept the null hypothesis which means that statistically, the sampled data and the simulated data could belong to the same data set, although there were differences in the means of the two data sets.
Furthermore, we verified the reliability of the AMBaM comparing CO2 BKG estimates with our new method and the SF6-based method presented by Gatti et al. (2014) [3]. Differently than AMBaM which provides a BKG value for each sample in a profile, the SF6-based method used by Gatti et al. (2014) [3] provides only one averaged BKG value per profile. Hence, for the purpose of comparability, the AMBaM BKG results for each profile were averaged. In addition, using the 2010 and 2011 data from the same four regular vertical profiles sites at Amazon, we extended and tested our method for CH4, CO and N2O as well as CO2.
Figure 2 shows the linear regressions for the four studied gases for both methods, with their respective coefficient of determination (r2) and the slope (). All slope results were higher than 0.8, indicating that the two methods yield comparable results. Regarding to the coefficients of determination (r2) the lower result was 0.60, reflecting strong correlation between the two methods. N2O (r2 = 0.95, = 1.00) followed by CO2 (r2 = 0.73, = 0.95) showed the best agreement between the studied gases while CH4 (r2 = 0.60, = 0.89) and CO (r2 = 0.67, = 0.81) showed larger differences between the methods.
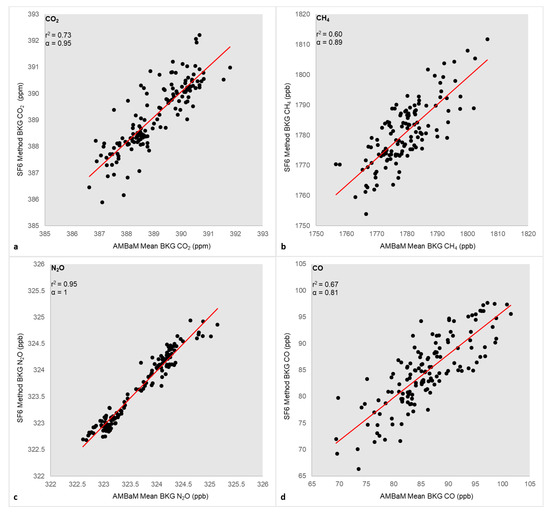
Figure 2.
Correlation between BKG methods results, AMBaM and SF6-based, and its coefficient of determination (r2) and the slope () for the studied gases. (a) CO2 results. (b) CH4 results. (c) N2O results. (d) CO results.
While the method used by Gatti et al. (2014) [3] is based on the two background stations RPB and ASC, we add a third station located farther south to capture background air-mass concentrations of trajectories traveling from below the latitude of ASC, which often represent lower GHG concentration relative to trajectories originating in higher latitudes. Adding Cape Point station (CPT; 34.35 S, 18.48 W) can impact the BKG determination depending on the number of trajectories with southern origins for a given profile and the magnitude of differences between the global station GHG concentrations at the time (Figure 3). In general, it can result in a decrease in the averaged BKG, thus causing more positive fluxes for Amazon.
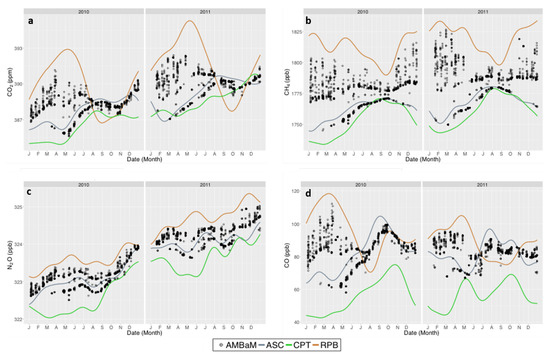
Figure 3.
Barbados (RPB), Ascension Island (ASC) and Cape Point station (CPT) 2010 and 2011 time series with the AMBaM BKG results per profile for the studied gases. (a) CO2 results. (b) CH4 results. (c) N2O results. (d) CO results.
Differences between the methods were expected due to two main reasons. The SF6-based method did not comprise CPT measurements, rounding up the BKG values to the ones found in ASC when BKG results were lower than ASC results. In AMBaM BKG results, 27.7% of ALF air-mass back-trajectories showed an origin below ASC latitude, followed by TAB (19.9%), RBA (18.8%) and SAN (18.5%) which added important information to the BKG, but increased the differences between the methods results. The second reason was the ability of AMBaM to provide a BKG value for each sample in a profile. In Figure 3 it was possible to identify how CPT influenced the BKG results per profile on the AMBaM, where it could also enlighten why the CH4 and CO linear regressions showed higher dispersion (Figure 2). These gases presented a higher range of differences between RPB and CPT, which could represent a larger variation on a profile BKG calculation, which may have caused a reduction on the averaged AMBaM BKG result in comparison with the SF6-based BKG. In contrast, when the global stations presented a smaller variation, the correlation between the two methods was higher, because even though the BKG profile still presented different origins of air mass back-trajectories, due to the lower variation between the global stations results, the differences between methods were minimized.
As a further evaluation of our new method, to verify its influence on the determination of the Amazon Basin carbon flux, the results by profile were applied to the data presented in Gatti et al. (2014) [3], replacing the SF6-based BKG with the AMBaM BKG. Table 1 shows the comparison of the two BKG methods for yearly total flux estimates by site, and the scaled flux for the Amazon Basin. Addressing the subject of comparison between methods, the flux uncertainties using AMBaM BKG presented in Table 1 were related to the SF6 BKG based flux results by the absolute error of each profile.

Table 1.
Comparison between BKG methodologies on flux results.
Applied to the CIT, the flux results using the AMBaM BKG were similar to the SF6-based BKG method in all the four observational sites, which maintained the source or sink behaviour within the years and sites. In a final test, the flux estimates were scaled to the tropical South America forested area, using a basin area of 6.77 × 10⁶ km2 [3]. Once again, both BKG methods presented similar results to scaled flux. With AMBaM BKG, 2010 represented a source to the atmosphere of 0.41 ± 0.10 Pg C yr−1 and 2011 showed a neutral carbon balance (0.00 ± 0.15 Pg C yr−1), while the results presented by Gatti et al. (2014) [3] for 2010 and 2011 were 0.48 ± 0.18 and 0.06 ± 0.10 Pg C yr−1 respectively. All the results combined give us the confidence to replace the SF6-based method by AMBaM.
3. Materials and Methods
3.1. Sampling
The sampling flights were performed using small aircraft, regularly two times per month, over the same geographical position for each site, at between 12–13 h local time, in a descending spiral profile avoiding the emission from the aircraft. Profiles typically included 12–17 air samples between 300 and 4500 m above sea level [3]. We also tested the new method using data from a upper portion of higher vertical profiles (6500–4000 m above sea level) sampled at the coastal site SAH in 2013 and 2014.
3.2. Method Development
AMBaM is a method to allow for BKG calculation using the sampling location and open source code and data from the Hysplit model and mole fraction data from background sites, in our case RPB, ASC and CPT. Figure 4 shows the overall scheme of the AMBaM.
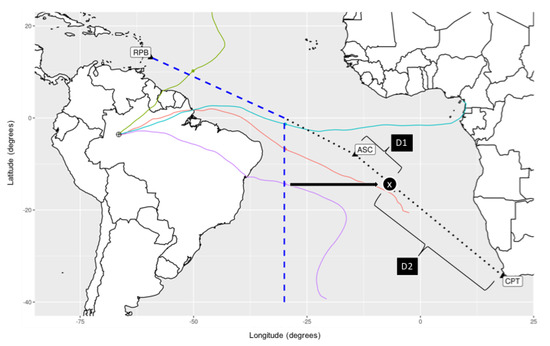
Figure 4.
Air-mass back-trajectories method scheme. Blue dashed line is the Virtual Limit. Green, red, cyan and purple are examples of air-mass back-trajectories. D1 and D2 are the distances between the projected (black arrow) position “X” and the NOAA global stations, using the purple air-mass back-trajectory as an illustration of the AMBaM BKG calculation.
The atmospheric air circulation over the Amazon is characterized by trade-wind easterlies coming from the tropical Atlantic Ocean [4] and moving towards the Andes (west). This particular behaviour allows us to relate the BKG using the data from the NOAA Global Monitoring Laboratory (NOAA/GML) at Global Greenhouse Gas Reference Network (GGGRN) at the Atlantic Ocean using air-mass back-trajectories [6,9]. Taking advantage of the air circulation pattern, the geographical position of each sample trajectory was used to calculate the BKG.
Based on Alden et al. (2016) [10], who determined the limit of −30 W as the inversion model’s region where CO2 BKG was estimated, two segments of a virtual limit (VL) were developed, defining the limits of the domain through which incoming air passes. The first one is a latitude limit, from the Equator southwards at 30 W, and the second segment is a line from the Equator to RPB (dashed blue lines in Figure 4). From the location that the air mass back-trajectory crosses the VL, a horizontal projection is made to a second set of lines extending between (a) CPT and ASC and (b) ASC and RPB (Figure 4). The intersection of this projection and the lines between the sites determines the crossing point (“X” in Figure 4). The distance between the projected point and the global stations (D1 and D2 in Figure 4) determines the weighting of the GHG concentrations at each global station as shown Equation (1).
where is the GHG mole fraction of the higher latitude global station, is the GHG mole fraction of the lower latitude global station, D1 is the distance between the projected crossing point and the higher latitude global station, D2 is the distance between the projected crossing point and the lower latitude.
The calculations described above were run using the open source software R and GNU Parallel. R is a well-known, open source software environment for statistical computing and a general programming language [11]. GNU Parallel is a tool for parallel computing [12]. The AMBaM algorithm and the data applied on this study are open source and can be accessed trought the pathway presented at Supplementary Materials.
4. Conclusions
The AMBaM method showed robust results compared to previous ones for the Amazon Basin, not only when compared the BKG results themselves but, when applied to the Column Integration Technique, the fluxes results were similar. The comparison validation with the SAH coastal site also showed good agreement. All the studies together support the AMBaM application as an appropriate BKG method for the Amazon Basin. It is also a low-cost approach using available resources and open source data.
Supplementary Materials
The AMBaM algorithm used to calculate BKG is open source and accessible through the Github platform, under the name cqmaTools by the link: https://github.com/INPE-LAGEE/cqmaTools. The data applied to the studies are available online at http://www.ccst.inpe.br/projetos/lagee/.
Author Contributions
L.G.D., L.V.G., A.S. and M.G. contributed with the AMBaM conceptualization, formal analysis, writing—original draft preparation and/or review and editing. C.C. also contributed trough the original draft preparation. W.P., J.M. and J.T. contributed adding relevant reviews and editing. R.S., L.M., S.C. and R.N. added an important contribution by projects administration and data curation. A.A. and G.C. contributed as Ph.D. supervisors from the authors L.G.D. and A.S. respectivtly. L.V.G., M.G. and J.M. were also responsible for the funding acquisition for all measurements presented on this article. All authors have read and agreed to the published version of the manuscript.
Funding
This study was financed in part by the Coordenação de Aperfeiçoamento de Pessoal de Nível Superior—Brasil (CAPES)—Finance Code 001. FAPESP (process FAPESP 2016/02018-2, 2018/14423-4), CNPq (process CNPq 480713/2013-8), ERC (European Research Council, program Horizon 2020), ERC (project GeoCarbon), MCTI, IPEN and INPE. Gilberto Câmara and Alber Sánchez are supported by the São Paulo Research Foundation (FAPESP) e-science program (grant 2014-08398-6). Gilberto Câmara is also supported by CNPq (grant 312151-2014-4). Wouter Peters received funding from ERC project ASICA (G.A. 649087).
Acknowledgments
The authors gratefully acknowledge the NOAA Air Resources Laboratory (ARL) for the provision of the HYSPLIT transport and dispersion model and/or READY website (http://www.ready.noaa.gov) used in this publication.
Conflicts of Interest
The authors declare no conflict of interest.
References
- Houghton, R.; Lawrence, K.T.; Hackler, J.L.; Brown, S. The spatial distribution of forest biomass in the Brazilian Amazon: A comparison of estimates. Glob. Chang. Biol. 2001, 7, 731–743. [Google Scholar] [CrossRef]
- Gloor, M.; Gatti, L.; Brienen, R.; Feldpausch, T.R.; Phillips, O.L.; Miller, J.; Ometto, J.P.; Rocha, H.; Baker, T.; De Jong, B.; et al. The carbon balance of South America: A review of the status, decadal trends and main determinants. Biogeosciences 2012, 9, 5407–5430. [Google Scholar] [CrossRef]
- Gatti, L.V.; Gloor, M.; Miller, J.B.; Doughty, C.E.; Malhi, Y.; Domingues, L.G.; Basso, L.S.; Martinewski, A.; Correia, C.S.C.; Borges, V.F.; et al. Drought sensitivity of Amazonian carbon balance revealed by atmospheric measurements. Nature 2014, 506, 76–80. [Google Scholar] [CrossRef] [PubMed]
- Miller, J.B.; Gatti, L.V.; D’Amelio, M.T.; Crotwell, A.M.; Dlugokencky, E.J.; Bakwin, P.; Artaxo, P.; Tans, P.P. Airborne measurements indicate large methane emissions from the eastern Amazon basin. Geophys. Res. Lett. 2007, 34. [Google Scholar] [CrossRef]
- D’Amelio, M.T.S.; Gatti, L.V.; Miller, J.B.; Tans, P. Regional N2O fluxes in Amazonia derived from aircraft vertical profiles. Atmos. Chem. Phys. Discuss. 2009, 9, 17429–17463. [Google Scholar] [CrossRef]
- Gatti, L.V.; Miller, J.B.; D’Amelio, M.T.S.; Martinewski, A.; Basso, L.S.; Gloor, M.E.; Wofsy, S.; Tans, P. Vertical profiles of CO2 above eastern Amazonia suggest a net carbon flux to the atmosphere and balanced biosphere between 2000 and 2009. Tellus B 2010, 62, 581–594. [Google Scholar] [CrossRef]
- Basso, L.S.; Gatti, L.V.; Gloor, M.; Miller, J.B.; Domingues, L.G.; Correia, C.S.; Borges, V.F. Seasonality and interannual variability of CH4 fluxes from the eastern Amazon Basin inferred from atmospheric mole fraction profiles. J. Geophys. Res. 2016, 121, 168–184. [Google Scholar] [CrossRef] [PubMed]
- Gloor, M.; Dlugokencky, E.; Brenninkmeijer, C.; Horowitz, L.; Hurst, D.F.; Dutton, G.; Crevoisier, C.; Machida, T.; Tans, P. Three-dimensional SF 6 data and tropospheric transport simulations: Signals, modeling accuracy, and implications for inverse modeling. J. Geophys. Res. 2007, 112, 1–17. [Google Scholar] [CrossRef]
- Gerbig, C.; Lin, J.C.; Wofsy, S.C.; Daube, B.C.; Andrews, A.E.; Stephens, B.B.; Bakwin, P.S.; Grainger, C.A. Toward constraining regional-scale fluxes of CO2 with atmospheric observations over a continent: 2. Analysis of COBRA data using a receptor-oriented framework. J. Geophys. Res. Atmos. 2003, 108. [Google Scholar] [CrossRef]
- Alden, C.B.; Miller, J.B.; Gatti, L.V.; Gloor, M.M.; Guan, K.; Michalak, A.M.; van der Laan-Luijkx, I.T.; Touma, D.; Andrews, A.; Basso, L.S.; et al. Regional atmospheric CO2 inversion reveals seasonal and geographic differences in Amazon net biome exchange. Glob. Chang. Biol. 2016, 22, 3427–3443. [Google Scholar] [CrossRef] [PubMed]
- Ihaka, R.; Gentleman, R. R: A Language for Data Analysis and Graphics. J. Comput. Graph. Stat. 1996, 5, 299. [Google Scholar] [CrossRef]
- Tange, O. GNU Parallel—The Command-Line Power Tool. Usenix Mag. 2011, 36, 42–47. [Google Scholar]
© 2020 by the authors. Licensee MDPI, Basel, Switzerland. This article is an open access article distributed under the terms and conditions of the Creative Commons Attribution (CC BY) license (http://creativecommons.org/licenses/by/4.0/).