Article

Fast Warming Has Accelerated Snow Cover Loss during Spring and Summer across the Northern Hemisphere over the Past 52 Years (1967–2018)

1
State Key Laboratory of Cryosphere Sciences, Altai Kuwei Snow Station, Northwest Institute of Eco-Environment and Resources, Chinese Academy of Sciences, Lanzhou 730000, China
2
College of Environmental and Resource Science, Chengdu University of Information Technology, Chengdu 610225, China
*
Author to whom correspondence should be addressed.
Atmosphere 2020, 11(7), 728; https://doi.org/10.3390/atmos11070728
Submission received: 25 May 2020 / Revised: 27 June 2020 / Accepted: 5 July 2020 / Published: 8 July 2020
(This article belongs to the Section Climatology)

Abstract

:
With snow cover changing worldwide in several worrisome ways, it is imperative to determine both the variability in snow cover in greater detail and its relationship with ongoing climate change. Here, we used the satellite-based snow cover extent (SCE) dataset of National Oceanic and Atmospheric Administration (NOAA) to detect SCE variability and its linkages to climate over the 1967–2018 periods across the Northern Hemisphere (NH). Interannually, the time series of SCE across the NH reveal a substantial decline in both spring and summer (−0.54 and −0.71 million km2/decade, respectively), and this decreasing trend corresponded with rising spring and summer temperatures over high-latitude NH regions. Among the four seasons, the temperature rise over the NH was the highest in winter (0.39 °C/decade, p < 0.01). More precipitation in winter was closely related to an increase of winter SCE in mid-latitude areas of NH. Summer precipitation over the NH increased at a significant rate (1.1 mm/decade, p < 0.01), which likely contribute to the accelerated reduction of summer’s SCE across the NH. However, seasonal sensitivity of SCE to temperature changes differed between the Eurasian and North American continents. Thus, this study provides a better understanding of seasonal SCE variability and climatic changes that occurred at regional and hemispheric spatial scales in the past 52 years.

1. Introduction

The maximum terrestrial snow cover extent (SCE) over the land surfaces of the Northern Hemisphere (NH) is approximately 47 million km2 for the end of 20th century [1,2], covering nearly half of its landmass. Terrestrial snow cover is not only the most extensive component of the cryosphere, but also the most seasonally and rapidly changing cryospheric variable [3]. This pronounced variability in pattern, area, and spatiotemporal distribution of snow cover over the NH strongly affects the surface energy balance, water cycle, climatic changes, ecosystem environment, and human activities [4,5]. For example, Zhang et al. [6] determined that East Asian summer precipitation is significantly associated with the west–east dipole pattern of spring snow decrement, which is triggered by anomalous mid-latitude Eurasian thermodynamic processes. Specifically, reduced spring snow cover corresponds to anomalously dry local soil conditions from spring to the following summer, thereby increasing surface the heat flux and near-surface temperatures. Cohen [7] studied the potential impact of snow cover anomalies on remote and local atmospheric dynamics, showing that snow cover variability over the NH anomaly caused large-scale general atmospheric circulation patterns to change at mid-high latitudes in winter. Pulliainen et al. [8] analyzed trends in advanced spring recovery of the NH boreal evergreen forests carbon uptake over several years, and then linked the variation to trends of spring snowmelt’s timing over the NH. In recent years, researchers have sought to quantify the economic benefits provided by snow cover; they pointed out that the total value of snow resources in North America’s mountainous area would exceed a trillion dollars [9]. Accordingly, stark changes in snow cover over the NH may impact the benefit that societies currently enjoy and may obtain in the future.
At both the regional and hemisphere scale, SCE has gradually declined in the last few decades, and this variation rate depended on the length and seasonal scale of the time series and datasets uses. For the period of 1972–1992, Groisman et al. [10] found that NH’s mean annual SCE decreased by 10% (2.3 million km2), with a substantial retreat of SCE occurring over the second half of the hydrologic year (i.e., April through September); those same authors also suggested that the retreat of SCE has contributed to higher air temperatures through positive radiation feedback. In another work, Brown and Robinson [11] reported that, across the NH, the spring SCE retreated by 0.8 million km2/decade from 1970 to 2010, based on multiple satellites datasets and climate re-analysis products. Analyzing the National Oceanic and Atmospheric Administration’s (NOAA) weekly snow cover datasets, Dery and Brown [12] discovered annual decreases in SCE of −1.28, −0.78, and −0.48 million km2 during the past 35 years (1972–2006) over the NH, North America (NA), and Eurasia (EA), respectively, based on weekly mean SCE values excluding the months of July and August. Hori et al. [13] developed a 5-km daily SCE product, derived from satellite-borne optical sensors, which revealed from 1978 to 2015 negative trends of −0.39 (winter), −0.26 (spring), −0.15 (summer), and −0.93 (autumn) km2/decade, respectively. The Arctic is another important large region of the NH, where snow has far-reaching effects on ecosystem processes and biodiversity. However, June SCE in the Arctic is currently being lost at rate of 13.6% per decade for the period 1967–2018 [14]. According to the in situ dataset, no long-term trends in snow cover variation are evident in western China, for which large inter-annual variations are superimposed on weak trend of SCE and snow depth increase for the period 1951–1997 [15,16].
The key reasons for why SCE has changed over different regions of the NH have been discussed before. For example, surface net radiation and sensible heat flux are, respectively, the primary and secondary source of energies that contributed to snow cover changes over North American and Eurasian land surfaces [17]. Surface energy changes can increase air temperature and water vapor cycling, and surface energy changes are driven by changes in land surface albedo. Albedo in turn is related to a changed SCE. The Arctic Oscillation is closely linked to the variability in Eurasia’s October SCE, which shows seasonally asymmetric trends between spring and fall [18]. Further, McCabe et al. [19] pointed out that decreases in the March SCE of NH may be associated with a poleward storm track and circumpolar vortex shrinkage, leading to less snowfall at low- and mid-latitudes, but more of it at high-latitudes. To summarize, there are regional differences in the main factors contributing to SCE changes, which depend on seasonal climate characteristics and received solar radiation.
This study’s aim is to explore NH’s variation of snow cover in greater detail through a spatially and temporally complete dataset. Using this, we investigated the spatiotemporal characteristics of recent trends in NH at the scale of seasons in order to strengthen our understanding of contemporary SCE changes (i.e., recent half-century). To do that, we analyzed SCE’s seasonal trends for the NH, NA, and EA for the period 1967–2018, based on the NOAA/NCDC(National Climatic Data Center) climate dataset. The trends for the same period in seasonal climate change were also assessed to explore their possible influence upon NH’s changed SCE. We had three objectives: (1) to analyze seasonal/spatial changes of SCE across NH, North America, and Eurasia and uncover their regional differences; (2) to identify possible causes and principal factors governing SCE variability, by relating it to main climate variables (temperature, precipitation); and, (3) to evaluate whether reported associations between SCE and climate warming have been consistent in the last 52 years.

2. Datasets and Methods

2.1. Satellite-Based Snow Cover Dataset

We used the Northern Hemisphere SCE dataset from Rutgers University Global Snow Lab [20]. SCE data were derived from NOAA/NCDC climate dataset recorded for the NH [21,22]. The SCE data synthesizes the GOES (Geostationary Operational Environmental Satellite Program), AVHRR (The Advanced Very High Resolution Radiometer), and other visible-band satellite data [23,24], spanning October 1966 to the present. We analyzed variability, trends, as well as climatic drivers using a monthly SCE time series (1967–2018). Specifically, we relied on monthly SCE data over the NH, EA and NA to analyze seasonal variation of SCE and discern long-term (52 years) trends in SCE from 1967 through 2018 (Figure 1). Meanwhile, NH includes EA, NA, and Greenland in our analysis. We applied a mean interpolation method to replace any missing values in 1967–1971, the missing value accounts for 1.4% (9 individual months) of the study period. To detect seasonal SCE variability and its relationships with seasonal climatic variables, the seasons were defined, as follows: winter (December–February), spring (March–May), summer (June–August), and autumn (September–November).
The NOAA dataset is considered to be reliable for continental-scale studies of snow cover variability. It has been widely applied for different regions and proven itself to be appropriate for determining SCE’s change at monthly, seasonally, and annual time scales. Not surprisingly this product is heavily used in the climatic and hydrological research fields; for example, to identify and extract seasonal streamflow signals in river basins, which can be readily plugged into existing streamflow forecast models, such as the Natural Resources Conservation Service’s (NRCS) Visual Interactive Prediction and Estimation Routines (VIPER) [25]. The NOAA dataset has also been used to investigate the teleconnection pattern of SCE to Pacific-North American (PNA) index variability [26]. In another example, Medler et al. [27] used this SCE data to explore its relationship to summer wildfire patterns, because spatial and temporal patterns of snow influence soil moisture and plant growth, both of which are relevant to summer wildfire risk and spread. More studies using this SCE dataset include those that address snow melt timing, spring snowline, frozen season changes, and severe snowstorms, among others [28,29,30].

2.2. Temperature and Precipitation Data

We used monthly temperature and precipitation data of land obtained from the CRU (Climatic Research Unit) 4.0 [31] over the period of 1967 to 2018 in order to detect possible drivers of SCE’s variability. The CRU dataset was developed and has been subsequently updated, improved, and maintained with the support from a number of funders, principally the UK Natural Environment Research Council (NERC) and the US Department of Energy. The CRU dataset is widely used by researchers of climate, hydrology, and environment sciences [29]. The CRU data used in this study have a spatial resolution of 0.5° × 0.5°. The annual value of all gridded points within the NH, NA, and EA was respectively calculated to obtain a regional variation of Climate. We spatially assessed trends in seasonal temperature and precipitation for each gridded point during the study period. In this way, the spatial trend characteristics of seasonal temperature and precipitation can be clearly expressed.

2.3. Methodology and Statistics

We used the ordinary least squares linear (OLS) regression to detect trends in seasonal SCE for the period of 1967–2018. The significance of OLS fitted-line’s slope was determined by the t test (two-tailed) at the p < 0.01 significance level. Subsequently, to explore the potential causes of variability in SCE within and among seasons, we investigated Pearson’s correlations of SCE with either temperature or precipitation. Spatial Pearson’s correlations between SCE, precipitation, and air temperature were carried out to detect the possible causes and principal factor of SCE variation in different seasons (also at a p < 0.1 significance level). Finally, time series correlation analyses were performed in winter, spring, summer, and autumn for NH, NA, and EA, (using p < 0.01 and p < 0.05 significance levels). We also used a non-parametric 10-year LOESS-smooth method [32] to detect decadal to multi-decadal trends for SCE and each climate variable.

3. Results and Discussions

3.1. Monthly Variability of Snow Cover Extent over the NH

Monthly SCE showed a distinct “U” pattern: the maximum SCE occurred in winter and then SCE decreased to a stable low value in summer, after then the SCE increased from summer to autumn (Figure 2). Across the NH, the maximum monthly SCE ranged from 47 million km2 in January to 45.8 million km2 in February. Seasonally, along with the temperature increase in spring (March–May), the NH’s SCE decreased from 40 million km2 (March) and 30 million km2 (April) to 18 million km2 in May, and 8.88 million km2 in June. The EA featured greater (30 million km2) seasonal variability in their SCE than did the NA, which suggests that the formers’ larger land area is a factor contributing to such variability. This result is consistent with Estilow et al. [33], who reported a mean annual SCE over NH of 25.1 million km2, with a standard deviation (SD) of 0.9 million km2. They also showed that the mean annual maximum SCE totaled to 47.4 million km2 (SD = 1.5), which is 44.4 million km2 more extensive than the mean annual minimum of 3.0 million km2 (SD = 0.7).

3.2. The Accelerated Loss of SCE in Spring and Summer over the NH Landmass

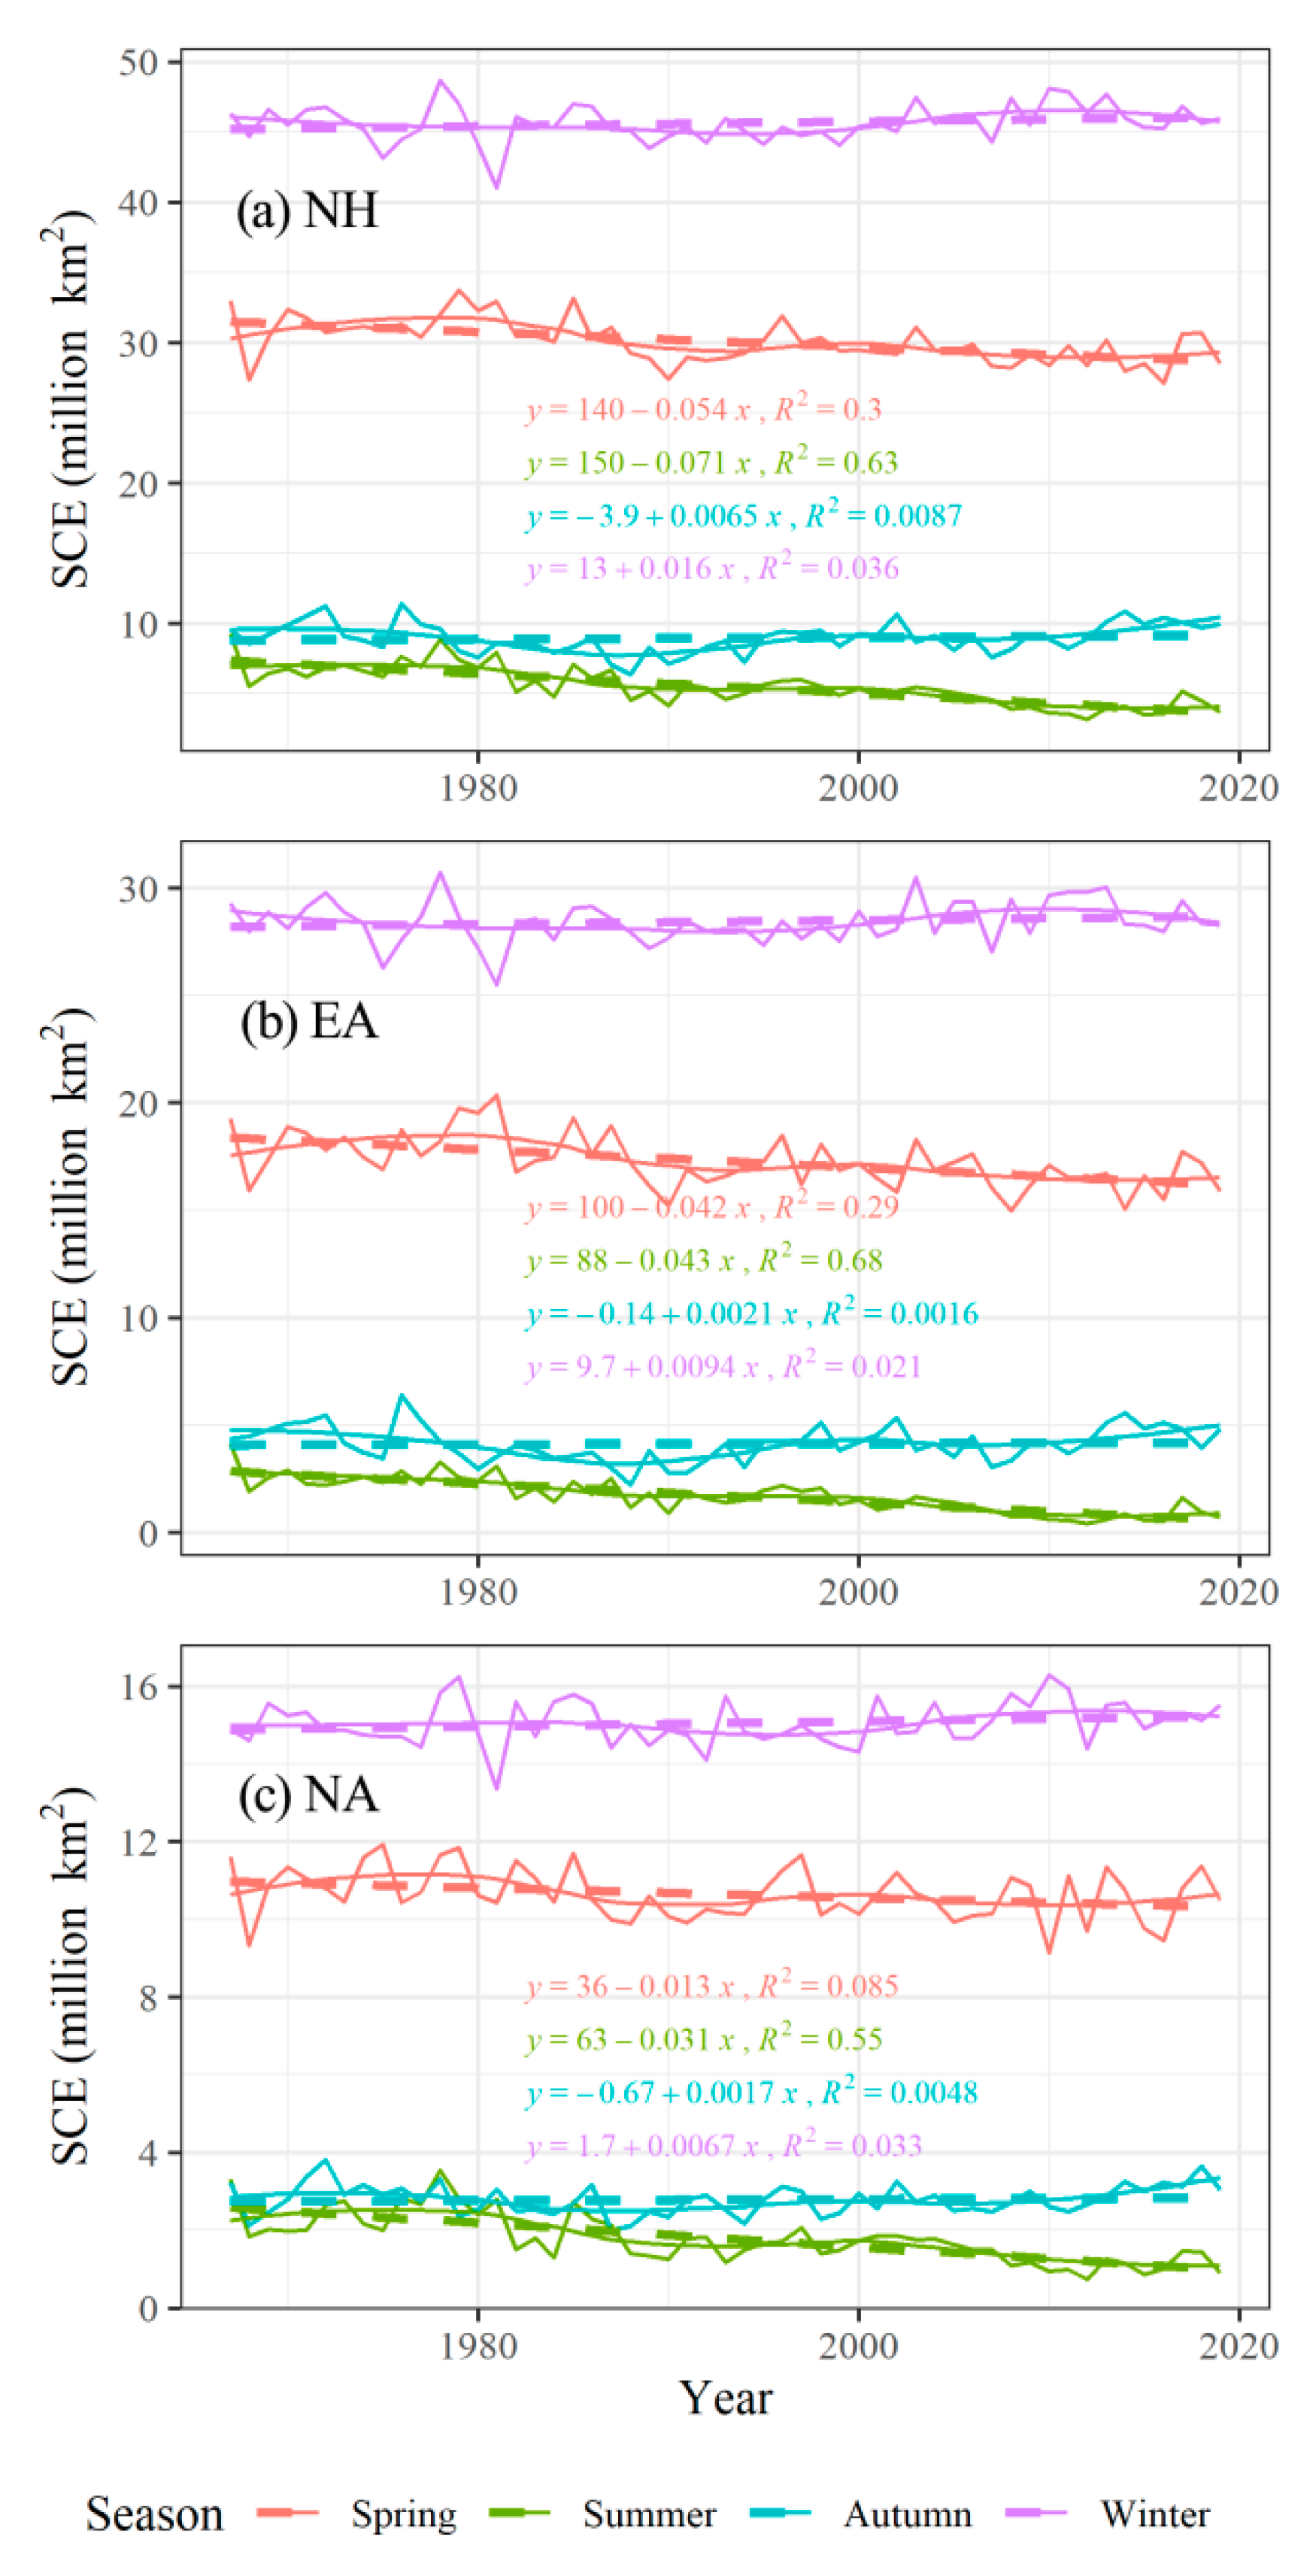
We detected striking inter-annual variability for SCE over NH, EA, and NA (Figure 3). Over NH, the SCE peaked in winter 1978 (48.7 million km2; Figure 3a). By contrast, mean SCE was lowest in 1981’s winter, at 41 million km2. In summer, the NH’s SCE reached its maximum and minimum, respectively, in 1967 (9.3 million km2) and 2012 (3.2 million km2). Long-term changes in SCE for the NH differ among seasons. The winter SCE of NH underwent decline from 1967 through 1995, followed by slight increase; no clear linear trend was found for winter SCE variation over NH during this study period. For autumn, 1988 was an inversion year, in that the SCE was significantly decreasing before that, after which it exhibited a slight trend of increasing. The SCE in spring and summer shows strong, decreasing trends. Evidently, for NH, in spring the SCE decreased by −0.54 million km2/decade (R2 = 0.3; p < 0.01) from 1967 to 2018, and in summer it decreased by −0.71 million km2/decade (R2 = 0.63, p < 0.01). According to previous research, changes in SCE over NH during March and April were −0.32 million km2/decade and −0.47 million km2/decade, respectively, for the 1922–2010 period [11]. Hori et al. reported that the changed SCE for spring and summer was −0.26 km2/decade and −0.15 km2/decade from 1978 to 2015, respectively [13]. These loss rates are lower than our results. A likely explanation is the different time spans consider among studies. Our results indicate that the decreasing rates of SCE have accelerated in the past 52 years, especially in spring and summer.
Over the EA landmass, the winter SCE was lowest in 1981 (25.5 million km2) and highest in 1978 (30.7 million km2). By contrast, the mean summer SCE in 1967 was the highest (4.2 million km2), and in 2012 was the lowest, at 0.44 million km2. Seasonal SCE over the EA shows different long-term trends (Figure 3b). The linear trends of SCE in both winter and autumn were not significant, but differing trends were evident in their sub-periods. Figure 3b shows that a slight decrease for the mean winter SCE of EA occurred after 2010. For autumn, 1988 was also an inversion year for SCE like that found over the NH. In both spring and summer, the SCE was greatly reduced, as expected, and the decreasing linear trend was significant (Figure 3b). The loss rates of SCE in spring and summer were the same (≈ −0.42 million km2/decade, R2 = 0.29 for spring and R2 = 0.68 for summer; p < 0.01) over the EA from 1967 to 2018. Many studies have reported significant increases in snow cover accumulation in winter over the EA’s large areas of [34,35]. We found no obvious trends for autumn and winter SCE increasing across the NH. As can be concluded, Eurasia continent SCE variation plays a leading role in SCE variation of northern hemisphere.
Over NA land, the winter’s lowest SCE was 13.4 million km2 in 1981, and its highest SCE was 16.3 million km2 in 2010 (Figure 3c). In summer, as for the NH, 1978 was the year with highest SCE, with a mean of 3.54 million km2. Subsequently, the SCE in 2012’s summer was the lowest, at 0.74 million km2. Analysis of variation trends of SCE over NA, its decline in spring was not as pronounced as that seen over the NH or EA, at a rate of −0.13 million km2/decade (R2 = 0.085; p = 0.034); however, with a rate of −0.31 million km2/decade (R2 = 0.55; p < 0.01) the rate of loss of summer SCE was significant and similar to that of NH and EA. In winter and autumn, similar fluctuations in SCE occurred for NA, as seen for NH and EA, with no significant trends found.

3.3. The Spatiotemporal Variation of Climate over NH

Inter-annual variability of seasonal temperature shows increasing trends during 1967–2018 over the NH, and likewise for EA and NA (Figure 4). The seasonal mean temperature across the NH increased at a significant rate, corresponding to 0.35 °C, 0.29 °C, 0.30 °C, and 0.39 °C per decade (p < 0.01) in spring, summer, autumn, and winter, respectively (Figure 4). The warming rate was faster in winter than in the other seasons for the NH. The mean air temperature over the NH in winter remained stable increase in recent years. For autumn, the inter-annual variation in temperature over the NH can be characterized by a stable increase with fluctuation during the 1967–1997 periods, followed by a rapid increase from 1998 to 2010, and then a slow decline ensued. In this respect, spring and summer were similar, so we focused on the rapid warming of 1988–2018.
For EA, the seasonal mean temperature rose significantly, at rates of 0.39 °C, 0.31 °C, 0.31 °C, and 0.37 °C per decade (p < 0.01), respectively, in spring, summer, autumn, and winter (Figure 4). Compared with the NH, the warming rate was faster in spring than in the other seasons for EA, whose rate of temperature in spring and summer accelerated rapidly during the 1988–2018 period. For autumn, the inter-annual variation of temperature over EA was similar to that over the NH, undergoing a rapid increase from 1998 through 2010, but then a slow decline. As found for NH for winter, 2007 was also the year when the temperature trend inverted over EA. Seasonal mean temperature’s rate of increase over NA was significant, at 0.24 °C, 0.24 °C, 0.27 °C, and 0.45 °C per decade (p < 0.01) in spring, summer, autumn, and winter, respectively. It should be noted that, among the seasons, the rate of warming over NA was fastest in winter, for which its rate of change exceeded that of the NH and EA. However, the temperature’s rate of increase in spring, summer, and autumn were lower in NA than either NH or EA.
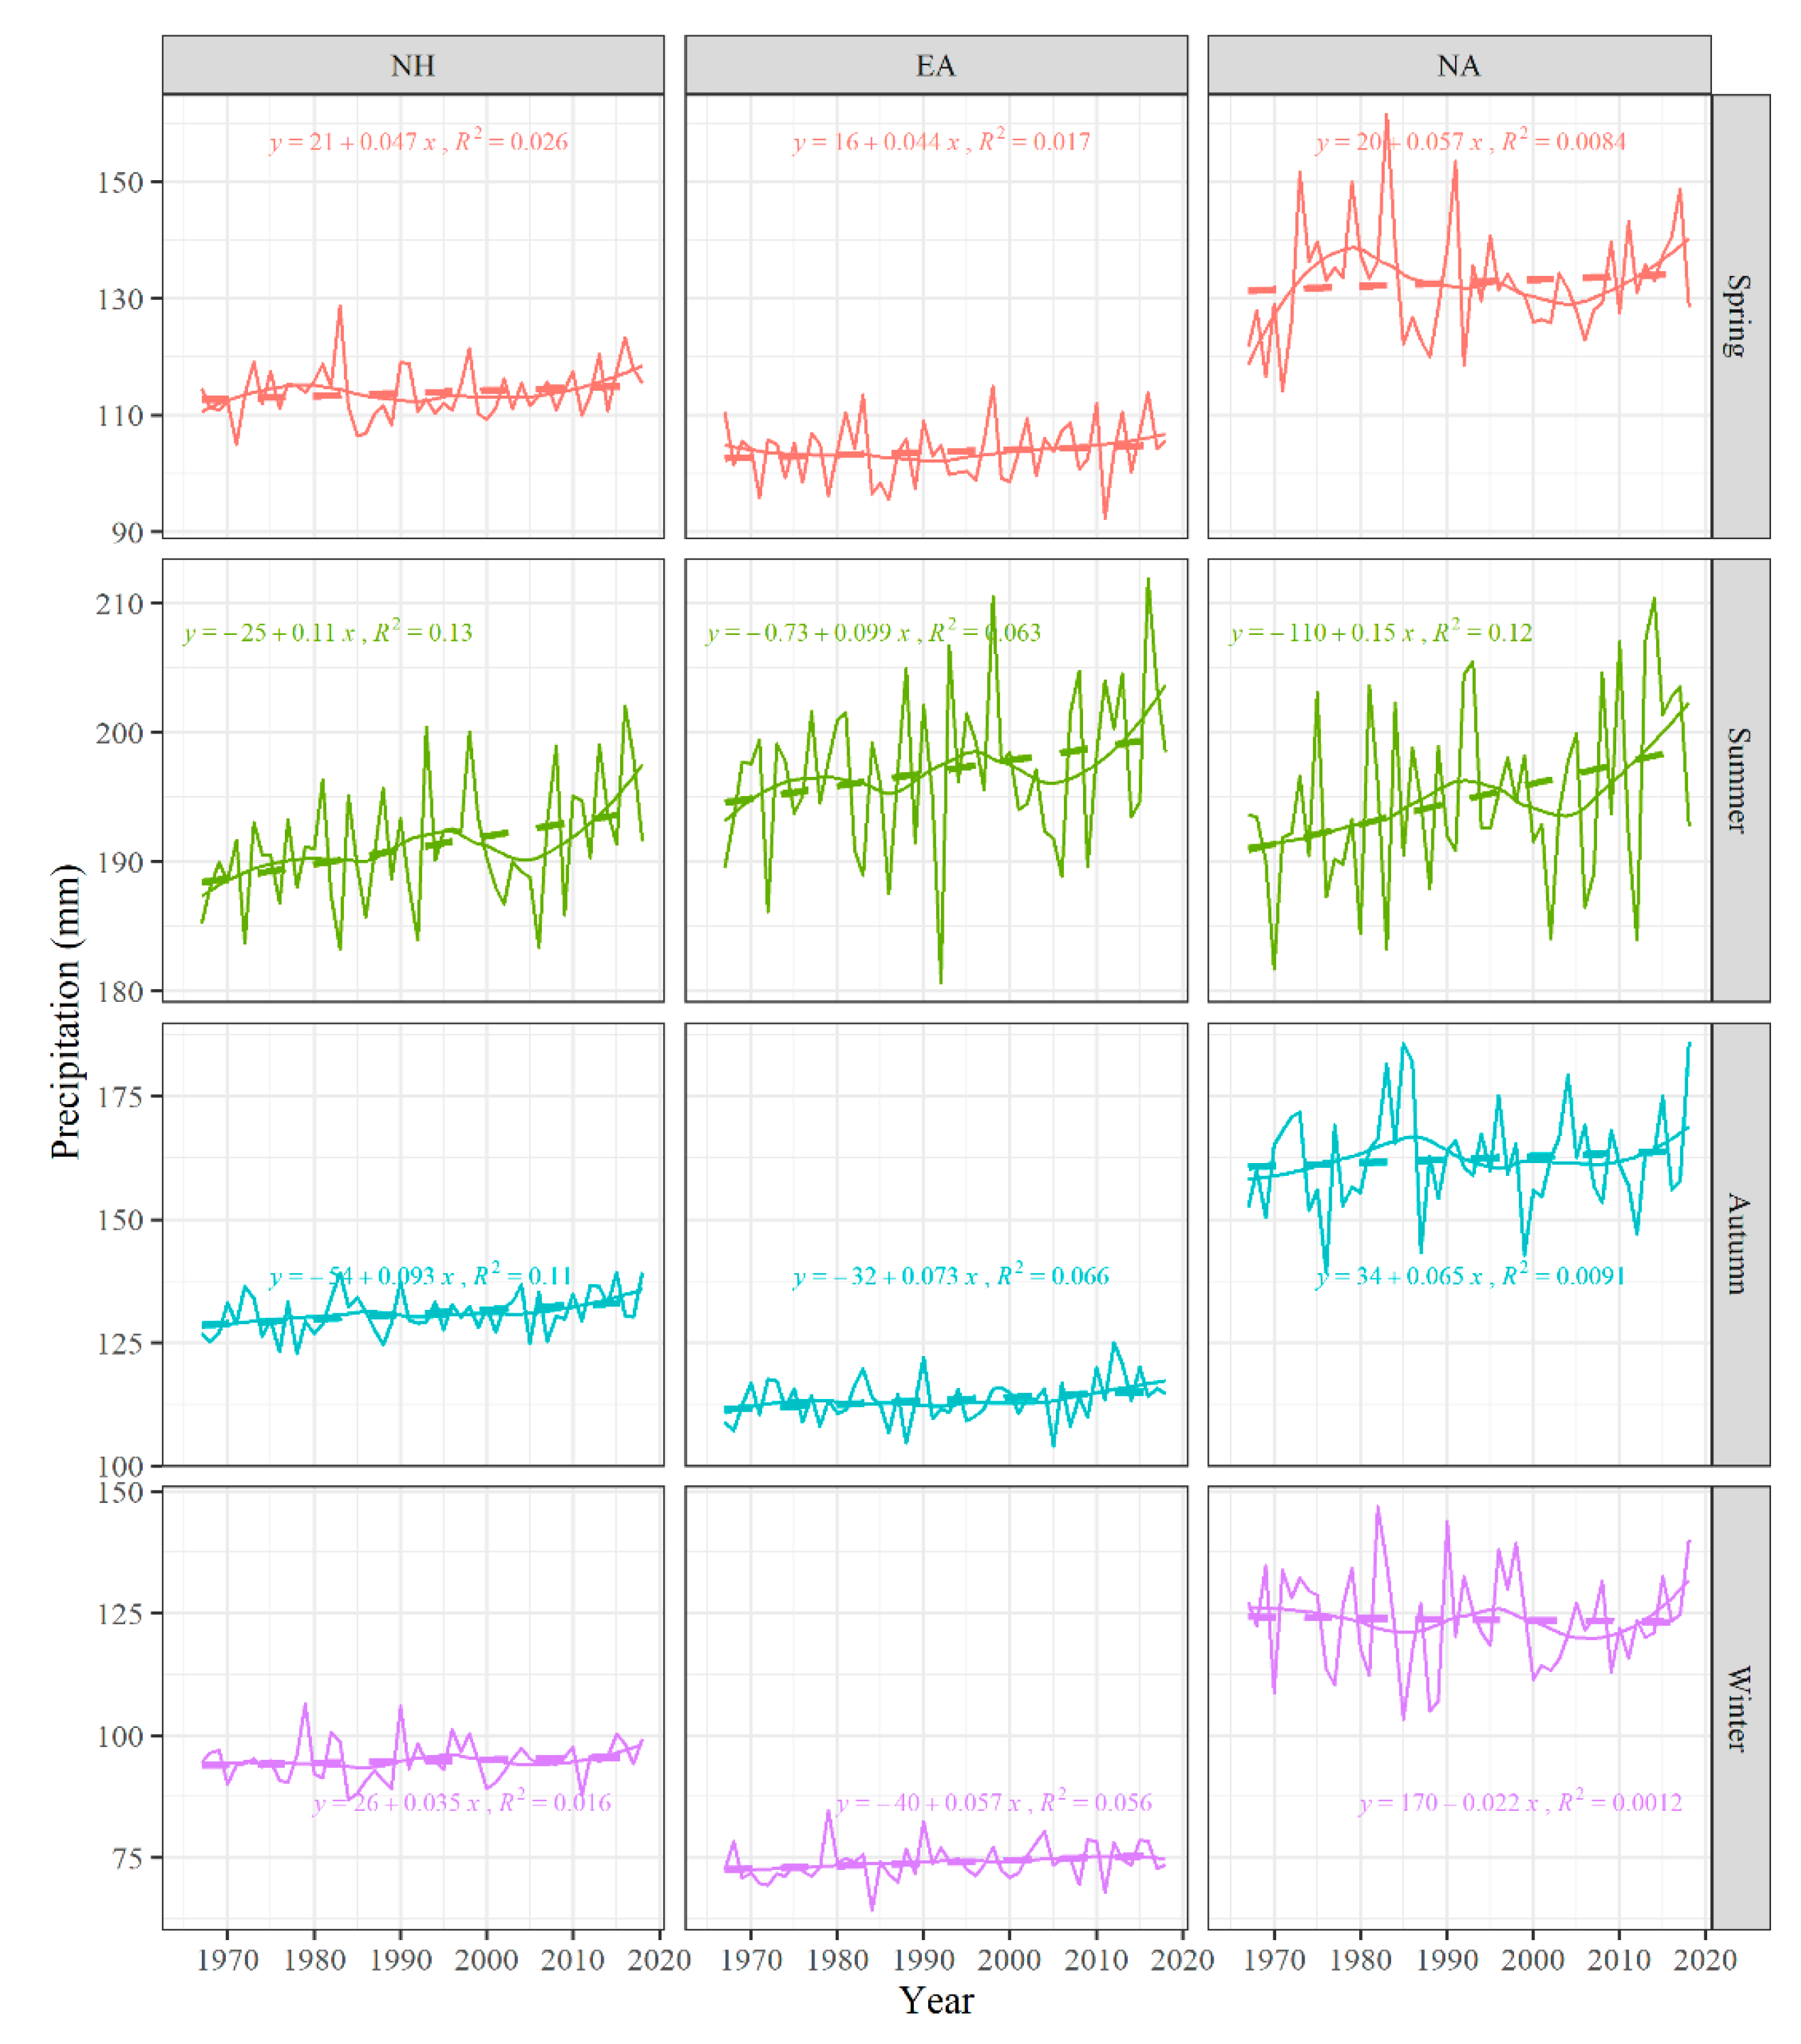
Seasonal precipitation shows slight increasing trends with fluctuations evident for NH, EA, and NA in 1967–2018 (Figure 5), but most of these were not significant. Specifically, across the NH, the rates of increase were 0.47, 1.1, 0.93, and 0.35 mm/decade for spring, summer, autumn, and winter, respectively, of which the summer one was significant only (p < 0.01). Additionally, the amplitude of the summer precipitation fluctuations (ca. 30 mm) was also larger than that in other seasons (about 20 mm) over the NH. Over EA, precipitation increased at rates of 0.44, 0.99, 0.73, and 0.35 mm/decade, respectively, in the spring, summer, autumn, and winter; but none of these increasing rates were statistically significant. Over NA, the variance in seasonal precipitation typically exceeded that found over the NH or EA (Figure 5). The non-significant increasing rates were 0.57, 1.5, 0.65, and 0.22 mm/decade for spring, summer, autumn, and winter, respectively. In spring, after rising in the 1970s, the NA precipitation fell during 1980–2005 and increased again after 2005. In summer, NA’s precipitation increased slowly during 1967–1990, but then declined until 2005, but it increased after 2005. To sum up, large differences were evident between NA’s precipitation and EA’s precipitation.
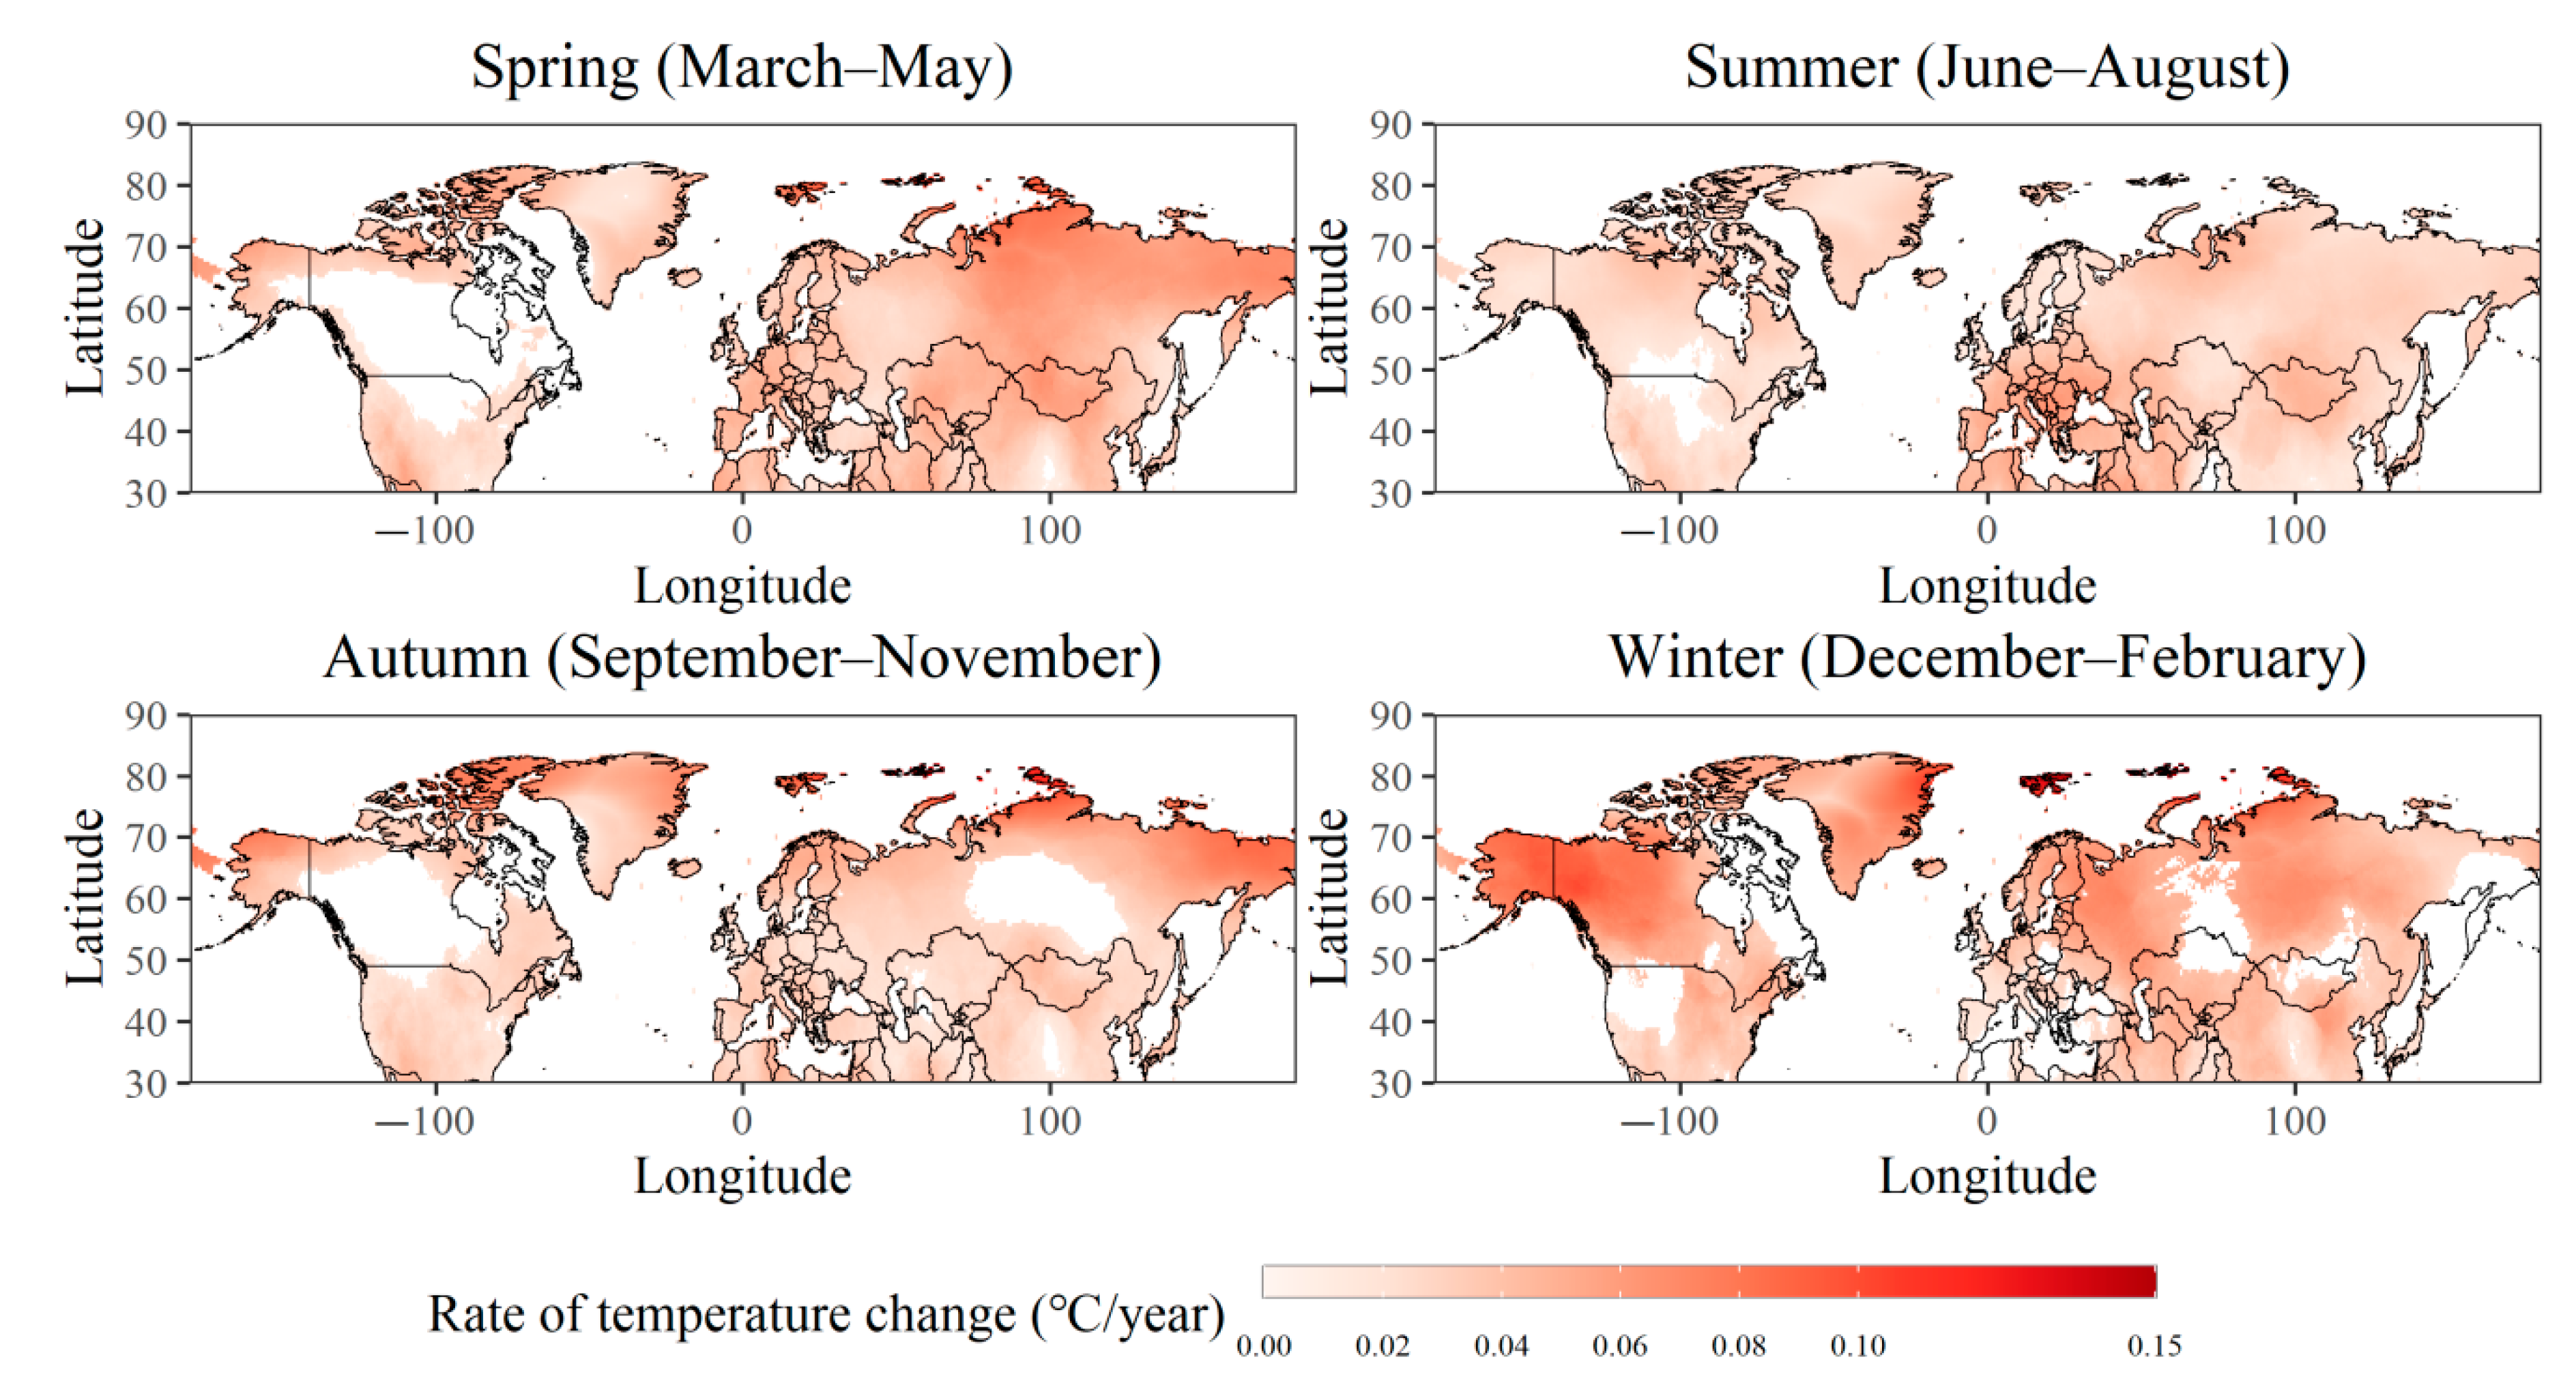
Spatially, temperature’s significant warming (p < 0.1) over the NH was characterized by heterogeneity in all seasons during the period of 1967–2018 (Figure 6). The warming rates were higher in high-latitude region for spring, summer, autumn, and winter. For the EA, in spring, the regional temperature gradually increased from low-latitude to high-latitude regions over the study period. Across EA, the magnitude of temperature warming ranged from 0 °C to 0.8 °C per decade. It worth noting that spring warming was not significant over much of NA, except its west mountain region, marked by significant magnitudes of warming (0.2–0.6 °C/decade). In summer, the area where temperature increased remarkably was distributed in EA, for which the magnitude of this trends increased with latitude (30° N–70° N) from 0.2 °C to 0.8 °C/decade. For NA, the warming was also not significant in its central region, whereas trends over west mountain region ranged from 0.2 °C to 0.6 °C per decade. For autumn, the warming rates ranged from 0.2 °C to 1.0 °C per decade in most areas of the NH during 1967–2018, yet a higher warming rate was detected in the high-latitude (60° N–80° N) with distinguished rises of 0.8–1 °C/decade. Unlike autumn, the regional trends in temperature were remarkably pronounced over northern EA and NA in winter. The rates of increased warming in winter spanned 0.6–1.0 °C/decade and then reached a maximum of 1.5 °C/decade in northwest NA (60° N–70° N, −160° W–120° W).
Seasonal precipitation exhibited larger heterogeneity in its spatial distribution than temperature (Figure S1). The NH’s precipitation featured spatially heterogeneity trends, from spring to winter. Seasonal precipitation insignificantly varied from −0.3 to 0.6 mm/decade over the NH from 1967 to 2018, however significant regions accounts for only 10%.

3.4. Relationships between SCE, Temperature, and Precipitation across the NH, NA, and EA

Seasonal mean temperature was significantly correlated with SCE over the NH, EA, and NA for certain seasons (Table 1). For the NH, as Table 1 shows, there were strong significant negative correlations between temperature and SCE in both spring and in summer. It is likely that warming contributed to the loss of SCE over NH from 1967 to 2018. The loss of snow cover over NH in turn can accelerate warming by reducing the earth surface albedo. This phenomenon is a positive feedback relationship between snow reduction and temperature warming coupling. SCE was also negatively correlated with precipitation in summer over NH, suggesting that the latter could be also an important factor accelerating the NH’s decline of SCE. However, SCE significantly increased with autumn precipitation over NH. It is reasonable that snow is a part of the autumn precipitation, and so SCE is expected to positively vary with it. There is a physical mechanism that could explain these relationships found over the NH. Air temperature affects the reflectance properties of the snow surface, including snow’s metamorphism, effective grain-size, and liquid water content in snow layer [36]. Rising temperature in the summer can lead to changes in the snow grain metamorphosis. Thus, high temperatures would diminish the albedo of the snow surface as a whole. Accordingly, in summer, higher temperatures would accelerate snow melting, elevating the water content of the snow surface, thus lowering the surface albedo. Precipitation primarily affects the annual snow cover accumulation in autumn and winter. Nevertheless, summer precipitation can influence the melting process of snow because it alters the snow layer’s water content and snow surface albedo [37]. Consequently, the snow surface absorbs more radiation and melting will accelerate. In addition, meltwater on snow surface harbors many dust particles during its transport, and microorganisms adhering to the snow surface proliferate as both temperature and precipitation rise.
For EA, there were strong, significant negative correlations between SCE and temperature in spring and summer (Table 1). Winter’s SCE was significantly negatively correlated with temperature, which indicated that the former decreased as the latter increased over EA, and vice-versa; yet, the correlation between SCE and precipitation in each season were not significant; hence, precipitation over EA may be not a stable factor influencing SCE change during the study period. For NA, no significant relationship was detected between SCE and spring temperature, but there were significant negative correlations between SCE and the temperature in summer and autumn. Precipitation in any season was not significantly related to SCE over NA. These results indicated that the variation in summer and autumn SCE over NA are mainly driven by temperature in that season. To sum up, there are differences in the seasonal air temperature sensitivities of SCE for the two continents (EA vs. NA).
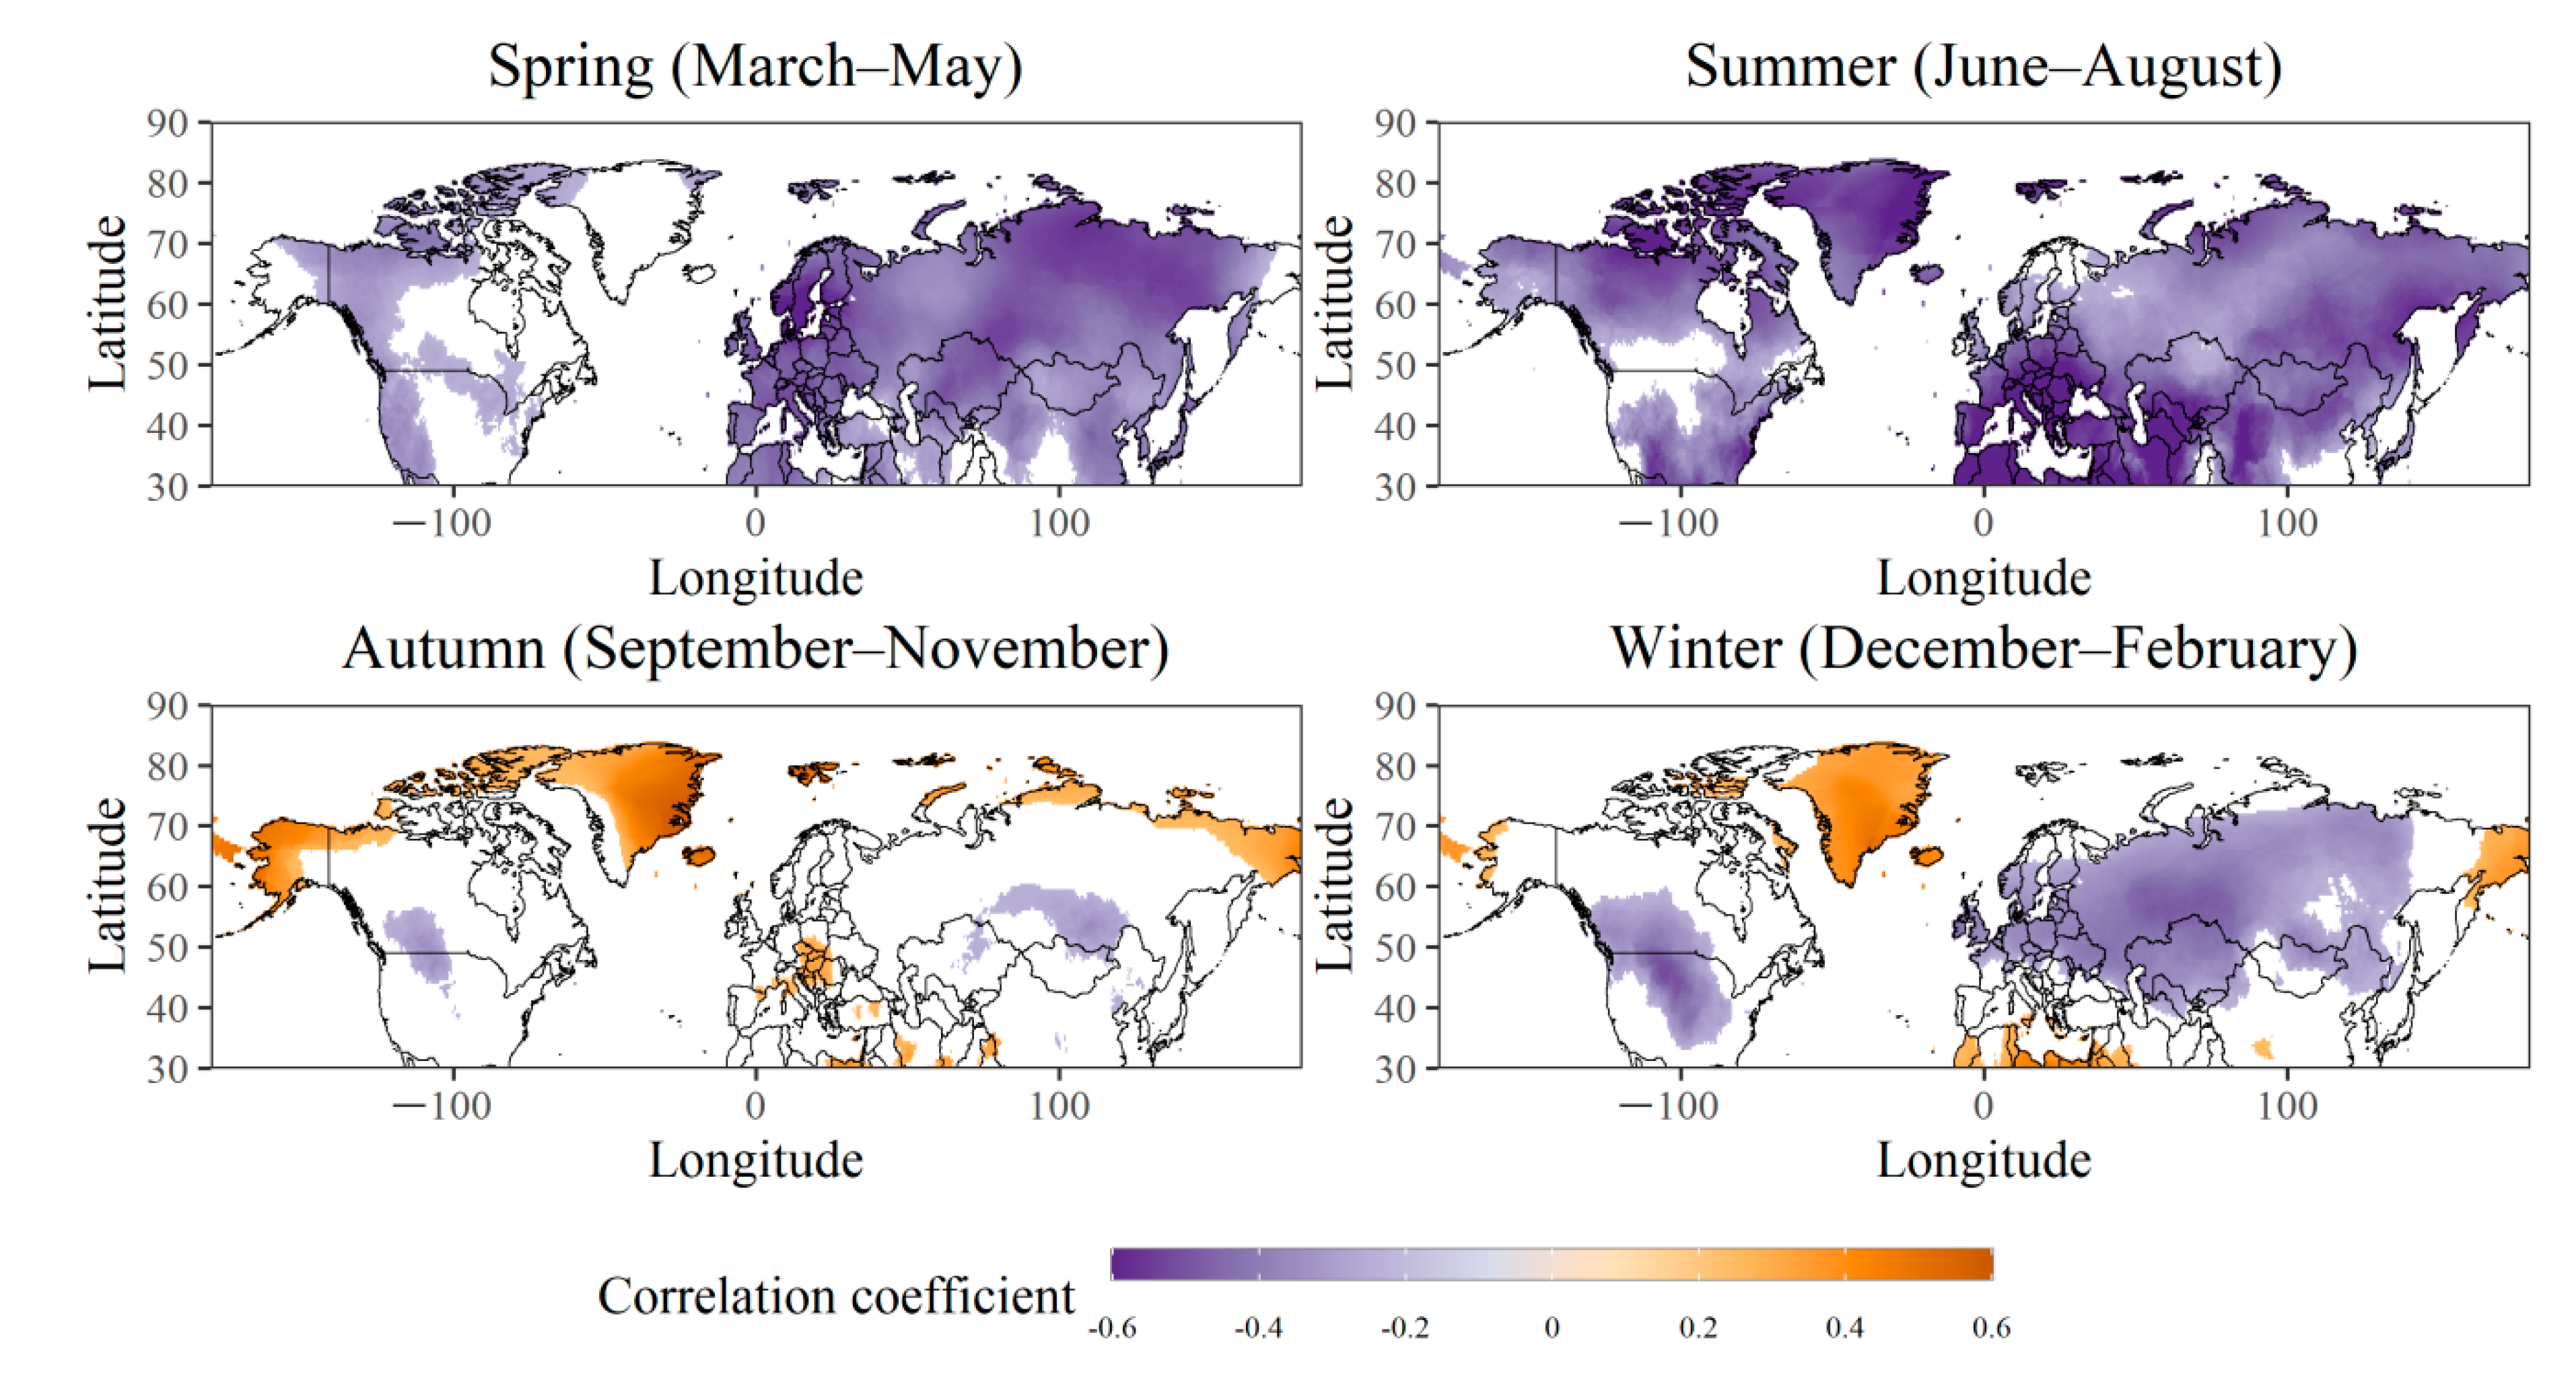
Seasonal temperature shows strong spatial correlations with the seasonal SCE (Figure 7). In spring, there were strong significant negative correlations (r-values = −0.2 to −0.6; p < 0.1) between SCE of NH and the temperature of northern EA and NA’s west mountain region (Figure 7). It is likely to suggest that air temperatures in northern EA and western NA mainly influenced the variation of NH’s SCE in spring. Similarly, in summer, SCE over the NH was significantly negative correlated with summer temperatures in most of the NH regions, but especially in the regions of EA and NA, with the exceptions of central NA. In autumn, only small areas in the center of each continent presented significant negative correlations, and some significant positive correlations between NH’s SCE and temperature were distributed at the north edge of the EA and NA. Yet, we did find significant negative correlations (r = −0.2 to −0.6, p < 0.1) between the SCE of the NH and winter’s temperatures in northwest EA and central NA.
It is likely that precipitation had a weaker influence than temperature upon SCE (Figure S2). No strong significant correlations occurred between SCE and precipitation in spring and summer, except for a few areas in high-latitude regions. However, significant positive correlations (r-values = 0.2 to 0.6; p < 0.1) between NH’s SCE and precipitation occurred in winter in the edge regions of EA and NA (50° N–70° N). They are distributed in and around the north China and America and Chersky Mountains of the EA continent in winter. However, there are also negative correlations in some regions (i.e., the Siberia and the Alps Mountains regions). These results suggested that the slight increase of SCE over the NH could have been affected by slightly increasing precipitation in these regions of NH during winter. In all likelihood there is no field significance for precipitation on SCE seasonally. In general, solid precipitation obviously increases SCE, whereas liquid precipitation decreases SCE through input of latent heat and snow metamorphism (decreasing surface albedo). If precipitation increased in the form of rain in autumn or early winter with climate warming, the negative correlations also can be understood.
In this study, temperature warming significantly affected SCE variation in spring and summer during the study period. Accelerated warming of northern EA in spring and the whole NH in summer (Figure 4) may cause the strong decline of spring SCE and summer SCE over the NH; accordingly, the SCE had strong relationships with spring and summer temperatures (Figure 7). Therefore, it is reasonable to speculate that, in spring and summer, the landmass would receive more energy, which can accelerate the melting of snow and therefore hasten the loss of SCE more than in previous years. Several studies have showed that both spring and summer warming may cause rapid declines in spring and summer SCE or snow water equivalent. McCabe and Wolock [19] reported a substantial decrease in March SCE over the NH after 1970s, in a time series that ran up to 2007; they also showed that this reduced SCE in March corresponded to greater mean temperature in winter of the NH. The latter would have lessened the proportion of precipitation that occurs as snow and driven an increase in snowmelt for the mid-latitudes of NH, thus reducing snow and March SCE. Brown et al. [38] demonstrated that the winter SCE of NA generally increased in the 20th century, providing further evidence for a trend of more precipitation occurring over NH’s mid-latitudes. However, there are some regions in high latitudes with positive correlations between SCE and temperature during autumn, which are located in near the Chase Mountains and the Alaska Mountains. In these regions, the snow water equivalent was reported to increase in the 1980–2017 period [4]. Accordingly, the reason may be explained by an increasement of snowfall [39], although temperature increases over the NH. Brown et al. also report that maximum snow accumulation increases in northern Siberia and the Canadian Arctic Archipelago under a warmer climate [40]. The above results highlight the spatial variability and complexity of the snow response to warmer conditions.
Our results further indicate that higher warming rates in spring and summer over the high-latitude NH regions (Figure 5) were responsible for accelerating the SCE decline in spring and summer (Figure 2), an interpretation supported by the strong relationships found between temperature and SCE in both spring and summer (Figure 7). Some studies have suggested that the Arctic region warming is amplified by ice–snow–albedo feedback loops [41]. The snow–albedo–temperature positive feedback can result in an SCE reduction due to warming at the hemispheric scale in spring and summer, because snow responds faster to climate change than do glaciers, ice sheets, and permafrost [42]. By contrast, widespread snow cover loss could accelerate warming over NH. For example, Yu et al. [43] pointed out that the snow cover changes can accelerate climate warming when compared to the radiative forcing caused by the vegetation cover changes over Siberia. Our results further illustrate that warming may strengthen this positive feedback, especially during spring and summer months. Another important reason for the sharp decrease in SCE that occurred during spring and summer over the NH in the last 52 years likely be the advance in snow melt and a shift in hydrologic regimes [44,45,46]. The former has been reported on by researchers; snowmelt has appeared ca. 4~10 days earlier per decade over most of regions of the NH [4,8,47]. When snowmelt begins earlier and snow cover is disappearing earlier in the spring, the land surface will receive more energy to heat the soil and to melt the snow cover. Another factor may be that a shallower snowpack in late spring and early summer responds more quickly to warming than a deep snowpack in winter. Winter air temperatures are generally lower-i.e., the snowpack is well below 0 °C and thus not sensitive to an increase in temperature in winter. Besides, in mid-latitude regions, increase in precipitation in autumn and winter can weaken the relationship between temperature and SCE in the same season. The weak relationship in autumn and winter also may be related to uneven regional temperature trends in the EA and NA continents in autumn and winter (Figure 5).
The two continents (EA and NA) differed in their seasonal response of SCE to climate, which may be associated with their different climate systems. In a study of Eurasian snow cover, Clark et al. [48] found that the North Atlantic Oscillation (NAO) signals are primarily restricted to central Europe in winter. Although the NAO produces large temperature anomalies over many regions of the EA continent, much of these regions experience mean temperatures that are so cold that temperature variability has little if any effect on snow cover during the winter. Nonetheless, NA’s climate is closely related to the Pacific–North American (PNA) pattern [49]. For the out-of-phase PNA and Asian–Bering–North American (ABNA) combination, the anomalous circulation center tends to be situated along the west coast of North America. This induces weak circulation anomalies over north–central North America and brings weak thermal advection and precipitation anomalies there. Snow cover responses to climate in the Siberian region are related to the corresponding atmospheric circulation anomalies, which are associated with sea surface temperatures and precipitation anomalies in the tropical eastern–central Pacific [49]. In the future warming background, there will be different possible trends of snow variability at how snow variation over NH [50]. Further work is undoubtedly needed in order to investigate and explain the apparent differences in snow distribution, variation trends, and response to climate change between the two continents.

4. Conclusions

This study investigated the variability of seasonal SCE and climate over the Northern Hemisphere (NH) and revealed that, over the past half-century, the loss of SCE has accelerated in spring and summer, but not in autumn or winter. These trends are closely associated with significant seasonal warming over the NH, Eurasia (EA), and North America (NA) during the 1967–2018 periods. Warming rates were higher in winter and spring than in summer and autumn, over both the NH and EA. The temporal trends in seasonal precipitation were spatially heterogeneous in mid-latitude areas of NH from 1967 to 2018 seasonally. Snow cover has responded quickly to climate change in recent decades. The SCE declined significantly with higher temperatures during spring and summer across the NH in the last 52 years. Furthermore, the SCE response to rising temperature differed between the continents: it was more sensitive in spring and summer over the EA, but more sensitive in summer over NA. Thus, this study provides a better understanding of seasonal snow cover climatology and changes across the NH landmass. Based on our findings, we suggest that more attention should be paid to snow cover over NH in the early summer, since its response to climate change is the strongest.

Supplementary Materials

The following are available online at https://www.mdpi.com/2073-4433/11/7/728/s1, Figure S1: Spatial distributions of seasonal precipitation trends over the NH from 1967 to 2018, based on CRU TS 4.0. Only the significant (p < 0.1) trends are shown, Figure S2: Map of the correlation coefficients between SCE and precipitation in four seasons over the NH during the period of 1967–2018. The color indicates the direction and strength of those trends significant at the p < 0.1 level.

Author Contributions

Conceptualization, X.W., Y.S., and W.Z.; data analysis, X.W.; writing—original draft preparation, X.W.; writing—review and editing, W.Z. and Y.L. All authors have read and agreed to the published version of the manuscript.

Funding

This research was supported by the National Natural Science Foundation of China (grant numbers 41701065, 41690144, 41721091), the Self-determination Project of the State Key Laboratory of Cryospheric Sciences (grant number SKLCS-ZZ-2020), the ‘Light of West China’ Program, CAS, the National Natural Science Foundation of China (grant number 41971083), the Key Special Subject of the National Key Research and Development Program of China (grant number 2019YFC1510502), and the CAS Pioneer Hundred Talents Program (to X.W.).

Acknowledgments

We thank Rutgers University Global Snow Lab and the American National Oceanic and Atmospheric Administration (NOAA) for kindly sharing the monthly SCE dataset. We are so grateful for the monthly temperature and precipitation data provided by the CRU (Climatic Research Unit) of the KNMI Climate Explorer, build in the Netherlands. We thank Guobao Xu for detailed suggestion and improvement of draft writing.

Conflicts of Interest

The authors declare no conflict of interest.

References

  1. Zhong, X.; Zhang, T.; Kang, S.; Wang, K.; Zheng, L.; Hu, Y.; Wang, H. Spatiotemporal variability of snow depth across the eurasian continent from 1966 to 2012. Cryosphere 2018, 12, 227–245. [Google Scholar] [CrossRef] [Green Version]
  2. Robinson, D.A.; Dewey, K.F.; Richard, R.; Heim, J. Global snow cover monitoring: An update. Bull. Am. Meteorol. Soc. 1993, 74, 1689–1696. [Google Scholar] [CrossRef] [Green Version]
  3. Acia. Arctic Climate Impact Assessment—Scientific Report. Available online: http://amap.no/acia/ (accessed on 1 May 2005).
  4. Wu, X.; Che, T.; Li, X.; Wang, N.; Yang, X. Slower snowmelt in spring along with climate warming across the northern hemisphere. Geophys. Res. Lett. 2018, 45, 12331–12339. [Google Scholar] [CrossRef]
  5. Tomaszewska, M.; Nguyen, L.; Henebry, G. Land surface phenology in the highland pastures of montane central asia: Interactions with snow cover seasonality and terrain characteristics. Remote Sens. Environ. 2020, 240, 1–25. [Google Scholar] [CrossRef]
  6. Zhang, R.; Zhang, R.; Zuo, Z. Impact of eurasian spring snow decrement on east asian summer precipitation. J. Clim. 2017, 30, 3421–3437. [Google Scholar] [CrossRef]
  7. Cohen, J.; Entekhabi, D. The influence of snow cover on northern hemisphere climate variability. Atmos.-Ocean. 2001, 39, 35–53. [Google Scholar] [CrossRef]
  8. Pulliainen, J.; Aurela, M.; Laurila, T.; Aalto, T.; Takala, M.; Salminen, M.; Kulmala, M.; Barr, A.; Heimann, M.; Lindroth, A.; et al. Early snowmelt significantly enhances boreal springtime carbon uptake. Proc. Natl. Acad. Sci. USA 2017, 114, 11081–11086. [Google Scholar] [CrossRef] [Green Version]
  9. Sturm, M.; Goldstein, M.A.; Parr, C. Water and life from snow: A trillion dollar science question. Water Resour. Res. 2017, 53, 3534–3544. [Google Scholar] [CrossRef]
  10. Groisman, P.Y.; Karl, T.R.; Knight, R.W.; Stenchikov, G.L. Changes of snow cover, temperature, and radiative heat balance over the northern hemisphere. J. Clim. 1994, 7, 1633–1656. [Google Scholar] [CrossRef] [Green Version]
  11. Brown, R.D.; Robinson, D.A. Northern hemisphere spring snow cover variability and change over 1922–2010 including an assessment of uncertainty. Cryosphere 2011, 5, 219–229. [Google Scholar] [CrossRef] [Green Version]
  12. Dery, S.J.; Brown, R.D. Recent northern hemisphere snow cover extent trends and implications for the snow-albedo feedback. Geophys. Res. Lett. 2007, 34, L22504. [Google Scholar] [CrossRef]
  13. Hori, M.; Sugiura, K.; Kobayashi, K.; Aoki, T.; Tanikawa, T.; Kuchiki, K.; Niwano, M.; Enomoto, H. A 38-year (1978-2015) northern hemisphere daily snow cover extent product derived using consistent objective criteria from satellite-borne optical sensors. Remote Sens. Environ. 2017, 191, 402–418. [Google Scholar] [CrossRef]
  14. Bormann, K.J.; Brown, R.D.; Derksen, C.; Painter, T.H. Estimating snow-cover trends from space. Nat. Clim. Chang. 2018, 11, 923–957. [Google Scholar] [CrossRef]
  15. Qin, D.; Liu, S.; Li, P. Snow cover distribution, variability, and response to climate change in western china. J. Clim. 2006, 19, 1820–1833. [Google Scholar]
  16. Li, X.; Cheng, G.; Jin, H.; Kang, E.; Che, T.; Jin, R.; Wu, L.; Nan, Z.; Wang, J.; Shen, Y. Cryospheric change in china. Glob. Planet Chang. 2008, 62, 210–218. [Google Scholar] [CrossRef]
  17. Shi, X.G.; Dery, S.J.; Groisman, P.Y.; Lettenmaier, D.P. Relationships between recent pan-arctic snow cover and hydroclimate trends. J. Clim. 2013, 26, 2048–2064. [Google Scholar] [CrossRef]
  18. Yeo, S.R.; Kim, W.; Kim, K.-Y. Eurasian snow cover variability in relation to warming trend and arctic oscillation. Clim. Dyn. 2017, 48, 499–511. [Google Scholar] [CrossRef]
  19. Mccabe, G.J.; Wolock, D.M. Long-term variability in northern hemisphere snow cover and associations with warmer winters. Clim. Chang. 2010, 99, 141–153. [Google Scholar] [CrossRef]
  20. Armstrong, R.; Brodzik, M. Northern Hemisphere Ease-Grid 2.0 Weekly Snow Cover and Sea Ice Extent, Version 4; NASA National Snow and Ice Data Center Distributed Active Archive Center: Boulder, CO, USA, 2013.
  21. Robinson, D.A.; Dewey, K.F. Recent secular variations in the extent of northern-hemisphere snow cover. Geophys. Res. Lett. 1990, 17, 1557–1560. [Google Scholar] [CrossRef] [Green Version]
  22. Robinson, D.A.; Estilow, T.W. Noaa Climate Data Record (CDR) of Northern Hemisphere (NH) Snow Cover Extent (SCE), Version 1; NOAA National Centers for Environmental Information: Boulder, CO, USA, 2012.
  23. Helfrich, S.R.; Mcnamara, D.; Ramsay, B.H.; Baldwin, T.; Kasheta, T. Enhancements to, and forthcoming developments in the interactive multisensor snow and ice mapping system (ims)&nbsp. Hydrol. Process. 2007, 21, 1576–1586. [Google Scholar]
  24. Ramsay, B.H. The interactive multisensor snow and ice mapping system. Hydrol. Process. 1998, 12, 1537–1546. [Google Scholar] [CrossRef]
  25. Washington, B.; Seymour, L.; Mote, T.; Robinson, D.; Estilow, T. Identifying and extracting a seasonal streamflow signal from remotely sensed snow cover in the columbia river basin. Remote Sens. Appl. Soc. Environ. 2019, 14, 207–223. [Google Scholar] [CrossRef]
  26. Ballinger, T.J.; Rohli, R.V.; Allen, M.J.; Robinson, D.A.; Estilow, T.W. Half-century perspectives on north american spring snowline and snow cover associations with the pacific-north american teleconnection pattern. Clim. Res. 2018, 74, 201–216. [Google Scholar] [CrossRef]
  27. Medler, M.J.; Montesano, P.; Robinson, D.A. Examining the relationship between snow cover and wildfire patterns in the western united states. Phys. Geogr. 2002, 23, 1–8. [Google Scholar] [CrossRef]
  28. Kim, Y.; Kimball, J.S.; Robinson, D.A.; Derksen, C. New satellite climate data records indicate strong coupling between recent frozen season changes and snow cover over high northern latitudes. Environ. Res. Lett. 2015, 10. [Google Scholar] [CrossRef] [Green Version]
  29. Lawrimore, J.; Karl, T.R.; Squires, M.; Robinson, D.A.; Kunkel, K.E. Trends and variability in severe snowstorms east of the rocky mountains. J. Hydrometeorol. 2014, 15, 1762–1777. [Google Scholar] [CrossRef] [Green Version]
  30. Mioduszewski, J.R.; Rennermalm, A.K.; Robinson, D.A.; Wang, L. Controls on spatial and temporal variability in northern hemisphere terrestrial snow melt timing, 1979–2012. J. Clim. 2015, 28, 2136–2153. [Google Scholar] [CrossRef] [Green Version]
  31. Harris, I.; Jones, P.D.; Osborn, T.J.; Lister, D.H. Updated high-resolution grids of monthly climatic observations—The cru ts3.10 dataset. Int. J. Climatol. 2014, 34, 623–642. [Google Scholar] [CrossRef] [Green Version]
  32. Devlin, C.S.J. Locally weighted regression: An approach to regression analysis by local fitting. J. Am. Stat. Assoc. 1988, 83, 596–610. [Google Scholar]
  33. Estilow, T.; Young, A.; Robinson, D. A long-term northern hemisphere snow cover extent data record for climate studies and monitoring. Earth Syst. Sci. Data Discuss. 2015, 7, 134–142. [Google Scholar] [CrossRef] [Green Version]
  34. Kitaev, L.M.; Kislov, A.; Krenke, A.; Razuvaev, V.; Martuganov, R.; Konstantinov, I. The snow cover characteristics of northern eurasia and their relationship to climatic parameters. Boreal Environ. Res. 2002, 7, 437–445. [Google Scholar]
  35. Kitaev, L.; Forland, E.; Razuvaev, V.; Tveito, O.E.; Krueger, O. Distribution of snow cover over northern eurasia. Nordic Hydrol. 2005, 36, 311–319. [Google Scholar] [CrossRef]
  36. Brock, B.W.; Willis, I.C.; Sharp, M.J. Measurement and parameterization of albedo variations at haut glacier d’arolla, switzerland. J. Glaciol. 2000, 46, 675–688. [Google Scholar] [CrossRef] [Green Version]
  37. Wu, X.; Wang, N.; Lu, A.; Pu, J.; Guo, Z.; Zhang, H. Variations in albedo on dongkemadi glacier in tanggula range on the tibetan plateau during 2002-2012 and its linkage with mass balance. Arct. Antarct. Alp. Res. 2015, 47, 281–292. [Google Scholar] [CrossRef] [Green Version]
  38. Brown, R.D. Northern hemisphere snow cover variability and change, 1915–1997. J. Clim. 2000, 13, 2339–2355. [Google Scholar] [CrossRef]
  39. Rasmussen, R.; Liu, C.; Ikeda, K.; Gochis, D.; Yates, D.; Chen, F.; Tewari, M.; Barlage, M.; Dudhia, J.; Yu, W.; et al. High-resolution coupled climate runoff simulations of seasonal snowfall over colorado: A process study of current and warmer climate. J. Clim. 2011, 24, 3015–3048. [Google Scholar] [CrossRef] [Green Version]
  40. Brown, R.; Schuler, D.V.; Bulygina, O.; Derksen, C.; Luojus, K.; Mudryk, L.; Wang, L.; Yang, D. Arctic Terrestrial Snow Cover; Snow, Water, Ice and Permafrost in the Arctic (SWIPA), Arctic Monitoring and Assessment Programme (AMAP): Oslo, Norway, 2017; pp. 25–64. [Google Scholar]
  41. Rangwala, I.; Sinsky, E.; Miller, J.R. Amplified warming projections for high altitude regions of the northern hemisphere mid-latitudes from cmip5 models. Environ. Res. Lett. 2013, 8. [Google Scholar] [CrossRef]
  42. Flanner, M.; Shell, K.; Barlage, M.; Perovich, D.; Tschudi, M. Radiative forcing and albedo feedback from the northern hemisphere cryosphere between 1979 and 2008. Nat. Geosci. 2011, 4, 151–155. [Google Scholar] [CrossRef]
  43. Yu, L.; Liu, T.; Zhang, S. Temporal and spatial changes in snow cover and the corresponding radiative forcing analysis in siberia from the 1970s to the 2010s. Adv. Meteorol. 2017, 2017, 1–11. [Google Scholar] [CrossRef] [Green Version]
  44. Abdul Aziz, O.I.; Burn, D.H. Trends and variability in the hydrological regime of the mackenzie river basin. J. Hydrol. 2006, 319, 282–294. [Google Scholar] [CrossRef]
  45. Tan, A.; Adam, J.C.; Lettenmaier, D.P. Change in spring snowmelt timing in eurasian arctic rivers. J. Geophys. Res. Atmos. 2011, 116, D03101. [Google Scholar] [CrossRef] [Green Version]
  46. Stewart, I.T.; Cayan, D.R.; Dettinger, M.D. Changes toward earlier streamflow timing across western north america. J. Clim. 2005, 18, 1136–1155. [Google Scholar] [CrossRef]
  47. Zhang, W.; Kang, S.; Shen, Y.; He, J.; Chen, A. Response of snow hydrological processes to a changing climate during 1961 to 2016 in the headwater of irtysh river basin, chinese altai mountains. J. Mt. Sci.-Engl. 2017, 14, 2295–2310. [Google Scholar] [CrossRef]
  48. Clark, M.P.; Serreze, M.C.; Robinson, D.A. Atmospheric controls on eurasian snow extent. Int. J. Climatol. 1999, 19, 27–40. [Google Scholar] [CrossRef] [Green Version]
  49. Yu, B.; Lin, H. Modification of the wintertime pacific–north american pattern related north american climate anomalies by the asian–bering–north american teleconnection. Clim. Dyn. 2019, 53, 313–328. [Google Scholar] [CrossRef] [Green Version]
  50. Räisänen, J. Warmer climate: Less or more snow? Clim. Dyn. 2008, 30, 307–319. [Google Scholar] [CrossRef]
Figure 1. Overview of the study area. NH includes Eurasia (EA) continent, North America (NA) continent, and Greenland.
Atmosphere 11 00728 g001
Figure 2. Boxplots of monthly variability in SCE (1967–2018) of NH, EA, and NA. The horizontal line in the box is medium value. The upper and lower boundary of box is the first quartile and the third quartile, respectively. Dots are outliers (more or less than twice standard deviations).
Atmosphere 11 00728 g002
Figure 3. Variability in seasonal SCE of NH (a), EA (b), and NA (c) during the 1967–2018 period, with 10-year LOESS-smoothed values. Equations in the figure are for fitted linear regressions (dashed lines).
Atmosphere 11 00728 g003
Figure 4. Variability in seasonal temperature across the NH, EA, and NA during the 1967–2018 period, with 10-year LOESS-smoothed values. Equations in the figure are for fitted linear regressions (dashed lines).
Atmosphere 11 00728 g004
Figure 5. Variability in seasonal precipitation of NH, EA, and NA during the 1967–2018 period, with 10-year LOESS-smoothed values. Equations in the figure are for fitted linear regressions (dashed lines).
Atmosphere 11 00728 g005
Figure 6. Spatial distributions of seasonal temperature trends over the NH, from 1967 to 2018, based on CRU TS 4.0. Only the significant (p < 0.1) trends are shown.
Atmosphere 11 00728 g006
Figure 7. Map of the correlation coefficients between seasonal SCE and seasonal temperature over the NH during the period of 1967–2018. Only the significant (p < 0.1) correlations are shown.
Atmosphere 11 00728 g007
Table 1. Pearson’s correlation coefficients between SCE and temperature (tem), precipitation (pre) in different seasons over the NH, EA, and NA during the period of 1967–2018. ‘*’ denotes significance at the 0.05 level and ‘**’ denotes significance at the 0.01 level.
SeasonNHEANA
tempretempretempre
Spring−0.654 **−0.104−0.688 **−0.083−0.1780.071
Summer−0.729 **−0.365 **−0.744 **−0.215−0.343 *−0.127
Autumn0.0520.318 *−0.1110.217−0.424 **−0.03
Winter−0.2120.077−0.277 *−0.0890.0810.003