Characterization and Source Identification of Elements and Water-Soluble Ions in Submicrometre Aerosols in Brno and Šlapanice (Czech Republic)

 ,
, 
Abstract
:
1. Introduction
2. Experiments
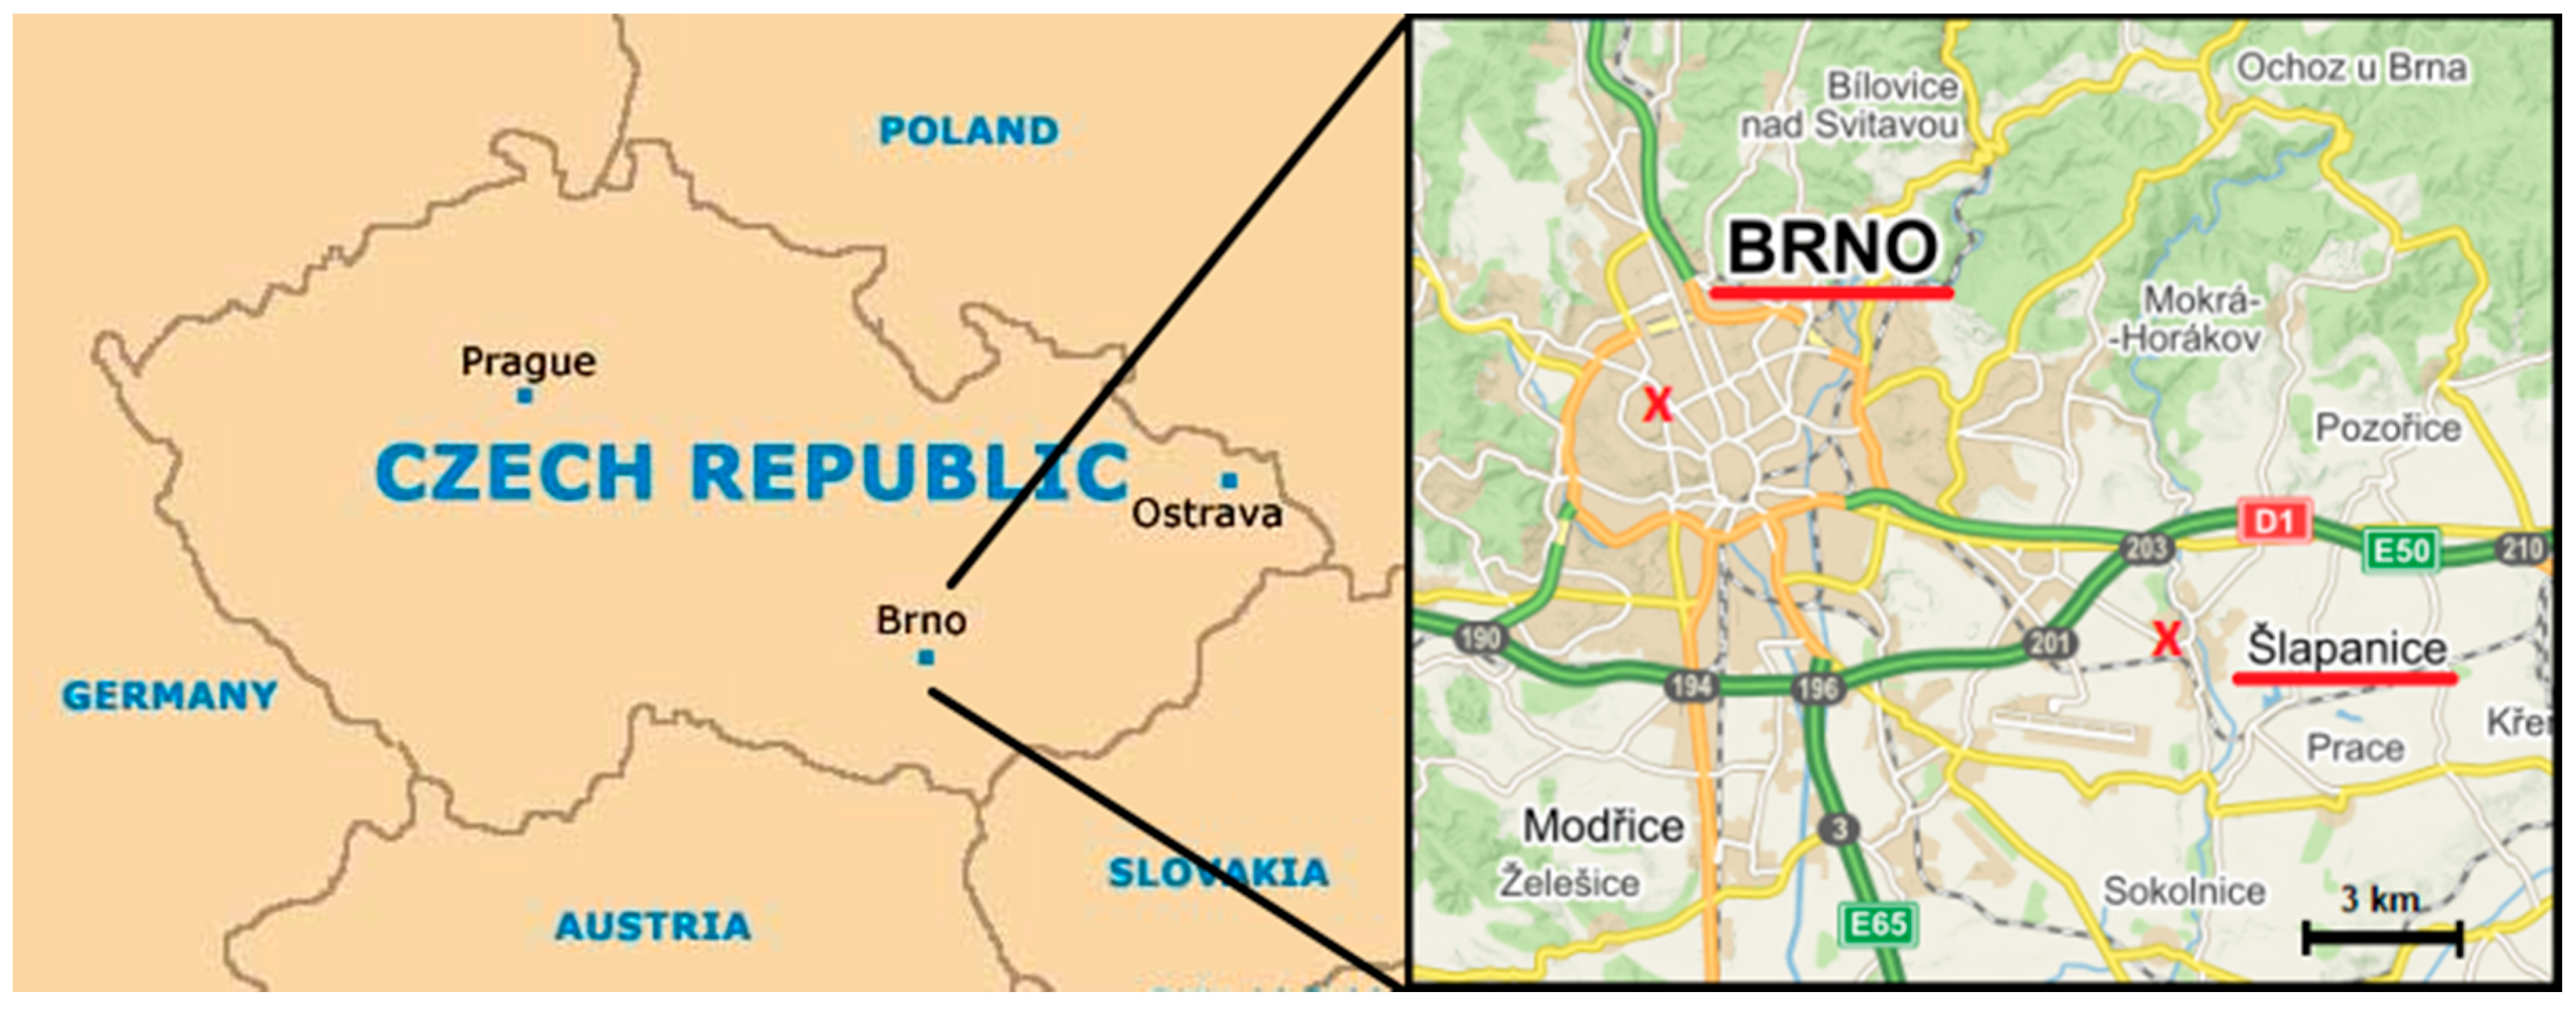
2.1. Sampling Sites
2.2. Aerosol Sampling
2.3. Processing and Filter Analysis
2.4. Calculation of Air Trajectories
2.5. Factor Analysis Model
3. Results
3.1. Characterization of Submicrometre Aerosols
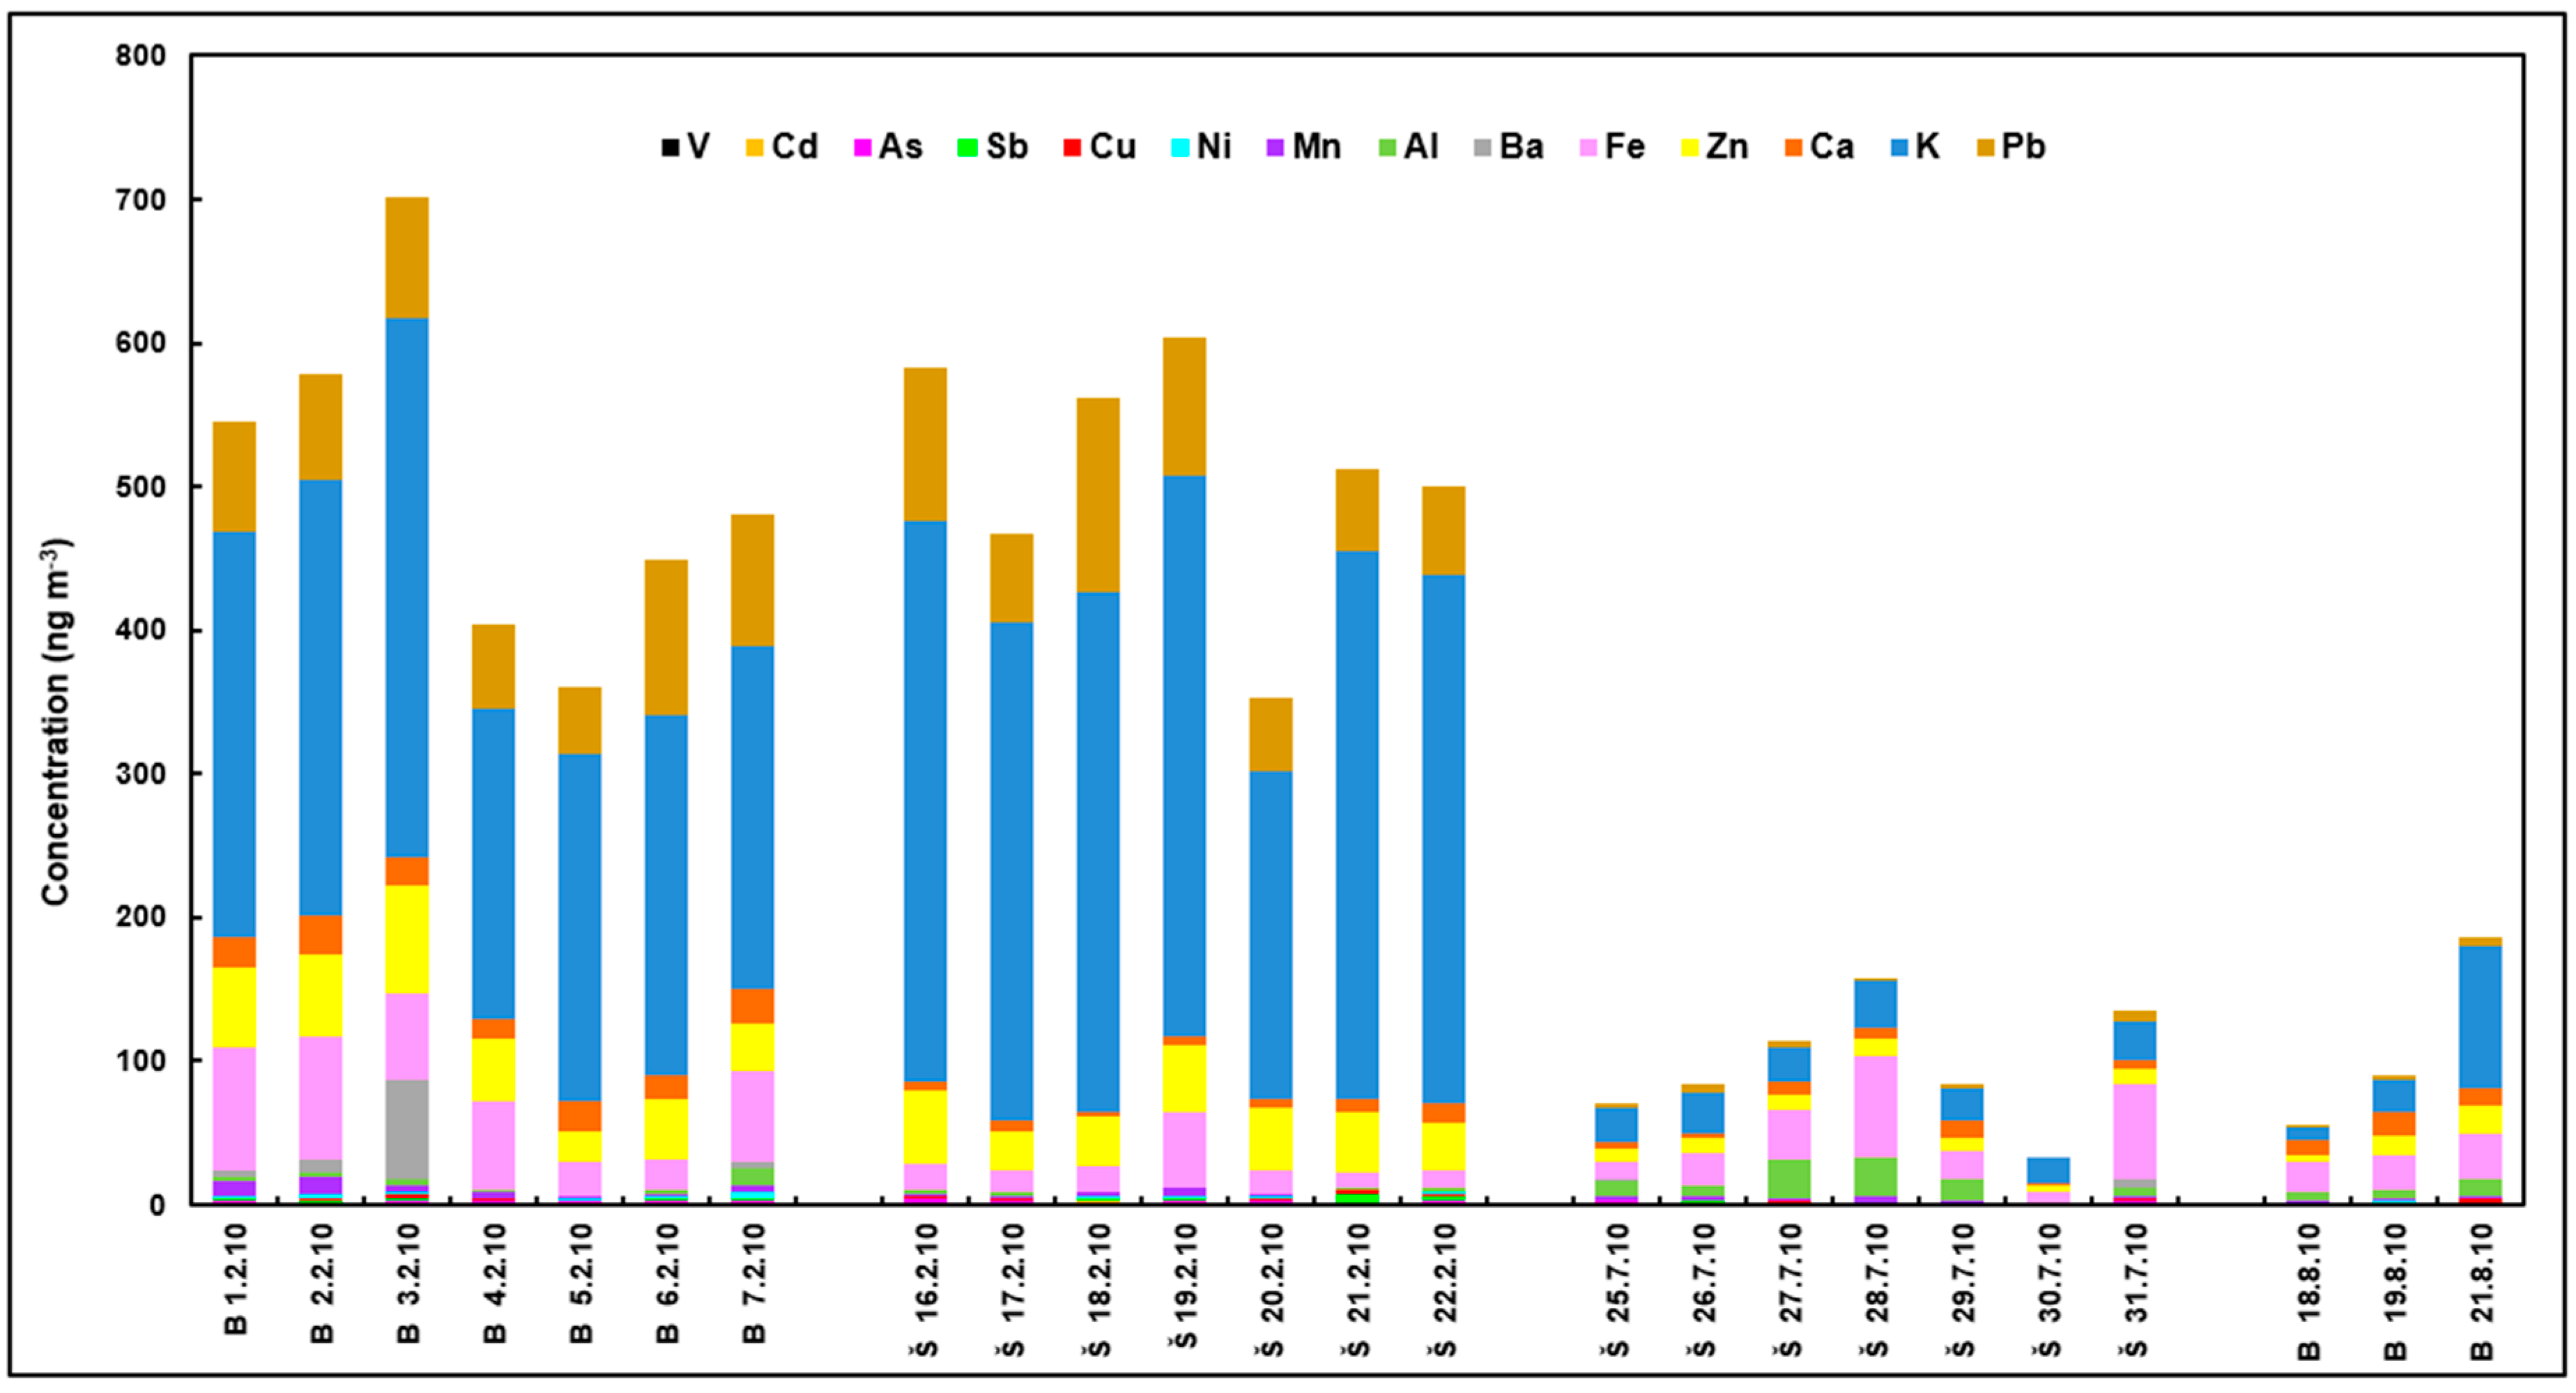
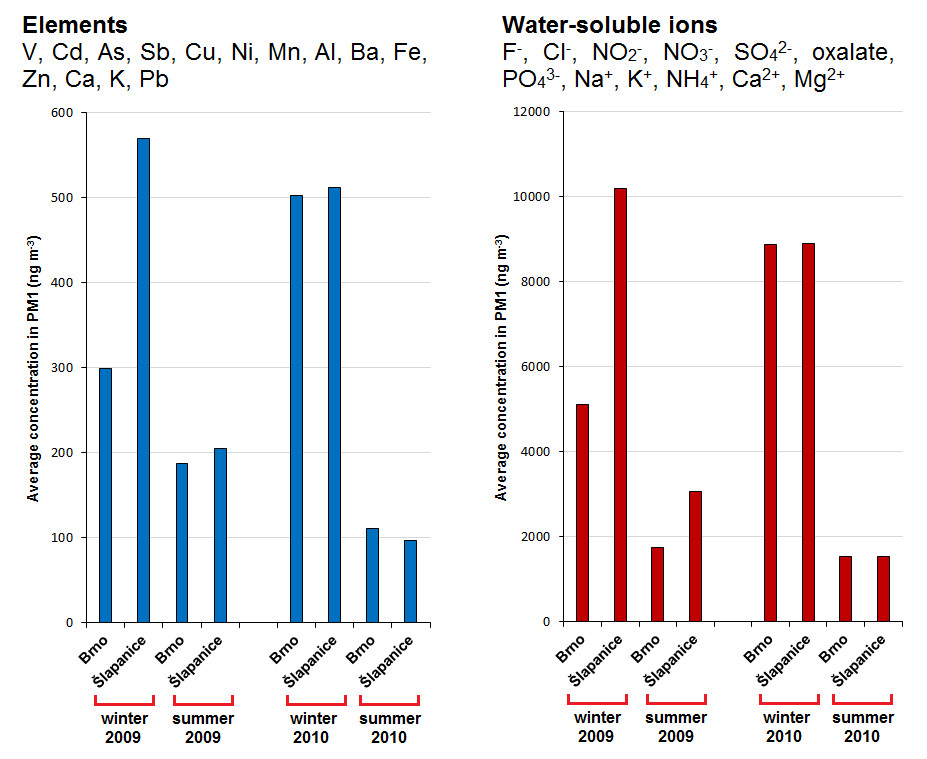
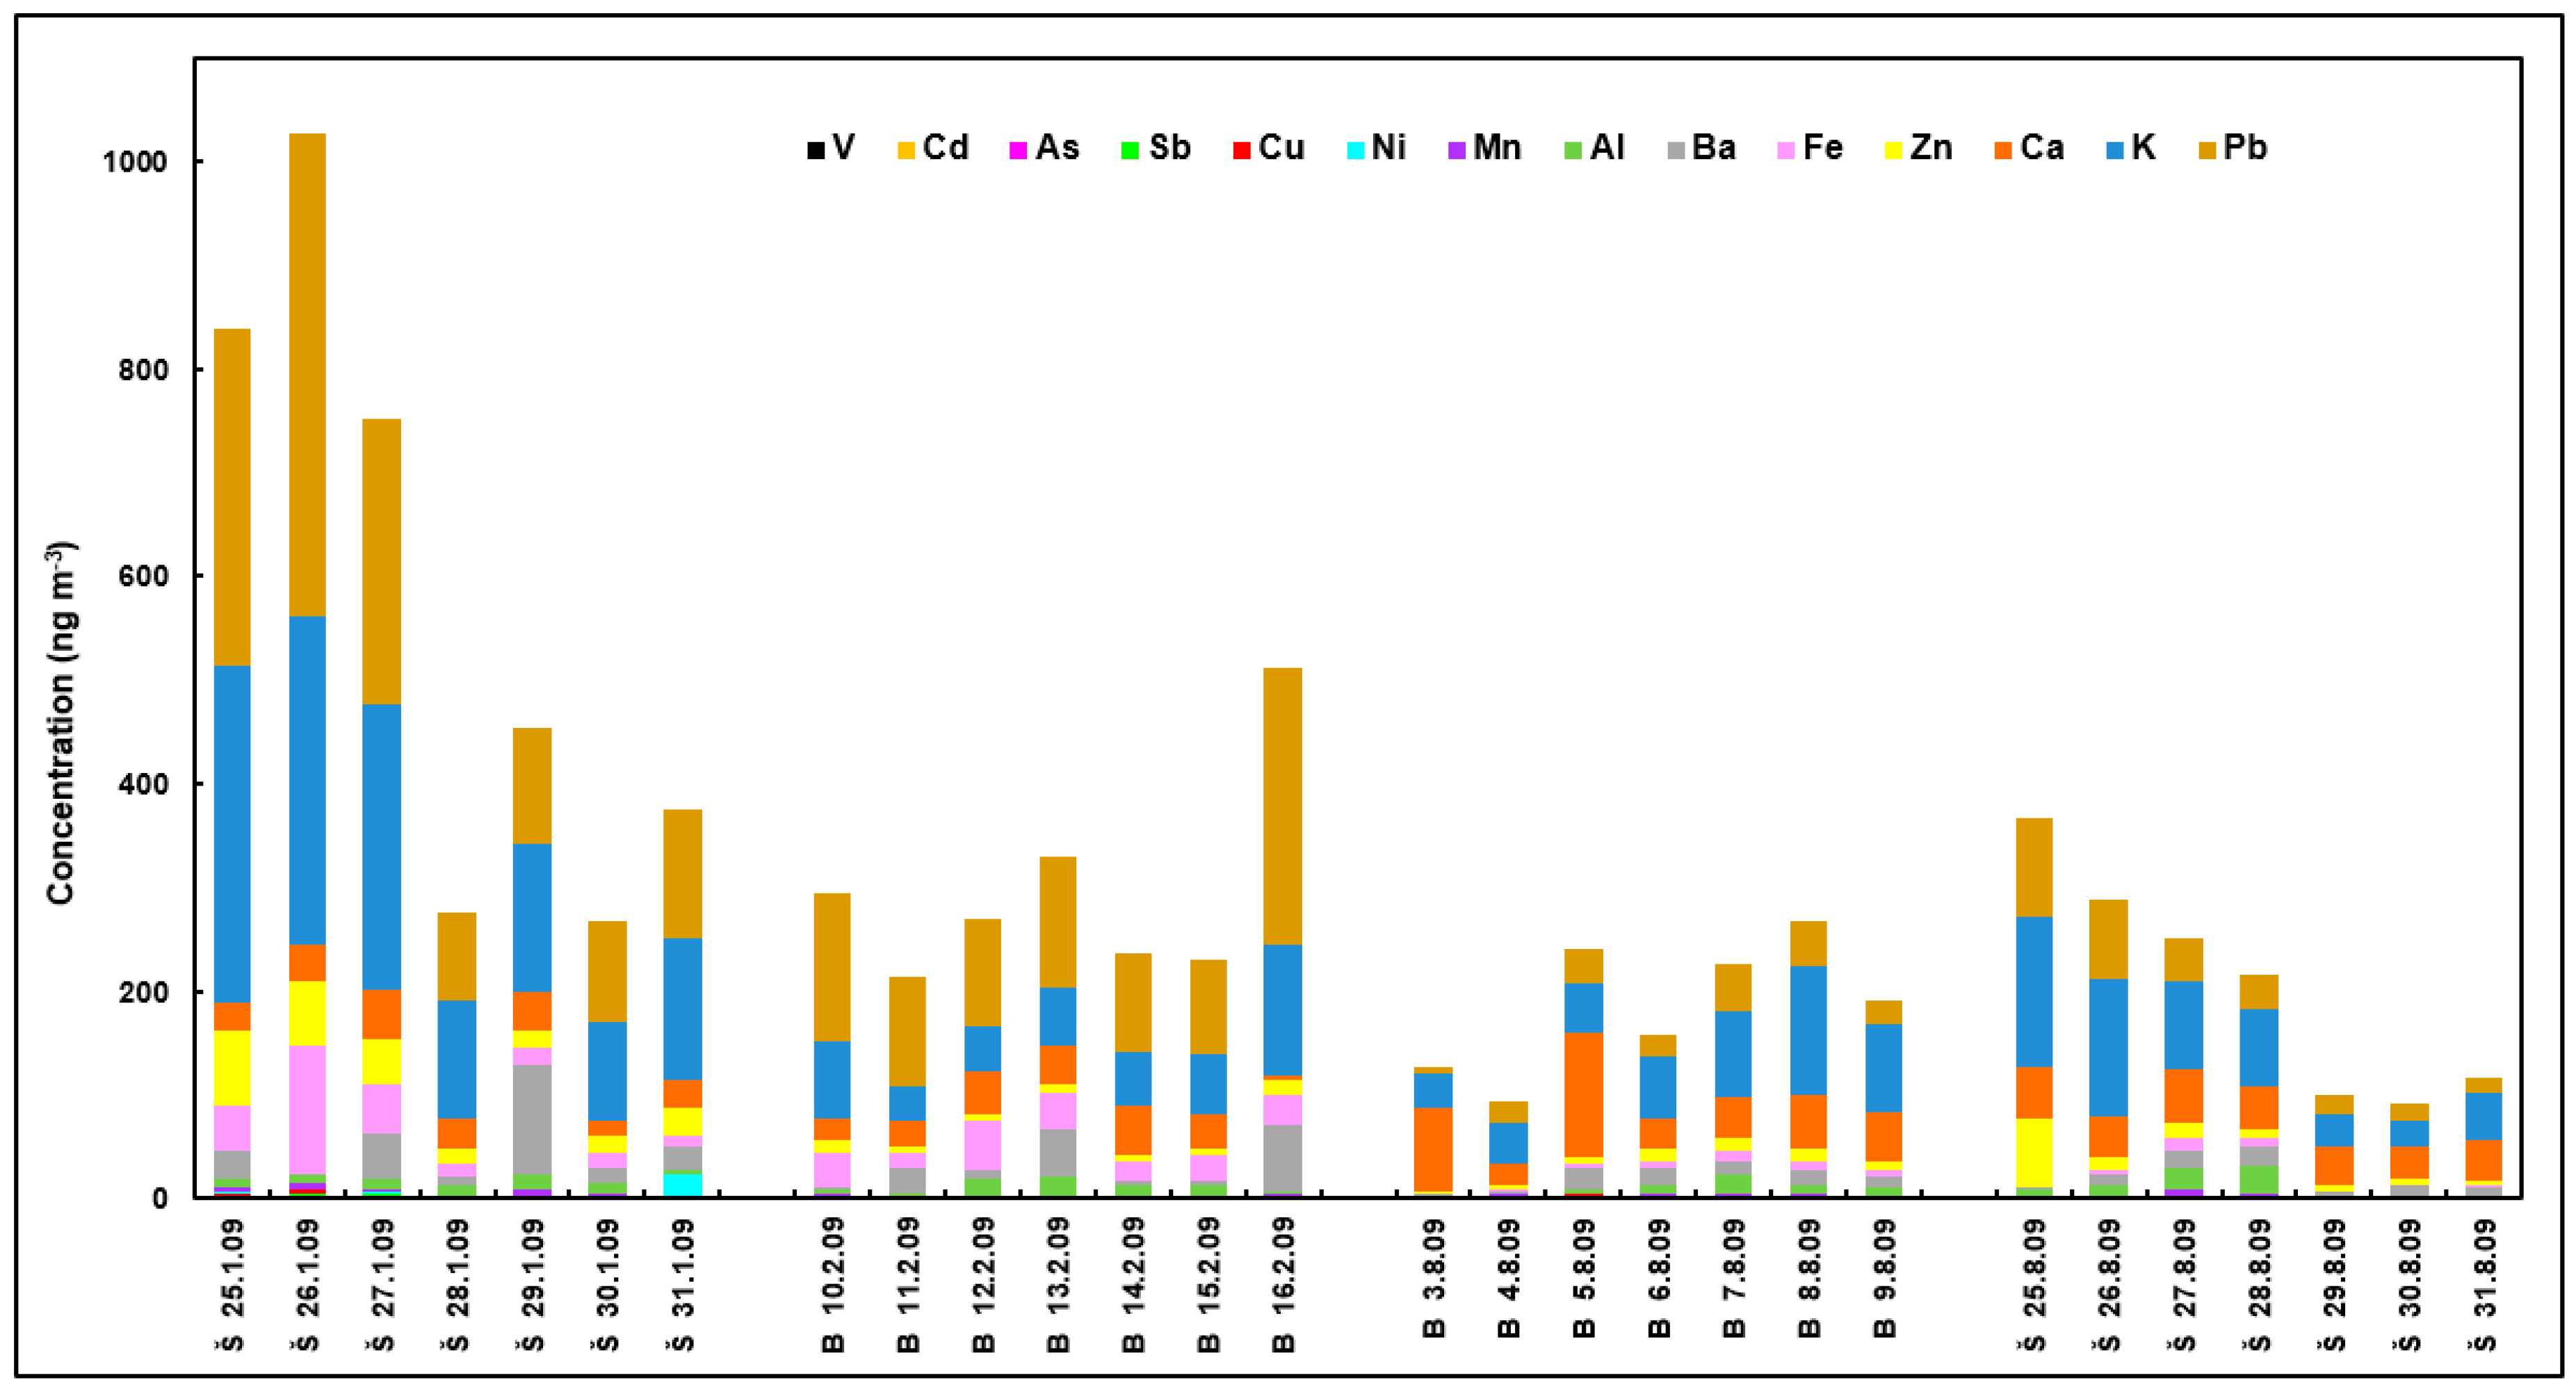
3.2. Characterization of Elements
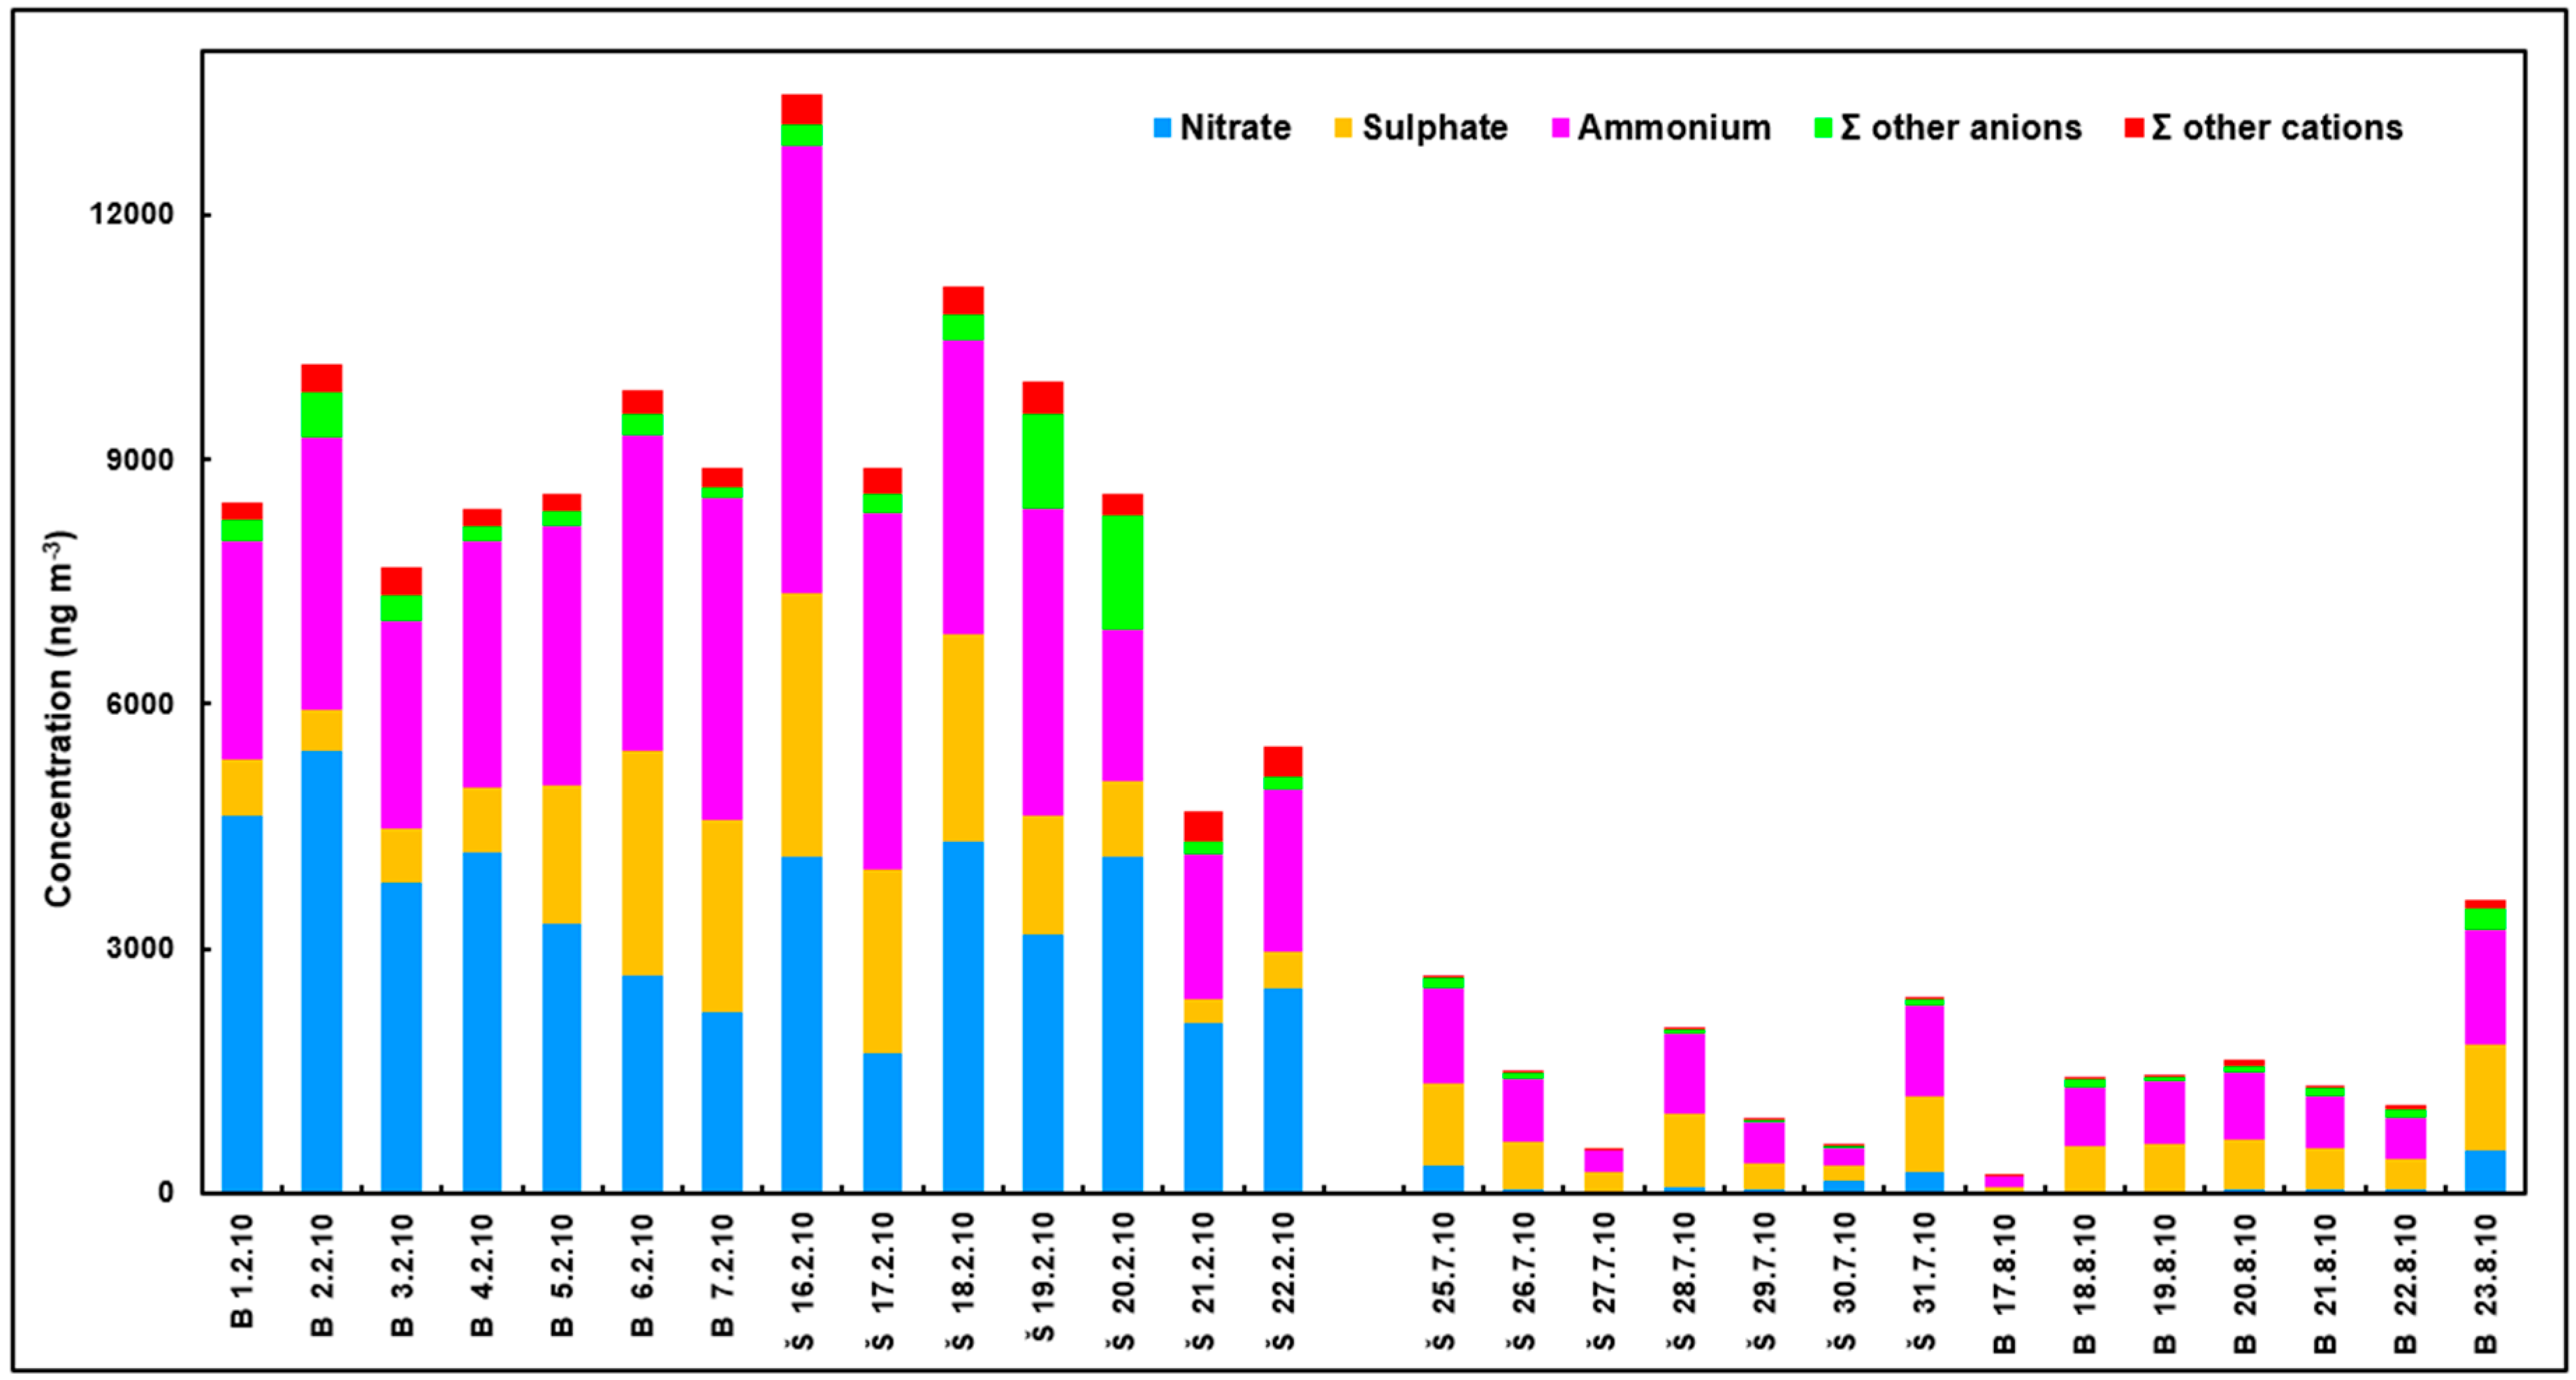
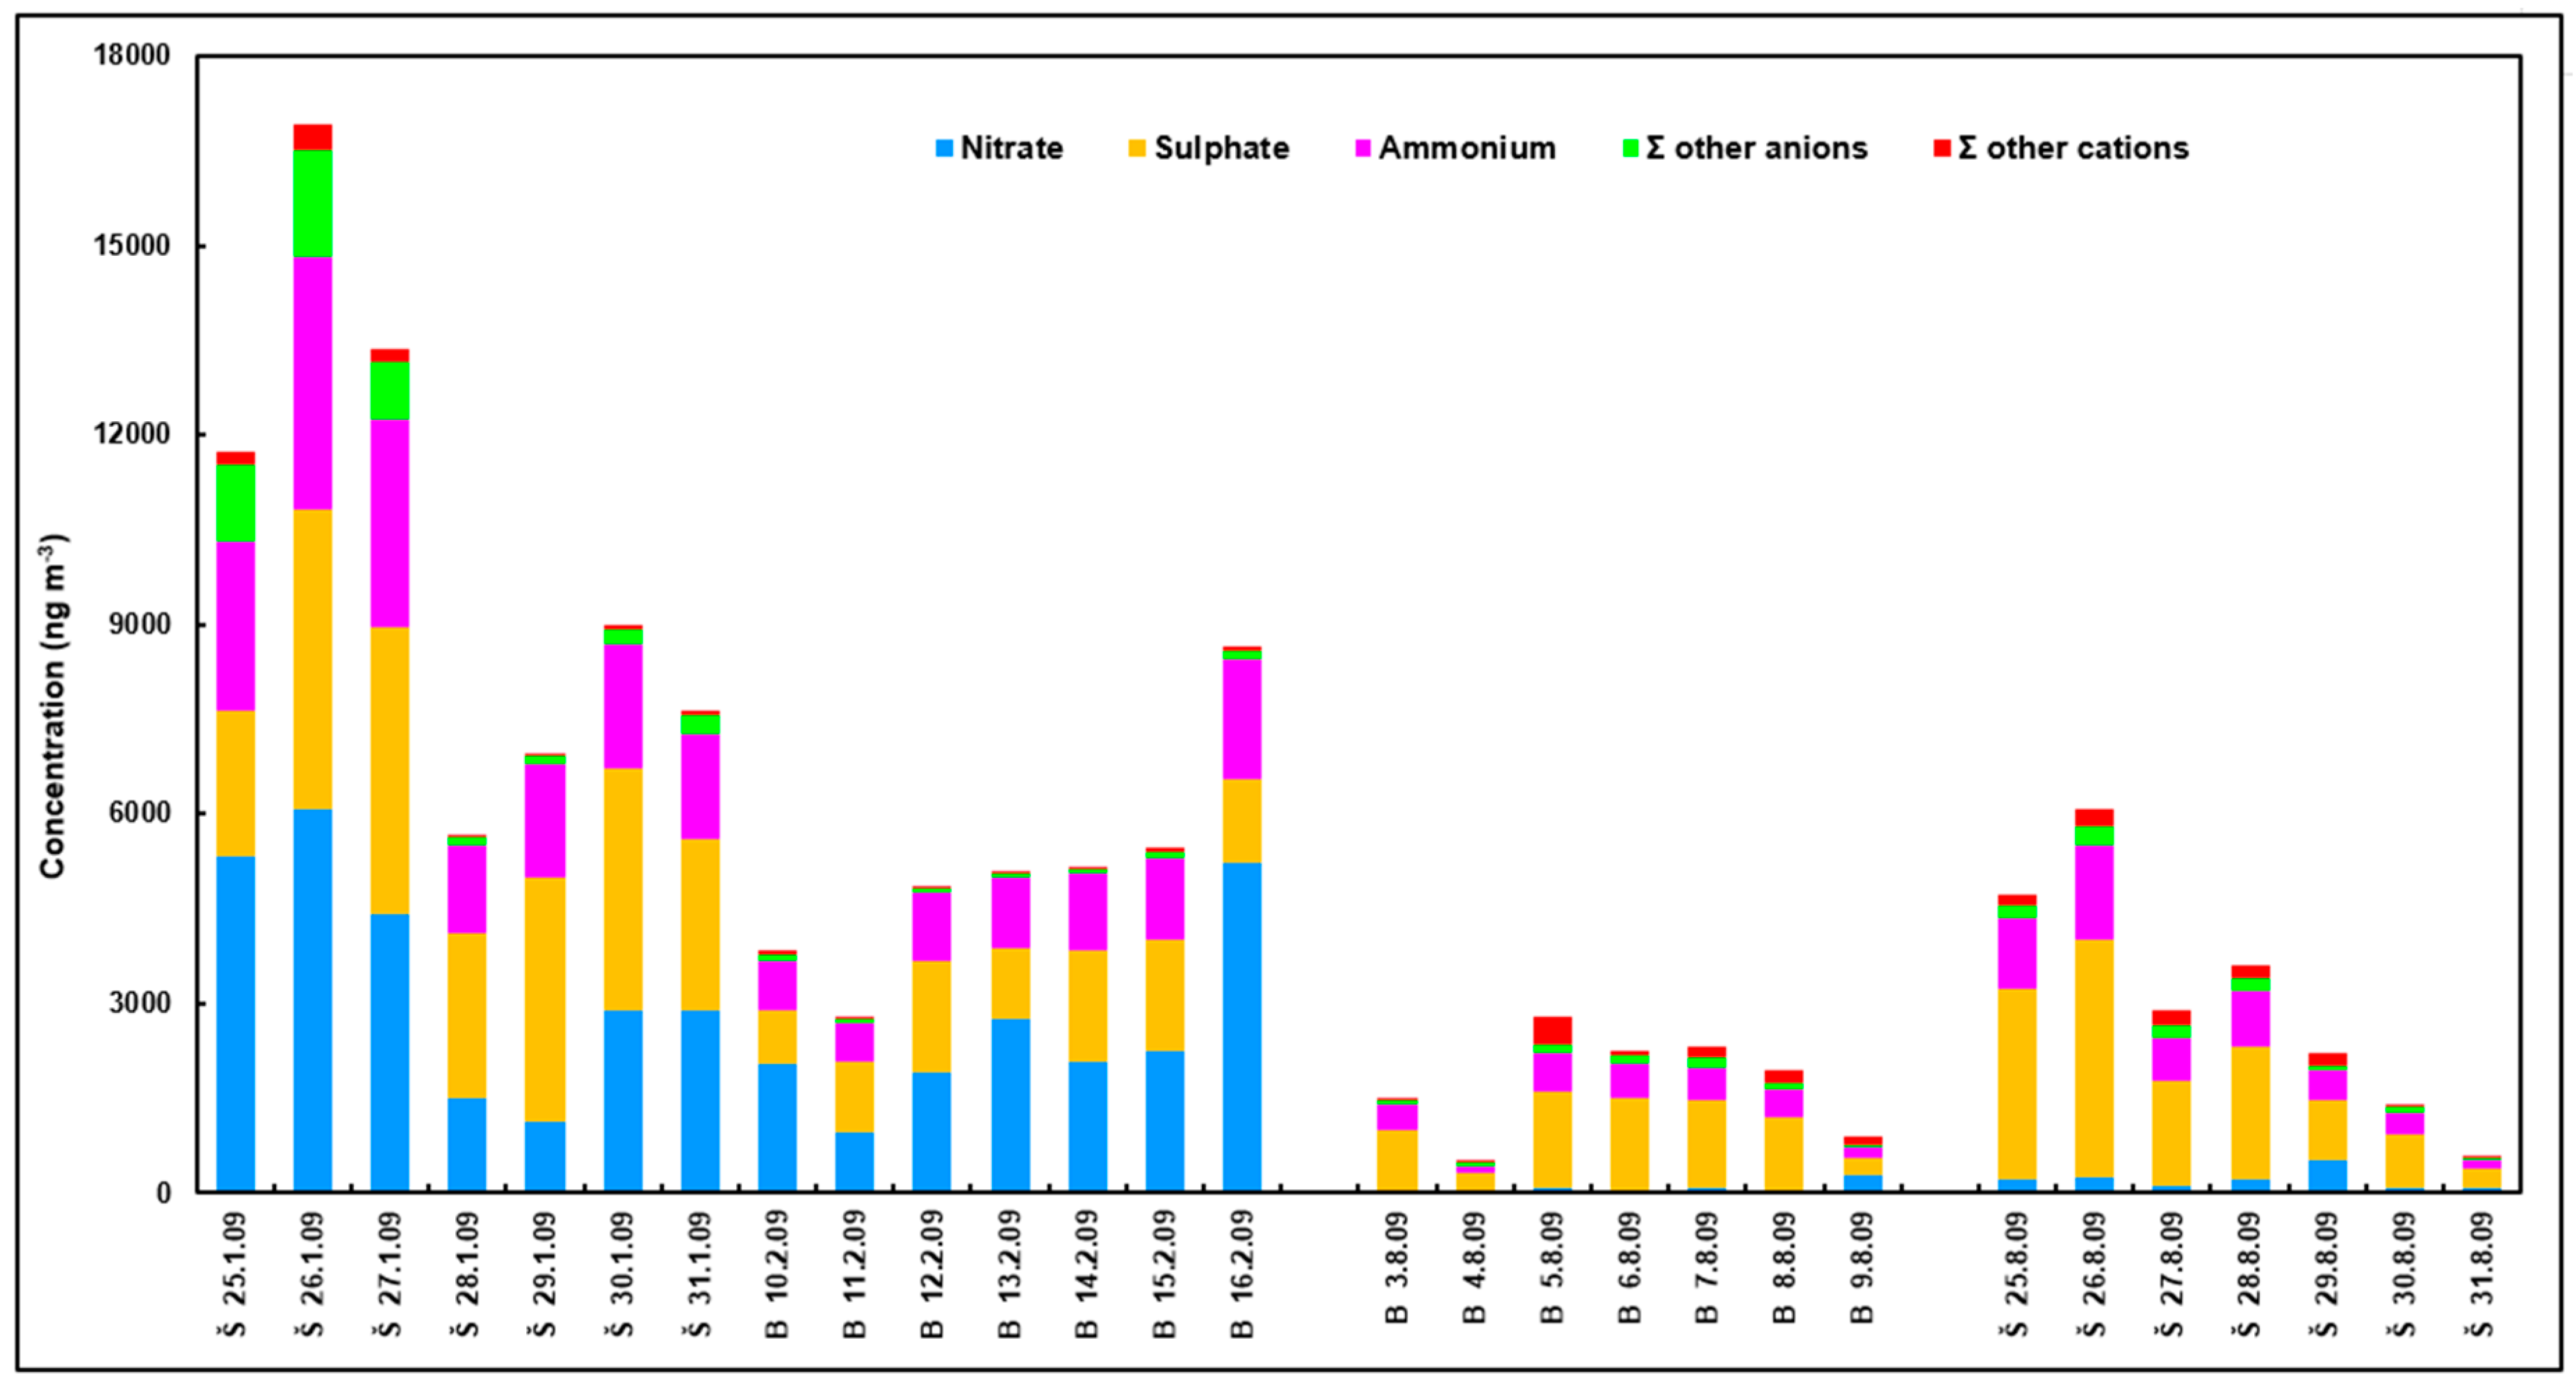
3.3. Characterization of Water-Soluble Ions
3.4. Correlation Analysis
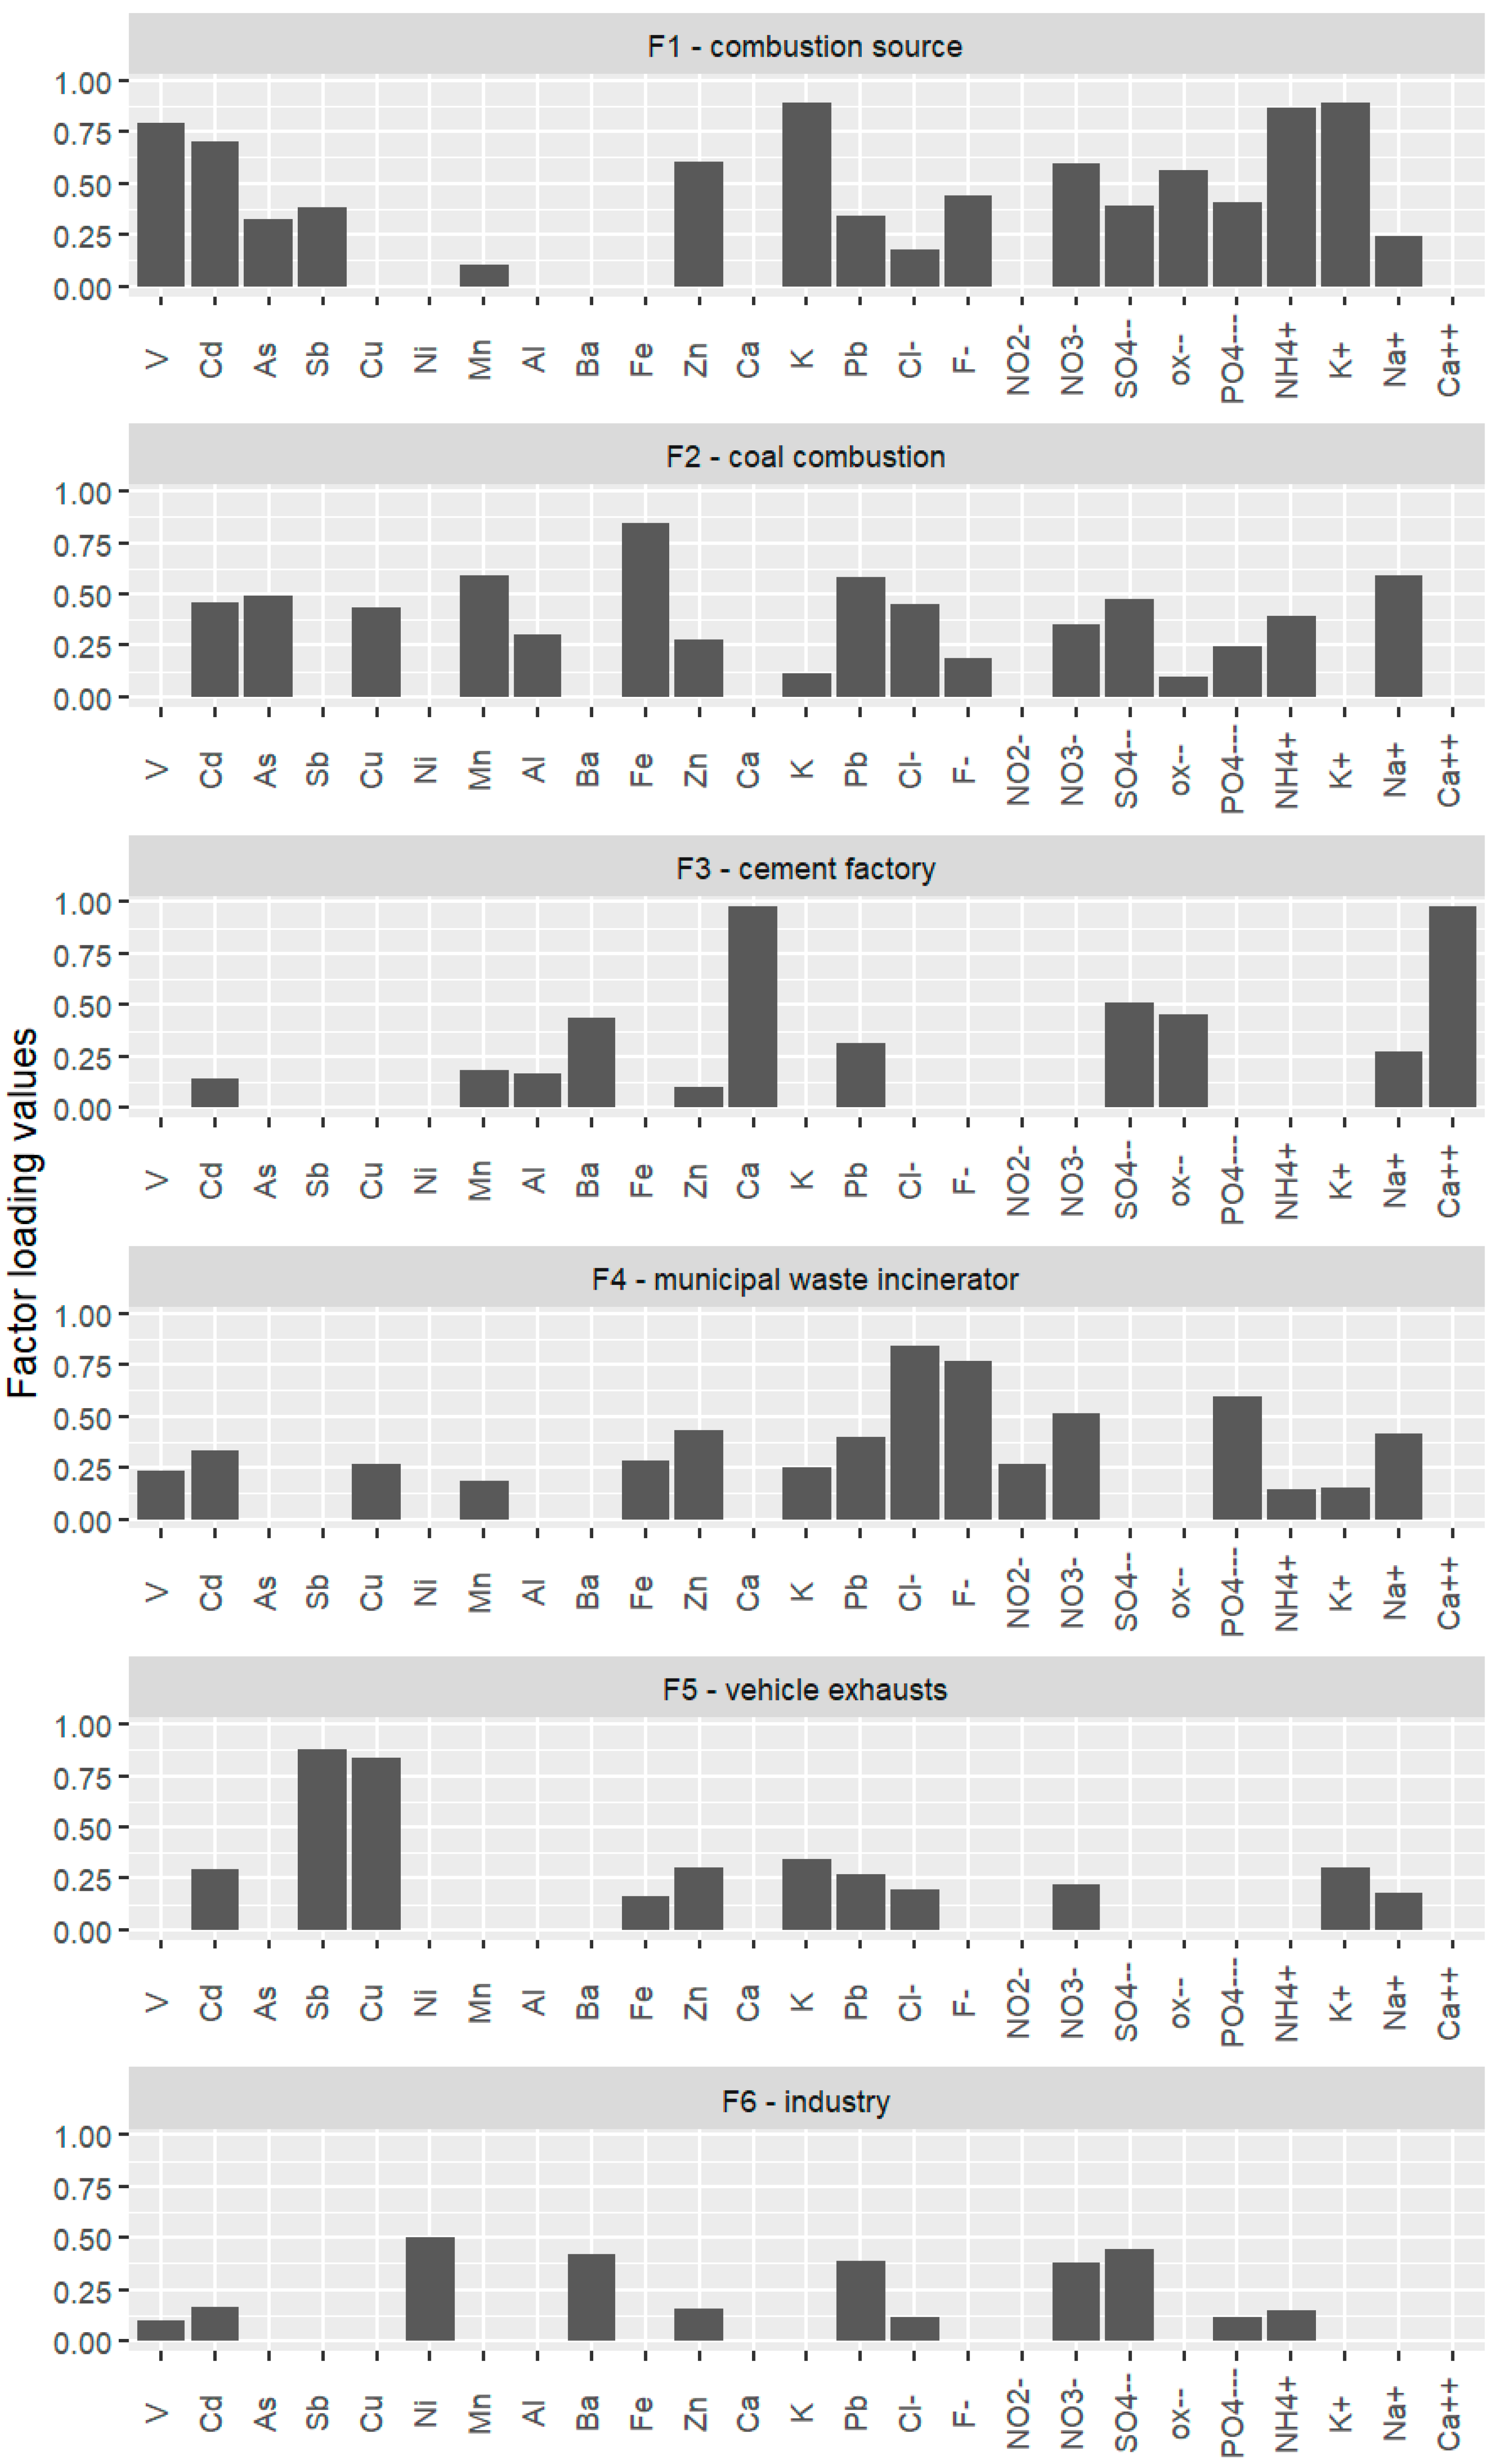
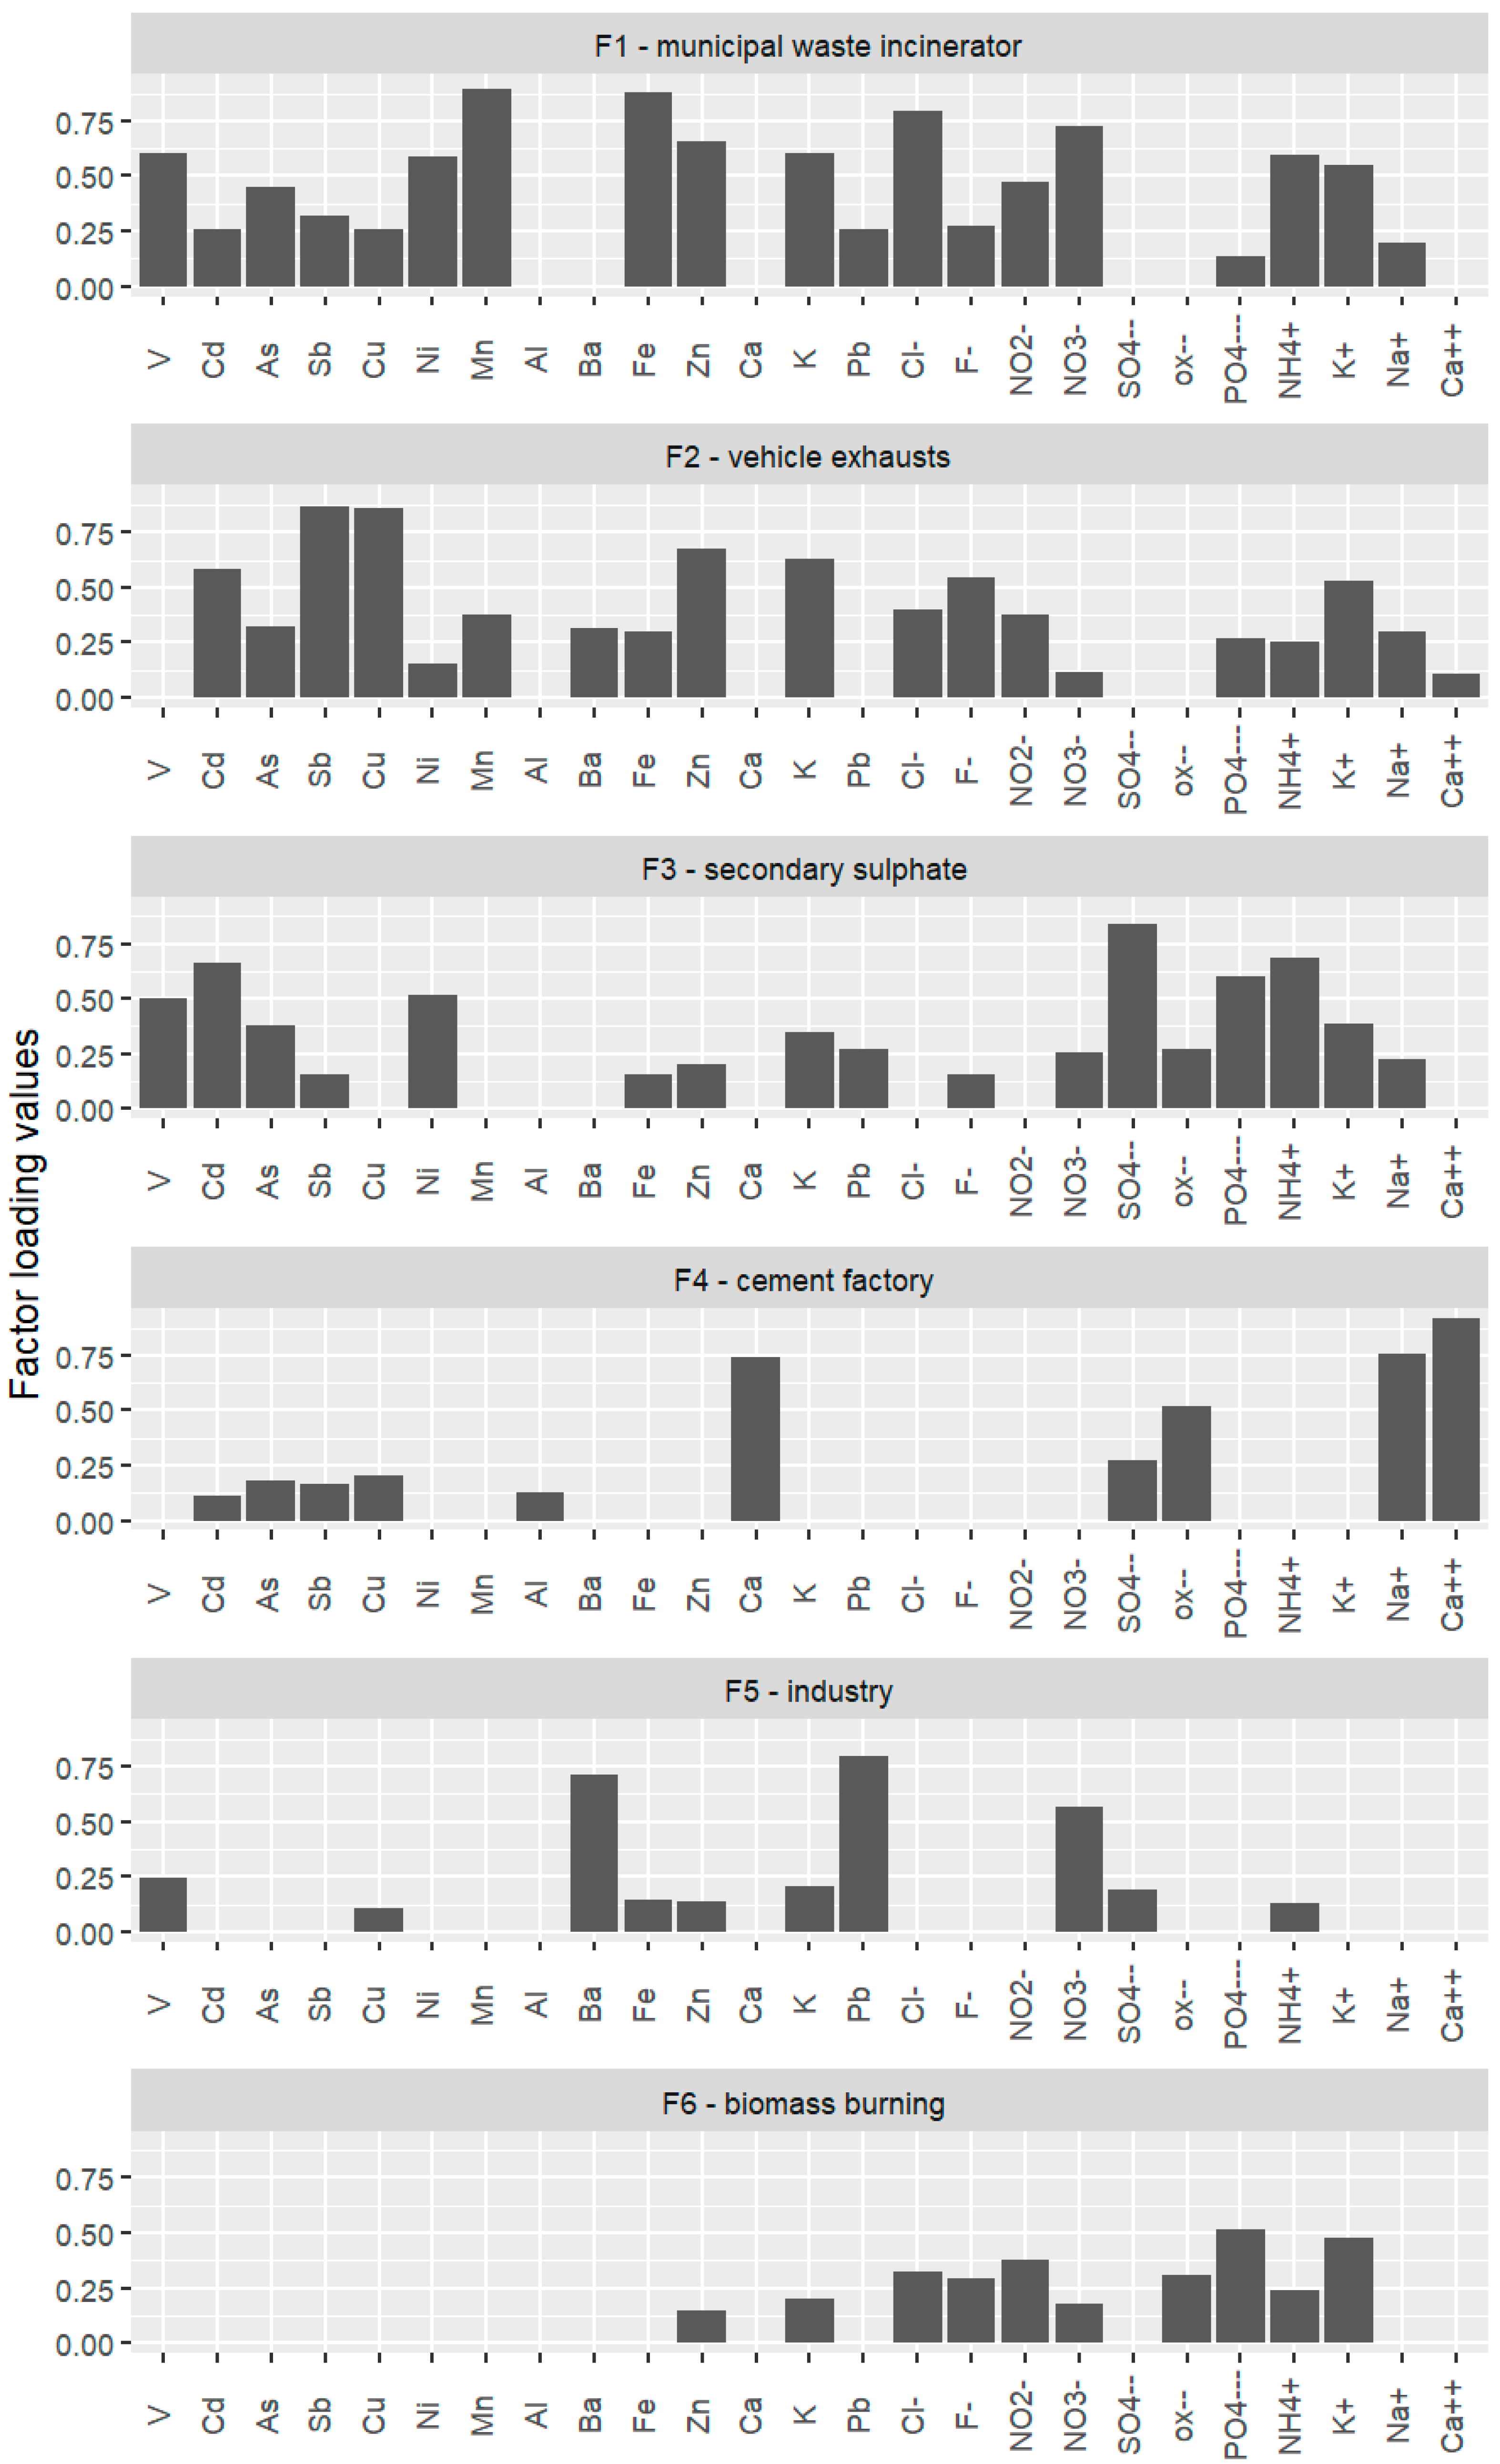
3.5. Source Apportionment
3.5.1. Analysis for Šlapanice
3.5.2. Analysis for Brno
3.5.3. Comparison of Results for Šlapanice and Brno
4. Conclusions
Supplementary Materials
Author Contributions
Funding
Acknowledgments
Conflicts of Interest
References
- Seinfeld, J.H.; Pandis, S.N. Atmospheric Chemistry and Physics. From Air Pollution to Climate Change; Wiley & Sons: New York, NY, USA, 1998. [Google Scholar]
- Pope, C.A.; Dockery, D.W.; Schwartz, J. Review of epidemiological evidence of health-effects of particulate air-pollution. Inhal. Toxicol. 1995, 7, 1–18. [Google Scholar] [CrossRef]
- Brunekreef, B.; Holgate, S.T. Air pollution and health. Lancet 2002, 360, 1233–1242. [Google Scholar] [CrossRef]
- Kim, K.H.; Kabir, E.; Kabir, S. A review on the human health impact of airborne particulate matter. Environ. Int. 2015, 74, 136–143. [Google Scholar] [CrossRef]
- Hovorka, J.; Pokorná, P.; Hopke, P.K.; Křůmal, K.; Mikuška, P.; Píšová, M. Wood burning as a main source of winter aerosol in residential district in proximity to a large automobile factory in Central Europe. Atmos. Environ. 2015, 113, 98–107. [Google Scholar] [CrossRef]
- Kozáková, J.; Leoni, C.; Klán, M.; Hovorka, J.; Racek, M.; Koštejn, M.; Ondráček, J.; Moravec, P.; Schwarz, J. Chemical Characterization of PM1-2.5 and its Associations with PM1, PM2.5-10 and Meteorology in Urban and Suburban Environments. Aerosol Air Qual. Res. 2018, 18, 1684–1697. [Google Scholar] [CrossRef] [Green Version]
- Schwarz, J.; Pokorná, P.; Rychlík, Š.; Škáchová, H.; Vlček, O.; Smolík, J.; Ždímal, V.; Hůnová, I. Assessment of air pollution origin based on year-long parallel measurement of PM2.5 and PM10 at two suburban sites in Prague, Czech Republic. Sci. Total Environ. 2019, 664, 1107–1116. [Google Scholar] [CrossRef]
- Pokorná, P.; Hovorka, J.; Klán, M.; Hopke, P.K. Source apportionment of size resolved particulate matter at a European air pollution hot spot. Sci. Total Environ. 2015, 502, 172–183. [Google Scholar] [CrossRef]
- Lhotka, R.; Pokorná, P.; Zíková, N. Long-Term Trends in PAH Concentrations and Sources at Rural Background Site in Central Europe. Atmosphere 2019, 10, 687. [Google Scholar] [CrossRef] [Green Version]
- Kozáková, J.; Pokorná, P.; Vodička, P.; Ondráčková, L.; Ondráček, J.; Křůmal, K.; Mikuška, P.; Hovorka, J.; Moravec, P.; Schwarz, J. The influence of local emissions and regional air pollution transport on a European air pollution hot spot. Environ. Sci. Pollut. R. 2019, 26, 1675–1692. [Google Scholar] [CrossRef]
- Křůmal, K.; Mikuška, P.; Vojtěšek, M.; Večeřa, Z. Seasonal variations of monosaccharide anhydrides in PM1 and PM2.5 aerosol in urban areas. Atmos. Environ. 2010, 44, 5148–5155. [Google Scholar] [CrossRef]
- Mikuška, P.; Křůmal, K.; Večeřa, Z. Characterization of organic compounds in the PM2.5 aerosols in winter in an industrial urban area. Atmos. Environ. 2015, 105, 97–108. [Google Scholar] [CrossRef]
- Vossler, T.; Cernikovsky, L.; Novak, J.; Placha, H.; Krejci, B.; Nikolova, I.; Chalupnickova, E.; Williams, R. An investigation of local and regional sources of fine particulate matter in Ostrava, the Czech Republic. Atmos. Pollut. Res. 2015, 6, 454–463. [Google Scholar]
- Schwarz, J.; Cusack, M.; Karban, J.; Chalupníčková, E.; Havránek, V.; Smolík, J.; Ždímal, V. PM2.5 chemical composition at a rural background site in Central Europe, including correlation and air mass back trajectory analysis. Atmos. Res. 2016, 176–177, 108–120. [Google Scholar] [CrossRef]
- Mikuška, P.; Kubátková, N.; Křůmal, K.; Večeřa, Z. Seasonal variability of monosaccharide anhydrides, resin acids, methoxyphenols and saccharides in PM2.5 in Brno, the Czech Republic. Atmos. Pollut. Res. 2017, 8, 576–586. [Google Scholar] [CrossRef]
- Mikuška, P.; Čapka, L.; Večeřa, Z. Aerosol sampler for analysis of fine and ultrafine aerosols. Anal. Chim. Acta 2018, 1020, 123–133. [Google Scholar] [CrossRef] [PubMed]
- Coufalík, P.; Čmelík, R.; Křůmal, K.; Čapka, L.; Mikuška, P. Determination of short-term changes in levoglucosan and dehydroabietic acid in aerosols with Condensation Growth Unit-Aerosol Counterflow Two-Jets Unit-LC-MS. Chemosphere 2018, 210, 279–286. [Google Scholar] [CrossRef]
- Křůmal, K.; Mikuška, P.; Večeřa, Z. Polycyclic aromatic hydrocarbons and hopanes in PM1 aerosols in urban areas. Atmos. Environ. 2013, 67, 27–37. [Google Scholar] [CrossRef]
- Křůmal, K.; Mikuška, P.; Večeřa, Z. Monosaccharide anhydrides, monocarboxylic acids and OC/EC in PM1 aerosols in urban areas in the Czech Republic. Atmos. Pollut. Res. 2015, 6, 917–927. [Google Scholar] [CrossRef]
- Kubelová, L.; Vodička, P.; Schwarz, J.; Cusack, M.; Makeš, O.; Ondráček, J.; Ždímal, V. A study of summer and winter highly time-resolved submicron aerosol composition measured at a suburban site in Prague. Atmos. Environ. 2015, 118, 45–57. [Google Scholar] [CrossRef]
- Coufalík, P.; Mikuška, P.; Matoušek, T.; Večeřa, Z. Determination of bioaccessible fraction of elements in urban aerosol using simulated lung fluids. Atmos. Environ. 2016, 140, 469–475. [Google Scholar] [CrossRef]
- Pokorná, P.; Hovorka, J.; Hopke, P.K. Elemental composition and source identification of very fine aerosol particles in a European air pollution hot-spot. Atmos. Pollut. Res. 2016, 7, 671–679. [Google Scholar] [CrossRef]
- Křůmal, K.; Mikuška, P.; Večeřa, Z. Characterization of organic compounds in winter PM1 aerosols in a small industrial town. Atmos. Pollut. Res. 2017, 8, 930–939. [Google Scholar] [CrossRef]
- Leoni, C.; Pokorná, P.; Hovorka, J.; Masiol, M.; Topinka, J.; Zhao, Y.; Křůmal, K.; Cliff, S.; Mikuška, P.; Hopke, P.K. Source apportionment of aerosol particles at a European air pollution hot spot using particle number size distributions and chemical composition. Environ. Pollut. 2018, 234, 145–154. [Google Scholar] [CrossRef]
- Dumková, J.; Vrlíková, L.; Večeřa, Z.; Putnová, B.; Dočekal, B.; Mikuška, P.; Fictum, P.; Hampl, A.; Buchtová, M. Inhaled Cadmium Oxide Nanoparticles: Their in Vivo Fate and Effect on Target Organs. Int. J. Mol. Sci. 2016, 17, 874. [Google Scholar] [CrossRef] [Green Version]
- Dumková, J.; Smutná, T.; Vrlíková, L.; Le Coustumer, P.; Večeřa, Z.; Dočekal, B.; Mikuška, P.; Čapka, L.; Fictum, P.; Hampl, A.; et al. Sub-chronic inhalation of lead oxide nanoparticles revealed their broad distribution and tissue-specific subcellular localization in target organs. Part. Fibre Toxicol. 2017, 14, 55. [Google Scholar] [CrossRef] [Green Version]
- Dvorská, A.; Komprdová, K.; Lammel, G.; Klánová, J.; Plachá, H. Polycyclic aromatic hydrocarbons in background air in central Europe—Seasonal levels and limitations for source apportionment. Atmos. Environ. 2012, 46, 147–154. [Google Scholar] [CrossRef]
- Vojtěšek, M.; Mikuška, P.; Křůmal, K.; Večeřa, Z. Analysis of water-soluble fraction of metals in atmospheric aerosols using Aerosol Counterflow Two-Jets Unit and chemiluminescent detection. Intern. J. Environ. Anal. Chem. 2012, 92, 432–449. [Google Scholar] [CrossRef]
- Viana, M.; Kuhlbusch, T.A.J.; Querol, X.; Alastuey, A.; Harrison, R.M.; Hopke, P.K.; Winiwarter, W.; Vallius, M.; Szidat, S.; Prévôt, A.S.H.; et al. Source apportionment of particulate matter in Europe: A review of methods and results. J. Aerosol. Sci. 2008, 39, 827–849. [Google Scholar] [CrossRef]
- Almeida, S.M.; Pio, C.A.; Freitas, M.C.; Reis, M.A.; Trancoso, M.A. Source apportionment of fine and coarse particulate matter in a sub-urban area at the Western European Coast. Atmos. Environ. 2005, 39, 3127–3138. [Google Scholar] [CrossRef]
- Vallius, M.; Janssen, N.A.H.; Heinrich, J.; Hoek, G.; Ruuskanen, J.; Cyrys, J.; Van Grieken, R.; de Hartog, J.J.; Kreyling, W.G.; Pekkanen, J. Sources and elemental composition of ambient PM2.5 in three European cities. Sci. Total Environ. 2005, 337, 147–162. [Google Scholar] [CrossRef]
- Viana, M.; Querol, X.; Alastuey, A.; Gil, J.I.; Menéndez, M. Identification of PM sources by principal component analysis (PCA) coupled with wind direction data. Chemosphere 2006, 65, 2411–2418. [Google Scholar] [CrossRef]
- Dai, Q.L.; Bi, X.H.; Wu, J.H.; Zhang, Y.F.; Wang, J.; Xu, H.; Yao, L.; Jiao, L.; Feng, Y.C. Characterization and source identification of heavy metals in ambient PM10 and PM2.5 in an integrated iron and steel industry zone compared with a background site. Aerosol Air Qual. Res. 2015, 15, 875–887. [Google Scholar] [CrossRef] [Green Version]
- Titos, G.; Lyamani, H.; Pandolfi, M.; Alastuey, A.; Alados-Arboledas, L. Identification of fine (PM1) and coarse (PM10-1) sources of particulate matter in an urban environment. Atmos. Environ. 2014, 89, 593–602. [Google Scholar] [CrossRef] [Green Version]
- Samek, L.; Stegowski, Z.; Furman, L.; Styszko, K.; Szramowiat, K.; Fiedor, J. Quantitative Assessment of PM2.5 Sources and Their Seasonal Variation in Krakow. Water Air Soil Pollut. 2017, 228, 290. [Google Scholar] [CrossRef] [PubMed] [Green Version]
- Juda-Rezler, K.; Reizer, M.; Maciejewska, K.; Blaszczak, B.; Klejnowski, K. Characterization of atmospheric PM2.5 sources at a Central European urban background site. Sci. Total Environ. 2020, 713, 136729. [Google Scholar] [CrossRef] [PubMed]
- Mikuška, P.; Večeřa, Z.; Bartošíková, A.; Maenhaut, W. Annular diffusion denuder for simultaneous removal of gaseous organic compounds and air oxidants during sampling of carbonaceous aerosols. Anal. Chim. Acta 2012, 714, 68–75. [Google Scholar] [CrossRef]
- Stein, A.F.; Draxler, R.R.; Rolph, G.D.; Stunder, B.J.B.; Cohen, M.D.; Ngan, F. NOAA’s HYSPLIT atmospheric transport and dispersion modeling system. Bull. Am. Meteorol. Soc. 2015, 96, 2059–2077. [Google Scholar] [CrossRef]
- Rolph, G.D. Real-time Environmental Applications and Display System (READY); NOAA Air Resources Laboratory: College Park, MD, USA, 2017. Available online: http://www.ready.noaa.gov (accessed on 15 June 2020).
- Überla, K. Faktorová Analýza; Alfa Bratislava: Bratislava, Slovak Republic, 1976. [Google Scholar]
- Johnson, R.A.; Wichern, D.W. Applied Multivariate Statistical Analysis; Prentice-Hall: New Jersey, NJ, USA, 1992. [Google Scholar]
- Miao, Y.; Li, J.; Miao, S.; Che, H.; Wang, Y.; Zhang, X.; Zhu, R.; Liu, S. Interaction between planetary boundary layer and PM2.5 pollution in megacities in China: A Review. Curr. Pollut. Rep. 2019, 5, 261–271. [Google Scholar] [CrossRef] [Green Version]
- Xiang, Y.; Tianshu Zhang, T.; Liu, J.; Lv, L.; Dong, Y.; Chen, Z. Atmosphere boundary layer height and its effect on air pollutants in Beijing during winter heavy pollution. Atmos. Res. 2019, 215, 305–316. [Google Scholar] [CrossRef]
- Yin, J.; Harrison, R.M. Pragmatic mass closure study for PM1.0, PM2.5 and PM10 at roadside, urban background and rural sites. Atmos. Environ. 2008, 42, 980–988. [Google Scholar] [CrossRef]
- Spindler, G.; Brüggemann, E.; Gnauk, T.; Grüner, A.; Müller, K.; Herrmann, H. A four-year size-segregated characterization study of particles PM10, PM2.5 and PM1 depending on air mass origin at Melpitz. Atmos. Environ. 2010, 44, 164–173. [Google Scholar] [CrossRef]
- Sarti, E.; Pasti, L.; Rossi, M.; Ascanelli, M.; Pagnoni, A.; Trombini, M.; Remelli, M. The composition of PM1 and PM2.5 samples, metals and their water soluble fractions in the Bologna area (Italy). Atmos. Pollut. Res. 2015, 6, 708–718. [Google Scholar] [CrossRef] [Green Version]
- Rogula-Kozłowska, W. Chemical composition and mass closure of ambient particulate matter at a crossroads and a highway in Katowice, Poland. Environ. Prot. Eng. 2015, 41, 15–29. [Google Scholar] [CrossRef]
- Rogula-Kozłowska, W.; Klejnowski, K. Submicrometer Aerosol in Rural and Urban Backgrounds in Southern Poland: Primary and Secondary Components of PM1. Bull. Environ. Contam. Toxicol. 2013, 90, 103–109. [Google Scholar] [CrossRef] [PubMed]
- Křůmal, K.; Mikuška, P. Mass concentrations and lung cancer risk assessment of PAHs bound to PM1 aerosol in six industrial, urban and rural areas in the Czech Republic, Central Europe. Atmos. Pollut. Res. 2020, 11, 401–408. [Google Scholar] [CrossRef]
- Tchounwou, P.B.; Yedjou, C.G.; Patlolla, A.K.; Sutton, D.J. Heavy Metal Toxicity and the Environment. In Molecular, Clinical and Environmental Toxicology. Experientia Supplementum; Luch, A., Ed.; Springer: Basel, Switzerland, 2012; Volume 101, pp. 133–164. [Google Scholar]
- Genchi, G.; Carocci, A.; Lauria, G.; Sinicropi, M.S.; Catalano, A. Nickel: Human Health and Environmental Toxicology. Int. J. Environ. Res. Public Health 2020, 17, 679. [Google Scholar] [CrossRef] [PubMed] [Green Version]
- The Czech Republic Act No. 201/2012 Coll., On Air Protection. Available online: https://www.mzp.cz/www/platnalegislativa.nsf/9F4906381B38F7F6C1257A94002EC4A0/%24file/201_2012.pdf (accessed on 26 June 2020).
- Wiseman, C.L.S.; Zereini, F. Characterizing metal(loid) solubility in airborne PM10, PM2.5 and PM1 in Frankfurt, Germany using simulated lung fluids. Atmos. Environ. 2014, 89, 282–289. [Google Scholar] [CrossRef]
- Caggiano, R.; Macchiato, M.; Trippetta, S. Levels, chemical composition and sources of fine aerosol particles (PM1) in an area of the Mediterranean basin. Sci. Total Environ. 2010, 408, 884–895. [Google Scholar] [CrossRef]
- Rudnick, R.L.; Gao, S. Composition of the continental crust. In Treatise on Geochemistry; Holland, H.D., Turekian, K.K., Eds.; Elsevier: New York, NY, USA, 2003; pp. 1–64. [Google Scholar]
- Harrison, R.M.; Tilling, R.; Romero, M.S.C.; Harrad, S.; Jarvis, K. A study of trace metals and polycyclic aromatic hydrocarbons in the roadside environment. Atmos. Environ. 2003, 37, 2391–2402. [Google Scholar] [CrossRef]
- Gugamsetty, B.; Wei, H.; Liu, C.N.; Awasthi, A.; Hsu, S.C.; Tsai, C.J.; Roam, G.D.; Wu, Y.C.; Chen, C.F. Source characterization and apportionment of PM10, PM2.5 and PM0.1 by using positive matrix factorization. Aerosol Air Qual. Res. 2012, 12, 476–491. [Google Scholar] [CrossRef]
- Fine, P.M.; Cass, G.R.; Simoneit, B.R. Chemical characterization of fine particle emissions from fireplace combustion of woods grown in the northeastern United States. Environ. Sci. Technol. 2001, 35, 2665–2675. [Google Scholar] [CrossRef] [PubMed]
- Pacyna, J.M.; Pacyna, E.G. An assessment of global and regional emissions of trace metals to the atmosphere from anthropogenic sources worldwide. Environ. Rev. 2001, 9, 269–298. [Google Scholar] [CrossRef]
- Xu, M.; Yan, R.; Zheng, C.; Qiao, Y.; Han, J.; Sheng, C. Status of trace element emission in a coal combustion process: A review. Fuel Process. Technol. 2003, 85, 215–237. [Google Scholar] [CrossRef]
- Wiinikka, H.; Grönberg, C.; Boman, C. Emissions of heavy metals during fixed-bed combustion of six biomass fuels. Energy Fuels 2013, 27, 1073–1080. [Google Scholar] [CrossRef]
- Chen, J.; Li, C.; Ristovski, Z.; Milic, A.; Gu, Y.; Islam, M.S.; Wang, S.; Hao, J.; Zhang, H.; He, C.; et al. A review of biomass burning: Emissions and impacts on air quality, health and climate in China. Sci. Total Environ. 2017, 579, 1000–1034. [Google Scholar] [CrossRef] [Green Version]
- Křůmal, K.; Mikuška, P.; Horák, J.; Hopan, F.; Krpec, K. Characterization of gaseous and particulate pollutants in emissions from combustion of biomass and coal in modern and old-type boilers during reduced output used for residential heating. Chemosphere 2019, 229, 51–59. [Google Scholar] [CrossRef] [PubMed]
- Czech Statistical Office. Population and Housing Census; Prague, Czech Republic, 2011; Available online: https://vdb.czso.cz/vdbvo2/faces/cs/index.jsf?page=vystup-objekt-parametry&pvo=OTOR119&sp=A&z=T&f=TABULKA&katalog=30812&pvokc=65&pvoch=6203 (accessed on 11 October 2017).
- Hu, C.W.; Chao, M.R.; Wu, K.Y.; Chang-Chien, G.P.; Lee, W.J.; Chang, L.W.; Lee, W.S. Characterization of multiple airborne particulate metals in the surroundings of a municipal waste incinerator in Taiwan. Atmos. Environ. 2003, 37, 2845–2852. [Google Scholar] [CrossRef]
- Rovira, J.; Nadal, M.; Schuhmacher, M.; Domingo, J.L. Concentrations of trace elements and PCDD/Fs around a municipal solid waste incinerator in Girona (Catalonia, Spain). Human health risks for the population living in the neighborhood. Sci. Total Environ. 2018, 630, 34–45. [Google Scholar] [CrossRef] [PubMed]
- Horák, J.; Kuboňová, L.; Bajer, S.; Dej, M.; Hopan, F.; Krpec, K.; Ochodek, T. Composition of ashes from the combustion of solid fuels and municipal waste in households. J. Environ. Manag. 2019, 248, 109269. [Google Scholar] [CrossRef]
- Conesa, J.A.; Rey, L.; Egea, S.; Rey, M.D. Pollutant ormation and emissions from cement kiln stack using a solid recovered fuel from municipal solid waste. Environ. Sci. Technol. 2011, 45, 5878–5884. [Google Scholar] [CrossRef] [Green Version]
- Gupta, R.K.; Majumdar, D.; Trivedi, J.V.; Bhanarkar, A.D. Particulate matter and elemental emissions from a cement kiln. Fuel Process. Technol. 2012, 104, 343–351. [Google Scholar] [CrossRef]
- Arfala, Y.; Douch, J.; Assabbane, A.; Kaaouachi, K.; Tian, H.; Hamdani, M. Assessment of heavy metals released into the air from the cement kilns co-burning waste: Case of Oujda cement manufacturing (Northeast Morocco). Sustain. Environ. Res. 2018, 28, 363–373. [Google Scholar] [CrossRef]
- Zhou, J.; Zhang, R.; Cao, J.; Chow, J.C.; Watson, J.G. Carbonaceous and ionic components of atmospheric fine particles in Beijing and their impact on atmospheric visibility. Aerosol Air Qual. Res. 2012, 12, 492–502. [Google Scholar] [CrossRef]
- Aneja, V.P.; Roelle, P.A.; Murray, G.C.; Southerland, J.; Erisman, J.W.; Fowler, D.; Asman, W.A.H.; Patni, N. Atmospheric nitrogen compounds II: Emissions, transport, transformation, deposition and assessment. Atmos. Environ. 2001, 35, 1903–1911. [Google Scholar] [CrossRef]
- Russell, A.G.; McRae, G.J.; Cass, G.R. Mathematical modeling of the formation and transport of ammonium nitrate aerosol. Atmos. Environ. 1983, 17, 949–964. [Google Scholar] [CrossRef]
- Zhang, F.; Cheng, H.; Wang, Z.; Lv, X.; Zhu, Z.; Zhang, G.; Wang, X. Fine particles (PM2.5) at a CAWNET background site in Central China: Chemical compositions, seasonal variations and regional pollution events. Atmos. Environ. 2014, 86, 193–202. [Google Scholar] [CrossRef]
- Weinstein, L.H.; Davison, A. Fluorides in the Environment: Effects on Plants and Animals; CABI Publishing: Wallingford, Oxfordshire, England, 2004. [Google Scholar]
- Zavala, M.; Molina, L.T.; Maiz, P.; Monsivais, I.; Chow, J.C.; Watson, J.G.; Munguia, J.L.; Cardenas, B.; Fortner, E.C.; Herndon, S.C.; et al. Black carbon, organic carbon, and co-pollutant emissions and energy efficiency from artisanal brick production in Mexico. Atmos. Chem. Phys. 2018, 18, 6023–6037. [Google Scholar] [CrossRef] [Green Version]
- Jiang, Y.; Zhuang, G.; Wang, Q.; Liu, T.; Huang, K.; Fu, J.S.; Li, J.; Lin, Y.; Zhang, R.; Deng, C. Characteristics, sources and formation of aerosol oxalate in an Eastern Asia megacity and its implication to haze pollution. Atmos. Chem. Phys. 2011, 11, 22075–22112. [Google Scholar] [CrossRef]
- Laongsri, B.; Harrison, R.M. Atmospheric behaviour of particulate oxalate at UK urban background and rural sites. Atmos. Environ. 2013, 71, 319–326. [Google Scholar] [CrossRef]
- Wang, Y.; Zhuang, G.; Tang, A.; Yuan, H.; Sun, Y.; Chen, S.; Zheng, A. The ion chemistry and the source of PM2.5 aerosol in Beijing. Atmos. Environ. 2005, 39, 3771–3784. [Google Scholar] [CrossRef]
- Coufalík, P.; Matoušek, T.; Křůmal, K.; Vojtíšek-Lom, M.; Beránek, V.; Mikuška, P. Content of metals in emissions from gasoline, diesel, and alternative biofuels. Environ. Sci. Pollut. Res. 2019, 26, 29012–29019. [Google Scholar] [CrossRef] [PubMed]
- Xue, Y.; Wu, J.; Feng, Y.; Dai, L.; Bi, X.; Li, X.; Zhu, T.; Tang, S.; Chen, M. Source characterization and apportionment of PM10 in Panzhihua, China. Aerosol Air Qual. Res. 2010, 10, 367–377. [Google Scholar] [CrossRef] [Green Version]
- Huang, X.; Olmez, I.; Aras, N.K.; Gordon, G.E. Emissions of trace elements from motor vehicles: Potential marker elements and source composition profile. Atmos. Environ. 1994, 28, 1385–1391. [Google Scholar] [CrossRef]


| Locality—Season | Temperature (°C) | Relative Humidity (%) | Modelled Wind Direction (Predominant) | ||
|---|---|---|---|---|---|
| Average | (Range) | Average | (Range) | ||
| Brno—winter 2009 | −1.9 | (−3.0–0.1) | 77.6 | (67.7–89.5) | north, northwest |
| Šlapanice—winter 2009 | 0.6 | (−2.4–1.6) | 81.7 | (69.6–92.2) | northeast |
| Brno—summer 2009 | 21.0 | (18.5–21.8) | 67.1 | (54.3–80.7) | all directions |
| Šlapanice—summer 2009 | 20.0 | (14.3–24.9) | 71.9 | (67.7–86.7) | northwest |
| Brno—winter 2010 | −3.0 | (−6.0–1.0) | 75.2 | (69.4–85.0) | all directions |
| Šlapanice—winter 2010 | 0.8 | (−1.9–2.5) | 88.1 | (82.0–97.2) | south |
| Brno—summer 2010 | 18.0 | (17.2–21.2) | 71.3 | (65.3–84.8) | west |
| Šlapanice—summer 2010 | 18.2 | (15.1–20.1) | 79.2 | (65.9–93.4) | north |
| Locality—Season | PM1 (µg/m3) | |
|---|---|---|
| Mean | (Range) | |
| Brno—winter 2009 (10–16 February 2009) | 12.3 | (10.3–20.3) |
| Šlapanice—winter 2009 (25–31 January 2009) | 28.5 | (13.1–47.8) |
| Brno—summer 2009 (3–9 August 2009) | 8.89 | (7.72–10.7) |
| Šlapanice—summer 2009 (25–31 August 2009) | 12.2 | (5.99–18.6) |
| Brno—winter 2010 (1–7 February 2010) | 25.9 | (20.9–32.5) |
| Šlapanice—winter 2010 (16–22 February 2010) | 33.1 | (19.1–52.8) |
| Brno—summer 2010 (17–23 August 2010) | 10.4 | (5.77–17.6) |
| Šlapanice—summer 2010 (25–31 July 2010) | 7.73 | (5.88–11.3) |
| PM Component | Brno | Šlapanice | ||
|---|---|---|---|---|
| Winter | Summer | Winter | Summer | |
| Mean | Mean | Mean | Mean | |
| (range) | (range) | (range) | (range) | |
| V | 0.41 | 0.13 | 0.51 | 0.07 |
| (0.29–0.66) | (nd–0.30) | (0.36–0.77) | (nd–0.27) | |
| Cd | 0.09 | 0.18 | 0.48 | 0.20 |
| (0.05–0.14) | (nd–0.35) | (0.20–0.93) | (0.08–0.45) | |
| As | 0.32 | 0.55 | 0.74 | 0.17 |
| (0.15–0.58) | (nd–1.51) | (0.19–1.47) | (nd–0.42) | |
| Sb | 0.24 | 0.67 | 1.08 | 0.78 |
| (0.14–0.42) | (0.20–0.98) | (0.41–2.26) | (0.41–1.35) | |
| Cu | 0.46 | 1.08 | 1.33 | 0.50 |
| (0.25–0.76) | (nd–1.56) | (0.38–3.16) | (0.23–0.98) | |
| Ni | 0.37 | nd | 3.79 | nd |
| (0.09–0.66) | (nd–nd) | (0.77–20.7) | (nd–nd) | |
| Mn | 1.18 | 1.38 | 3.10 | 1.94 |
| (0.54–2.23) | (0.42–2.11) | (0.69–6.36) | (0.39–5.50) | |
| Al | 9.44 | 7.07 | 9.32 | 9.35 |
| (1.82–18.8) | (nd–18.9 | (3.64–14.0) | (nd–27.8) | |
| Ba | 22.1 | 11.42 | 31.9 | 10.2 |
| (2.39–63.9) | (3.15–20.0) | (0.48–107) | (1.99–17.7) | |
| Fe | 28.8 | 5.45 | 37.9 | 4.01 |
| (14.7–45.9) | (nd–10.9) | (10.2–123) | (nd–12.6) | |
| Zn | 8.49 | 8.52 | 35.8 | 17.2 |
| (5.48–15.6) | (2.60–12.8) | (13.6–72.6) | (5.61–66.1) | |
| Ca | 30.0 | 54.7 | 31.7 | 40.9 |
| (4.12–47.3) | (19.3–119) | (14.8–48.1) | (29.9–51.2) | |
| K | 63.3 | 68.1 | 201 | 76.7 |
| (32.9–127) | (34.3–124) | (95.2–326) | (24.7–145) | |
| Pb | 133 | 27.3 | 211 | 42.9 |
| (90.5–265) | (5.93–44.9) | (83.4–465) | (15.5–96.0) | |
| F− | 5.87 | 5.51 | 29.1 | 4.90 |
| (nd–16.9) | (0.99–14.6) | (4.46–67.1) | (1.20–10.2) | |
| Cl− | 10.4 | 6.59 | 515 | 13.1 |
| (nd–36.5) | (1.05–17.1) | (47.3–1461) | (1.93–26.4) | |
| NO2− | 3.20 | 5.14 | 8.35 | 5.97 |
| (2.11–4.29) | (0.99–22.5) | (5.83–13.7) | (0.74–12.1) | |
| NO3− | 2462 | 79.9 | 3460 | 215 |
| (969–5224) | (8.39–294) | (1128–6090) | (82.9–530) | |
| SO42− | 1386 | 1012 | 3516 | 1799 |
| (846–1775) | (262–1535) | (2328–4731) | (285–3742) | |
| oxalate | 55.9 | 85.8 | 91.5 | 133 |
| (32.2–72.8) | (19.0–148) | (50.2–109) | (28.4–262) | |
| PO43− | 3.00 | 3.90 | 26.2 | 5.18 |
| (nd–8.84) | (1.00–10.7) | (13.0–48.1) | (nd–21.1) | |
| Na+ | 4.30 | 50.1 | 30.4 | 25.0 |
| (nd–11.5) | (2.01–166) | (nd–148) | (1.01–57.1) | |
| K+ | 39.5 | 55.6 | 84.7 | 63.3 |
| (10.5–72.7) | (17.3–109) | (18.7–175) | (18.2–119) | |
| NH4+ | 1140 | 395 | 2387 | 733 |
| (616–1894) | (121–601) | (1388–3989) | (134–1450) | |
| Ca2+ | 5.37 | 26.6 | 28.0 | 35.4 |
| (2.11–10.3) | (15.0–46.3) | (11.9–43.7) | (25.9–45.8) | |
| Mg2+ | nd | nd | nd | 3.52 |
| (nd–nd) | (nd–nd) | (nd–nd) | (1.00–6.02) | |
| PM Component | Brno | Šlapanice | ||
|---|---|---|---|---|
| Winter | Summer | Winter | Summer | |
| Mean | Mean | Mean | Mean | |
| (range) | (range) | (range) | (range) | |
| V | 0.57 | nd | 0.98 | 0.08 |
| (0.31–0.97) | (nd–nd) | (0.37–1.45) | (nd–0.58) | |
| Cd | 0.58 | 0.15 | 0.50 | 0.10 |
| (0.38–1.17) | (0.07–0.26) | (0.42–0.62) | (0.02–0.32) | |
| As | 1.11 | 0.20 | 1.06 | 0.88 |
| (0.54–1.68) | (nd–0.43) | (0.66–1.92) | (nd–2.44) | |
| Sb | 1.05 | 0.70 | 1.93 | 0.29 |
| (0.67–1.72) | (0.44–1.13) | (0.84–4.96) | (0.09–0.39) | |
| Cu | 1.40 | 1.44 | 1.09 | 0.60 |
| (0.45–3.47) | (1.04–2.15) | (0.31–3.02) | (nd–1.14) | |
| Ni | 1.38 | 0.10 | 0.72 | nd |
| (0.40–4.21) | (0.02–0.23) | (0.29–1.40) | (nd–nd) | |
| Mn | 5.90 | 1.24 | 2.14 | 2.37 |
| (1.71–11.6) | (0.51–1.83) | (0.73–5.28) | (0.78–3.84) | |
| Al | 3.89 | 8.63 | 1.51 | 13.5 |
| (0.90–11.1) | (7.21–11.4) | (0.45–2.90) | (nd–27.6) | |
| Ba | 12.6 | 0.10 | nd | 0.87 |
| (nd–69.6) | (nd–0.30) | (nd–nd) | (nd–4.87) | |
| Fe | 57.4 | 25.1 | 20.4 | 33.2 |
| (20.6–86.0) | (20.8–31.5) | (10.6–53.0) | (7.44–70.1) | |
| Zn | 46.2 | 12.5 | 40.2 | 9.77 |
| (19.8–73.7) | (4.54–19.7) | (27.4–51.4) | (4.45–12.9) | |
| Ca | 20.7 | 13.0 | 6.87 | 6.15 |
| (13.6–26.5) | (10.7–16.8) | (2.88–13.2) | (2.45–12.8) | |
| K | 273 | 44.0 | 353 | 25.7 |
| (217–377) | (8.59–100) | (229–391) | (18.2–33.1) | |
| Pb | 76.7 | 3.05 | 81.1 | 3.36 |
| (46.5–109) | (1.69–5.04) | (50.6–135) | (nd–7.18) | |
| F− | 14.4 | 4.02 | 43.4 | 0.27 |
| (7.65–27.3) | (nd–7.89) | (16.5–141) | (nd–1.91) | |
| Cl− | 140 | 7.65 | 315 | 10.7 |
| (37.8–194) | (nd–19.2) | (40.3–1129) | (2.61–21.6) | |
| NO2− | 23.4 | 2.06 | 16.7 | 17.5 |
| (3.52–74.8) | (0.48–3.54) | (nd–46.5) | (0.30–82.6) | |
| NO3− | 3746 | 105 | 3156 | 137 |
| (2234–5422) | (8.20–519) | (1727–4315) | (25.1–335) | |
| SO42− | 1355 | 577 | 1591 | 596 |
| (518–2770) | (79.0–1315) | (280–3228) | (178–1009) | |
| oxalate | 74.8 | 78.0 | 121 | 23.7 |
| (51.9–112) | (7.29–190) | (2.82–234) | (0.50–46.6) | |
| PO43− | 24.0 | 12.3 | 30.1 | 3.01 |
| (5.48–37.2) | (1.75–44.0) | (nd–67.0) | (0.28–6.59) | |
| Na+ | 45.1 | 4.74 | 75.9 | 2.58 |
| (13.1–70.2) | (nd–10.2) | (6.34–324) | (nd–6.68) | |
| K+ | 212 | 36.8 | 314 | 18.5 |
| (171–278) | (10.1–105) | (191–352) | (12.8–21.7) | |
| NH4+ | 3217 | 701 | 3261 | 716 |
| (2539–3942) | (117–1382) | (1783–5475) | (211–1173) | |
| Ca2+ | 6.12 | 8.27 | 4.93 | 4.50 |
| (3.35–9.05) | (4.49–13.7) | (2.03–9.48) | (1.85–9.43) | |
| Mg2+ | 1.00 | 0.66 | 4.32 | 0.10 |
| (nd–3.08) | (0.06–1.37) | (nd–27.2) | (nd–0.68) | |
| Fe | Al | Ca | V | Mn | K | Ni | Ba | Cu | As | Zn | Sb | Cd | Pb | |
|---|---|---|---|---|---|---|---|---|---|---|---|---|---|---|
| Brno | 1.00 | 0.24 | 4.57 | 4.82 | 5.65 | 8.94 | 8.59 | 48.2 | 103 | 283 | 462 | 4356 | 5753 | 6393 |
| Šlapanice | 1.00 | 0.37 | 4.41 | 8.11 | 9.39 | 17.9 | 28.2 | 53.4 | 80.8 | 285 | 1096 | 7985 | 9717 | 11,722 |
| F1 | F2 | F3 | F4 | F5 | F6 | |
|---|---|---|---|---|---|---|
| V | 0.79 | 0.24 | 0.1 | |||
| Cd | 0.7 | 0.46 | 0.14 | 0.33 | 0.3 | 0.16 |
| As | 0.32 | 0.49 | ||||
| Sb | 0.38 | 0.88 | ||||
| Cu | 0.43 | 0.26 | 0.84 | |||
| Ni | 0.5 | |||||
| Mn | 0.1 | 0.59 | 0.19 | 0.19 | ||
| Al | 0.3 | 0.17 | ||||
| Ba | 0.44 | 0.42 | ||||
| Fe | 0.84 | 0.28 | 0.16 | |||
| Zn | 0.6 | 0.28 | 0.1 | 0.43 | 0.3 | 0.16 |
| Ca | 0.98 | |||||
| K | 0.89 | 0.11 | 0.25 | 0.34 | ||
| Pb | 0.34 | 0.59 | 0.31 | 0.4 | 0.27 | 0.39 |
| NO3− | 0.6 | 0.35 | 0.51 | 0.22 | 0.38 | |
| SO42− | 0.39 | 0.48 | 0.51 | 0.44 | ||
| Oxalate | 0.57 | 0.1 | 0.45 | |||
| F− | 0.44 | 0.19 | 0.77 | |||
| Cl− | 0.18 | 0.45 | 0.84 | 0.2 | 0.12 | |
| NO2− | 0.1 | 0.27 | ||||
| PO43− | 0.41 | 0.25 | 0.6 | 0.12 | ||
| NH4+ | 0.87 | 0.39 | 0.14 | 0.15 | ||
| Na+ | 0.25 | 0.59 | 0.28 | 0.41 | 0.18 | |
| K+ | 0.89 | 0.15 | 0.31 | |||
| Ca2+ | 0.98 | |||||
| Variance (%) | 23 | 14 | 13 | 12 | 9 | 5 |
| Cumul.Var. (%) | 23 | 37 | 50 | 62 | 71 | 76 |
| F1 | F2 | F3 | F4 | F5 | F6 | |
|---|---|---|---|---|---|---|
| V | 0.61 | 0.5 | 0.24 | |||
| Cd | 0.26 | 0.58 | 0.66 | 0.11 | ||
| As | 0.45 | 0.32 | 0.38 | 0.18 | ||
| Sb | 0.32 | 0.87 | 0.16 | 0.16 | ||
| Cu | 0.26 | 0.86 | 0.2 | 0.11 | ||
| Ni | 0.59 | 0.15 | 0.51 | |||
| Mn | 0.9 | 0.38 | ||||
| Al | 0.1 | 0.13 | ||||
| Ba | 0.31 | 0.71 | ||||
| Fe | 0.88 | 0.3 | 0.16 | 0.15 | ||
| Zn | 0.65 | 0.68 | 0.2 | 0.14 | 0.15 | |
| Ca | 0.74 | |||||
| K | 0.61 | 0.63 | 0.35 | 0.21 | 0.2 | |
| Pb | 0.26 | 0.27 | 0.8 | |||
| NO3− | 0.73 | 0.11 | 0.25 | 0.57 | 0.18 | |
| SO42− | 0.84 | 0.28 | 0.19 | |||
| Oxalate | 0.27 | 0.52 | 0.31 | |||
| F− | 0.27 | 0.54 | 0.16 | 0.29 | ||
| Cl− | 0.79 | 0.4 | 0.32 | |||
| NO2− | 0.47 | 0.37 | 0.38 | |||
| PO43− | 0.13 | 0.27 | 0.6 | 0.51 | ||
| NH4+ | 0.6 | 0.25 | 0.69 | 0.13 | 0.24 | |
| Na+ | 0.2 | 0.3 | 0.23 | 0.75 | ||
| K+ | 0.55 | 0.53 | 0.38 | 0.48 | ||
| Ca2+ | 0.1 | 0.92 | ||||
| Variance (%) | 23 | 18 | 13 | 10 | 8 | 7 |
| Cumul.Var. (%) | 23 | 41 | 54 | 64 | 72 | 79 |
© 2020 by the authors. Licensee MDPI, Basel, Switzerland. This article is an open access article distributed under the terms and conditions of the Creative Commons Attribution (CC BY) license (http://creativecommons.org/licenses/by/4.0/).
Share and Cite
Mikuška, P.; Vojtěšek, M.; Křůmal, K.; Mikušková-Čampulová, M.; Michálek, J.; Večeřa, Z. Characterization and Source Identification of Elements and Water-Soluble Ions in Submicrometre Aerosols in Brno and Šlapanice (Czech Republic). Atmosphere 2020, 11, 688. https://doi.org/10.3390/atmos11070688
Mikuška P, Vojtěšek M, Křůmal K, Mikušková-Čampulová M, Michálek J, Večeřa Z. Characterization and Source Identification of Elements and Water-Soluble Ions in Submicrometre Aerosols in Brno and Šlapanice (Czech Republic). Atmosphere. 2020; 11(7):688. https://doi.org/10.3390/atmos11070688
Chicago/Turabian StyleMikuška, Pavel, Martin Vojtěšek, Kamil Křůmal, Martina Mikušková-Čampulová, Jaroslav Michálek, and Zbyněk Večeřa. 2020. "Characterization and Source Identification of Elements and Water-Soluble Ions in Submicrometre Aerosols in Brno and Šlapanice (Czech Republic)" Atmosphere 11, no. 7: 688. https://doi.org/10.3390/atmos11070688
APA StyleMikuška, P., Vojtěšek, M., Křůmal, K., Mikušková-Čampulová, M., Michálek, J., & Večeřa, Z. (2020). Characterization and Source Identification of Elements and Water-Soluble Ions in Submicrometre Aerosols in Brno and Šlapanice (Czech Republic). Atmosphere, 11(7), 688. https://doi.org/10.3390/atmos11070688