Article

The Optical Properties of Aerosols at the Summit of Mount Tai in May and June and the Retrieval of the Complex Refractive Index

1
Collaborative Innovation Center on Forecast and Evaluation of Meteorological Disasters, Nanjing University of Information Science & Technology, Nanjing 210044, China
2
Key Laboratory for Aerosol-Cloud-Precipitation of China Meteorological Administration, School of Atmospheric Physics, Nanjing University of Information Science & Technology, Nanjing 210044, China
3
Tianjin Environmental Meteorological Center, Tianjin 300074, China
4
Tianjin Institute of Meteorology, Tianjin 300074, China
5
Plateau Atmosphere and Environment Key Laboratory of Sichuan Province, School of Atmospheric Sciences, Chengdu University of Information Technology, Chengdu 610225, China
*
Author to whom correspondence should be addressed.
Atmosphere 2020, 11(6), 655; https://doi.org/10.3390/atmos11060655
Submission received: 14 May 2020 / Revised: 16 June 2020 / Accepted: 16 June 2020 / Published: 19 June 2020
(This article belongs to the Section Aerosols)

Abstract

:
To study the optical properties of background atmospheric aerosols in East China, we carried out observations of the physical, chemical and optical properties of atmospheric aerosols at the summit of Mount Tai (Mt. Tai, 1533.7 m above sea level) from 13 May to 25 June 2017. The results show that the average scattering coefficient ( σ sca , 550 ) at 550 nm of the aerosols at the summit of Mt. Tai is 40.3 Mm−1, and the average absorption coefficient ( σ abs , 550 ) at 550 nm is 16.0 Mm−1. The complex refractive index of aerosols is a key parameter for aerosol retrieval and modeling. There are few studies on the equivalent complex refractive index of aerosol in the Taishan area. We calculated the aerosol equivalent complex refractive index using the observed aerosol scattering coefficients, absorption coefficients and particle size distribution data, providing more data support for future modeling in this region. The real part (n) of the complex refractive index at 550 nm of aerosol ranges from 1.31 to 1.98 (mostly under 1.50), with an average value of 1.38, while the imaginary part (k) ranges from 0.014 to 0.251 (less than 0.10 for over 95% samples), with an average value of 0.040. The analysis of the n and k of the aerosol average complex refractive index shows that the scattering properties of the aerosols at the summit of Mt. Tai are relatively weak and the absorption properties are relatively strong when compared with those of other kinds of aerosols. The k of the aerosol complex refractive index at the summit of Mt. Tai has strong correlations with the wind speed, temperature, as revealed by the correlation analysis.

1. Introduction

The optical properties (scattering coefficient, absorption coefficient, extinction coefficient, single scattering albedo and optical depth) of atmospheric aerosols are important parameters affecting atmospheric radiation. The Fifth Assessment Report of the Government Panel on Climate Change indicates that atmospheric aerosols can directly alter the distribution of global radiation by scattering and absorbing sunlight [1]. The optical properties of aerosols not only affect the direct climatic effects of aerosols, but also affect the environmental effects of aerosols, such as the formation of haze and visibility.
Due to the short retention time and diverse sources of aerosols in the atmosphere, their regional distribution, shape, scale and chemical composition are all affected by local emissions. Therefore, it is particularly important to strengthen the observation of local aerosols and understand the optical properties of local aerosols. Many studies have been carried out on the optical properties of local aerosols. The AERONET (Aerosol Robotic Network) [2] and the CARSNET (China Aerosol Remote Sensing Network) [3] provide support for long-term monitoring of the optical properties of aerosols. Yuan et al. [4] analyzed the optical properties of aerosols in the Mt. Huang area of China and studied the mixed state of aerosols according to the closed experiment designed by optical parameters. Tan et al. [5] analyzed the optical properties of aerosols in the Pearl River Delta region of China and the influence of hygroscopicity on the optical properties. Shen et al. [6] pointed out that the scattering coefficient and the absorption coefficient of aerosols in the Taishan area are much lower than those in key cities and polluted areas of China. Local observation and study of the optical properties of aerosols in a given region can expand the global aerosol database to provide reliable information and scientific support for the more accurate research of cloud precipitation, control of pollutants and assessment of aerosol radiative forcing.
The complex refractive index of aerosols is the basic physical quantity used to describe the optical properties of matter, and it is generally described as m = n + i · k, where n is the real part of the complex refractive index, describing the scattering characteristics of matter and k is the imaginary part of the complex refractive index, describing the absorption characteristics of matter [7]. The complex refractive index of aerosols is one of key parameters used to determine the properties of aerosol scattering and absorption. Further study of the complex refractive index of aerosols can improve the judgement of the physical and chemical properties of aerosols such as the aerosol mixing state or aerosol composition. In most climate models, the aerosol refractive index used in the parameterization scheme is relatively simple, which limits the reliability of climate model results [8]. Further study of the aerosol refractive index can provide the basis for the optimization of parametric schemes in climate models and reduce the uncertainty of atmospheric aerosol effects on weather and climate.
The complex refractive index of aerosols currently cannot be measured accurately and effectively due to the lack of proper instrumentation. It can only be inferred and retrieved from an absorbing cross section and a scattering cross section [9,10]. The FORTRAN codes for the Lorenz-Mie theory of Bohren and Huffman [11] are the basis for solving the problem of aerosol refractive index inversion. Mätzler et al. [12] described the theory of Mie scattering and Mie absorption via MATLAB scripts. Sumlin et al. [10] created a PyMieScatt third-party library in PYTHON on the basis of the scripts of Mätzler et al. [12], which can be used not only for forward modeling of aerosol optical properties but also for inversion of the complex refractive index of spherical particles, core–shell model particles and group particles with a given particle size distribution.
Generally, the principle of the inversion method of the complex refractive index is to assume a complex refractive index, then calculate the scattering coefficient and the absorption coefficient of aerosols by Mie scattering theory, then obtain the complex refractive index with the least difference between the theoretical scattering coefficient and absorption coefficient and observed scattering coefficient and absorption coefficient by statistical methods, and finally select it as the optimal inversion result of the aerosol complex refractive index. Although the Mie scattering calculation principle and the step selection to iteratively find the optimal solution can cause the error between the inversion result and the true value, the complex refractive index obtained by this principle can effectively characterize the main properties of the aerosols [13].
With the improvement in the accuracy of the equipment used to observe the optical, microphysical and chemical properties of aerosols, the method of inversion calculation of the complex refractive index of aerosols by radiation transmission theory has been widely used [14,15]. The imaginary parts of the complex refractive indices of the dust deposited in mountain snow are retrieved by means of scattering and reflection characteristics (Skiles et al. [16]). The refractive indices of five kinds of dust particles were retrieved in the study of Wagner et al. [17]. Sumlin et al.’s study notes that the inversion of the complex refractive index of a single particle may appear in multiple solutions, requiring additional optical parameters such as backscattering coefficients to qualify the inversion results. The inversion of the complex refractive index of group particles usually has a unique solution [10]. The inversion of the aerosol refractive index in Beijing [18], Xiamen [19], Xinjiang [20] and other Chinese regions shows that the real part of the complex refractive index of aerosols in these areas is between 1.30 and 1.55, while the imaginary part is less than 0.02. The study of the aerosol refractive index is limited by the number of observed data samples and accuracy of the instrumentation, which makes the law of the complex refractive index difficult to describe.
Studies show that the aerosol optical pollution in East China and North China is serious, and the number of days of haze is increasing gradually, which not only causes a decline in visibility that affects traffic and daily life but also harms human health [5,21]. Mt. Tai is located within the transport channel from the North China Plain (NCP) to the Yangtze River Delta (YRD). With an altitude of 1533.7 m, Mt. Tai is the highest mountain in central East China. The atmosphere at the summit of the mount is less affected by the surrounding surface pollution sources, and the peak height is near the upper layer of the atmospheric boundary layer and the free troposphere, which causes the aerosols here can represent the background atmospheric aerosols in East China. By studying the optical properties and changing characteristics of the atmospheric aerosols at Mt. Tai, we can reveal the background optical properties in East China and provide key parameters for evaluating the radiative forcing of aerosols. Many researchers have studied the physical and chemical properties of atmospheric aerosols in this area, but researches on the optical properties of aerosols or the complex refractive index of aerosols in this area are sparse. In this study, high-precision instruments were used to observe the optical parameters and the size distribution of aerosols for two months. According to the observed data, we not only studied the optical properties and the size distribution of the aerosols at the summit of Mt. Tai, but also calculated the equivalent complex refractive index of aerosols by inversion, making up for the lack of complex refractive index research in this area.

2. Analysis of the Optical Properties of Aerosol

2.1. Sources and Processing of Optical Data

The site of this observation experiment is at the Mount Tai National Base Climate Station (36.25° N, 117.10° E), with an altitude of 1533.7 m. The effective observation time was from 13 May to 25 June 2017. The instruments used in the experiment include an integrating nephelometer (Model 3563, TSI), an aethalometer (Model AE33), and a wide-range particle spectrometer (WPS). The sampling instruments are all dried at the air inlet. The influence of humidity is not considered in this study.
The integrating nephelometer (Model 3563, TSI) can continuously monitor the scattering coefficient ( σ sca , λ ) and the hemispherical backscattering coefficient of aerosols at three wavelengths (450 nm, 550 nm and 700 nm). The time resolution of the corresponding data is 60 s.
The Model AE33 aethalometer (Aethalometer 33, Magee) can measure the mass concentration of the absorbent aerosols in seven bands (370 nm, 470 nm, 520 nm, 590 nm, 660 nm, 880 nm and 950 nm) in real time. The basic principle of the instrument is that when a beam of light is irradiated to a filter membrane with an absorbent aerosol, the light through which the absorbent aerosol absorbs light is attenuated. The mass concentration of the absorbent aerosol measured during the sampling period is obtained by measuring the increment in the attenuation of light through the sampling filter membrane during two sampling weeks. The time resolution of the data is 60 s. The black carbon (BC) concentration observed by the aethalometer 33 at 880 nm wavelength was used to calculate the absorption coefficient of the aerosol. The measurement of mass concentration of the BC at this wavelength can effectively reduce the interference of light-absorbing organic carbon. The mass concentration of the BC aerosol measured by the aethalometer in 880 nm bands can be used to calculate the absorption coefficient of the aerosol to 550 nm wavelength light empirically (by Equations (1) and (2)).
σ abs , 532 = 8.28 · [ B C ] 880 + 2.23
where σ abs , 532 is the absorption coefficient at 532 nm, [ B C ] 880 is the mass concentration of absorbing aerosols at 880 nm measured by the aethalometer, and 8.28 is the conversion coefficient, which varies within a certain range affected by substance type [22]. The equation is obtained by fitting the measured data with the aethalometer which is based on filter membrane method and the photoacoustic spectrometer based on the photoacoustic method. The R2 of the fitting equation is 0.92.
σ abs , λ 1 = σ abs , λ 2 · λ 1 λ 2
where σ abs , λ 1 and σ abs , λ 2 are the absorption coefficients of aerosols to lights with a wavelength of λ 1 and λ 2 , respectively [23]. λ 1 and λ 2 are 550 nm and 532 nm, respectively.
All the data used in this study have been quality controlled, and unreasonable observational data have been eliminated, such as data that are negative, data whose difference between the sampling gas flow rate and the specified flow rate is more than 5%, and data reflecting instrumentation issues. The data used in the study are correct, stable and effective.

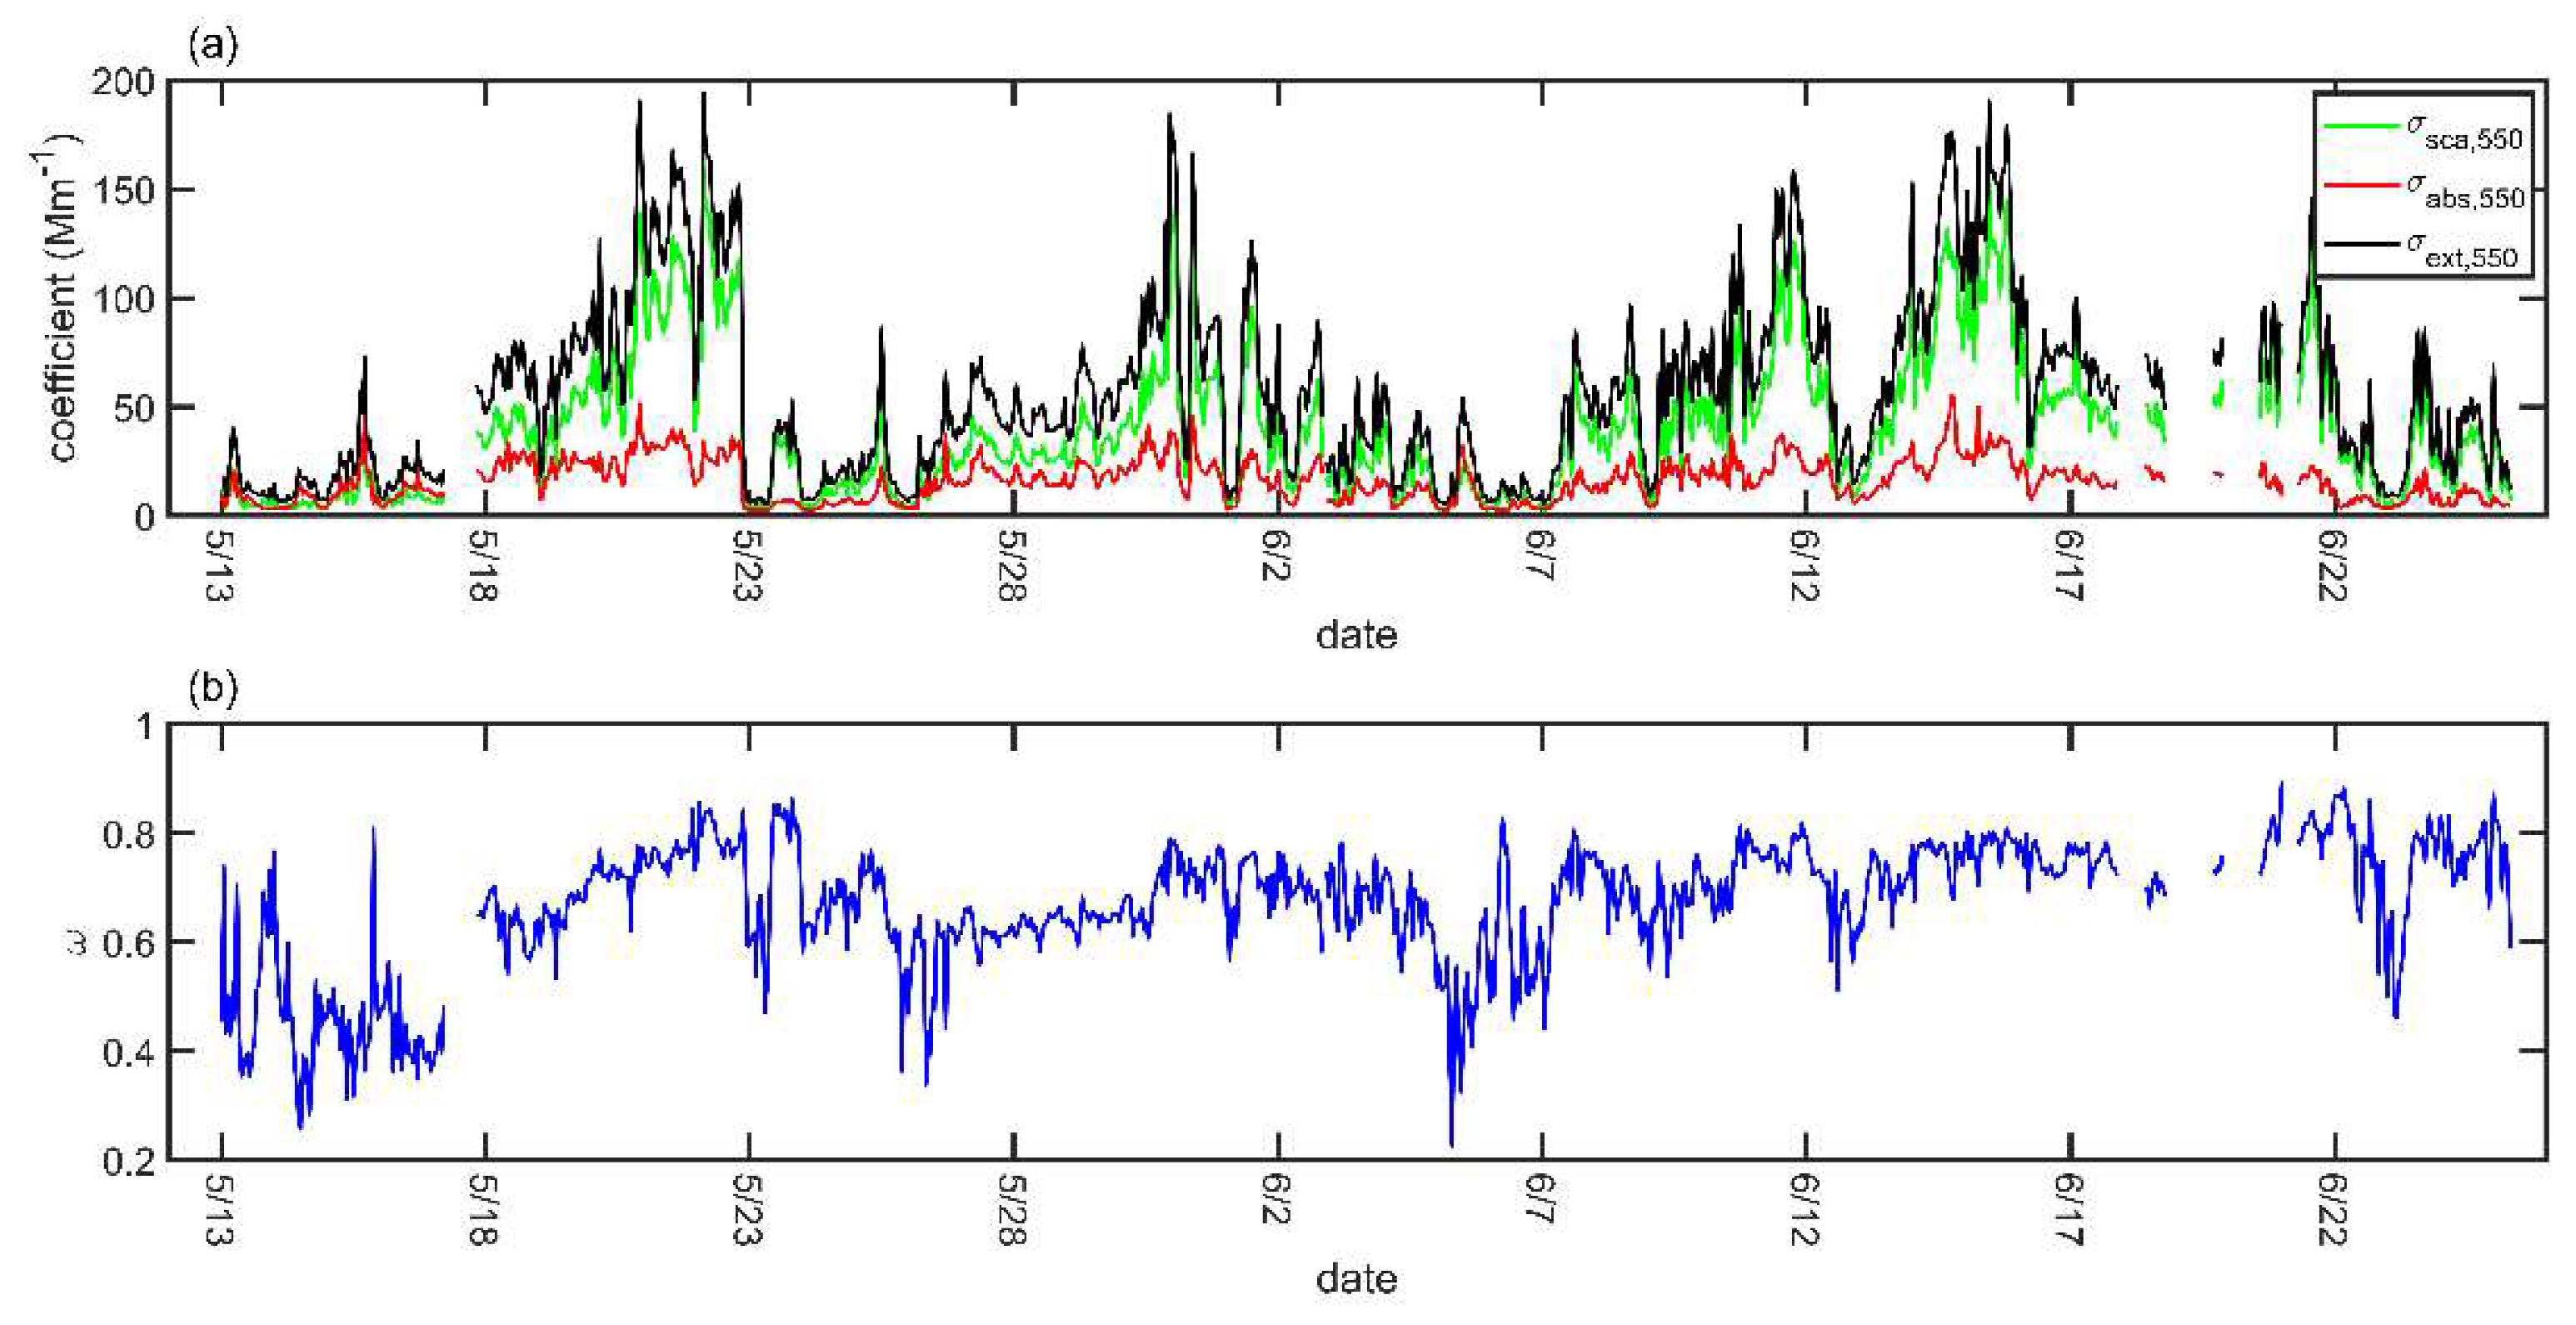
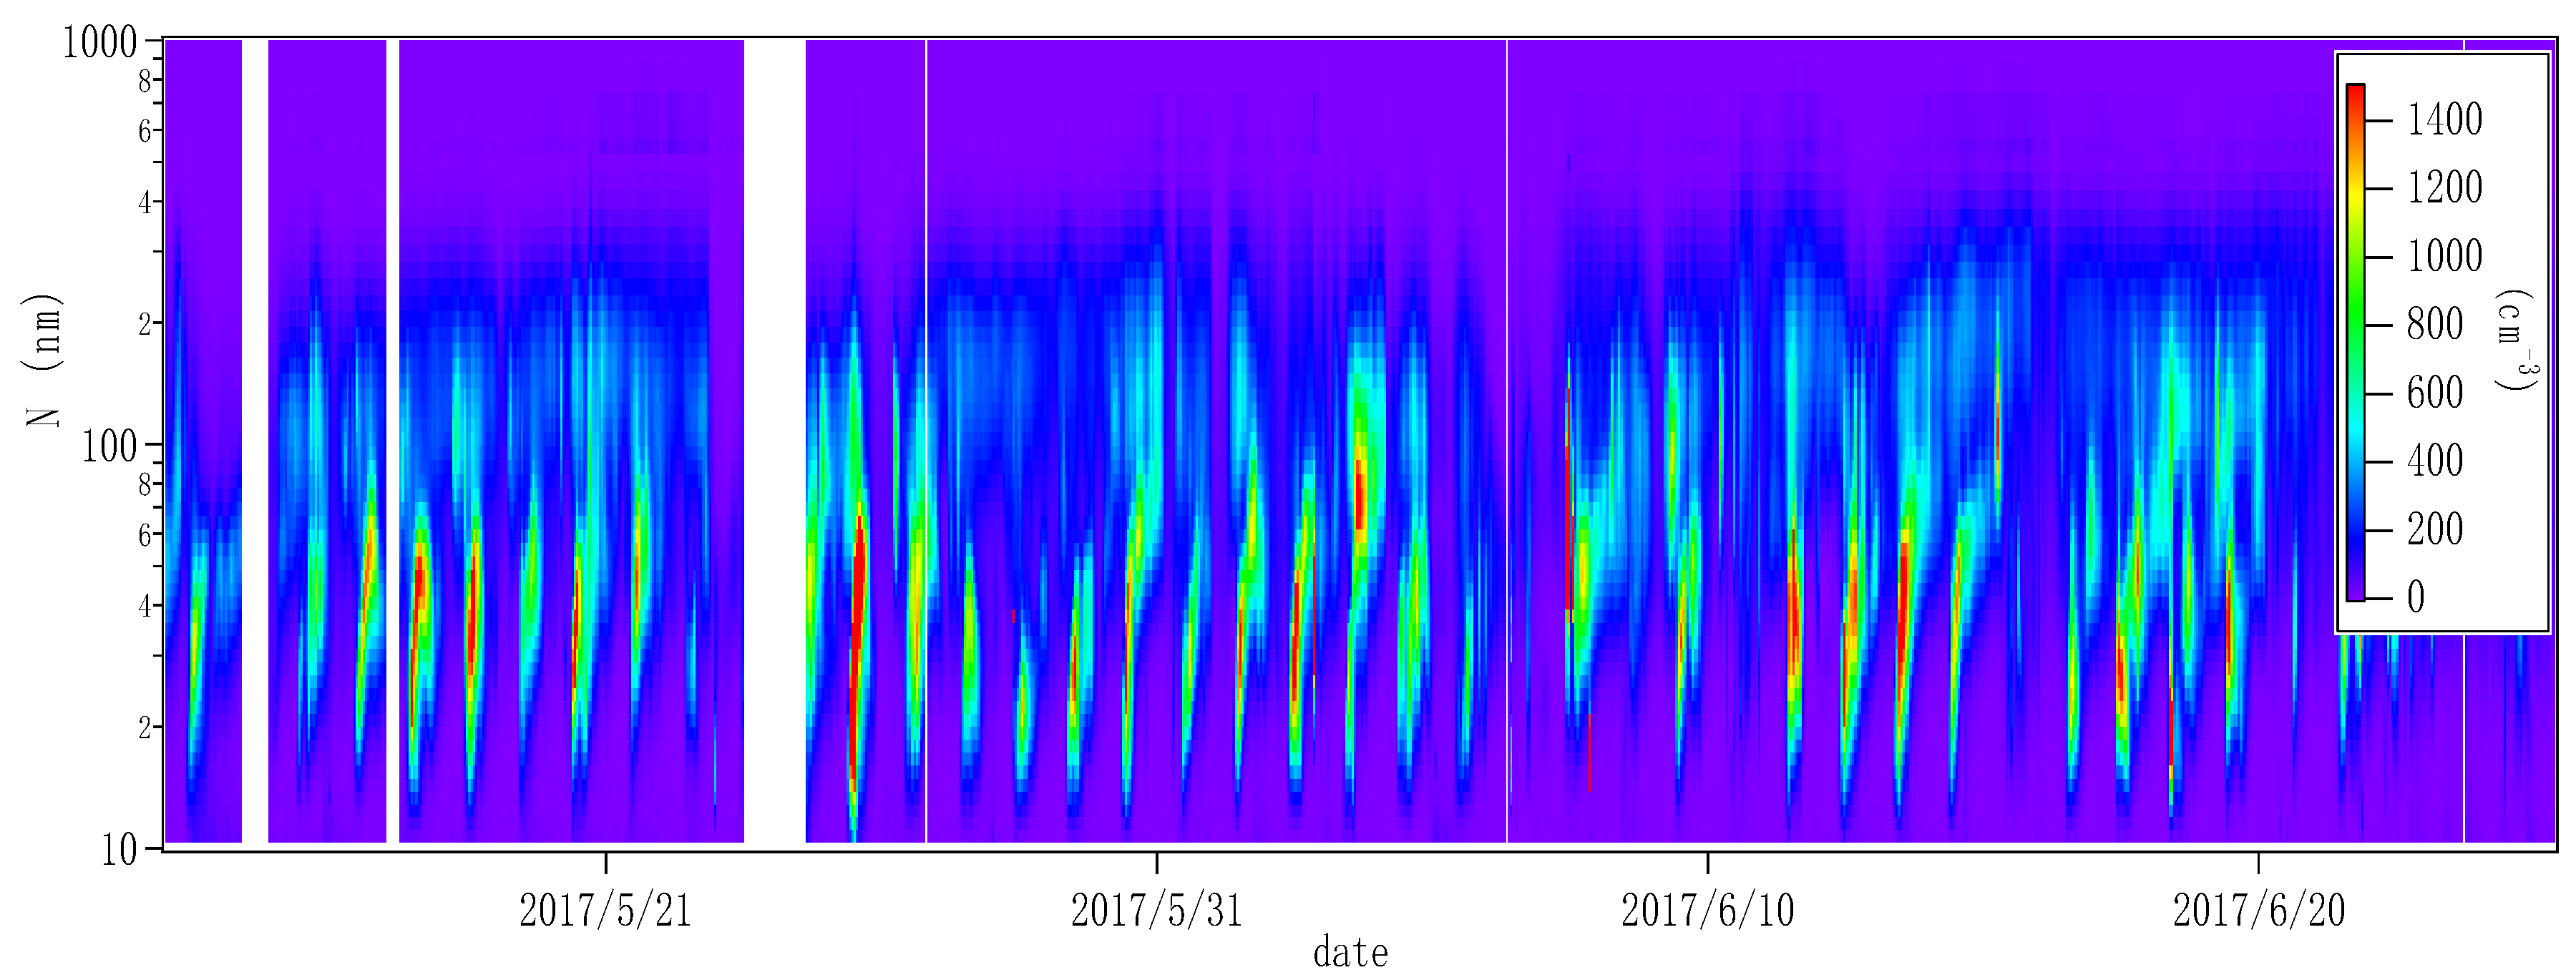
2.2. Results and Analysis of the Optical Properties of Aerosols

We take the data that have been quality controlled into the hourly average. The scattering coefficient and the absorption coefficient at 550 nm of the aerosols at the summit of Mt. Tai during the observation period are calculated. The extinction coefficient is the sum of the scattering coefficient and the absorption coefficient.
The single scattering albedo (ω550) of the aerosol can be calculated by Equation (3) according to the scattering coefficient and the absorption coefficient of the aerosol at 550 nm.
ω 550 = σ sca , 550 σ sca , 550 + σ abs , 550
where σ sca , 550 and σ abs , 550 are the scattering coefficient and the absorption coefficient at 550 nm of the aerosol, respectively [4].
Figure 1 shows that the σ sca , 550 ranges from 2.6 to 159.8 Mm−1, with an average of 40.3 Mm−1. The σ abs , 550 ranges from 2.7 to 55.1 Mm−1, with an average of 16.0 Mm−1. Among the existing studies shown in Table 1, the scattering coefficient range of aerosols is approximately 10–500 Mm−1, the absorption coefficient range is approximately 1–114 Mm−1, and the single scattering albedo range is approximately 0.6–0.9. The scattering coefficient of the aerosol in this study is close to the results observed at Mt. Huang [4] and Bondville [24], which is approximately 10% of the aerosol scattering coefficients of Beijing [25], Shanghai [26] and other urban areas. Meanwhile, the absorption coefficient in this study is close to the observation results of Shangdianzi [21] and Nanjing [27], which is approximately 25% of the absorption coefficients of Beijing, Shanghai and other urban areas.
Because of the obvious difference in solar radiation in different seasons, the properties of aerosols, such as optical properties, often show a clear pattern of variation in different seasons. It is pointed out that the scattering coefficient of aerosols at Mt. Tai is highest in summer and the lowest in spring, and the absorption coefficient is at the average level of one year in spring and summer [6]. The observation period was in late spring and early summer, which indicates the varied optical properties of aerosols.
A lower single-scattering albedo indicates stronger absorption characteristics of the aerosols. ω of urban atmospheric aerosols is generally 0.6–0.7, and ω of rural background atmospheric aerosols is generally 0.8–0.9 [35]. During the observation period, ω550 of aerosols at the summit of Mt. Tai ranges from 0.23 to 0.90, with the average value of 0.67, indicating that the absorption and scattering characteristics of the background atmospheric aerosols in this area are stronger than those in the surrounding areas. The single-scattering albedo of the aerosols at Mt. Tai during the observation period is close to that of Delhi and Granada, which is approximately 20% smaller than that in Beijing and Shanghai.
Figure 2 shows that the scattering coefficient and the absorption coefficient of aerosol have clear daily variations during the observation period. The σ sca , 550 and σ abs , 550 results show the trend of a higher value in the daytime and a lower value in the nighttime. Through the analysis of the daily variation of atmospheric aerosol concentration during observation, the mean mass concentration of PM2.5 in the daytime and nighttime are 23.23 µg m−3 and 19.84 µg m−3, respectively. The mean mass concentration of PM10 in the daytime and nighttime are 95.18 µg m−3 and 83.60 µg m−3, respectively. In addition, the total number concentrations of aerosols were 12055.4 cm−3 and 5476.7 cm−3, respectively. The concentration of aerosols is the most important factor affecting the optical properties of aerosols. With sunrise, the atmospheric convection activity becomes active and the height of planetary boundary layer (PBL) rises, and the concentration and composition of aerosols at the summit of Mt. Tai will change obviously, resulting in the change of optical properties. The study shows that the range of PBL of spring in the mount Tai area is 300~2200 m, and the range of PBL of summer is 300~2600 m, which all change around the height of the observation station [6]. The optical properties of mountaintop aerosols are affected by the variation in boundary layer height and various photochemical reactions. During the nighttime, the peak height is higher than the PBL height and located in the free troposphere. The atmospheric particles below the mountain cannot be transported up to the observation station. At the same time, the night wind speed of the summit of Mt. Tai is high and the diffusion conditions are good. All these reasons cause the low aerosol concentration in the nighttime and low scattering and absorption coefficients. With the increase in solar radiation, the boundary layer rises, and the height of the boundary layer reaches a peak around midday. With the development of the boundary layer, the pollutants are brought to the height of the mountain top, and the concentration of aerosols increases, resulting in an increase in the aerosol scattering coefficient and absorption coefficient of the mountaintop aerosols. At the same time, the photochemical reaction in the atmosphere becomes more active, and more secondary aerosols, such as sulfate, are produced, resulting in an increase in the scattering coefficient of the mountaintop aerosol. The distribution of σ sca , 550 shows a single peak with a maximum of 48.61 Mm−1 at 17:00 and a minimum of 30.99 Mm−1 at 03:00. A bimodal distribution of σ abs , 550 , with peaks at 12:00 and 18:00, reached a maximum of 20.82 Mm−1 at 18:00.

3. The Retrieval of the Complex Refractive Index

3.1. Inversion Method of the Complex Refractive Index

The aerosol refractive index inversion method used in this paper is based on the method of Zhang et al. [36]. The principle of the method is, first, to set the real part and the imaginary part are in certain ranges of groups of refractive indexes. The real part is 1.0–2.3, the interval is 0.01, there are 130 values; the imaginary part is 0–0.8, and the nonlinear change is divided into 50 values, which is set with a third power of the ordinal number of each bin as an independent variable. After that, 6500 sets of complex refraction indices and the size distribution data are substituted into the Mie theoretical program to calculate the corresponding scattering coefficient and absorption coefficient. Finally, the scattering and absorption coefficients observed at a certain time are compared with the values in the result database. The complex refractive index corresponding to the group data with the smallest difference in the result database is the equivalent complex refractive index inversion result of all the aerosols at that time. There are some assumptions that are made when using this method (assuming that all the aerosol particles are spherical and that the scattering coefficient and absorption coefficient measured by the instrument are produced by the detected aerosol particles). Aerosol optical properties will be affected by the shape of particles, so shape factors will affect the inversion calculation of the complex refractive index [37,38]. During the aging process, the aerosols tend to be more spherical and compact. Although there are some differences between other aerosol models (like DDA, RDG and T-matrix) and Mie model, Mie model can accurately calculate the general properties of aerosol particles, especially for the properties of an ensemble of aged particles in the atmosphere [39,40]. Previous studies found that for atmospheric aerosols, the ranges of n and k are 1.3–2.0 and 10−9–1.0, respectively [41]. The range set in this paper can cover the range of the equivalent refractive index of aerosols. In this inversion study, the scattering coefficient, absorption coefficient, and the size distribution data used are all taken as the hourly average of the data during the observation period. Only the complex refractive index of aerosols to light with a wavelength of 550 nm was studied.

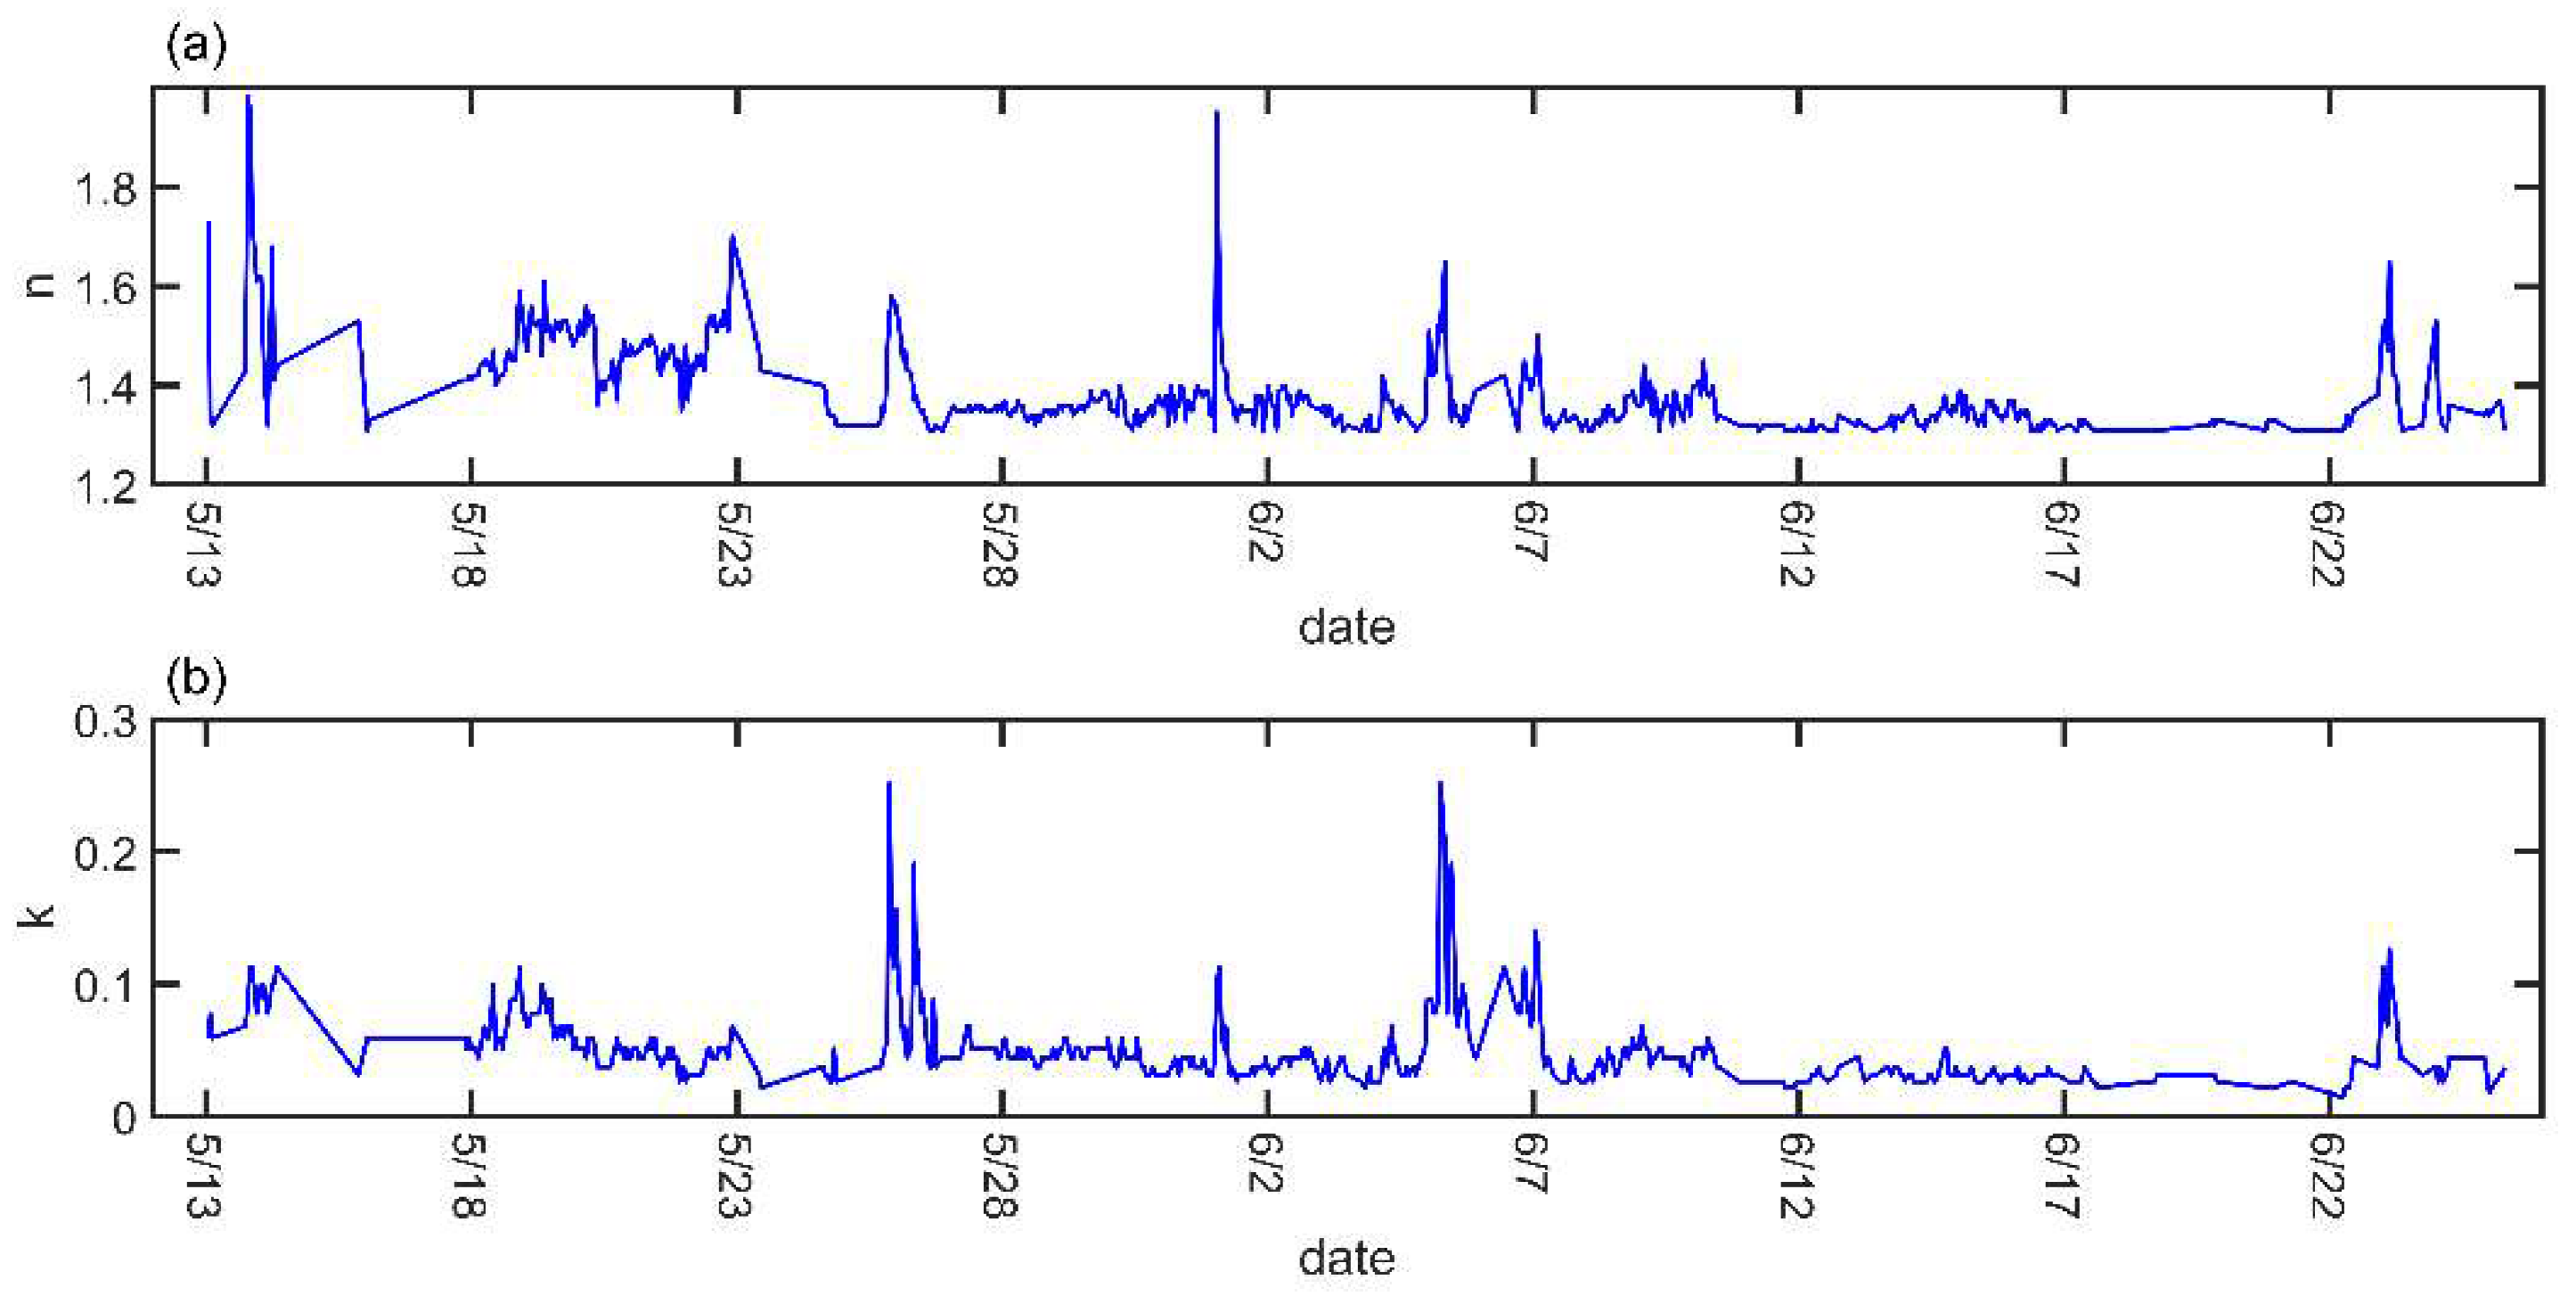
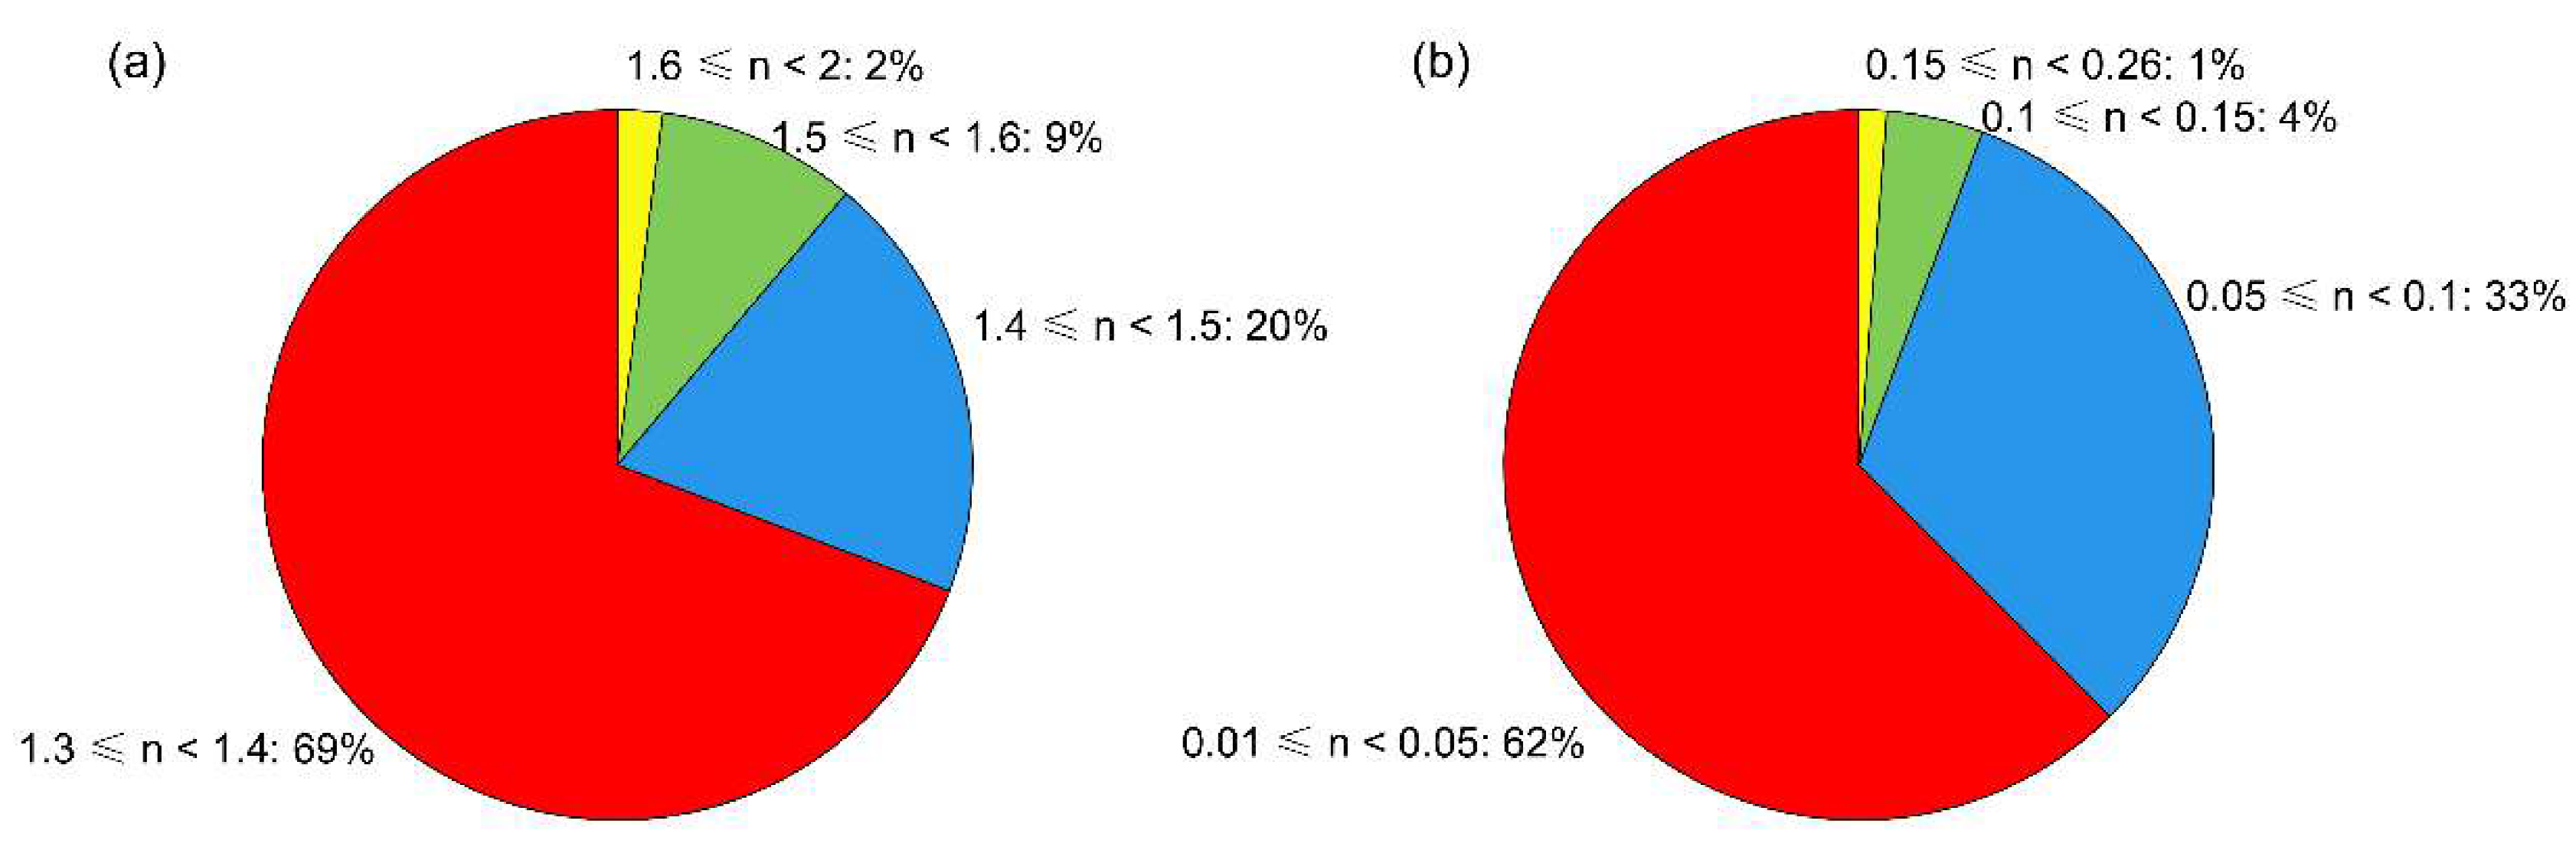
3.2. Inversion Results and Analysis of the Complex Refractive Index

Figure 3 shows the variation of aerosol number concentration size distribution from 13 May to 25 June 2017. During the observation period, the aerosol at the summit of Mt. Tai was mainly distributed in the Aitken mode. Aerosol number concentrations of particles whose sizes above 400 nm are few. The number concentration size distribution of aerosol is the basic data for calculation of complex refractive index inversion.
From Figure 4, we can see that the real range of the equivalent refractive index of mountaintop aerosols at a wavelength of 550 nm is 1.31–1.98, and the average value is 1.38. The range of the imaginary part is 0.014–0.251, and the average value is 0.049. Figure 5 shows that the real part of the aerosol refractive index is mainly concentrated in the range of 1.30–1.50, the frequency reaches 89%; the imaginary part is mainly concentrated in the range of 0.01–0.1, and the frequency reaches 95%. The results show that the real and imaginary parts of the equivalent complex refractive index of aerosols at the summit of Mt. Tai are kept at similar levels. The results can better reflect the general values of the equivalent complex refractive index of mountaintop aerosols.
The complex refractive index of aerosols from several studies is summarized in Table 2. The larger the real part is, the stronger the scattering ability of the particles is; the larger the imaginary part is, the stronger the absorption ability of the particles is [46]. The n of the average equivalent refractive index of aerosols in this study is smaller than that of light scattering aerosols (such as sulfate and nitrate), which shows that the scattering properties of the aerosols at the summit of Mt. Tai are relatively weak compared with those of other kinds of aerosols. The k in this study is larger than that of most kinds of aerosols, even larger than that of dust, but much smaller than that of black carbon, which shows that the absorption properties are relatively strong compared with those of other kinds of aerosols. The k of the equivalent refractive index of aerosol at the summit of Mt. Tai is large, which indicates that the absorption aerosol composition (like BC or OC) is large. The incineration of incense and the burning of incinerators in temples which are to the west of the observation station might be one of reasons for this phenomenon.

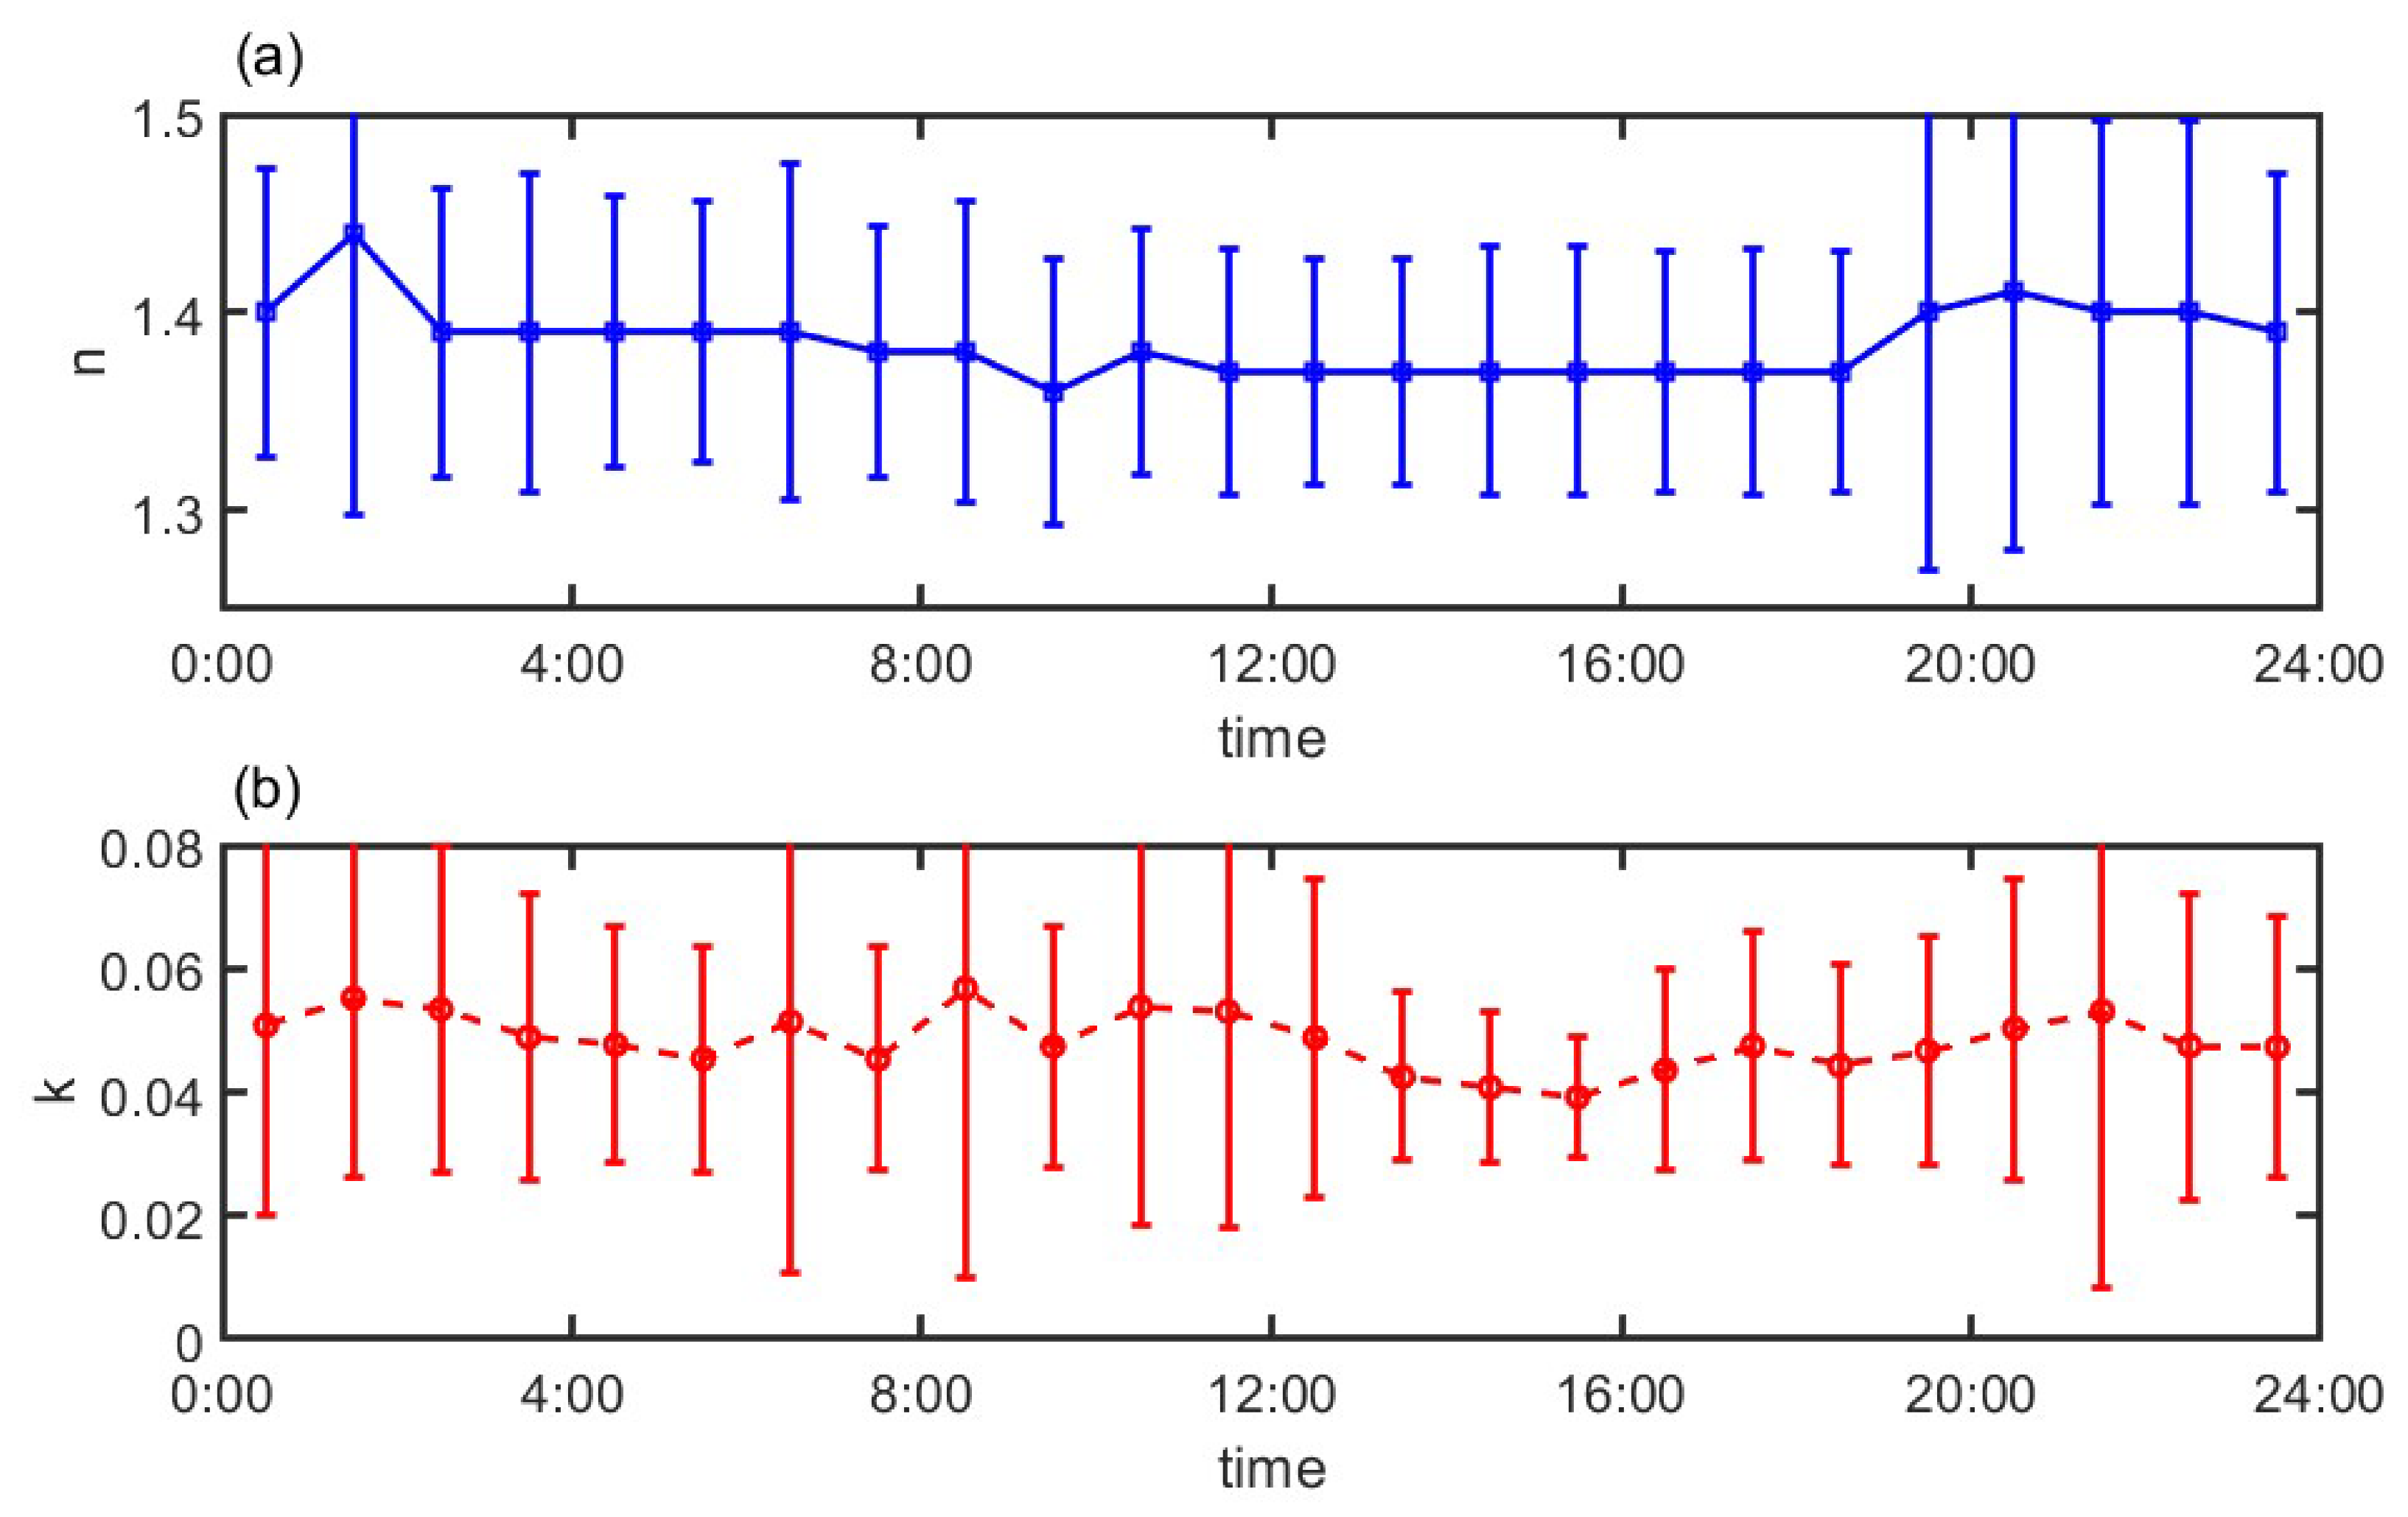
3.3. Diurnal Variation in the Complex Refractive Index

The real and imaginary parts of the retrieved complex refractive index are averaged by time, and the diurnal variation distribution of the atmospheric aerosol refractive index in the Taishan area during the observation period is obtained. From Figure 6, we can see that the real part of the complex refractive index has an obvious diurnal variation law, which is lower during the day and higher at night, and the two peaks appear at 01:00 and 21:00, respectively. The real part is highest (1.44) at 01:00 and is lowest (1.36) at 10:00. The imaginary part of the complex refractive index has no obvious diurnal variation law, and there are multiple peaks. The lowest value of the imaginary part appears at 16:00, which is 0.039. The diurnal variation of the aerosol refractive index is influenced by many complicated factors. This paper discusses the influence of meteorological elements on the variation law of the refractive index below.

3.4. Correlation Analysis between the Complex Refractive Index and Meteorological Elements

The equivalent refractive index of aerosol particles at the summit of Mt. Tai at a single wavelength (550 nm) is causally related to the composition, shape and size of the aerosol particles. Because the observed objects are small and the sample size is large, it is difficult to study the relationship between these physical quantities and the complex refractive index by real-time observation of the composition, shape and size of the aerosols. At the macroscale, aerosol particles come from different sources, such as anthropogenic sources of emissions including chemical fuel combustion and motor vehicle exhaust and other natural sources including dust and plant pollen. Due to the mobility and openness of the atmospheric system, there is a strong correlation between the source of aerosol particles and meteorological elements such as wind speed, temperature and relative humidity of the atmosphere. To understand the correlation between the aerosol refractive index and meteorological elements in the Taishan area, this study analyzed the correlation between the real and imaginary parts of the inverted hourly aerosol refractive index and the wind speed, temperature, air pressure and relative humidity. The correlation coefficients obtained are shown in Table 3.
Table 3 shows the correlation between n and k of the retrieved aerosol refractive index and meteorological elements. Through correlation analysis, it is found that the correlation coefficient between n and k of the aerosol refractive index and the wind speed and the temperature exceed the critical correlation coefficient at the significance levels of 0.01, which shows that the correlations between the real and imaginary part of the aerosol refractive index and these meteorological elements are statistically significant. The correlations between the aerosol refractive index and air pressure and relative humidity are not significant. The scattering coefficient increases with the increase of n and the absorption coefficient increases with the increase of k [47,48]. Most of the pollutants in the observation station are transported outside the scenic area, during this observation period [49,50]. When the average wind speed is large, a large number of aerosols which are produced by iron and steel plants and chemical plants in the range of 50 km around are transported to the observation station, which results in a large change in the aerosol composition of the observation point, and the increase of n and k in the inversion results. There is a strong negative correlation between n of the aerosol refractive index and temperature. During the daytime, the temperature increases, and the real part of the refractive index decreases. The correlation between these two metrics can explain, to some extent, the phenomenon that the real part of the complex refractive index in the curve of Figure 6a has a diurnal variation that is lower during the day and higher at night. The change in the imaginary part does not show such a clear regularity in Figure 6b, which may be due to the combined action of many meteorological elements, such as temperature and RH. During this observation period, the frequency of northerly wind is higher. The northeast direction of the observation station is the mountain behind the scenic spot, the artificial activity is rare, and the aerosol number concentration level is low, meanwhile, the relative humidity is high. When the relative humidity increases, the atmosphere of the station is relatively clean, and the real and imaginary parts of the aerosol decrease.

4. Conclusions

During the observation period from 13 May to 25 June 2017, σ sca , 550 of the atmospheric aerosols at the summit of Mt. Tai ranges from 2.6 to 159.8 Mm−1, with an average of 40.3 Mm−1. σ abs , 550 ranges from 2.7 to 55.1 Mm−1, with an average of 16.0 Mm−1. The scattering coefficient and absorption coefficient of aerosols exhibit obvious diurnal variation characteristics and the two parameters both show higher values in the daytime and lower values in the nighttime. The optical properties of mountaintop aerosols are affected by the variation in boundary layer height and various photochemical reactions. σ sca , 550 reached a maximum of 48.61 Mm−1 at 17:00 and a minimum of 30.99 Mm−1 at 03:00. σ abs , 550 reached a maximum of 20.82 Mm−1 at 18:00.
The real part of the complex refractive index of aerosols at the summit of Mt. Tai summit at 550 nm ranges from 1.31 to 1.98, and the average value is 1.38. The imaginary part ranges from 0.014 to 0.251, and the average value is 0.049. The real part of the aerosol refractive index is mainly in the range of 1.30–1.50 with a frequency of 89%, while the imaginary part is mainly in the range of 0.01–0.1 with a frequency of 95%. The n and k are highly concentrated and exhibit small ranges of variation, indicating that the inversion calculation results can accurately describe the general situation of aerosols in the Mt. Tai area. The comparison of n and k between aerosols of this study and other types of aerosols shows that the scattering properties of aerosols at the summit of Mt. Tai are relatively weak and the absorption properties are relatively strong when compared with those of other kinds of aerosols. From the correlation analysis between the aerosol equivalent refractive index and the meteorological elements during the observation period, we can see that the imaginary part of the aerosol refractive index has strong correlations with the wind speed, temperature.
The data of the integrating nephelometer and aethalometer used in this paper have the advantage of a high time resolution. The absorption data of aerosols at seven wavelengths can be measured by the aethalometer, and the improved double-spot compensation algorithm enables the instrument to obtain the optical absorption parameters of aerosols more accurately. More accurate data can better reveal the optical properties of the aerosols at the summit of Mt. Tai. The deficiency of this study is that the observation data are collected fewer times, and the small number of samples causes the data to exhibit random patterns. The Mie theory with the assumption of spherical particle will also produce some uncertainty in the inversion algorithm of complex refractive index. Some accidental factors, such as extreme weather phenomena and the increase of passenger flow, will also affect the credibility of our aerosol refractive index inversion results representing the general properties of this region. Whether the results of aerosol equivalent refractive index inversion can be effectively applied to relevant climate models is a problem that needs to be verified in future research.

Author Contributions

Conceptualization, D.Z.; Methodology, D.Z., Y.Y., M.Z. and H.W.; Visualization, D.Z., Y.Y., M.Z., H.W., L.Y. and S.S.; Investigation, D.Z., C.L., L.Y. and S.S.; Writing—Original Draft Preparation, D.Z., Y.Y. and H.W.; and Writing—Review and Editing, D.Z., Y.Y., H.W. and C.L. All authors have read and agreed to the published version of the manuscript.

Funding

This research was funded by the National Natural Science Foundation of China under grant no. 41590873.

Acknowledgments

The first author are grateful for the help of the other authors and the resources provided by the Nanjing University of Information Science & Technology. The first author would like to thank Yanan Wu for her support.

Conflicts of Interest

The authors declare no conflict of interest.

References

  1. IPCC. Climate Change 2013: The Physical Science Basis. Working Group I Contribution to the Fifth Assessment Report of the Intergovernmental Panel on Climate Change; Stocker, T.F., Qin, D., Plattner, G.-K., Tignor, M., Allen, S.K., Boschung, J., Nauels, A., Xia, Y., Bex, V., Midgley, P.M., Eds.; Cambridge University Press: Cambridge, UK; New York, NY, USA, 2013; p. 1535. [Google Scholar]
  2. Holben, B.N.; Eck, T.F.; Slutsker, I.; Tanre, D.; Buis, J.P.; Setzer, A.; Vermote, E.; Reagan, J.A.; Kaufman, Y.; Nakajima, T. AERONET—A federated instrument network and data archive for aerosol characterization. J. Remote Sens. Environ. 1998, 66, 1–16. [Google Scholar] [CrossRef]
  3. Che, H.; Zhang, X.; Chen, H.; Damiri, B.; Goloub, P.; Li, Z.; Zhang, X.; Wei, Y.; Zhou, H.; Dong, F. Instrument calibration and aerosol optical depth validation of the China Aerosol Remote Sensing Network. J. Geophys. Res. Atmos. 2009, D3, 114. [Google Scholar] [CrossRef]
  4. Yuan, L.; Yin, Y.; Xiao, H.; Yu, X.; Hao, J.; Chen, K.; Liu, C. A closure study of aerosol optical properties at a regional background mountainous site in Eastern China. J. Sci. Total Environ. 2016, 550, 950–960. [Google Scholar] [CrossRef] [Green Version]
  5. Tan, H.; Liu, L.; Fan, S.; Li, F.; Yin, Y.; Cai, M.; Chan, P.W. Aerosol optical properties and mixing state of black carbon in the Pearl River Delta, China. J. Atmos. Environ. 2016, 131, 196–208. [Google Scholar] [CrossRef]
  6. Shen, X.; Sun, J.; Zhang, Y.; Wehner, B.; Nowak, A.; Tuch, T.; Zhang, X.; Wang, T.; Zhou, H.; Zhang, X. First long-term study of particle number size distributions and new particle formation events of regional aerosol in the North China Plain. J. Atmos. Chem. Phys. 2011, 11, 1565–1580. [Google Scholar] [CrossRef] [Green Version]
  7. Seinfeld, J.H.; Pandis, S.N. Atmospheric Chemistry and Physics: From Air Pollution to Climate Change, 3rd ed.; Wiley: Hoboken, NJ, USA, 2016. [Google Scholar]
  8. Liao, H.; Seinfeld, J. Radiative forcing by mineral dust aerosols: Sensitivity to key variables. J. Geophys. Res. Atmos. 1998, 103, 31637–31645. [Google Scholar] [CrossRef]
  9. Chazette, P.; Liousse, C. A case study of optical and chemical ground apportionment for urban aerosols in Thessaloniki. J. Atmos. Environ. 2001, 35, 2497–2506. [Google Scholar] [CrossRef]
  10. Sumlin, B.J.; Heinson, W.R.; Chakrabarty, R.K. Retrieving the aerosol complex refractive index using PyMieScatt: A Mie computational package with visualization capabilities. J. Quant. Spectrosc. Radiat. Transf. 2018, 205, 127–134. [Google Scholar] [CrossRef] [Green Version]
  11. Bohren, C.F.; Huffman, D.R. Absorption and Scattering of Light by Small Particles; Wiley: Hoboken, NJ, USA, 2008. [Google Scholar]
  12. Mätzler, C. MATLAB functions for Mie scattering and absorption, version 2. J. IAP Res. Rep. 2002, 8, 9. [Google Scholar]
  13. Kolgotin, A.; Müller, D.; Chemyakin, E.; Romanov, A. Perspectives of the explicit retrieval of the complex refractive index of aerosols from optical data taken with lidar. In EPJ Web of Conferences; EDP Sciences: Les Ulis, France, 2016; Volume 119, p. 17016. [Google Scholar] [CrossRef] [Green Version]
  14. Spindler, C.; Riziq, A.A.; Rudich, Y. Retrieval of aerosol complex refractive index by combining cavity ring down aerosol spectrometer measurements with full size distribution information. J. Aerosol. Sci. Technol. 2007, 41, 1011–1017. [Google Scholar] [CrossRef] [Green Version]
  15. Reed, B.E.; Peters, D.M.; McPheat, R.; Grainger, R. The complex refractive index of volcanic ash aerosol retrieved from spectral mass extinction. J. Geophys. Res. Atmos. 2018, 123, 1339–1350. [Google Scholar] [CrossRef] [Green Version]
  16. Skiles, M.; Painter, T.; Okin, G. A Method to Retrieve the Complex Refractive Index and Single Scattering Optical Properties of Dust Deposited in Mountain Snow Cover. J. Glaciol. 2017, 63, 133–147. [Google Scholar] [CrossRef] [Green Version]
  17. Wagner, R.; Ajtai, T.; Kandler, K.; Lieke, K.; Linke, C.; Müller, T.; Schnaiter, M.; Vragel, M. Complex refractive indices of Saharan dust samples at visible and near UV wavelengths: A laboratory study. J. Atmos. Chem. Phys. 2012, 12, 2491–2512. [Google Scholar] [CrossRef] [Green Version]
  18. Rui, L.; Xing-Na, Y.U.; Shen, L.; Chao, Y.U.; Zhu, J.; Xia, H. Aerosol optical properties in spring over urban Beijing. J. China Environ. Sci. 2016, 36, 1660–1668. [Google Scholar]
  19. Li, X.B.; Huang, Y.B.; Xu, C.D.; Wei, H.L.; Hu, H.L. Measurement of refractive index for aerosol particle in Xiamen. J. Opt. Precis. Eng. 2008, 16, 1831–1835. [Google Scholar]
  20. Geng, M.; Li, X.; Qin, W.; Liu, Z.; Lu, X.; Dai, C.; Miao, X.; Weng, N. Research on the characteristics of aerosol size distribution and complex refractive index in typical areas of China. J. Infrared Laser Eng. 2018, 47, 311001. [Google Scholar] [CrossRef]
  21. Yan, P.; Tang, J.; Huang, J.; Mao, J.; Zhou, X.; Liu, Q.; Wang, Z.; Zhou, H. The measurement of aerosol optical properties at a rural site in Northern China. J. Atmos. Chem. Phys. 2008, 8, 2229–2242. [Google Scholar] [CrossRef] [Green Version]
  22. Wu, D.; Mao, J.; Deng, X.; Tie, X.; Zhang, Y.; Zeng, L.; Li, F.; Tan, H.; Bi, X.; Huang, X. Black carbon aerosols and their radiative properties in the Pearl River Delta region. J. Sci. China Ser. D Earth Sci. 2009, 52, 1152–1163. [Google Scholar] [CrossRef]
  23. Nessler, R.; Weingartner, E.; Baltensperger, U. Adaptation of dry nephelometer measurements to ambient conditions at the Jungfraujoch. J. Environ. Sci. Technol. 2005, 39, 2219–2228. [Google Scholar] [CrossRef]
  24. Delene, D.J.; Ogren, J.A. Variability of aerosol optical properties at four North American surface monitoring sites. J. Atmos. Sci. 2002, 59, 1135–1150. [Google Scholar] [CrossRef]
  25. Jing, J.; Wu, Y.; Tao, J.; Che, H.; Xia, X.; Zhang, X.; Yan, P.; Zhao, D.; Zhang, L. Observation and analysis of near-surface atmospheric aerosol optical properties in urban Beijing. J. Particuol. 2015, 18, 144–154. [Google Scholar] [CrossRef]
  26. Xu, J.; Tao, J.; Zhang, R.; Cheng, T.; Leng, C.; Chen, J.; Huang, G.; Li, X.; Zhu, Z. Measurements of surface aerosol optical properties in winter of Shanghai. J. Atmos. Res. 2012, 109, 25–35. [Google Scholar] [CrossRef]
  27. Yu, X.; Ma, J.; Kumar, K.R.; Zhu, B.; An, J.; He, J.; Li, M. Measurement and analysis of surface aerosol optical properties over urban Nanjing in the Chinese Yangtze River Delta. J. Sci. Total Environ. 2016, 542, 277–291. [Google Scholar] [CrossRef]
  28. Nakayama, T.; Hagino, R.; Matsumi, Y.; Sakamoto, Y.; Kawasaki, M.; Yamazaki, A.; Uchiyama, A.; Kudo, R.; Moteki, N.; Kondo, Y. Measurements of aerosol optical properties in central Tokyo during summertime using cavity ring-down spectroscopy: Comparison with conventional techniques. J. Atmos. Environ. 2010, 44, 3034–3042. [Google Scholar] [CrossRef]
  29. Soni, K.; Singh, S.; Bano, T.; Tanwar, R.; Nath, S.; Arya, B. Variations in single scattering albedo and Angstrom absorption exponent during different seasons at Delhi, India. J. Atmos. Environ. 2010, 44, 4355–4363. [Google Scholar] [CrossRef]
  30. Garland, R.; Schmid, O.; Nowak, A.; Achtert, P.; Wiedensohler, A.; Gunthe, S.; Takegawa, N.; Kita, K.; Kondo, Y.; Hu, M. Aerosol optical properties observed during Campaign of Air Quality Research in Beijing 2006 (CAREBeijing-2006): Characteristic differences between the inflow and outflow of Beijing city air. J. Geophys. Res. Atmos. 2009, 114, D00G04. [Google Scholar] [CrossRef]
  31. Lyamani, H.; Olmo, F.; Alados-Arboledas, L. Light scattering and absorption properties of aerosol particles in the urban environment of Granada, Spain. Atmos. Environ. 2008, 42, 2630–2642. [Google Scholar] [CrossRef]
  32. Kim, K.W.; He, Z.; Kim, Y.J. Physicochemical characteristics and radiative properties of Asian dust particles observed at Kwangju, Korea, during the 2001 ACE-Asia intensive observation period. J. Geophys. Res. Atmos. 2004, 109, D19S02. [Google Scholar] [CrossRef]
  33. Bergin, M.; Cass, G.; Xu, J.; Fang, C.; Zeng, L.; Yu, T.; Salmon, L.; Kiang, C.; Tang, X.; Zhang, Y. Aerosol radiative, physical, and chemical properties in Beijing during June 1999. J. Geophys. Res. Atmos. 2001, 106, 17969–17980. [Google Scholar] [CrossRef] [Green Version]
  34. Anderson, T.; Covert, D.; Wheeler, J.; Harris, J.; Perry, K.; Trost, B.; Jaffe, D.; Ogren, J. Aerosol backscatter fraction and single scattering albedo: Measured values and uncertainties at a coastal station in the Pacific Northwest. J. Geophys. Res. Atmos. 1999, 104, 26793–26807. [Google Scholar] [CrossRef]
  35. Ackerman, T.P.; Toon, O.B. Absorption of visible radiation in atmosphere containing mixtures of absorbing and nonabsorbing particles. J. Appl. Opt. 1981, 20, 3661–3668. [Google Scholar] [CrossRef] [PubMed]
  36. Zhang, M.; Cui, Z.L.; Han, S.Q.; Cai, Z.Y.; Yao, Q. The Retrieval of Aerosol Complex Refractive Index and the Contribution Rate Analyses of Extinction Coefficient in Urban Tianjin City. J. Res. Environ. Sci. 2019, 32, 1483–1491. [Google Scholar]
  37. He, C.; Liou, K.N.; Takano, Y.; Zhang, R.; Zamora, M.L.; Yang, P.; Leung, L.R. Variation of the radiative properties during black carbon aging: Theoretical and experimental intercomparison. J. Atmos. Chem. Phys. 2015, 15, 11967–11980. [Google Scholar] [CrossRef] [Green Version]
  38. China, S.; Scarnato, B.; Owen, R.C.; Zhang, B.; Ampadu, M.T.; Kumar, S.; Dzepina, K.; Dziobak, M.P.; Fialho, P.; Perlinger, J.A. Morphology and mixing state of aged soot particles at a remote marine free troposphere site: Implications for optical properties. J. Geophys. Res. Lett. 2015, 42, 1243–1250. [Google Scholar] [CrossRef]
  39. Sarpong, E.; Smith, D.; Pokhrel, R.; Fiddler, M.N.; Bililign, S. Refractive indices of biomass burning aerosols obtained from African biomass fuels using rdg approximation. J. Atmos. 2020, 11, 62. [Google Scholar] [CrossRef] [Green Version]
  40. Poudel, S.; Fiddler, M.N.; Smith, D.; Flurchick, K.M.; Bililign, S. Optical properties of biomass burning aerosols: Comparison of experimental measurements and T-matrix calculations. J. Atmos. 2017, 8, 228. [Google Scholar] [CrossRef] [Green Version]
  41. Sumlin, B.J.; Pandey, A.; Walker, M.J.; Pattison, R.S.; Williams, B.J.; Chakrabarty, R.K. Atmospheric Photooxidation Diminishes Light Absorption by Primary Brown Carbon Aerosol from Biomass Burning. J. Environ. Sci. Technol. Lett. 2017, 4, 540–545. [Google Scholar] [CrossRef]
  42. Raut, J.C.; Chazette, P. Vertical profiles of urban aerosol complex refractive index in the frame of ESQUIF airborne measurements. J. Atmos. Chem. Phys. 2008, 8, 901–919. [Google Scholar] [CrossRef] [Green Version]
  43. Ebert, M.; Weinbruch, S.; Hoffmann, P.; Ortner, H.M. The chemical composition and complex refractive index of rural and urban influenced aerosols determined by individual particle analysis. J. Atmos. Environ. 2004, 38, 6531–6545. [Google Scholar] [CrossRef]
  44. Hand, J.L.; Kreidenweis, S.M. A new method for retrieving particle refractive index and effective density from aerosol size distribution data. J. Aerosol Sci. Technol. 2002, 36, 1012–1026. [Google Scholar] [CrossRef]
  45. Szymanski, W.W.; Nagy, A.; Czitrovszky, A.; Jani, P. A new method for the simultaneous measurement of aerosol particle size, complex refractive index and particle density. J. Meas. Sci. Technol. 2002, 13, 303. [Google Scholar] [CrossRef]
  46. Liu, C.; Xu, X.; Yin, Y.; Schnaiter, M.; Yung, Y.L. Black carbon aggregates: An optical property database. J. Quant. Spectrosc. Radiat. Transfer. 2019, 222–223, 170–179. [Google Scholar] [CrossRef]
  47. Zhao, D.; Yin, Y.; Liu, C.; Lu, C.; Xu, X. Can the aerosol absorption Ångström exponent represent aerosol color in the atmosphere: A numerical study. J. Atmos. 2020, 11, 187. [Google Scholar] [CrossRef] [Green Version]
  48. Teng, S.; Liu, C.; Schnaiter, M.; Chakrabarty, R.K.; Liu, F. Accounting for the effects of nonideal minor structures on the optical properties of black carbon aerosol. J. Atmos. Chem. Phys. 2019, 19, 2917–2931. [Google Scholar] [CrossRef] [Green Version]
  49. Shen, L.; Wang, H.; Yin, Y.; Chen, K.; Chen, J.; Shi, S. Size Distributions of Aerosol During the Summer at the Summit of Mountain Taishan (1534 m) in Central East China. J. Huanjing Kexue 2019, 40, 2019–2026. [Google Scholar]
  50. Cui, Y.; Yin, Y.; Chen, K.; Zhang, X.; Kuang, X.; Jiang, H.; Wang, H.; Zhen, Z.; He, C. Characteristics and sources of WSI in North China Plain: A simultaneous measurement at the summit and foot of Mount Tai. J. Environ. Sci. China 2020, 92, 264–277. [Google Scholar] [CrossRef]
Figure 1. Time series of the optical parameters of aerosol, at a wavelength of 550 nm, observed from 13 May to 25 June 2017: (a) Scattering coefficient, absorption coefficient, and extinction coefficient; (b) single scattering albedo.
Atmosphere 11 00655 g001
Figure 2. Daily variation in the scattering coefficient and absorption coefficient at 550 nm of aerosols during observation period.
Atmosphere 11 00655 g002
Figure 3. Time series of aerosol number concentration size distribution at the summit of Mt. Tai.
Atmosphere 11 00655 g003
Figure 4. Variation in the equivalent refractive index of the aerosols at a wavelength of 550 nm with time during observation at the summit of Mt. Tai. (a) n denotes the real part of the complex refractive index. (b) k denotes the imaginary part of the complex refractive index.
Atmosphere 11 00655 g004
Figure 5. Distribution range and frequency of the real and imaginary parts of the complex refractive index of aerosols at a wavelength of 550 nm. (a) n denotes the real part of the complex refractive index. (b) k denotes the imaginary part of the complex refractive index.
Atmosphere 11 00655 g005
Figure 6. Diurnal variation in the complex refractive index of aerosols at a wavelength of 550 nm during observation. (a) n denotes the real part of the complex refractive index. (b) k denotes the imaginary part of the complex refractive index.
Atmosphere 11 00655 g006
Table 1. Comparison of the aerosol optical properties determined in this study and those determined for other sites.
Site σ sca , λ
(Mm−1)
σ abs , λ (Mm−1) ω λ Data TimeReference
Mt. Tai, China40.316.00.672017.5–2017.6This study
(550 nm)(550 nm)(550 nm)
Mt. Tai, China142.913.00.882010.7–2011.12[6]
(550 nm)(550 nm)(550 nm)
Mt. Huang62.65.50.892011.6–2011.8[4]
(550 nm)(550 nm)(550 nm)
Shangdianzi, China174.617.50.882003.9–2005.1[21]
(525 nm)(525 nm)(525 nm)
Bondville, USA48.73.90.921996.9–2000.9[24]
(550 nm)(550 nm)(550 nm)
Beijing, China360640.822009.6–2010.5[25]
(525 nm)(525 nm)(525 nm)
Shanghai, China292.865.80.812010.12–2011.3[26]
(532 nm)(532 nm)(532 nm)
Nanjing, China303.328.00.892011.3–2011.4[27]
(532 nm)(532 nm)(532 nm)
Tokyo, Japan130.8113.60.882007.8–2007.9[28]
(532 nm)(532 nm)(532 nm)
Delhi, India110.562.50.692008.4–2008.6[29]
(550 nm)(550 nm)(550 nm)
Guangzhou, China151.034.30.822006.7[30]
(550 nm)(550 nm)(550 nm)
Granada, Spain84.028.80.662005.12–2006.2[31]
(550 nm)(670 nm)(670 nm)
Kwangju, Korea319.042.00.882001.4[32]
(520 nm)(880 nm)(550 nm)
Beijing, China488830.791999.6[33]
(530 nm)(530 nm)(530 nm)
North American continent10.81.40.881997.3–1997.4[34]
(550 nm)(550 nm)(550 nm)
Table 2. Summary of the studied complex refractive index of aerosols.
SiteAerosol TypenkReference
Mt. Tai, Chinamountain atmosphere1.38 (550 nm)0.049 (550 nm)This study
Mt. Tai, Chinablack carbon1.80 (550 nm)0.54 (550 nm)[6]
no-optical absorption components1.50 (550 nm)10−7 (550 nm)
water1.33 (550 nm)0 (550 nm)
Mt. Huang, Chinasulfate1.54 (550 nm)10−7 (550 nm)[4]
nitrate1.54 (550 nm)10−7 (550 nm)
organics1.55 (550 nm)0.001 (550 nm)
dust1.52 (550 nm)0.0034 (550 nm)
Sahara, Africadust1.53 (305–955 nm)0.016–0.50 (305 nm)[17]
Tianjin, Chinaurban aerosols1.64 (550 nm)0.015 (550 nm)[36]
Paris, Franceurban aerosols1.51–1.59 (530 nm)0.017–0.040 (530 nm)[42]
Eastern Germanyurban aerosols1.60 (530 nm)0.04 (530 nm)[43]
Americaclean atmosphere1.45 (500 nm)0[44]
Japanurban aerosols1.60.04[45]
Table 3. The correlation between n and k of the retrieved aerosol refractive index and meteorological elements.
Part of the mWind Speed (m·s−1) T (°C)RH (%)Pressure (hPa)Visibility (km)
n0.185 **−0.167 **−0.040.060.06
k0.353 **−0.257 **−0.220 **0.070.332 **
** at 0.01 level (double tail), the correlation is significant.

