Abstract
Using the two-box energy balance model (EBM), we explore the climate system response to radiative forcing generated by variations in the concentrations of stratospheric aerosols and estimate the effect of uncertainties in radiative feedbacks on changes in global mean surface temperature anomaly used as an indicator of the response of the climate system to external radiative perturbations. Radiative forcing generated by stratospheric sulfate aerosols from the second-largest volcanic eruption in the 20th century, the Mount Pinatubo eruption in June 1991, was chosen for this research. The global mean surface temperature response to a specified change in radiative forcing is estimated as a convolution of the derived impulse response function corresponding to EBM with a function that describes the temporal change in radiative forcing. The influence of radiative feedback uncertainties on changes in the global mean surface temperature is estimated using several “versions” of the EBM. The parameters for different “versions” were identified by applying a specific procedure for calibrating the two-box EBM parameters using the results of climate change simulations conducted with coupled atmosphere–ocean general circulation models from the Coupled Model Intercomparison Project phase 5 (CMIP5). Changes in the global mean surface temperature caused by stratospheric aerosol forcing are found to be highly sensitive not only to radiative feedbacks but also to climate system inertia defined by the effective heat capacity of the atmosphere–land–ocean mixed layer system, as well as to deep-ocean heat uptake. The results obtained have direct implications for a better understanding of how uncertainties in climate feedbacks, climate system inertia and deep-ocean heat uptake affect climate change modelling.
1. Introduction
Natural and anthropogenic atmospheric aerosols substantially influence the Earth’s climate by both directly and indirectly affecting the planetary energy balance, redistribution of radiative fluxes and the formation of thermal and dynamic structures of the ocean and atmosphere (see [1,2] and references cited herein). The climatic effect of atmospheric aerosols depends on their optical properties (scattering and absorption coefficients, single scattering albedo, Ångström exponent, particle size distribution and particle number) as well as the aerosols’ residence time (lifetime) in the atmosphere (e.g., [3,4,5,6]). The residence time is in turn determined by the particle sizes and the altitude of the aerosol layer (plume). Tiny stratospheric aerosols (e.g., volcanic sulfate aerosols) have one of the most significant effects on the climate since their lifetime can be up to several years, which is much longer than the residence time of the tropospheric aerosols (e.g., [7,8]). The stratospheric sulfate aerosol layer is an almost purely scattering medium for shortwave solar radiation. Therefore, some of the incoming solar radiation is reflected back into space, contributing to the near-surface cooling. However, stratospheric sulfate aerosol plume is a weakly absorbing medium for the infrared terrestrial radiation. Sulfate aerosols artificially injected into the stratosphere, due to their optical properties, are considered as a potential measure to mitigate anthropogenic global warming (e.g., [9,10,11,12] and references cited herein).
Currently, climate models of varying degrees of complexity play their role as our main tools for expanding our scientific understanding of the influence of stratospheric aerosols on the Earth’s climate change and its variability in the past, present and future. In climate studies, two main measures—equilibrium climate sensitivity (ECS) and transient climate response (TCR)—are commonly used to estimate the climate system response to a given external radiative forcing caused by various agents, including stratospheric aerosols. Meanwhile, it has long been known that different climate models demonstrate varying extents of climate system response since the range of climate sensitivity in climate models is quite wide (e.g., [13,14,15]). This uncertainty in climate sensitivity results in a large extent from intermodel differences in the strength of radiative feedback processes that are inherent in the physical climate system [16,17,18,19,20,21,22,23].
From the standpoint of control theory, feedback loops represent regulatory mechanisms that amplify (positive feedback) or diminish (negative feedback) the effects of external radiative forcing, thereby determining the climate sensitivity [24]. Observations and climate model simulations show that feedback loops jointly amplify the climate system response (in terms of surface temperature) to external radiative forcing [21,25]. In the context of the climate system, feedbacks can be analyzed within the global top-of-atmosphere (TOA) linear forcing-feedback framework [26,27]:
where is the global-mean net downward radiative flux at the TOA representing the rate of increase in heat stored in the climate system, is the radiative forcing (positive downwards) imposed on the climate system due to changes in concentrations of radiatively active atmospheric components, is the radiative response of the climate system (positive upwards) to change in the global mean surface temperature and ) is the climate response parameter which characterizes the net climate feedback strength (in the scientific literature, the parameter is also referred to as the climate feedback parameter). The sign convention used in Equation (1) corresponds to the so-called “positive-stable” climate feedback (for details, please refer to Gregory et al. [27]).
The global mean surface temperature change is considered relative to an unperturbed steady state of the climate system for which and therefore, . In a perturbed steady state and therefore, . The inverse of the feedback parameter ), is called the climate sensitivity parameter. Thus, the change in global-mean surface temperature due to radiative forcing , once the climate system reaches the equilibrium state, is defined as . If, for example, the radiative forcing , where is the radiative forcing induced by a doubling of the atmospheric carbon dioxide (CO2) concentration, then the ECS is given by . There is a wide variety of both positive and negative feedback mechanisms in the Earth’s climate system. Some of them are important in terms of their influence on the climate system response to external radiative forcing [25]. However, the strength of the feedback estimates in Coupled Model Intercomparison Project phase 5 (CMIP5) models [28] varies noticeably [29], which causes significant intermodel differences in the global-mean temperature response to a given radiative forcing.
In this paper, we apply the two-layer energy balance model (EBM) [30,31] to explore the climate system response to radiative forcing generated by variations in stratospheric aerosol concentrations, and ultimately to better understand how the uncertainties in climate feedbacks affect changes in global mean surface temperature anomaly used as an indicator of the response of the climate system to external radiative perturbations. Radiative forcing generated by stratospheric sulfate aerosols from the second-largest volcanic eruption of the 20th century, the Mount Pinatubo eruption in June 1991, was chosen for this research. Hansen et al. [32] suggested using the Pinatubo case as a test of climate sensitivity to a given forcing since the availability of data for Pinatubo allows one to accurately determine the magnitude of stratospheric aerosol forcing. The climate system response to a specified change in radiative forcing is estimated as a convolution of the derived impulse response function corresponding to EBM with a function that describes the temporal change in radiative forcing. The influence of radiative feedback uncertainties on changes in the global mean surface temperature is estimated using several EBM “versions”, the parameters of which were identified by applying a specific procedure for calibrating the two-box EBM parameters using the results of climate change simulations with coupled atmosphere–ocean general circulation models from the CMIP5 [29].
2. Materials and Methods
2.1. The Model
We used the two-box EBM [30,31] which, in stochastic formulation, has previously been applied to estimate the effects of parametric uncertainty on climate variability [19,20]. In this EBM, the climate system was divided into two subsystems: the upper box that corresponds to the atmosphere, the land surface and the ocean mixed layer, and the lower box that represents the deep ocean. The state of each box was characterized by the globally averaged temperature anomalies and with respect to their reference (equilibrium) values and . Equations that describe the evolution over time of the model state variables and under the influence of radiative forcing F are of the form:
where and are the effective heat capacities of the upper and lower boxes of the model; is a heat exchange parameter describing the interactions between the boxes. Temperature anomaly of the upper box is identified with the global-mean surface air temperature perturbation.
In the absence of radiative feedbacks (i.e., with only the ”Planck” response), we can define the so-called “reference-system climate sensitivity parameter” [16,24]:
where is the Earth’s emissivity [33]; is the Stephan–Boltzmann constant; is the reference global mean surface temperature. The reference climate sensitivity parameter gives a long-term (equilibrium) surface temperature increase °C in response to radiative forcing due to the doubling of the CO2 concentration.
Along with the feedback parameter , we can also consider the dimensionless feedback coefficient (factor) f [16], which is a fraction of the climate system output “signal” sent back to its input defined by the following expression: . Then, the response of the climate system to the radiative forcing is given by where is the climate system gain. It is obvious that the negative feedback () reduces the gain ( and, therefore, taking negative feedback into account weakens the climate system response to radiative forcing. In contrast, positive feedback () enhances the gain () and, thus, amplifies the climate system response. It is clear that climate feedbacks fall into this range [24]. If , then the perturbed climate system is unable to reach the new equilibrium state, therefore, this case is hardly applicable to the climate system [24]. Note that in a (linear) EBM, different feedbacks are considered as additive: [34]. Equation shows that the relationship between the absolute uncertainty in the system response and the absolute uncertainty in the feedback factor is nonlinear: . In climate studies, the uncertainty in system response to radiative forcing can be evaluated employing multiple models (an ensemble-based approach to climate simulations and projections). In this case, the feedback uncertainty can be given by the variance where is the model-mean feedback factor, its standard deviation, and is the standard deviation of the climate system response .
The two-box EBM includes four free parameters, , , λ and γ, and a radiative forcing amplitude parameter , which affect the time evolution of the state variables and . Model parameter values used in this study were taken from [29] (see Table 1). These values were identified via the specific procedure of calibrating the two-box EBM parameters from the results of climate change simulations performed using coupled atmosphere–ocean general circulation models from the CMIP5. As the base values of the model parameters, we will consider the rounded values of the multi-model means of the CMIP5 fitted values: , 106 , and , which corresponds to . Certainly, all CMIP5 models are similar since they are based on the same basic physical laws and principles and describe the evolution of the same (climate) system. Meanwhile, some characteristics of CMIP5 models (e.g., the description of physical processes and cycles, the numerical algorithms and spatial resolution) differ from each other [15]. This can be one of the greatest sources of differences in CMIP5 model parameter estimates. As in [29], the feedback parameters used in this study represent the instantaneous global radiative response at the TOA to global mean surface temperature changes, irrespective of how those variations occur. In contrast to complex climate models, in which the total feedback parameter is regarded as the “sum” of various individual feedback parameters, in EBMs the total feedback parameter is only considered. The values of the total feedback parameters listed in Table 1 were derived based on the assumption that the net radiative flux change at the TOA is induced by a quadrupling of the atmospheric CO2 concentration. However, as shown in [35], the global anthropogenic aerosol radiative feedback parameter is “indistinguishable” from the GHG feedback parameter. Thus, the use of the values of the total feedback parameter obtained in [29] is a fairly reasonable assumption.

Table 1.
The thermal inertia parameters and , deep-ocean heat uptake , climate feedback parameter , and climate feedback factor estimates of the Coupled Model Intercomparison Project phase 5 (CMIP5) models used in this study, and their multimodel mean and standard deviation given for the 16-model ensemble (all parameter values, with the exception of the climate feedback factor, are taken from [29]).
For convenience of further discussion, we note that model Equations (2) and (3) can be easily converted to a linear second-order differential equation describing a damped harmonic oscillator driven by a force that depends on time:
where is the angular resonance frequency, and is the damping coefficient.
The analysis of the above second-order differential equation, which is equivalent to the system of first order linear differential Equations (2) and (3), shows that the climate system response to radiative forcing is characterized by the “fast” and the “slow” relaxation times given, respectively, by
For the base parameter values, we obtain and .
2.2. The Global Radiative Forcing Due to Stratospheric SulfateA
In general, estimating the response of the climate system to radiative forcing produced by variations in the atmospheric concentrations of radiatively active gases and natural and anthropogenic aerosols requires quite a complex radiation transfer model. However, in the two-box EBM, an external radiative forcing is defined as a change in the planetary radiative balance at the TOA (or in other words, as the net radiative flux change at the TOA). In this study, to obtain an estimate of radiative forcing produced by stratospheric sulfate aerosols, we apply a simplified single-factor parameterization scheme [6], in which the aerosol optical depth (or thickness) at the wavelength 550 nm is used as a determining parameter to account for the optical properties of aerosol particles that scatter solar shortwave radiation for the case of a uniform layer of aerosols:
where is the empirical parameter [6], and is the global mean optical depth of stratospheric aerosols.
In this study, the temporal change in was specified in accordance with the GISS (Goddard Institute for Space Studies) aerosol data products [36] for the period 1989–2012 (the span of time from 2 years before to 21 years after the Pinatubo volcanic eruption in June 1991). The total amount of sulfur dioxide injected into the stratosphere as a result of the Pinatubo eruption is considerably uncertain and ranged from 10 to 20 Tg ([37,38] and references cited herein). Sulfur dioxide formed sulfate aerosols, which rapidly spread around the Earth reaching global coverage about 1 year after the eruption. We highlight that Hansen et al. [32] specifically suggested using the Pinatubo case as a test of climate sensitivity to a given forcing since the availability of data for Pinatubo allows accurate determination of the magnitude of stratospheric aerosol forcing.
2.3. Technique for the Solution of EBM Equations
Since the two-box EBM is linear, the response of the global mean surface temperature anomaly to radiative perturbation caused by stratospheric aerosols can be estimated as a convolution of the impulse response function (IRF) for continuous-time dynamical system (2)–(3) with a function that describes the change in radiative forcing [39]. Let be the IRF for the system described by Equations (2) and (3). Then is given by [40]
where denotes convolution of and over a finite time range .
In the general case, the impulse characteristic of a linear dynamical system is the response of a system to the input specified as a Dirac delta function with zero initial conditions. To find the IRF of a linear continuous-time dynamical system we can take the inverse Laplace transform of the system’s transfer function : , where is the symbol of the Laplace operator, and is a complex variable known as the complex frequency. In turn, the transfer function of the two-box EBM can be obtained by taking the Laplace transform of differential equations (2) and (3) with zero initial conditions. Omitting intermediate calculation, we give the final expression for the transfer function of system (2) and (3) [40]:
Taking the inverse Laplace transform of the transfer function (9), we have [40]
The IRF (10) completely characterizes the dynamic properties of EBMs (2)–(3) affected by any, but sufficiently small, time dependent external radiative perturbation.
3. Results and Discussion
To validate the proposed IRF-based technique for calculating the global mean surface temperature anomaly in response to external radiative perturbation, we performed calculations using two idealized forcing scenarios for which analytical solutions are available. These are (a) step forcing, which instantly jumps from 0 to the value of [2] at , and then remains constant (abrupt quadrupling of atmospheric CO2 scenario) and (b) linear forcing that corresponds to 1% yearly CO2 concentration growth (1 pct CO2 scenario), for which , where [12,40]. These two idealized scenarios are standard radiative forcing scenarios used to obtain the estimates of ECS and TCR from global climate models [28].
For a step forcing, the analytical solution for the global mean surface temperature anomaly as a function of time is given by
Here and , where and are the components of eigenvectors (for further details, see Appendix A).
For a linear forcing, the anomaly is calculated using the following formula:
where the coefficients and depend on the model parameters. The formulas for calculating and are omitted due to lack of space [40].
As shown in [40], the approximate solutions are in agreement with the exact analytical solutions. For both forcing scenarios, the relative error is lower than 1%, while the largest absolute error is about °C.
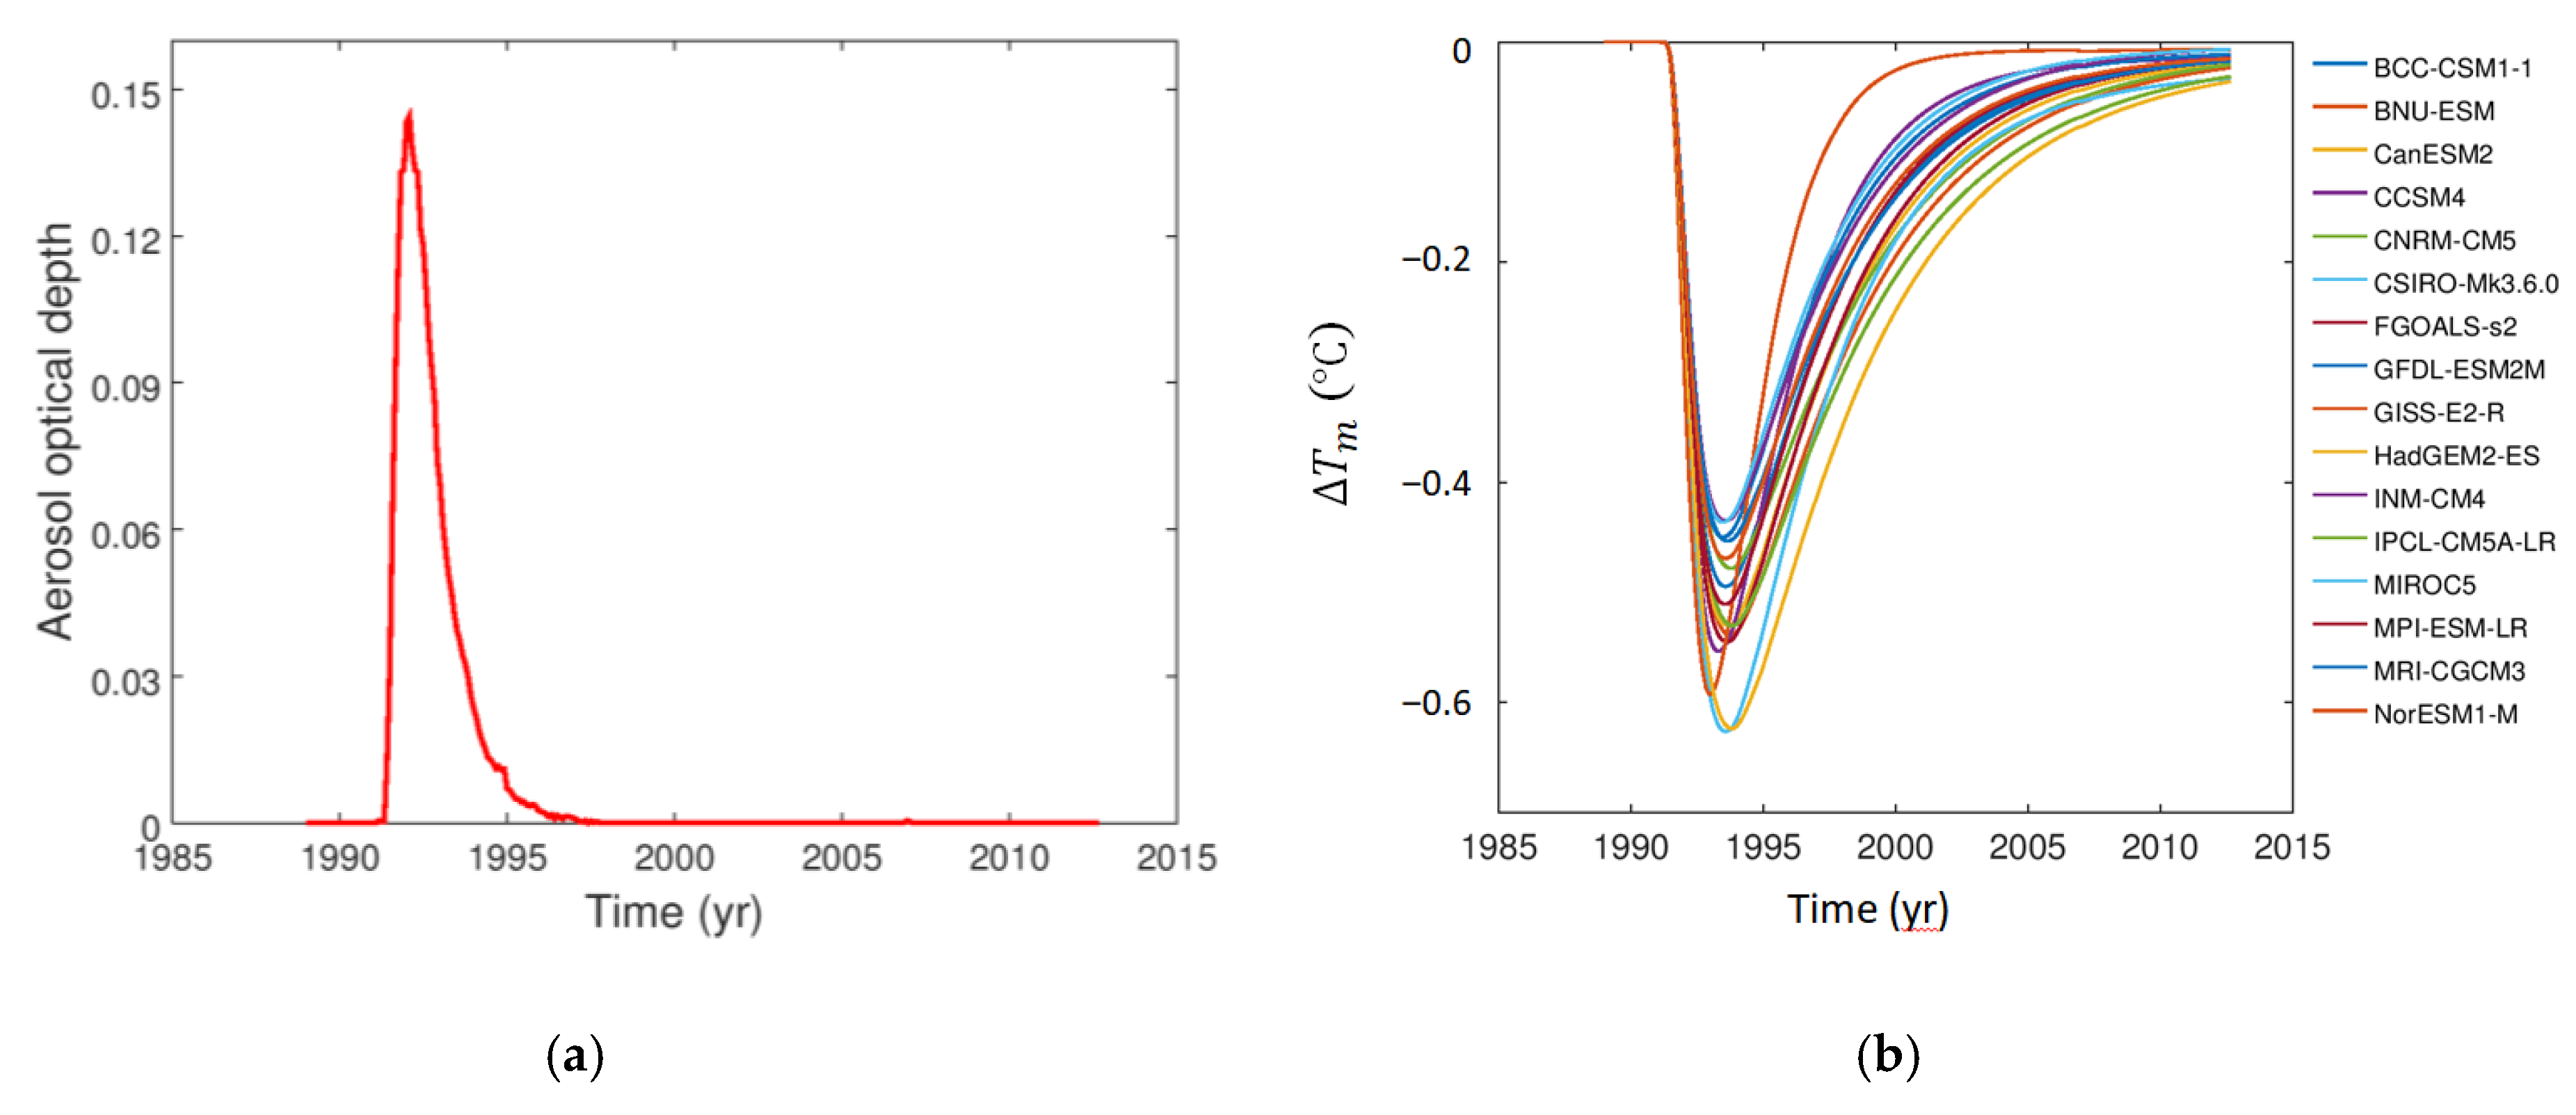
Figure 1a illustrates the time evolution of the global mean total optical depth at the wavelength 550 nm for the case of the Mount Pinatubo eruption. In order to isolate the global mean surface temperature signal induced by volcanic aerosols, we removed the radiative effects of background stratospheric aerosols by assuming that their total optical depth is ~0.005 [41]. This allows us to neglect the influence of radiative perturbation caused by background stratospheric aerosols on the global mean surface temperature change. The value of is given by the mean of stratospheric aerosol optical depth at the wavelength 550 nm for the 18 months preceding the Mount Pinatubo eruption. Thus, the optical depth of the stratospheric aerosols used in calculations is defined by , where is the aerosol optical depth taken from the GISS aerosol data products [36].
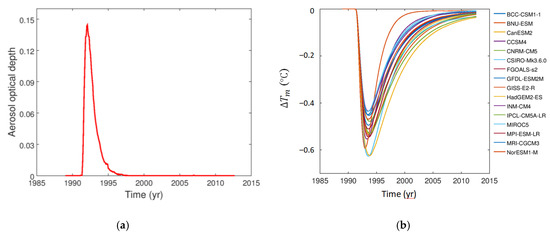
Figure 1.
Global mean total optical depth at 550 nm for the case of the Mount Pinatubo 1991 eruption (a) and the corresponding global mean surface temperature anomalies (°C) derived from running various energy balance models (EBMs) with parameters listed in Table 1 (b).
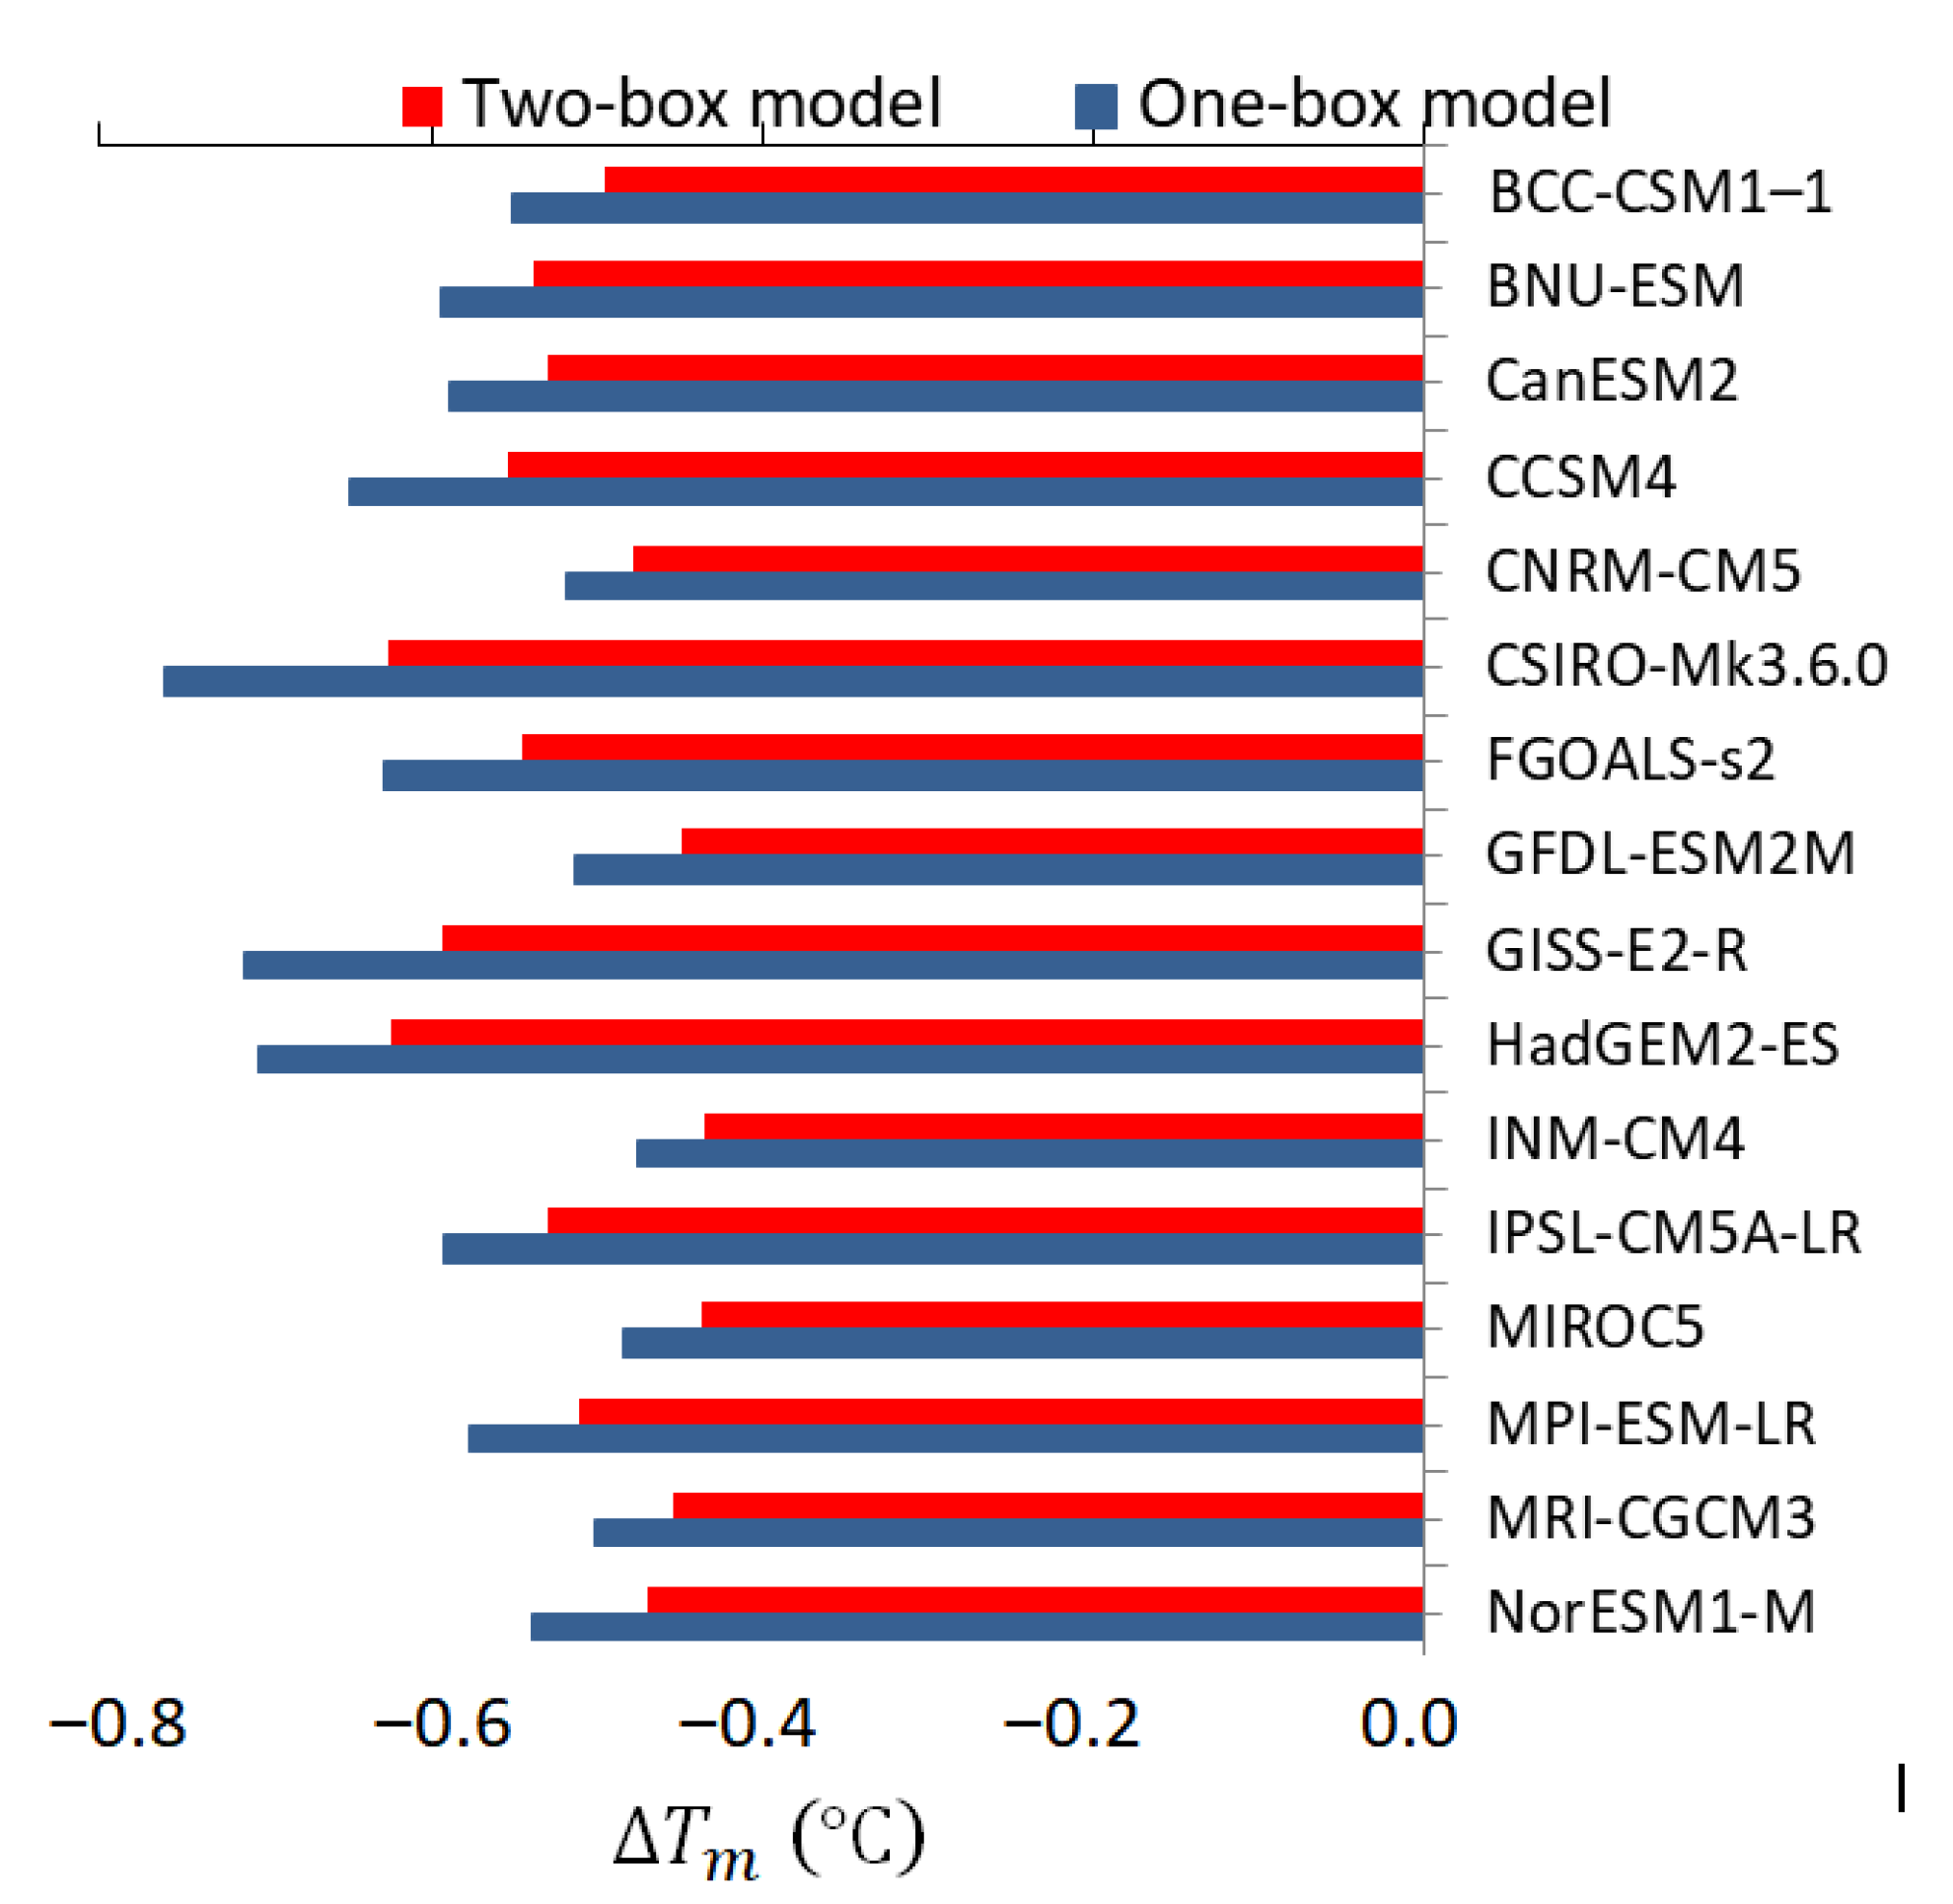
As shown in Figure 1a, the global mean total optical depth would rise rapidly to a maximum value of ~0.15 by the beginning of 1992, and then exponentially decrease to insignificant values by 1995. A similar behaviour is inherent in radiative forcing generated by volcanic stratospheric aerosols, since the relationship between the total optical depth and the top-of-the-atmosphere radiative forcing (7) is linear. The corresponding changes in the global mean surface temperature anomalies, derived using various EBMs with parameters listed in Table 1, are presented in Figure 1b. As reflected in this figure, all models show an abrupt cooling after the Mount Pinatubo eruption. However, the changes in global mean surface temperature anomaly due to radiative perturbation generated by volcanic aerosols vary noticeably between the different EBMs (see Figure 2). The lowest global mean surface temperature , taken as an indicator of the climate system changes in response to a volcanic aerosol forcing, occurs about 1.5–2 years after the eruption of Pinatubo.
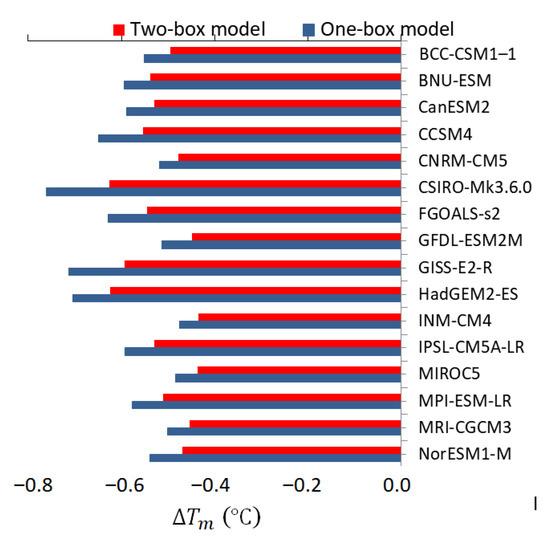
Figure 2.
Climate system response (°C) to volcanic aerosol radiative forcing obtained by different EBMs with parameters listed in Table 1.
To evaluate the model ensemble, we used standard statistical measures such as mean, standard deviation (StD) and the range of changes in . Multi-model ensemble mean volcanic cooling is about °C with a full range of °C, and the ensemble StD is ~0.06 °C. The strongest response °C was obtained using the CSIRO (Commonwealth Scientific and Industrial Research Organisation) model with the feedback parameter , while the smallest response °C was calculated using the INM (Institute of Numerical Mathematics) model with . As shown in previously published studies (e.g., [32,38,41]), the Pinatubo volcanic aerosol plume caused short-term global surface cooling of up to 0.4–0.6 °C. Thus, the results obtained by the two-box EBM are reasonably accurate despite the multi-model ensemble spread of °C for . For reference, Figure 2 presents the results obtained by the one-box EBM commonly used in theoretical climate studies. The main equation of this model can be derived from Equations (2) and (3) with the condition . Calculations show that omitting the deep-ocean heat uptake () leads to an increase in the climate system response to volcanic radiative forcing by about 15%.
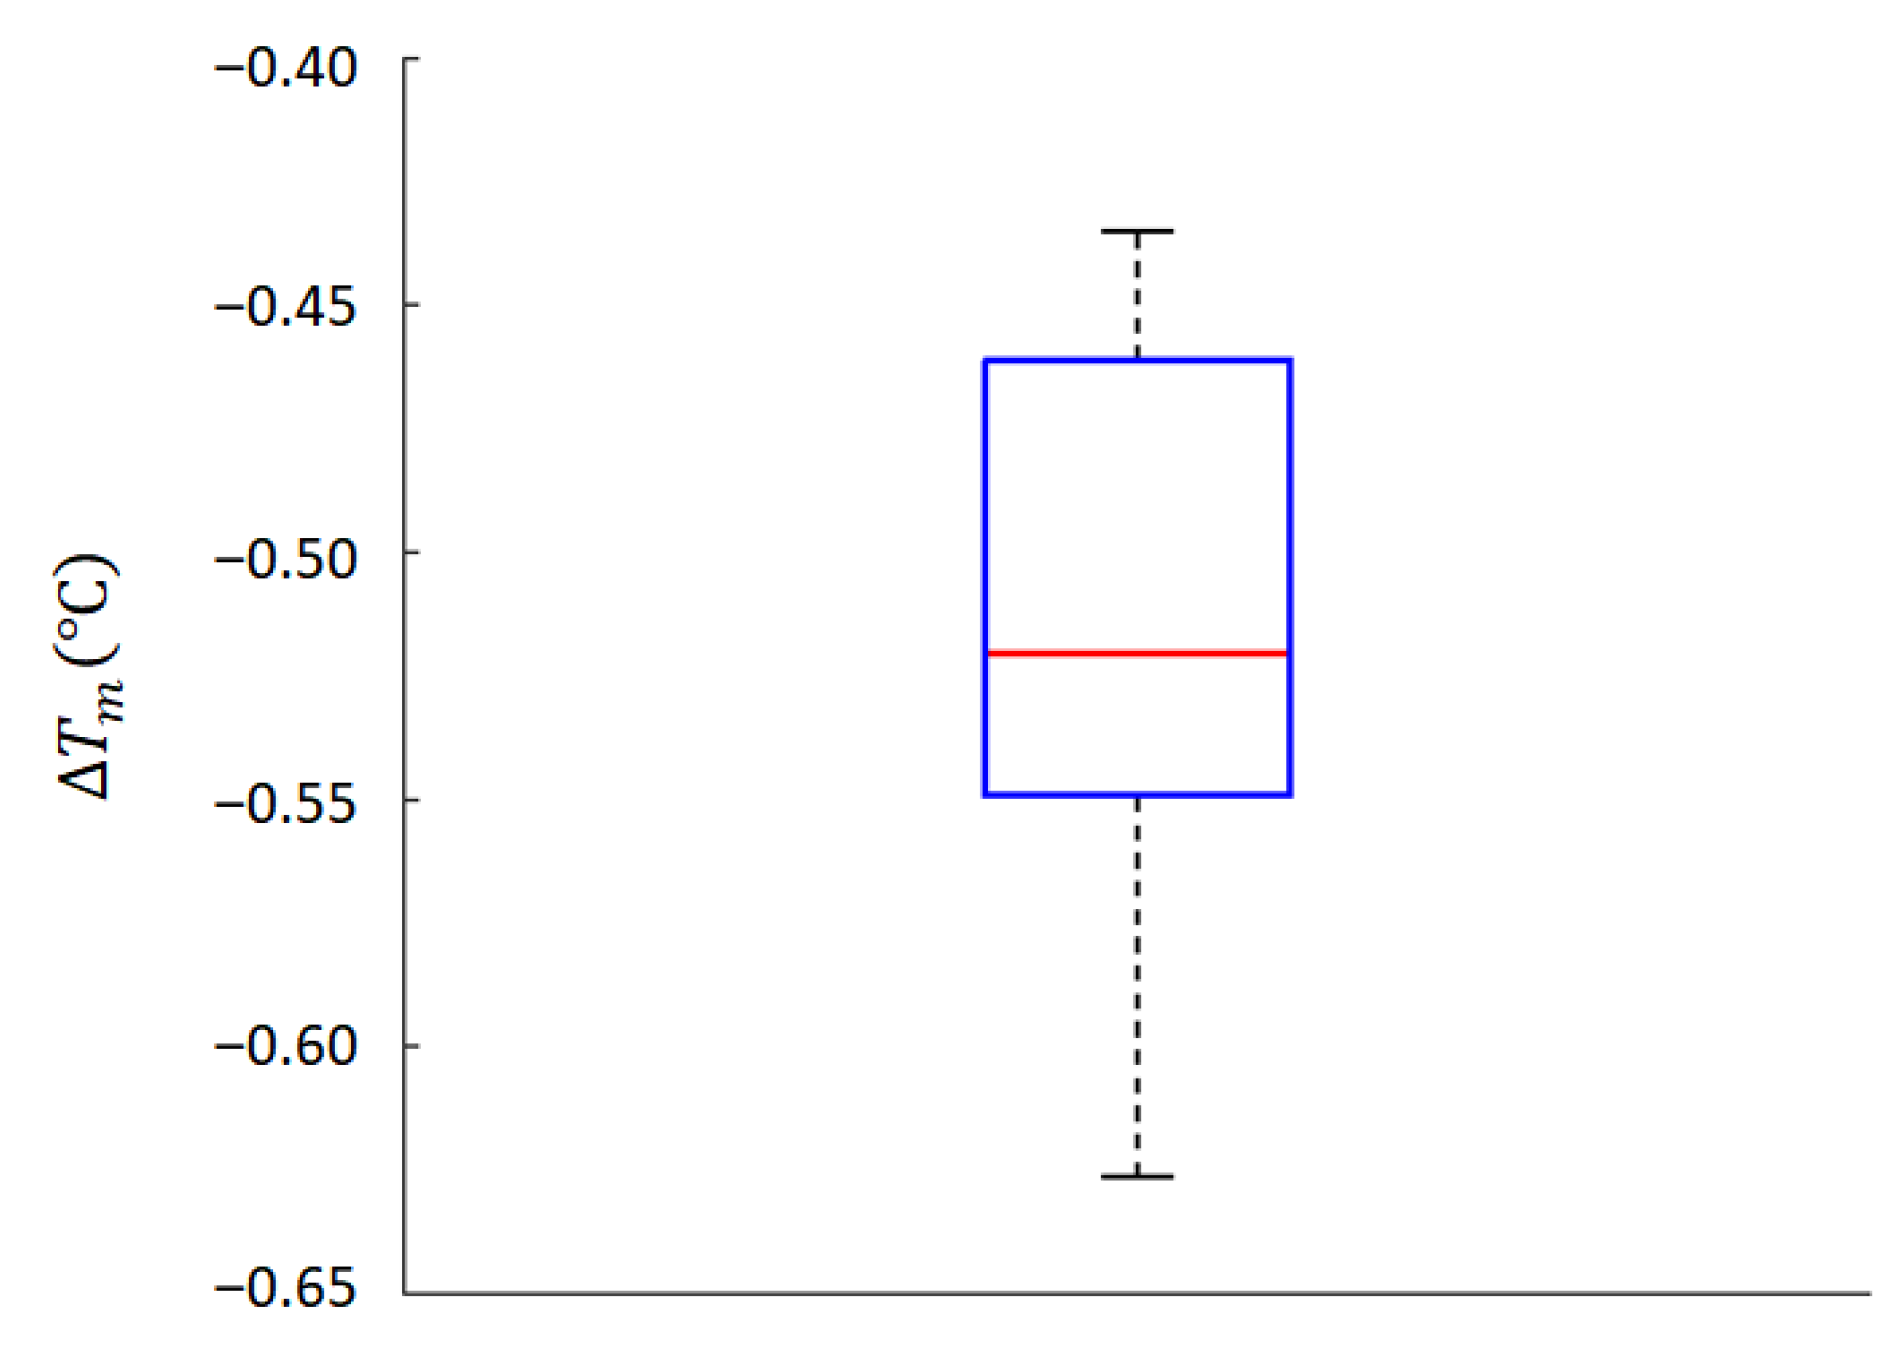
Figure 3, which to a certain extent compliments Figure 2, provides the box-whisker plot that summarizes the descriptive statistical measures (median, minimum and maximum values of , lower and upper quartiles) obtained from the multi-model ensemble. The whiskers show the range of obtained from the 16 realizations, while the box displays the interquartile range (the range between the first and third quartiles or, in other words, the middle 50% of the distribution), and the red line indicates the median.
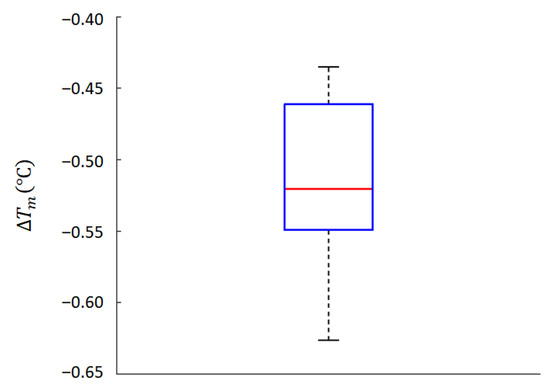
Figure 3.
Box-whisker plot for , calculated using various EBMs with parameters listed in Table 1.
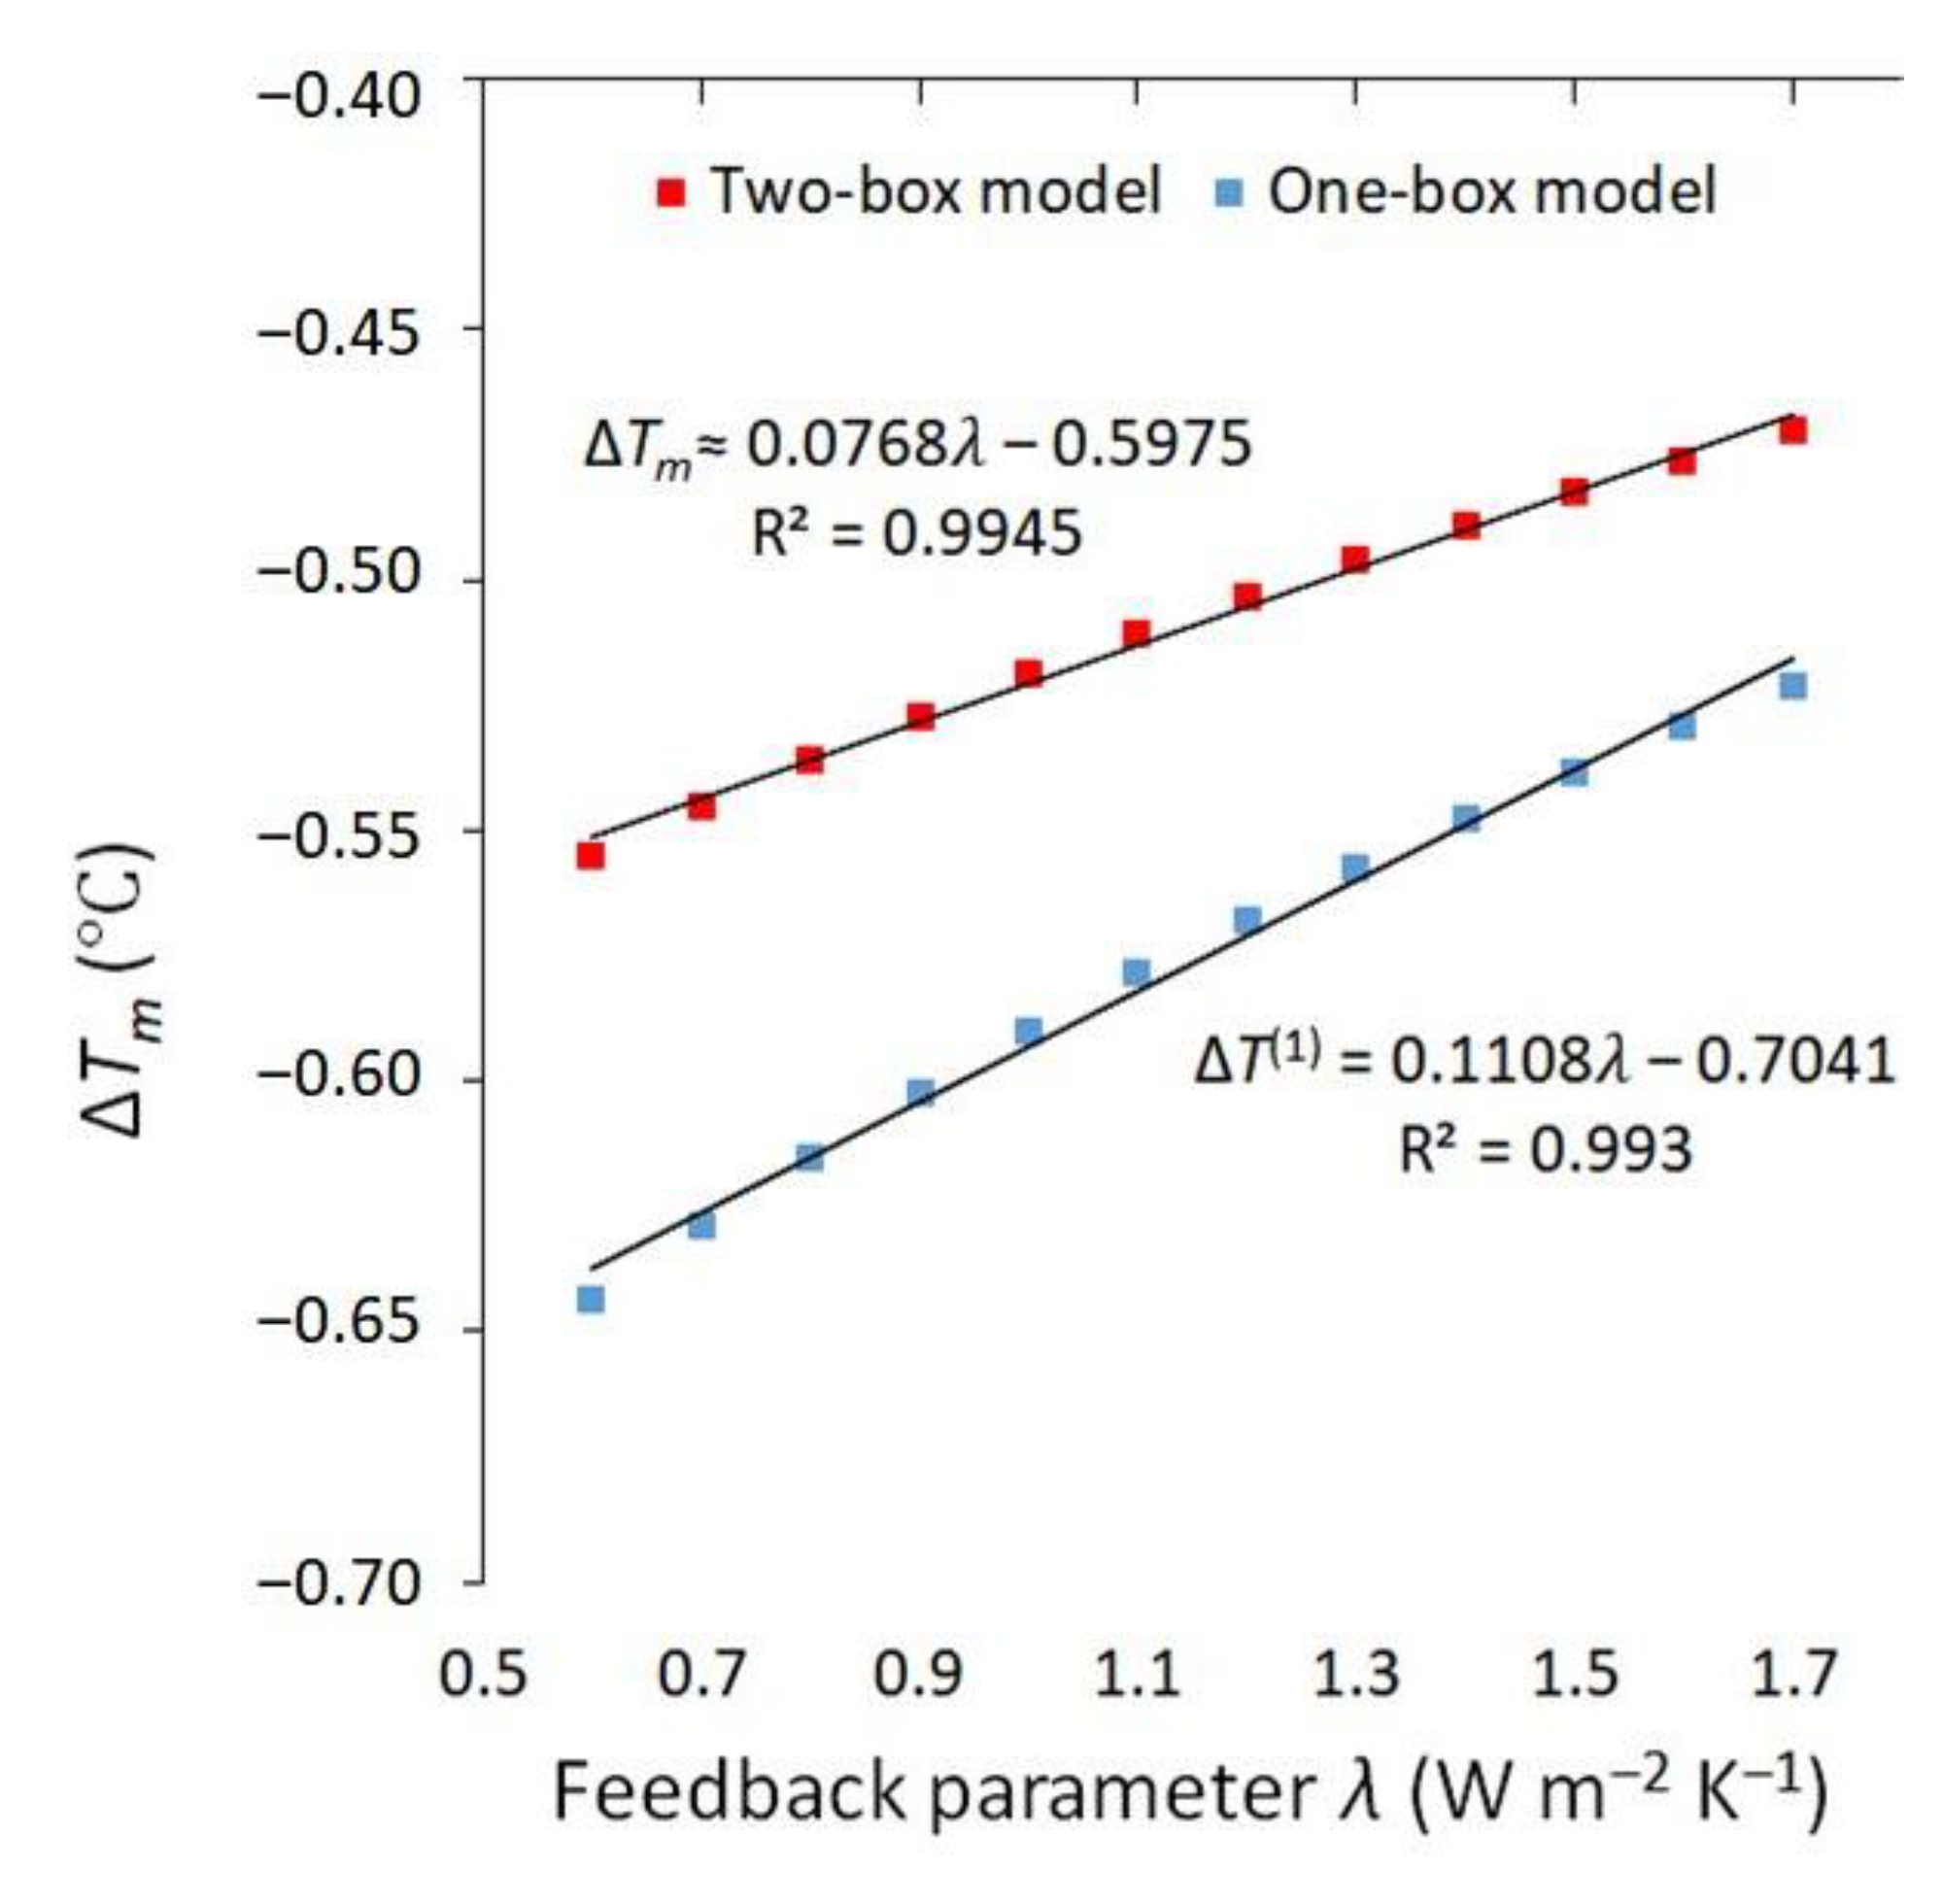
Since all model parameters affect the response of global mean surface temperature to external radiative forcing, in order to estimate the effect of only the feedback parameter on , we performed a series of numerical experiments in which multi-model mean (or base) values of , and were assigned, while the parameter changed in the range of 1 (see Table 1). This so-called “One-factor-at-a-time” method [19] is a commonly used approach in sensitivity analysis of dynamical systems including climate models [20]. As can be seen in Figure 4, the variable is almost linearly dependent on the feedback parameter . The relationship between and can be represented by the following linear equation: . A value of indicates a strong correlation between and . The results obtained from the one-box EBM are shown in Figure 4, for reference.
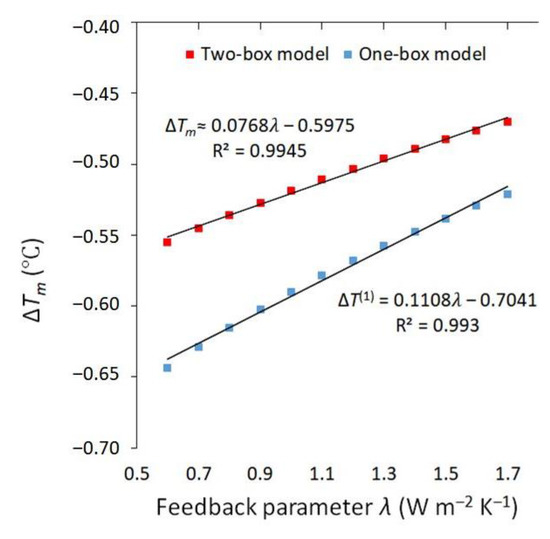
Figure 4.
Climate system response (°C) to volcanic aerosol radiative forcing as a function of climate feedback parameter ).
It is, however, well known (e.g., [21]) that the level of uncertainty in climate feedbacks is still high. Since the uncertainty in feedbacks is the essential source of uncertainty in the response of the Earth’s climate system to the anthropogenic greenhouse gas emissions, radiative feedback mechanisms are predominantly explored in the context of longer-term climatic changes measured on inter-annual, decadal and century scales. However, even at present, the intermodel spread in climate sensitivity, which is one of the main indices that measures the relationships between the increase in greenhouse gases (GHG) in the atmosphere and the magnitude of climate change, remains large, mainly due to the uncertainties in the representations of radiative feedbacks in state-of-the-art climate models. In this paper, we intended to estimate the effect of radiative feedback uncertainties on the short-term response of the climate system to a sharp radiative perturbation due to volcanic aerosols injected into the stratosphere by the 1991 Mount Pinatubo eruption.
To estimate the influence of feedback uncertainties on the climate system response to volcanic aerosol radiative forcing, we used the sensitivity coefficient defined as the partial derivative of with respect to λ, i.e., [19,20,42]. Then, the impact of feedback uncertainty on the model output can be quantified as follows: , where the variation characterizes the uncertainty in the parameter , and is the change (uncertainty) in the global mean surface temperature anomaly caused by . For linear regression of the form , the sensitivity coefficient is simply the slope of the regression line. From the equation that relates and (see above), one can find that .
Assuming the absolute uncertainty in the feedback parameter is (1-sigma uncertainty) [18,21], then the absolute uncertainty in caused by is °C, and the fractional (or percentage) uncertainty is about %. Recall that the fractional uncertainty is given by the ratio of the absolute uncertainty to the multi-model average value . For comparison, we also present results based on the one-box EBM: the absolute uncertainty in is °C and the fractional uncertainty is about % for the same uncertainty in the feedback parameter.
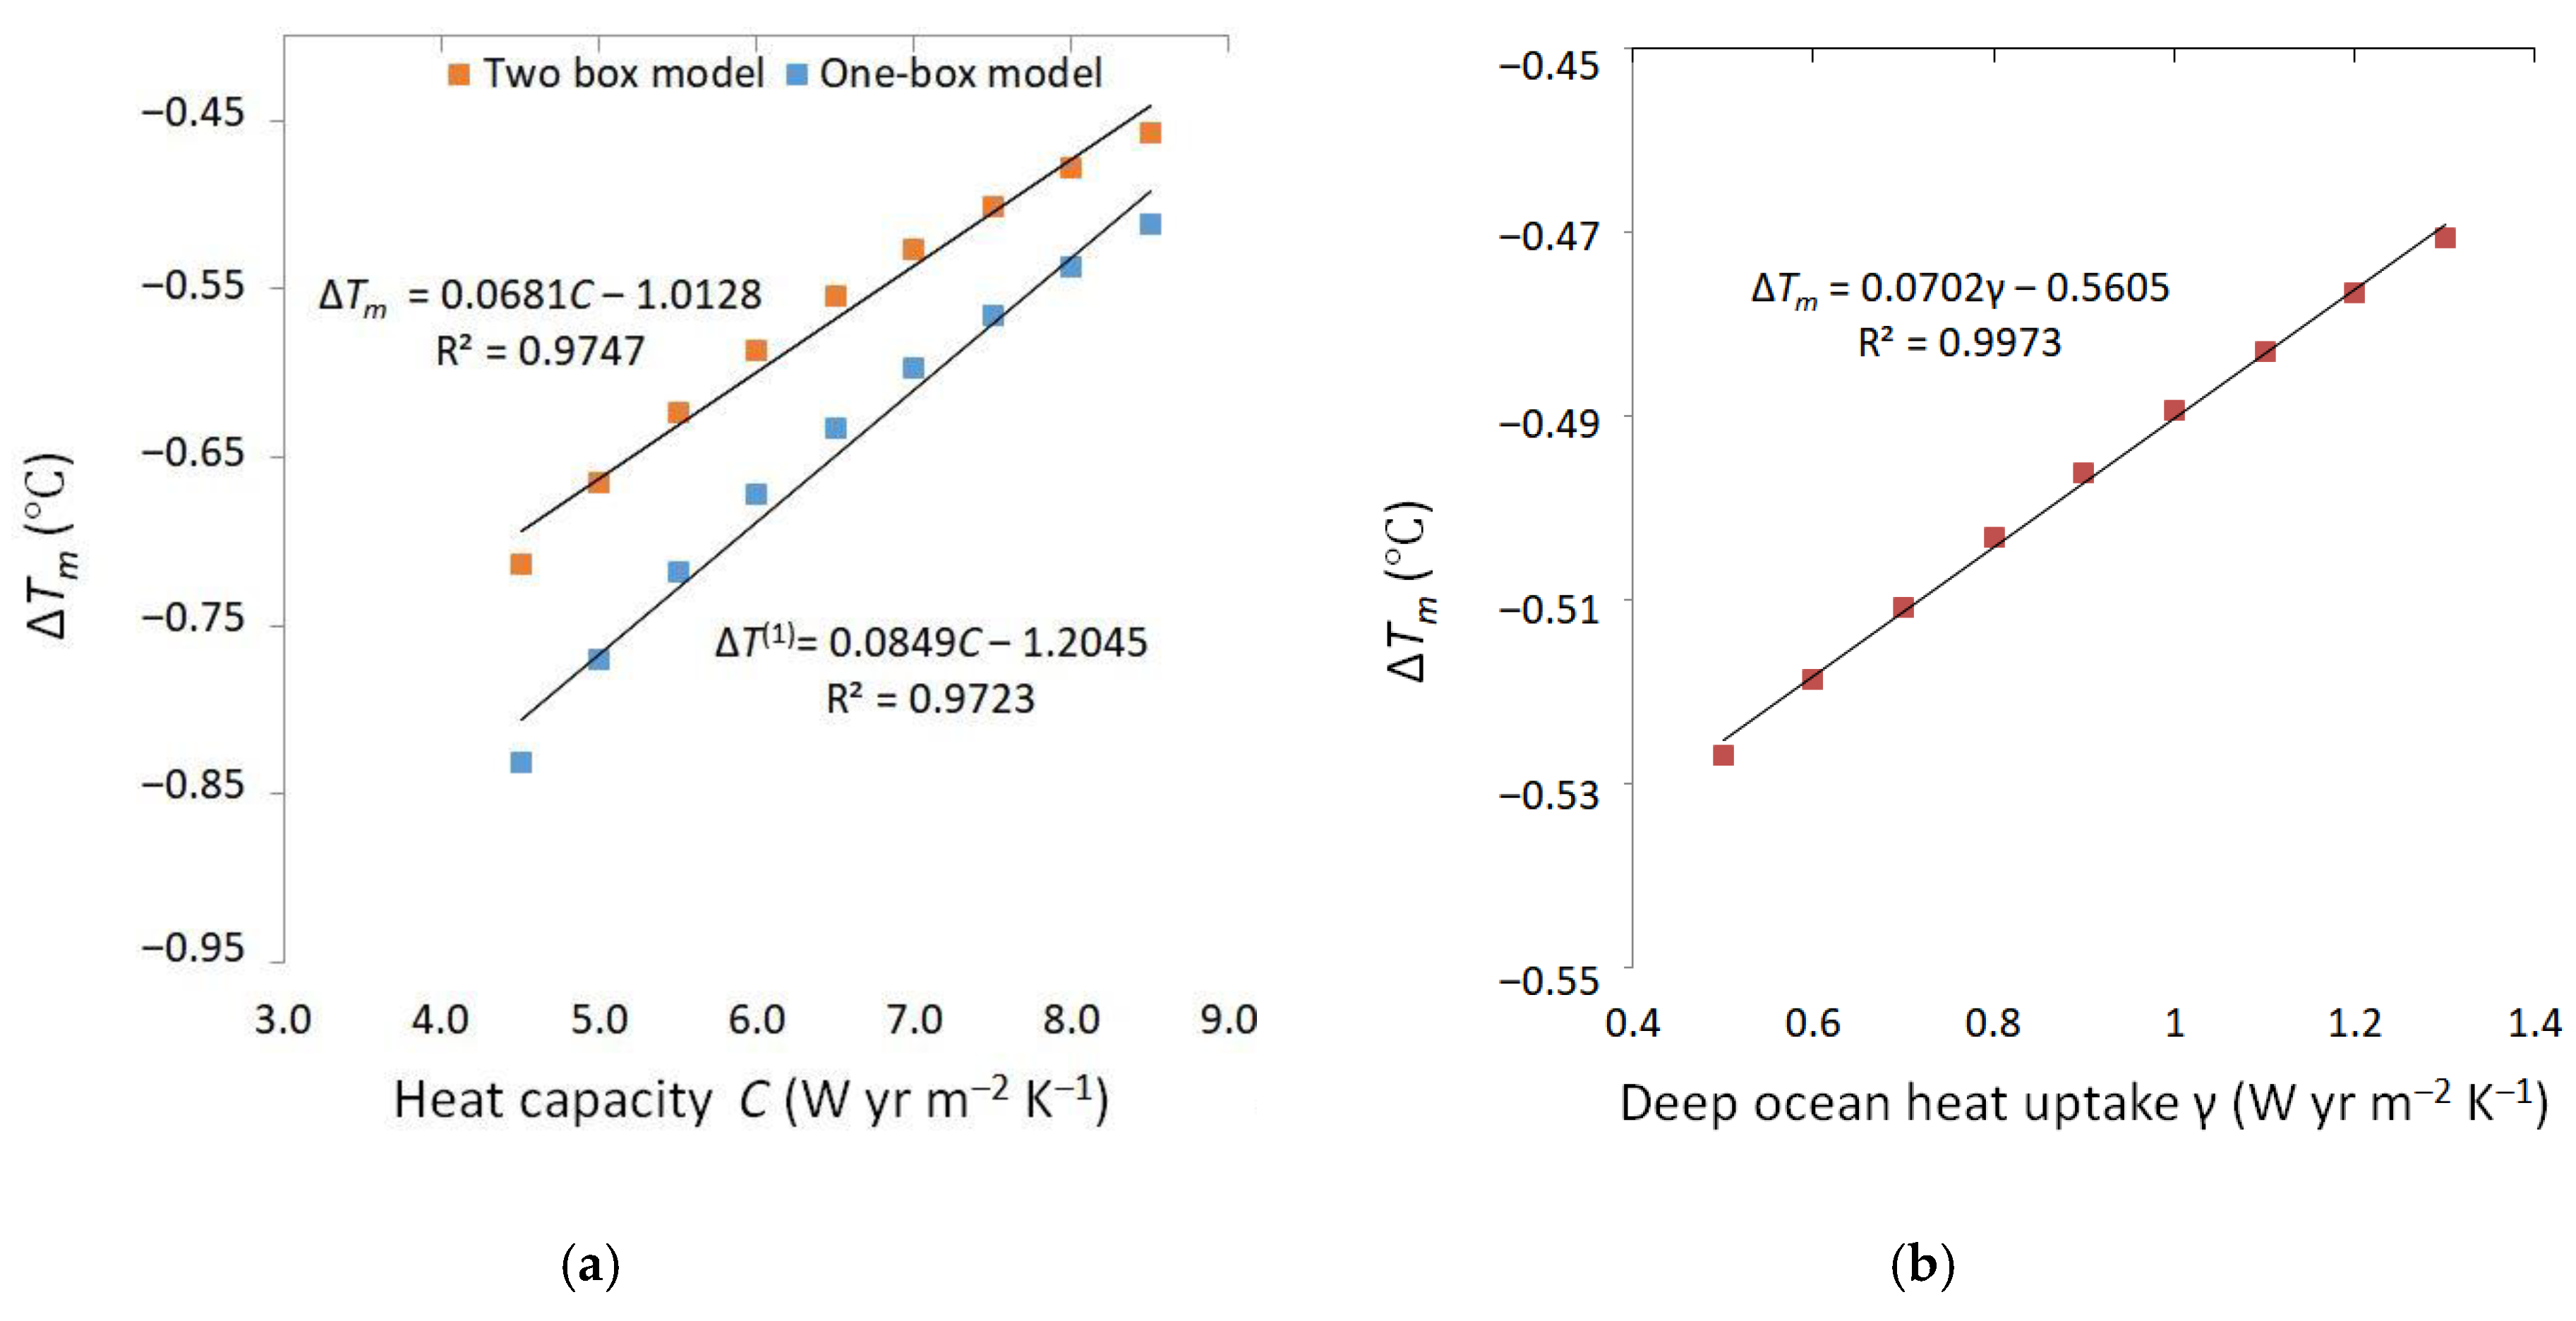
Using a similar approach, we can estimate the impact of uncertainties in each of the model parameters on the climate system response to volcanic stratospheric aerosol forcing, and thereby rank model parameters based on their relative contribution to the uncertainty in , as well as assess the relative role and importance of feedback parameter uncertainty in the overall model uncertainty. Figure 5 shows the dependences of on the effective heat capacity C of the upper box model (a) and on the deep-ocean heat uptake parameter γ (b). The corresponding sensitivity coefficients that characterize the influence of the uncertainties in parameters C and γ on the uncertainty in are, respectively, and . The sensitivity coefficient characterizing the response of a model to variations in the parameter is estimated at around . If the uncertainties , and are given, then we can estimate their effect on the uncertainty in using these sensitivity coefficients.
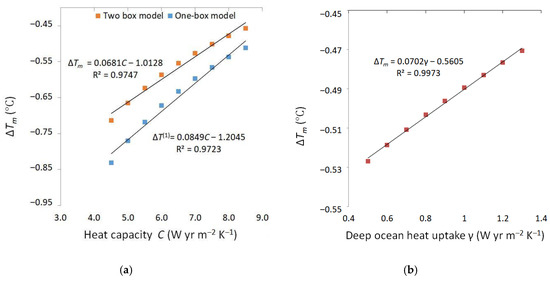
Figure 5.
Climate system response (°C) to volcanic aerosol radiative forcing as a function of (a) effective heat capacity and (b) deep-ocean heat uptake parameter .
Let us assume that all parameter values are known with some degree of uncertainty. Thus, each model parameter can be expressed in the standard form as , where is the base value of the parameter , and is the characteristic of the uncertainty range. For the sake of illustration, we consider the case when the uncertainty in each of the parameters is ±10% in relation to its base value, i.e., . Table 2 illustrates how the uncertain model parameters affect the uncertainty in model output . In other words, this table shows the effect of parameter uncertainties on variation in the global mean surface temperature anomaly . Analysis of this table suggests that the variations in caused by uncertainties in the parameters λ and γ are quantities of the same order of magnitude. The influence of uncertainty in the parameter C on variations in is about one order of magnitude greater than affects caused by and , whereas the influence of on is one order of magnitude less than affects due to and .

Table 2.
Absolute (°C) and relative (%) uncertainties in model output caused by ±10% uncertainty in model parameters.
The relative uncertainty in the model output due to the uncertainty in the parameter C is ~6 times as large as the relative uncertainty in due to the uncertainty in the feedback parameter , while the latter, in turn, is ~1.7 times as large as the relative uncertainty due to the uncertainty in the parameters γ. The uncertainty in deep-ocean heat capacity has a negligible influence on . These results provide some basis to suggest that the parameter C is the most influential model parameter and thus affects to the greatest extent. Parameters and γ rank second and third, respectively, followed by the parameter . This conclusion is accurate only if the range of uncertainty in all model parameters is given by the same fraction of the corresponding base parameter value (in our particular case we use a 10% uncertainty range). In fact, the range of uncertainty can vary from parameter to parameter. Thus, ranking the model parameters according to their degree of influence on the model output is not such a trivial problem as it might seem, and therefore requires special consideration. However, that important aspect is beyond the scope of our study. This paper seeks to only explore the influence of the uncertainty in radiative feedbacks on the variations in the magnitude of the global mean surface temperature anomaly due to radiative forcing generated by stratospheric aerosols.
4. Conclusions
In this paper, using the two-box EBM with several sets of parameter values that correspond to CMIP5 models, we have examined the effect of uncertainties in radiative feedbacks on the short-term response of the climate system to sharp radiative perturbation due to volcanic aerosols injected into the stratosphere by the 1991 Mount Pinatubo eruption. The impulse response method was applied to determine the globally averaged surface temperature anomalies that result from radiative forcing generated by volcanic stratospheric aerosols. We have considered two idealized forcing scenarios, one is linear and the other is step forcing, to show the computational accuracy of the impulse response technique. The global mean surface temperature anomalies in response to volcanic radiative forcing were estimated by considering 16 sets of EBM parameter values. The obtained quantitative estimates allow for the conclusion that the uncertainty inherent in feedbacks significantly affects the response of the climate system to volcanic aerosol forcing, thereby generating surface temperature uncertainties on short time scales. In addition, the effect of uncertainties in EBM parameters on the uncertainty in global mean surface temperature anomalies was estimated using a sensitivity analysis approach. However, care should be used in interpreting the results obtained, since the modelling framework is simple and idealized to a certain extent. Nevertheless, we expect that our approach and results obtained will be useful in providing a way to explore the effects of radiative feedbacks on the climate system response to external forcing whether of natural or man-made origin.
Funding
This research was partially funded by the Ministry of Science and Higher Education of the Russian Federation, grant number 0073-2019-0003.
Acknowledgments
I thank two anonymous reviewers for helpful comments.
Conflicts of Interest
The author declares no conflict of interest.
Appendix A
We rewrite the two-box model Equations (2) and (3) in the following form:
where
The system of liner Equations (A1) and (A2) can be represented in matrix from:
where
The matrix A can be factorized as
where is the square 2 × 2 matrix whose ith column is the eigenvector of , and is the diagonal matrix whose entries are the eigenvalues corresponding to the columns of :
Eigenvalues and can be found analytically:
The general solution to the homogeneous system corresponding to (A4) is given by
where , .
References
- Boucher, O.; Randall, D.; Artaxo, P.; Bretherton, C.; Feingold, G.; Forster, P.; Kerminen, V.-M.; Kondo, Y.; Liao, H.; Lohmann, U.; et al. Clouds and Aerosols. In Climate Change 2013: The Physical Science Basis. Contribution of Working Group I to the Fifth Assessment Report of the Intergovernmental Panel on Climate Change; Stocker, T.F., Qin, D., Plattner, G.-K., Tignor, M., Allen, S.K., Boschung, J., Nauels, A., Xia, Y., Bex, V., Midgley, P.M., Eds.; Cambridge University Press: Cambridge, UK; New York, NY, USA, 2013; pp. 571–657. [Google Scholar]
- Myhre, G.; Shindell, D.; Bréon, F.-M.; Collins, W.; Fuglestvedt, J.; Huang, J.; Koch, D.; Lamarque, J.-F.; Lee, D.; Mendoza, B.; et al. Anthropogenic and natural radiative forcing. In Climate Change 2013: The Physical Science Basis. Contribution of Working Group I to the Fifth Assessment Report of the Intergovernmental Panel on Climate Change; Stocker, T.F., Qin, D., Plattner, G.-K., Tignor, M., Allen, S.K., Boschung, J., Nauels, A., Xia, Y., Bex, V., Midgley, P.M., Eds.; Cambridge University Press: Cambridge, UK; New York, NY, USA, 2013; pp. 659–740. [Google Scholar]
- Matveev, L.T. General Meteorology Course. Atmospheric Physics; Hydrometeorological Publ.: St. Petersburg, Russia, 2000; p. 751. [Google Scholar]
- Hartmann, D.L. Global Physical Climatology. International Geophysics Series, Volume 56; Academic Press: New York, NY, USA, 1994; p. 412. [Google Scholar]
- Boucher, O. Atmospheric Aerosols: Properties and Climate Impacts; Springer: Dordrecht, The Netherlands, 2015; p. 328. [Google Scholar]
- Hansen, J.; Sato, M.; Ruedy, R.; Nazarenko, L.; Lacis, A.; Schmidt, G.A.; Russell, G.; Aleinov, I.; Bauer, M.; Bauer, S.; et al. Efficacy of climate forcing. J. Geophys. Res. 2005, 110, D18104. [Google Scholar] [CrossRef]
- Haywood, J.M. Atmospheric aerosols and their role in climate change. In Climate Change. Observed Impacts on Planet Earth, 2nd ed.; Letcher, T.M., Ed.; Elsevier: New York, NY, USA, 2016; pp. 449–463. [Google Scholar]
- Stenchikov, G.L. The role of volcanic activity in climate and global change. In Climate Change. Observed Impacts on Planet Earth, 2nd ed.; Letcher, T.M., Ed.; Elsevier: New York, NY, USA, 2016; pp. 419–447. [Google Scholar]
- Irvine, P.J.; Kravitz, B.; Lawrence, M.G.; Muri, H. An overview of the Earth system science of solar geoengineering. WIREs Clim. Chang. 2016, 7, 815–833. [Google Scholar] [CrossRef]
- Caldeira, K.; Bala, G. Reflecting on 50 years of geoengineering research. Earth Future 2017, 5, 1–17. [Google Scholar] [CrossRef]
- Soldatenko, S.A. Estimating the impact of artificially injected stratospheric aerosols on the global mean surface temperature in the 21th century. Climate 2018, 6, 85. [Google Scholar] [CrossRef]
- Soldatenko, S.A.; Yusupov, R.M. Optimal control for the process of using artificial sulfate aerosols for mitigating global warming. Atmos. Ocean. Optics 2019, 32, 55–63. [Google Scholar] [CrossRef]
- Meehl, G.A.; Stocker, T.F.; Collins, W.D.; Friedlingstein, P.; Gaye, A.T.; Gregory, J.M.; Kitoh, A.; Knutti, R.; Murphy, J.M.; Noda, A.; et al. Global Climate Projections. In Climate Change 2007: The physical science basis. Contribution of Working Group I to the Fourth Assessment Report of the Intergovernmental Panel on Climate Change; Solomon, S., Qin, D., Manning, M., Chen, Z., Marquis, M., Averyt, K.B., Tignor, M., Miller, H.L., Eds.; Cambridge University Press: Cambridge, UK, 2007; pp. 747–845. [Google Scholar]
- Collins, M.; Knutti, R.; Arblaster, J.; Dufresne, J.-L.; Fichefet, T.; Friedlingstein, P.; Gao, X.; Gutowski, W.J.; Johns, T.; Krinner, G.; et al. Long-term climate change: projections, commitments and irreversibility. In Climate Change 2013: The Physical Science Basis. Contribution of Working Group I to the Fifth Assessment Report of the Intergovernmental Panel on Climate Change; Stocker, T.F., Qin, D., Plattner, G.-K., Tignor, M., Allen, S.K., Boschung, J., Nauels, A., Xia, Y., Bex, V., Midgley, P.M., Eds.; Cambridge University Press: Cambridge, UK; New York, NY, USA, 2013; pp. 1029–1136. [Google Scholar]
- Flato, G.; Marotzke, J.; Abiodun, B.; Braconnot, P.; Chou, S.C.; Collins, W.; Cox, P.; Driouech, F.; Emori, S.; Eyring, V.; et al. Evaluation of Climate Models. In Climate Change 2013: The Physical Science Basis. Contribution of Working Group I to the Fifth Assessment Report of the Intergovernmental Panel on Climate Change; Stocker, T.F., Qin, D., Plattner, G.-K., Tignor, M., Allen, S.K., Boschung, J., Nauels, A., Xia, Y., Bex, V., Midgley, P.M., Eds.; Cambridge University Press: Cambridge, UK; New York, NY, USA, 2013; pp. 741–866. [Google Scholar]
- Bony, S.; Colman, R.A.; Kattsov, V.M.; Allan, R.P.; Bretherton, C.S.; Dufresne, J.-L.; Hall, A.; Hallegatte, S.; Holland, M.M.; Ingram, W.; et al. How well do we understand and evaluate climate change feedback processes? J. Clim. 2006, 19, 3445–3482. [Google Scholar] [CrossRef]
- Zelinka, M.D.; Klein, S.A.; Taylor, K.E.; Andrews, T.; Webb, M.J.; Gregory, J.M.; Forster, P.M. Contributions of different cloud types to feedbacks and rapid adjustments in CMIP5. J. Clim. 2013, 26, 5007–5027. [Google Scholar] [CrossRef]
- Colman, R.A. A comparison of climate feedback in general circulation models. Clim. Dyn. 2003, 20, 865–873. [Google Scholar] [CrossRef]
- Soldatenko, S.; Colman, R. Climate variability from annual to multi-decadal timescales in a two-layer stochastic energy balance model: analytic solutions and implications for general circulation models. Tellus A Dyn. Meteorol. Oceanogr. 2019, 71, 1–15. [Google Scholar] [CrossRef]
- Colman, R.; Soldatenko, S. Understanding the links between climate feedbacks, variability and change using a two-layer energy balance model. Clim. Dyn. 2020, 54, 3441–3459. [Google Scholar] [CrossRef]
- Loeb, N.G.; Su, W.; Kato, S. Understanding climate feedbacks and sensitivity using observations of Earth’s energy budget. Curr. Clim. Chang. Rep. 2016, 2, 170–178. [Google Scholar] [CrossRef] [PubMed]
- Soldatenko, S.A.; Yusupov, R.M. Estimating the influence of thermal inertia and feedbacks in the atmosphere-ocean system on the variability of the global surface air temperature. Atmos. Ocean. Phys. 2019, 55, 591–601. [Google Scholar] [CrossRef]
- Gregory, J.M.; Andrews, T. Variation in climate sensitivity and feedback parameters during the historical period. Geophys. Res. Lett. 2016, 43, 3911–3920. [Google Scholar] [CrossRef]
- Roe, G. Feedbacks, timescales and seeing red. Annu. Rev. Earth Planet. Sci. 2009, 37, 93–115. [Google Scholar] [CrossRef]
- Heinze, C.; Eyring, V.; Friedlingstein, P.; Jones, C.; Balkanski, Y.; Collins, W.; Fichefet, T.; Gao, S.; Hall, A.; Ivanova, D.; et al. ESD Reviews: Climate feedbacks in the Earth system and prospects for their evaluation. Earth Syst. Dyn. 2019, 10, 379–452. [Google Scholar] [CrossRef]
- Gregory, J.M.; Ingram, W.J.; Palmer, M.A.; Jones, G.S.; Stott, P.A.; Thorpe, R.B.; Lowe, J.A.; Johns, T.C.; Williams, K.D. A new method for diagnosing radiative forcing and climate sensitivity. Geophys. Res. Lett. 2004, 31, L03205. [Google Scholar] [CrossRef]
- Gregory, J.M.; Andrews, T.; Ceppi, P.; Mauritsen, T.; Webb, M.J. How accurately can the climate sensitivity to CO2 be estimated from historical climate change? Clim. Dyn. 2020, 54, 129–157. [Google Scholar] [CrossRef]
- Taylor, K.E.; Stouffer, R.J.; Meehl, G.A. An overview of the CMIP5 and the experimental design. Bull. Am. Meteorol. Soc. 2012, 93, 485–498. [Google Scholar] [CrossRef]
- Geoffroy, O.; Saint-Martin, D.; Olivié, D.J.L.; Voldoire, A.; Bellon, G.; Tytéca, S. Transient climate response in a two-layer energy-balance model. Part I: analytical solution and parameter calibration using CMIP5 AOGCM experiments. J. Clim. 2013, 26, 1841–1857. [Google Scholar] [CrossRef]
- Gregory, J.M. Vertical heat transports in the ocean and their effect on time-dependent climate change. Clim. Dyn. 2000, 16, 501–515. [Google Scholar] [CrossRef]
- Held, I.M.; Winton, M.; Takahashi, K.; Delworth, T.; Zeng, F.; Vallis, G.K. Probing the fast and slow components of global warming by returning abruptly to preindustrial forcing. J. Clim. 2010, 23, 2418–2427. [Google Scholar] [CrossRef]
- Hansen, J.; Sato, M.; Ruedy, R.; Lacis, A.; Asamoah, K.; Borenstein, S.; Brown, E.; Cairns, B.; Caliri, G.; Campbell, M.; et al. A Pinatubo climate modelling investigation. In The Mount Pinatubo Eruption Effects on the Atmosphere and Climate; Fiocco, G., Fuà, D., Visconti, G., Eds.; Springer: Berlin/Heidelberg, Germany, 1996; pp. 233–272. [Google Scholar]
- Karper, H.; Engler, H. Mathematics and Climate; SIAM: Philadelphia, PA, USA, 2013; p. 295. [Google Scholar]
- Hansen, J.; Lacis, A.; Rind, D.; Russell, G.; Stone, P.; Fung, I.; Ruedly, R.; Lerner, J. Climate sensitivity: analysis of feedback mechanisms. In Climate Processes and Climate Sensitivity; Hansen, J.E., Takahashi, T., Eds.; American Geophysical Union: Washington, DC, USA, 1984; pp. 130–163. [Google Scholar]
- Paynter, D.; Frölicher, T.L. Sensitivity of radiative forcing, ocean heat uptake, and climate feedback to changes in anthropogenic greenhouse gases and aerosols. J. Geophys. Res. Atmos. 2015, 120, 9837–9854. [Google Scholar] [CrossRef]
- Forcings in GISS Climate Models. Available online: https://data.giss.nasa.gov/modelforce/strataer/#References (accessed on 11 April 2020).
- Stenchikov, G.L.; Kirchner, I.; Robock, A.; Graf, H.-F.; Antuña, J.C.; Grainger, R.G.; Lambert, A.; Thomason, L. Radiative forcing from the 1991 Mount Pinatubo volcanic eruption. J. Geophys. Res. 1998, 103, 13837–13857. [Google Scholar] [CrossRef]
- Timmreck, C.; Mann, G.W.; Aquila, V.; Hommel, R.; Lee, L.A.; Schmidt, A.; Brühl, C.; Carn, S.; Chin, M.; Dhomse, S.S.; et al. The Interactive Stratospheric Aerosol Model Intercomparison Project (ISA-MIP): motivation and experimental design. Geosci. Model Dev. 2018, 11, 2581–2608. [Google Scholar] [CrossRef]
- Attenborough, M. Mathematics for Electrical Engineering and Computing; Elsevier: London, UK, 2003; p. 576. [Google Scholar]
- Soldatenko, S.A.; Yusupov, R.M. Model for estimating the transient response of the global mean surface temperature to changes in the concentrations of atmospheric aerosols and radiatively active gases. Atmos. Ocean. Opt. 2019, 32, 578–585. [Google Scholar] [CrossRef]
- Parker, D.E.; Wilson, H.; Jones, P.D.; Christy, J.R.; Folland, C.K. The impact of Mount Pinatubo on world-wide temperatures. Int. J. Climatol. 1996, 16, 487–497. [Google Scholar] [CrossRef]
- Soldatenko, S.; Steinle, P.; Tingwell, C.; Chichkine, D. Some aspects of sensitivity analysis in variational data assimilation for coupled dynamical systems. Adv. Meteorol. 2015, 2015, 753031. [Google Scholar] [CrossRef]
© 2020 by the author. Licensee MDPI, Basel, Switzerland. This article is an open access article distributed under the terms and conditions of the Creative Commons Attribution (CC BY) license (http://creativecommons.org/licenses/by/4.0/).

