Insignificant Impact of the “Stay-At-Home” Order on Ambient Air Quality in the Memphis Metropolitan Area, U.S.A.


Abstract
1. Introduction
2. Methods
3. Results
4. Discussion
5. Conclusions
Supplementary Materials
Author Contributions
Funding
Acknowledgments
Conflicts of Interest
References
- NASA. Airborne Nitrogen Dioxide Plummets Over China. Available online: https://earthobservatory.nasa.gov/images/146362/airborne-nitrogen-dioxide-plummets-over-china (accessed on 7 May 2020).
- IQAir. COVID-19 Air Quality Report: COVID-19 Impact on Air Quality in 10 Major Cities; IQAir: Staad, Switzerland, 2020. [Google Scholar]
- Isaifan, R.J. The dramatic impact of Coronavirus outbreak on air quality: Has it saved as much as it has killed so far? Glob. J. Environ. Sci. Manag. 2020, 6, 275–288. [Google Scholar] [CrossRef]
- USEPA. Air Data: Air Quality Data Collected at Outdoor Monitors Across the US. Available online: https://aqs.epa.gov/api (accessed on 5 May 2019).
- Duncan, B.N.; Prados, A.I.; Lamsal, L.N.; Liu, Y.; Streets, D.G.; Gupta, P.; Hilsenrath, E.; Kahn, R.A.; Nielsen, J.E.; Beyersdorf, A.J.; et al. Satellite data of atmospheric pollution for U.S. air quality applications: Examples of applications, summary of data end-user resources, answers to FAQs, and common mistakes to avoid. Atmos. Environ. 2014, 94, 647–662. [Google Scholar] [CrossRef]
- NASA’s Scientific Visualization Studio. Reductions in Nitrogen Dioxide Associated with Decreased Fossil Fuel use Resulting from COVID-19 Mitigation. Available online: https://svs.gsfc.nasa.gov/4810 (accessed on 11 May 2020).
- Schiermeier, Q. Why pollution is plummeting in some cities—But not others. Nature 2020, 580, 313. [Google Scholar] [CrossRef] [PubMed]
- ACI. Cargo Traffic 2017 FINAL (Annual). Available online: https://aci.aero/data-centre/annual-traffic-data/cargo/2017-cargo-summary-annual-traffic-data/ (accessed on 7 May 2020).
- TDOT. Traffic Maps. Available online: https://www.tn.gov/content/dam/tn/tdot/maps/2019-traffic-maps-with-aadt/Shleby%20Combined.pdf (accessed on 7 May 2020).
- WMC. Memphis, Shelby County Municipalities Issue ‘Safer-at-home’ Orders to Curb the Spread of COVID-19. Available online: https://www.wmcactionnews5.com/2020/03/23/mayor-issues-safer-home-order-memphis/ (accessed on 8 May 2020).
- WMC. Memphis Mayor Extends Safer-at-home Order into May. Available online: https://www.wmcactionnews5.com/2020/04/21/memphis-mayor-extends-safer-at-home-order-into-may/ (accessed on 8 May 2020).
- U.S. Census Bureau. QuickFacts: Crittenden County, Arkansas; DeSoto County, Mississippi; Shelby County, Tennessee. Available online: https://www.census.gov/quickfacts/fact/table/crittendencountyarkansas,desotocountymississippi,shelbycountytennessee/PST045219 (accessed on 28 May 2020).
- TDEC. TN Annual Monitoring Network Plan; Tennessee Department of Environment and Conservation: Nashville, TN, USA, 2019.
- U.S. Government. 40 CFR Appendix A to Part 58—Quality Assurance Requirements for Monitors used in Evaluations of National Ambient Air Quality Standards; Office of the Federal Register National Archives and Records Administration: Washington, DC, USA, 2019.
- NOAA. Climate Data Online: Dataset Discovery. Available online: https://www.ncdc.noaa.gov/cdo-web/datasets (accessed on 8 May 2020).
- NOAA. Global Historical Climate Network Daily-Description. Available online: https://www.ncdc.noaa.gov/ghcn-daily-description (accessed on 29 May 2020).
- Leard, B.; Linn, J.; Munnings, C. Explaining the evolution of passenger vehicle miles traveled in the United States. Energy J. 2019, 40, 25–54. [Google Scholar] [CrossRef]
- de Foy, B.; Schauer, J.J. Changes in speciated PM2.5 concentrations in Fresno, California, due to NOx reductions and variations in diurnal emission profiles by day of week. Elem. Sci. Anthr. 2019, 7. [Google Scholar] [CrossRef]
- Ravi, V.; Gao, A.H.; Martinkus, N.B.; Wolcott, M.P.; Lamb, B.K. Air quality and health impacts of an aviation biofuel supply chain using forest residue in the Northwestern United States. Environ. Sci. Technol. 2018, 52, 4154–4162. [Google Scholar] [CrossRef] [PubMed]
- Christoforou, C.S.; Salmon, L.G.; Hannigan, M.P.; Solomon, P.A.; Cass, G.R. Trends in fine particle concentration and chemical composition in Southern California. J. Air Waste Manag. Assoc. 2000, 50, 43–53. [Google Scholar] [CrossRef] [PubMed][Green Version]
- StreetLight Data. Daily County VMT. Available online: https://www.streetlightdata.com/VMT-monitor-by-county/#emergency-map-response (accessed on 8 May 2020).
- StreetLight Data. VMT Monitor—Methodology and Validation; StreetLight Data: San Francisco, CA, USA, 2020. [Google Scholar]
- Krudysz, M.A.; Froines, J.R.; Fine, P.M.; Sioutas, C. Intra-community spatial variation of size-fractionated PM mass, OC, EC, and trace elements in the Long Beach, CA area. Atmos. Environ. 2008, 42, 5374–5389. [Google Scholar] [CrossRef]
- Massoud, R.; Shihadeh, A.L.; Roumie, M.; Youness, M.; Gerard, J.; Saliba, N.; Zaarour, R.; Abboud, M.; Farah, W.; Saliba, N.A. Intraurban variability of PM10 and PM2.5 in an Eastern Mediterranean city. Atmos. Res. 2011, 101, 893–901. [Google Scholar] [CrossRef]
- USEPA. National Ambient Air Quality Standards (40 CFR part 50). Available online: https://www.epa.gov/criteria-air-pollutants/naaqs-table (accessed on 8 May 2020).
- Strickland, J. Civil Emergency Proclamation and Executive Order Extending and Amending Safer at Home Directive and Closure of Non-Essential Services and Businesses (No. 10-2020); City of Memphis: Memphis, TN, USA, 2020.
- USEPA. 2017 National Emissions Inventory (NEI) Data. Available online: https://www.epa.gov/air-emissions-inventories/2017-national-emissions-inventory-nei-data (accessed on 31 May 2020).
- Doraiswamy, P.; Davis, W.T.; Miller, T.L.; Fu, J.S. Source apportionment of fine particles in Tennessee using a source-oriented model. J. Air Waste Manag. Assoc. 2007, 57, 407–419. [Google Scholar] [CrossRef] [PubMed]
- Nopmongcol, U.; Alvarez, Y.; Jung, J.; Grant, J.; Kumar, N.; Yarwood, G. Source contributions to United States ozone and particulate matter over five decades from 1970 to 2020. Atmos. Environ. 2017, 167, 116–128. [Google Scholar] [CrossRef]
- USEPA. Our Nation’s Air 2019; U.S. Environmental Protection Agency: Washington, DC, USA, 2019.
- Xu, L.; Suresh, S.; Guo, H.; Weber, R.J.; Ng, N.L. Aerosol characterization over the southeastern United States using high-resolution aerosol mass spectrometry: Spatial and seasonal variation of aerosol composition and sources with a focus on organic nitrates. Atmos. Chem. Phys. 2015, 15, 7307–7336. [Google Scholar] [CrossRef]
- Lee, S.; Russell, A.G.; Baumann, K. Source apportionment of fine particulate matter in the Southeastern United States. J. Air Waste Manag. Assoc. 2007, 57, 1123–1135. [Google Scholar] [CrossRef] [PubMed]
- Arsenovic, P.; Rozanov, E.; Anet, J.; Stenke, A.; Schmutz, W.; Peter, T. Implications of potential future grand solar minimum for ozone layer and climate. Atmos. Chem. Phys. 2018, 18, 3469–3483. [Google Scholar] [CrossRef]
- Egorova, T.; Rozanov, E.; Arsenovic, P.; Sukhodolov, T. Ozone Layer Evolution in the Early 20th Century. Atmosphere 2020, 11, 169. [Google Scholar] [CrossRef]
- Seinfeld, J.H. Urban Air Pollution: State of the Science. Science 1989, 243, 745–752. [Google Scholar] [CrossRef] [PubMed]
- Atkinson, R. Atmospheric chemistry of VOCs and NOx. Atmos. Environ. 2000, 34, 2063–2101. [Google Scholar] [CrossRef]
- Gaudel, A.; Cooper, O.R.; Ancellet, G.; Barret, B.; Boynard, A.; Burrows, J.P.; Clerbaux, C.; Coheur, P.F.; Cuesta, J.; Cuevas, E.; et al. Tropospheric Ozone Assessment Report: Present-day distribution and trends of tropospheric ozone relevant to climate and global atmospheric chemistry model evaluation. Elem.-Sci. Anthrop. 2018, 6, 39. [Google Scholar] [CrossRef]
- Glanz, J.; Carey, B.; Holder, J.; Watkins, D.; Valentino-DeVries, J.; Rojas, R.; Leather, L. Where America Didn’t Stay Home Even as the Virus Spread. Available online: https://www.nytimes.com/interactive/2020/04/02/us/coronavirus-social-distancing.html (accessed on 12 May 2020).
- Shaver, K. “Quarantine Fatigue”: Researchers Find More Americans Venturing out against Coronavirus Stay-at-home Orders. Available online: https://www.washingtonpost.com/local/trafficandcommuting/quarantine-fatigue-researchers-find-more-americans-venturing-out-against-coronavirus-stay-at-home-orders/2020/04/25/fa1f01b2-84a3-11ea-a3eb-e9fc93160703_story.html (accessed on 13 May 2020).
- Woodall, G.M.; Smith, R.L. The Air Toxics Health Effects Database (ATHED). Toxicol. Appl. Pharmacol. 2008, 233, 20–24. [Google Scholar] [CrossRef] [PubMed]


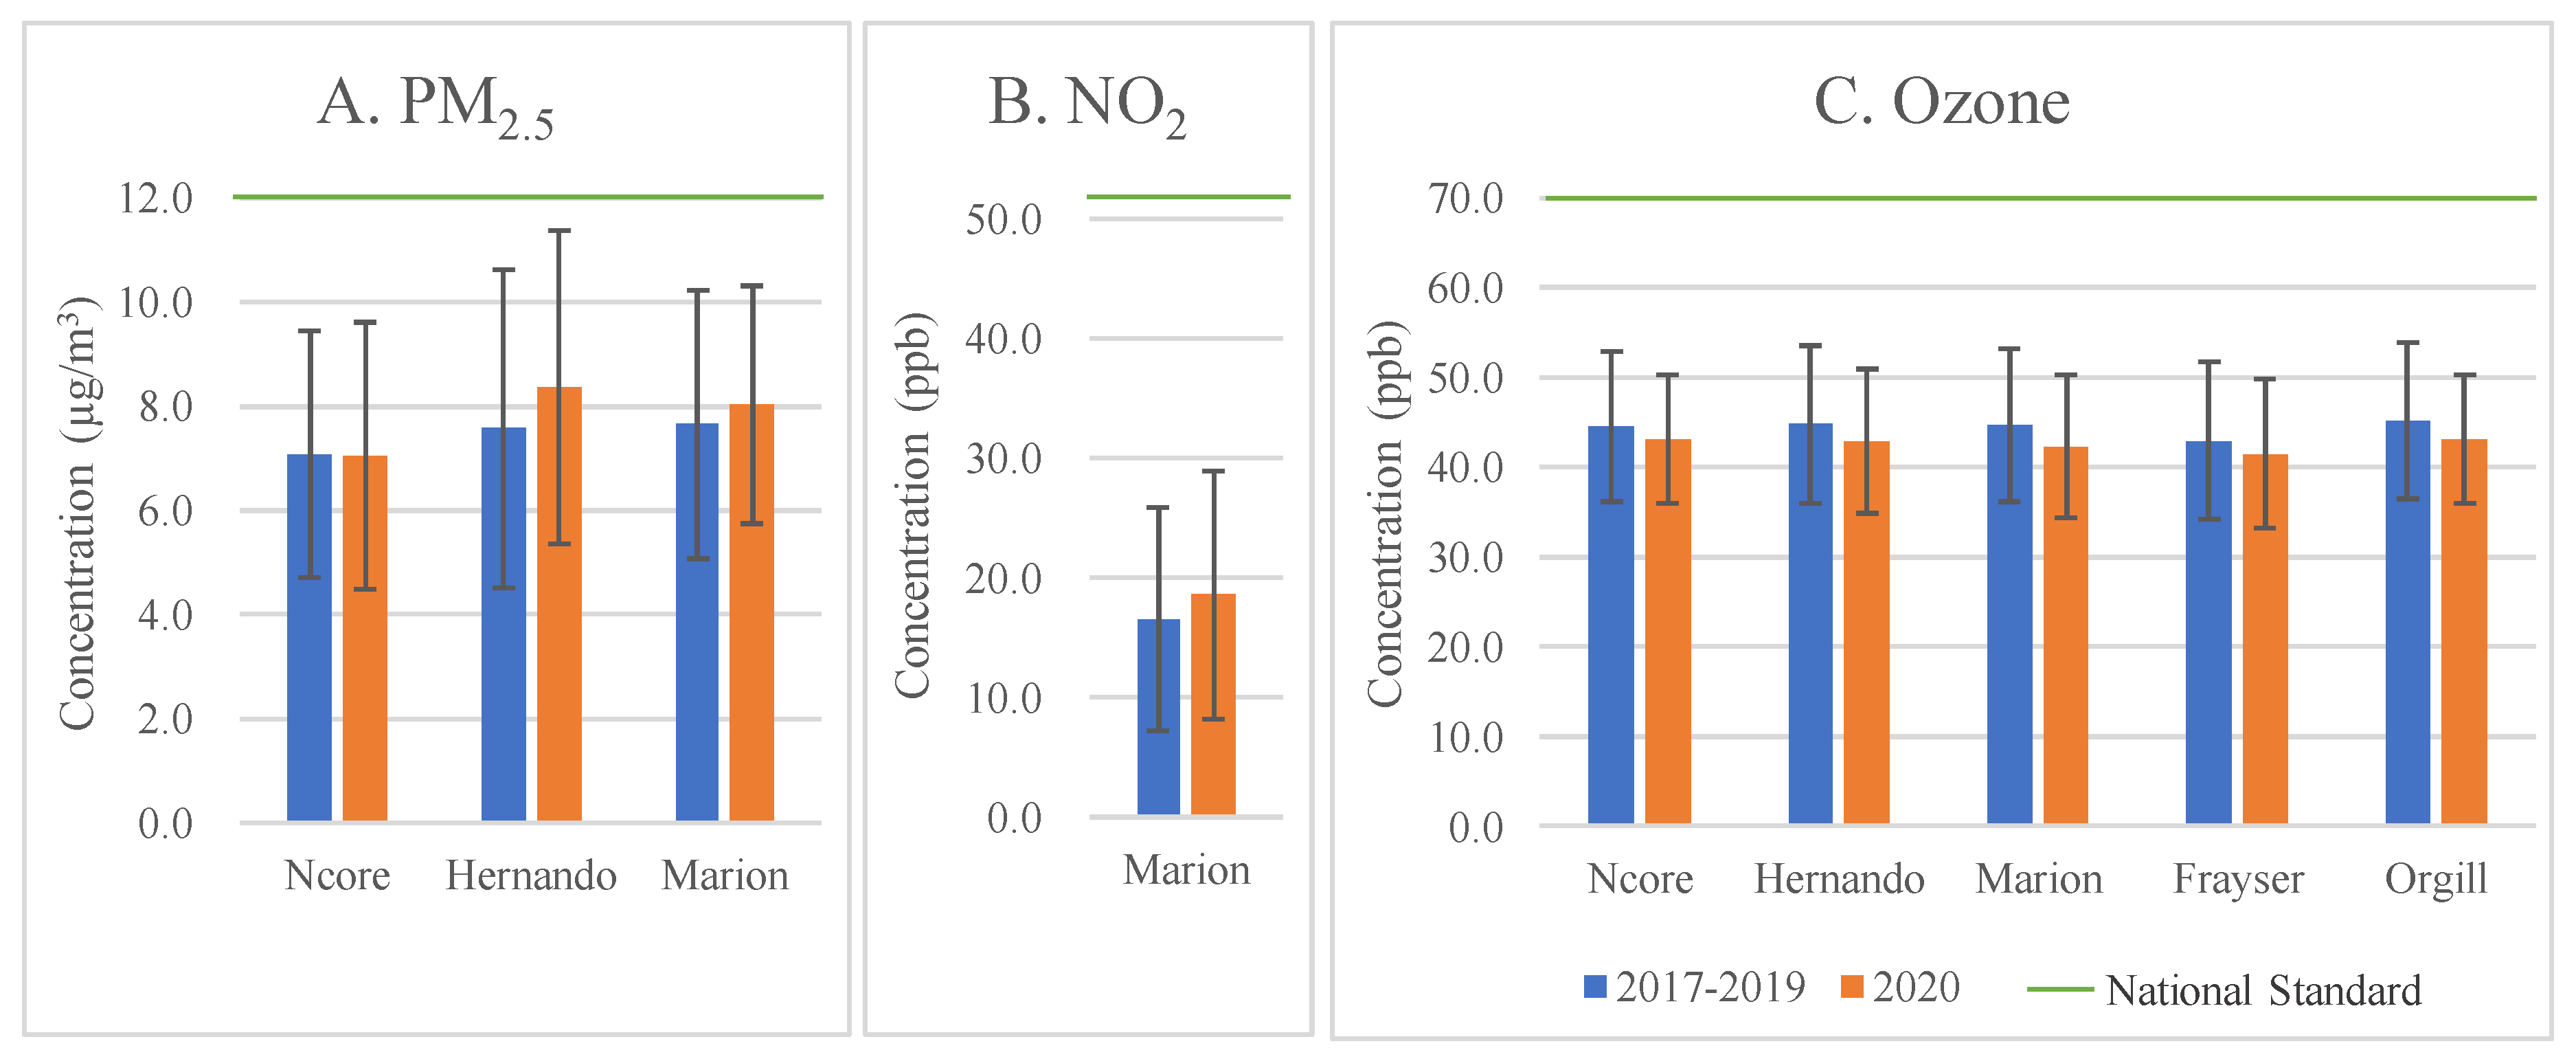
| Air Pollutant | PM2.5 (μg/m3) | NO2 (ppb) | Ozone (ppb) | ||||||
|---|---|---|---|---|---|---|---|---|---|
| Site | Ncore | Hernando | Marion | Marion | Ncore | Hernando | Marion | Frayser | Orgill |
| Lockdown (25 March–4 May, 2020) | |||||||||
| Mean (±SD) | 7.05 (±2.56) | 8.37 (±3.01) | 8.03 (±2.29) | 18.6 (±10.41) | 43.1 (±7.21) | 42.9 (±7.98) | 42.3 (±8.01) | 41.5 (±8.30) | 43.1 (±7.20) |
| Baseline (25 March–4 May, 2017–2019) | |||||||||
| Mean (±SD) | 7.08 (±2.37) | 7.57 (±3.06) | 7.65 (±2.57) | 16.5 (±9.37) | 44.6 (±8.33) | 44.8 (±8.80) | 44.7 (±8.52) | 43.0 (±8.75) | 45.2 (±8.77) |
| Crude model | |||||||||
| Lockdown (p-value) | −0.03 (0.94) | 0.80 (0.15) | 0.37 (0.41) | 2.05 (0.58) | −1.42 (0.33) | -1.83 (0.25) | −2.45 (0.11) | −1.49 (0.34) | −2.06 (0.18) |
| Full model | |||||||||
| Lockdown (p-value) | −0.12 (0.77) | 0.81 (0.13) | 0.56 (0.21) | 2.11 (0.51) | −1.71 (0.23) | −2.14 (0.16) | -3.06 (0.06) | −1.58 (0.30) | −2.10 (0.16) |
| Temperature (p-value) | 0.14 (<0.0001) | 0.07 (0.01) | 0.08 (0.0004) | −0.10 (0.26) | 0.02 (0.78) | −0.29 (0.0004) | −0.01 (0.9) | −0.01 (0.89) | −0.02 (0.80) |
| Wind speed (p-value) | −0.04 (0.55) | 0.02 (0.77) | 0.08 (0.14) | −1.18 (<0.0001) | −0.24 (0.23) | 0.04 (0.86) | −0.08 (0.67) | −0.02 (0.91) | 0.01 (0.96) |
| Precipitation (p-value) | -0.40 (0.26) | −1.93 (<0.0001) | −1.11 (0.004) | −2.37 (0.09) | −4.50 (0.0004) | −4.11 (0.0036) | −2.83 (0.034) | −4.77 (0.0004) | −4.18 (0.002) |
| Pearson Correlation Coefficient (R) | ||||
|---|---|---|---|---|
| Site | Ncore | Hernando | Marion | |
| COD | Ncore | 0.77 | 0.82 | |
| Hernando | 0.13 | 0.80 | ||
| Marion | 0.10 | 0.11 | ||
| Pearson Correlation Coefficient (R) | ||||||
|---|---|---|---|---|---|---|
| Site | Ncore | Hernando | Marion | Frayser | Orgill | |
| COD | Ncore | 0.96 | 0.94 | 0.96 | 0.95 | |
| Hernando | 0.04 | 0.90 | 0.92 | 0.90 | ||
| Marion | 0.04 | 0.05 | 0.97 | 0.95 | ||
| Frayser | 0.04 | 0.05 | 0.03 | 0.96 | ||
| Orgill | 0.03 | 0.05 | 0.03 | 0.04 | ||
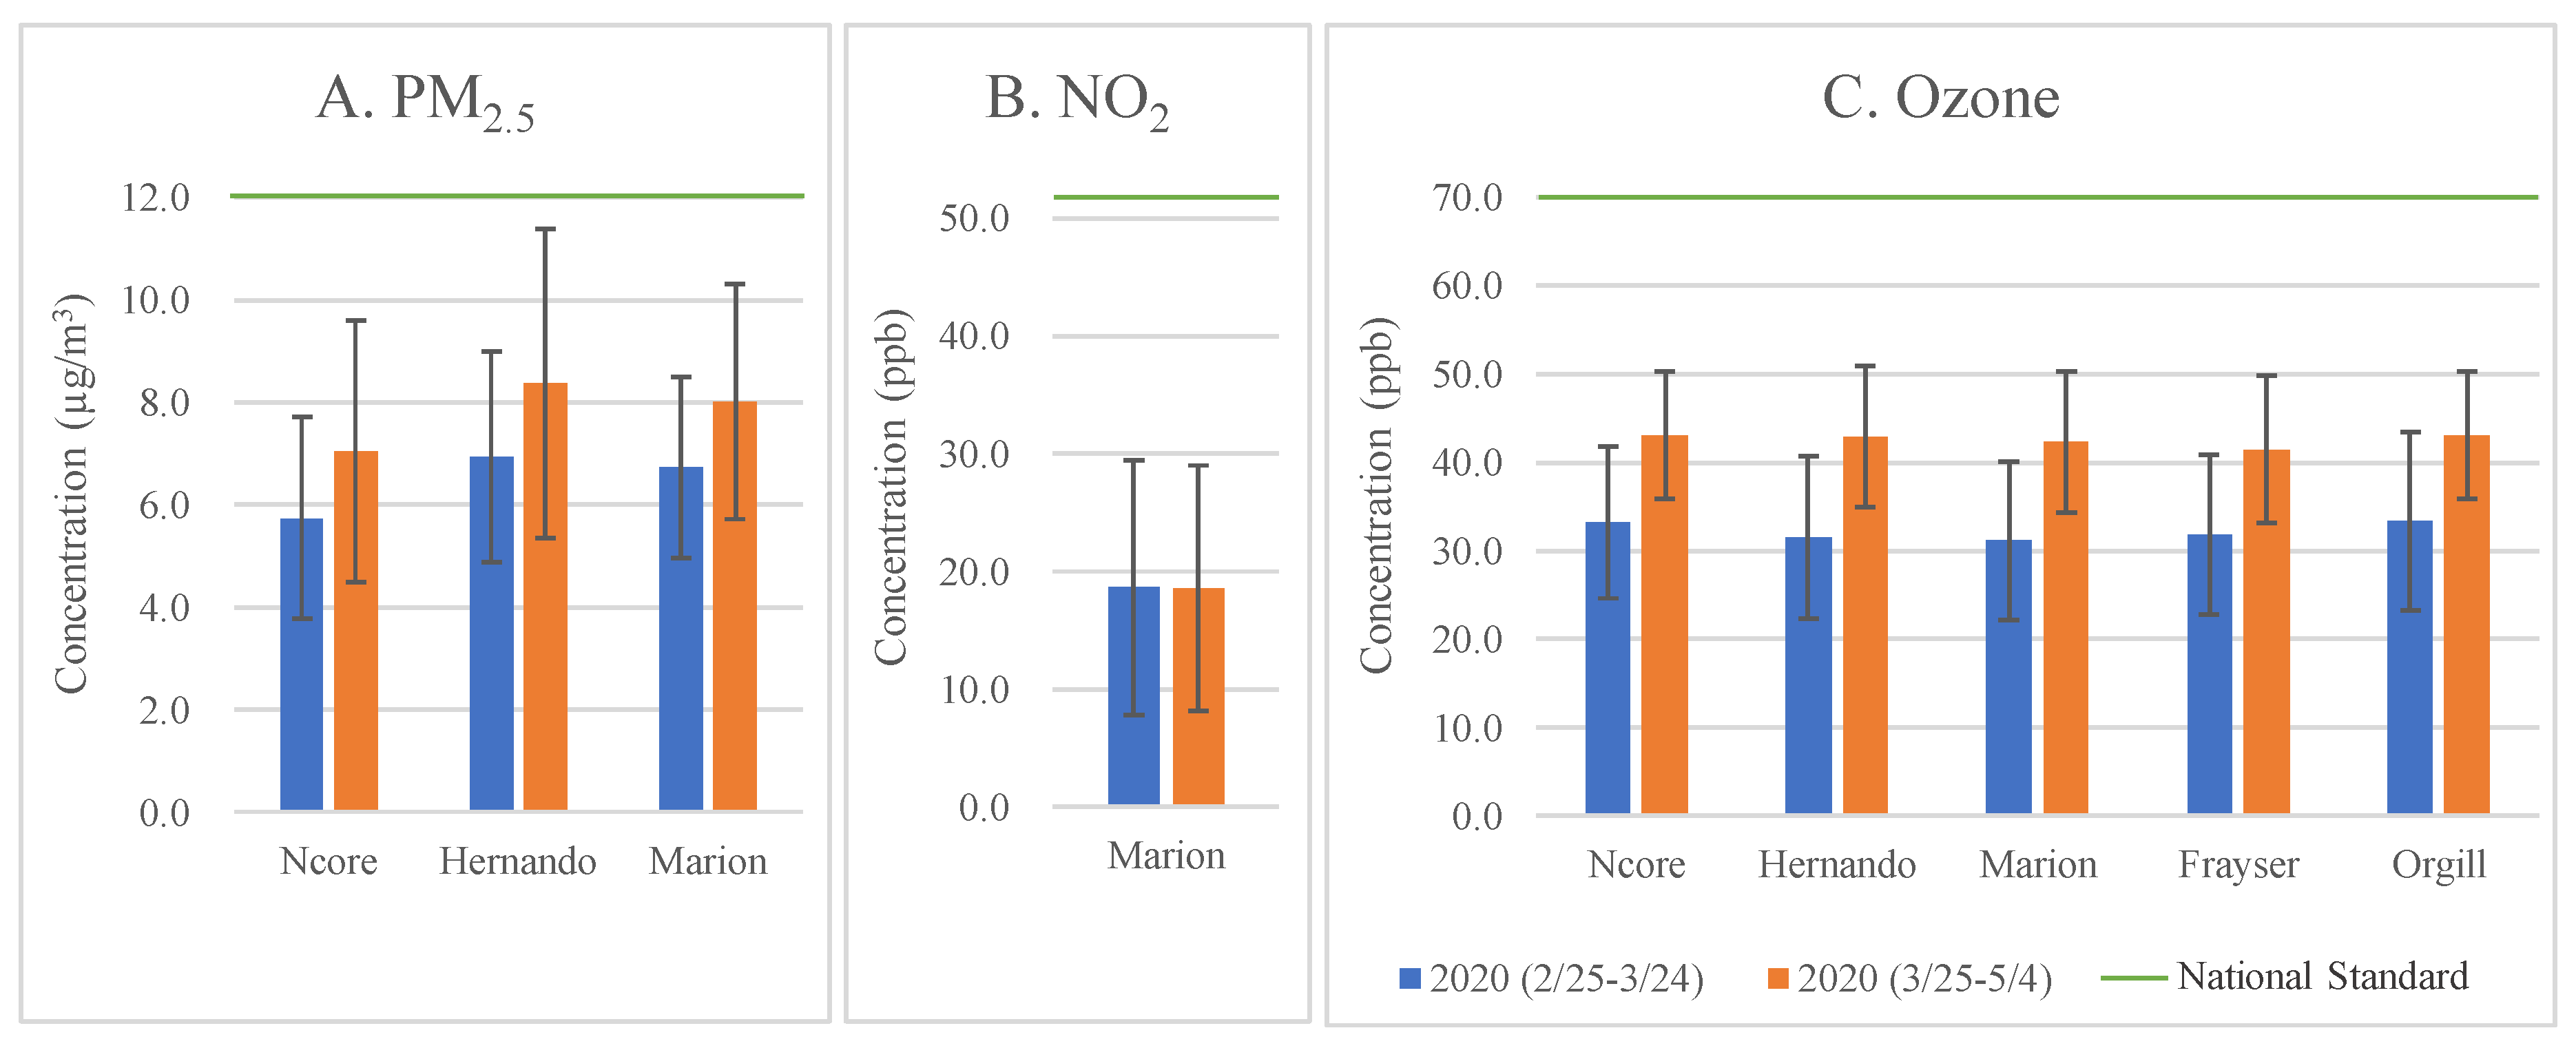
| Air Pollutants | PM2.5 (μg/m3) | NO2 (ppb) | Ozone (ppb) | ||||||
|---|---|---|---|---|---|---|---|---|---|
| Site | Ncore | Hernando | Marion | Marion | Ncore | Hernando | Marion | Frayser | Orgill |
| Lockdown (25 March–4 May, 2020) | |||||||||
| Mean (±SD) | 7.05 (±2.56) | 8.37 (±3.01) | 8.03 (±2.29) | 18.6 (±10.41) | 43.1 (±7.21) | 42.9 (±7.98) | 42.3 (±8.01) | 41.5 (±8.30) | 43.1 (±7.20) |
| Prior month (25 February–24 March, 2020) | |||||||||
| Mean (±SD) | 5.75 (±1.96) | 6.94 (±2.05) | 6.70 (±1.77) | 18.7 (±10.9) | 33.2 (±8.56) | 31.6 (±9.19) | 31.2 (±8.95) | 31.8 (±9.07) | 33.3 (±10.1) |
| Crude model | |||||||||
| Lockdown (p-value) | 1.30 (0.03) | 1.42 (0.03) | 1.30 (0.01) | −0.08 (0.99) | 9.97 (<0.0001) | 11.3 (<0.0001) | 11.1 (<0.0001) | 9.67 (<0.0001) | 9.78 (<0.0001) |
| Full model | |||||||||
| Lockdown (p-value) | −0.03 (0.95) | 0.23 (0.75) | 0.52 (0.39) | 0.92 (0.85) | 11.6 (<0.0001) | 14.2 (<0.0001) | 13.2 (<0.0001) | 11.9 (<0.0001) | 11.3 (<0.0001) |
| Temperature (p-value) | 0.17 (<0.0001) | 0.13 (0.006) | 0.10 (0.008) | −0.06 (0.79) | −0.21 (0.12) | −0.42 (0.02) | −0.31 (0.03) | −0.30 (0.06) | −0.18 (0.24) |
| Wind speed (p-value) | −0.11 (0.24) | −0.16 (0.17) | 0.03 (0.71) | −1.57 (0.005) | 0.45 (0.19) | 0.74 (0.07) | 0.57 (0.11) | 0.78 (0.04) | 0.55 (0.15) |
| Precipitation (p-value) | −0.16 (0.79) | −1.29 (0.07) | −0.73 (0.25) | −1.35 (0.76) | −5.48 (0.02) | −2.43 (0.30) | −3.77 (0.14) | −6.55 (0.009) | −4.67 (0.06) |
© 2020 by the authors. Licensee MDPI, Basel, Switzerland. This article is an open access article distributed under the terms and conditions of the Creative Commons Attribution (CC BY) license (http://creativecommons.org/licenses/by/4.0/).
Share and Cite
Jia, C.; Fu, X.; Bartelli, D.; Smith, L. Insignificant Impact of the “Stay-At-Home” Order on Ambient Air Quality in the Memphis Metropolitan Area, U.S.A. Atmosphere 2020, 11, 630. https://doi.org/10.3390/atmos11060630
Jia C, Fu X, Bartelli D, Smith L. Insignificant Impact of the “Stay-At-Home” Order on Ambient Air Quality in the Memphis Metropolitan Area, U.S.A. Atmosphere. 2020; 11(6):630. https://doi.org/10.3390/atmos11060630
Chicago/Turabian StyleJia, Chunrong, Xianqiang Fu, Debra Bartelli, and Larry Smith. 2020. "Insignificant Impact of the “Stay-At-Home” Order on Ambient Air Quality in the Memphis Metropolitan Area, U.S.A." Atmosphere 11, no. 6: 630. https://doi.org/10.3390/atmos11060630
APA StyleJia, C., Fu, X., Bartelli, D., & Smith, L. (2020). Insignificant Impact of the “Stay-At-Home” Order on Ambient Air Quality in the Memphis Metropolitan Area, U.S.A. Atmosphere, 11(6), 630. https://doi.org/10.3390/atmos11060630