Article

Impacts of Tree Canopy Cover on Microclimate and Human Thermal Comfort in a Shallow Street Canyon in Wuhan, China

1
College of Horticulture and Forestry Sciences, Huazhong Agricultural University, Wuhan 430070, China
2
Key Laboratory of Urban Agriculture in Central China, Ministry of Agriculture and Rural Affairs, Wuhan 430070, China
3
State Key Laboratory of Subtropical Building Science, South China University of Technology, Guangzhou 510640, China
4
School of Architecture, Harbin Institute of Technology (Shenzhen), Shenzhen 518055, China
*
Author to whom correspondence should be addressed.
Atmosphere 2020, 11(6), 588; https://doi.org/10.3390/atmos11060588
Submission received: 22 April 2020 / Revised: 30 May 2020 / Accepted: 2 June 2020 / Published: 3 June 2020
(This article belongs to the Special Issue Public Health Impacts of Climate Change)

Abstract

:
Increasing the number of street trees can be a promising method to reduce impacts of climate change currently impacting urban public health. However, the quantitative relationships between tree canopy cover and thermal comfort remains unclear, particularly in areas with high temperature and high humidity. This study aims to provide a better understanding of the effects of different degrees of tree canopy cover on human thermal comfort in shallow street canyons in a high temperature, high humidity area of China. Microclimatic measurements and qualitative surveys were conducted on sunny summer days in a shallow street canyon in Wuhan. The results suggest that microclimate benefits are greater for areas with a high-percentage tree canopy cover compared to medium- and low-percentage tree canopy cover—especially at noon. In streets with a high-percentage tree canopy cover, afternoon air temperatures and mean radiant temperatures can be reduced by up to 3.3 °C and 13.9 °C, respectively, compared to a similar street with no tree shade. The thermal sensation prediction formula is proposed and the relationship between human thermal sensation and microclimate factors is established. Blocking solar radiation and increasing wind speed are more feasible than controlling air temperature and humidity as ways to improve human thermal comfort.

1. Introduction

In the context of global warming and rapid urbanization, the thermal comfort of cities has become particularly important. Severe heat has a negative impact on public health and also greatly reduces the use of outdoor spaces and activities that can be undertaken [1,2]. Knez and Thorsson [3] demonstrated that when the level of thermal comfort is within an acceptable range, people tend to stay outdoors for a longer period of time (average 19–21 min). In contrast, when thermal comfort exceeds the optimal range, people stay outdoors for a short time (average 11 min). Good thermal comfort helps to improve the vitality of a street and has become an important indicator of its walking potential. Hence, it is increasingly important to consider thermal comfort in street design.
The ability of street trees to reduce temperature and improve thermal comfort has been well documented [4,5,6,7,8,9]. Armson et al. [4] noted that dense and tall canopy reduced the surface temperature by 12 °C and the mean radiant temperature by 4 °C in streets of Manchester, United Kingdom. The difference between the physiologically equivalent temperature (PET), where PET is defined as the equivalent to the air temperature in a typical indoor setting at which the heat balance of the human body is maintained with core and skin temperatures equal to those under the conditions being assessed, in a tree shaded area and a non-tree shaded area can reach 15 °C [10,11]. Trees have a greater effect on thermal comfort in shallow street canyons than in deep street canyons. Shashua-Bar et al. [12] indicated that when tree coverage was 70%, the air temperatures in shallow and deep street canopies (height-to-width ratio (H/W) is 0.25 and 2.0 respectively) decreased by 2.81 °C and 1.33 °C, respectively.
While the physical benefits of street tree canopy cover on thermal comfort are generally recognized, it is difficult to predict how different degrees of street tree canopy cover influence perceived thermal comfort, i.e., how a person senses and experiences physical thermal conditions [13,14,15]. Previous studies have demonstrated that individual aspects (e.g., gender, age) [16,17], behavioral aspects (e.g., clothing, level of activity, location) [18] and psychological aspects (e.g., thermal expectations, long- and short-term experiences, transient exposure, perceived control) [19,20] can affect the level of perceived thermal comfort.
Most studies have been conducted mostly by transverse questionnaire surveys, where a large number of subjects are interviewed under different environmental conditions to provide a statistically estimated thermal sensation of an average person under static climatic conditions [21,22,23,24]. The transverse approach has advantages including large sample sizes and relatively accurate results. However, the randomness of the subjects’ lifestyles and background conditions is relatively large, hence it is difficult to fully determine its accuracy [25]. In the longitudinal approach, a specific target group can be selected, and it can be expected to have a certain understanding of the research content in the test environment and can also eliminate the impact of individual differences. In a longitudinal experiment, the thermal sensations of a relatively small number of subjects over different environmental conditions are followed and evaluated [26]. This enables the detections of any changes in thermal sensation over varying climatic conditions. This method has been adopted in studies in other countries such as Japan, Israel and Hong Kong [26,27,28].
Summers in Wuhan, China are typically long, hot and humid. Rapid urbanization in Wuhan has resulted in long-term climatic issues [29]. In 2007, the large cities climate leadership group signed a cooperative agreement with Wuhan for climate-adaptive city construction which will provide technical and platform support, in addition to supporting city in becoming a national climate adaptability pilot city [30]. Therefore, it is of great significance to understand the effects of tree canopy cover on human thermal comfort in the summer in Wuhan. This information can assist in developing guidelines and understanding the implications for tree planting design and planning for the management of climate problems.
This study aims to provide a better understanding of the effects of different degrees of tree canopy cover on human thermal comfort in shallow street canyons in a high-temperature and high-humidity area of China. The results can help determine the most appropriate method for future tree planting. This will improve human thermal comfort and reduce the impacts of climate change, while protecting public health. To comprehensively describe the impact of tree canopy cover on human thermal comfort, we combined an investigation on physical thermal conditions with that of perceived thermal comfort. An on-site survey of a shallow street was conducted using a combination of subjective measurement of thermal comfort with measurements of the physical thermal environment. For the subjective investigation of thermal comfort, the longitudinal method was used, and this method provided information that cannot be obtained through the conventional transverse survey. The study aimed to determine (1) changes in microclimate parameters (air temperature (Ta), relative humidity (RH), wind speed (WS) and mean radiant temperature (Tmrt)) under different street tree canopy cover during the day; (2) the impact of different street tree canopy cover on human thermal comfort and (3) the relationship between thermal sensation and microclimate. Figure 1 illustrates the flow chart of research framework in data collection, results and discussion.

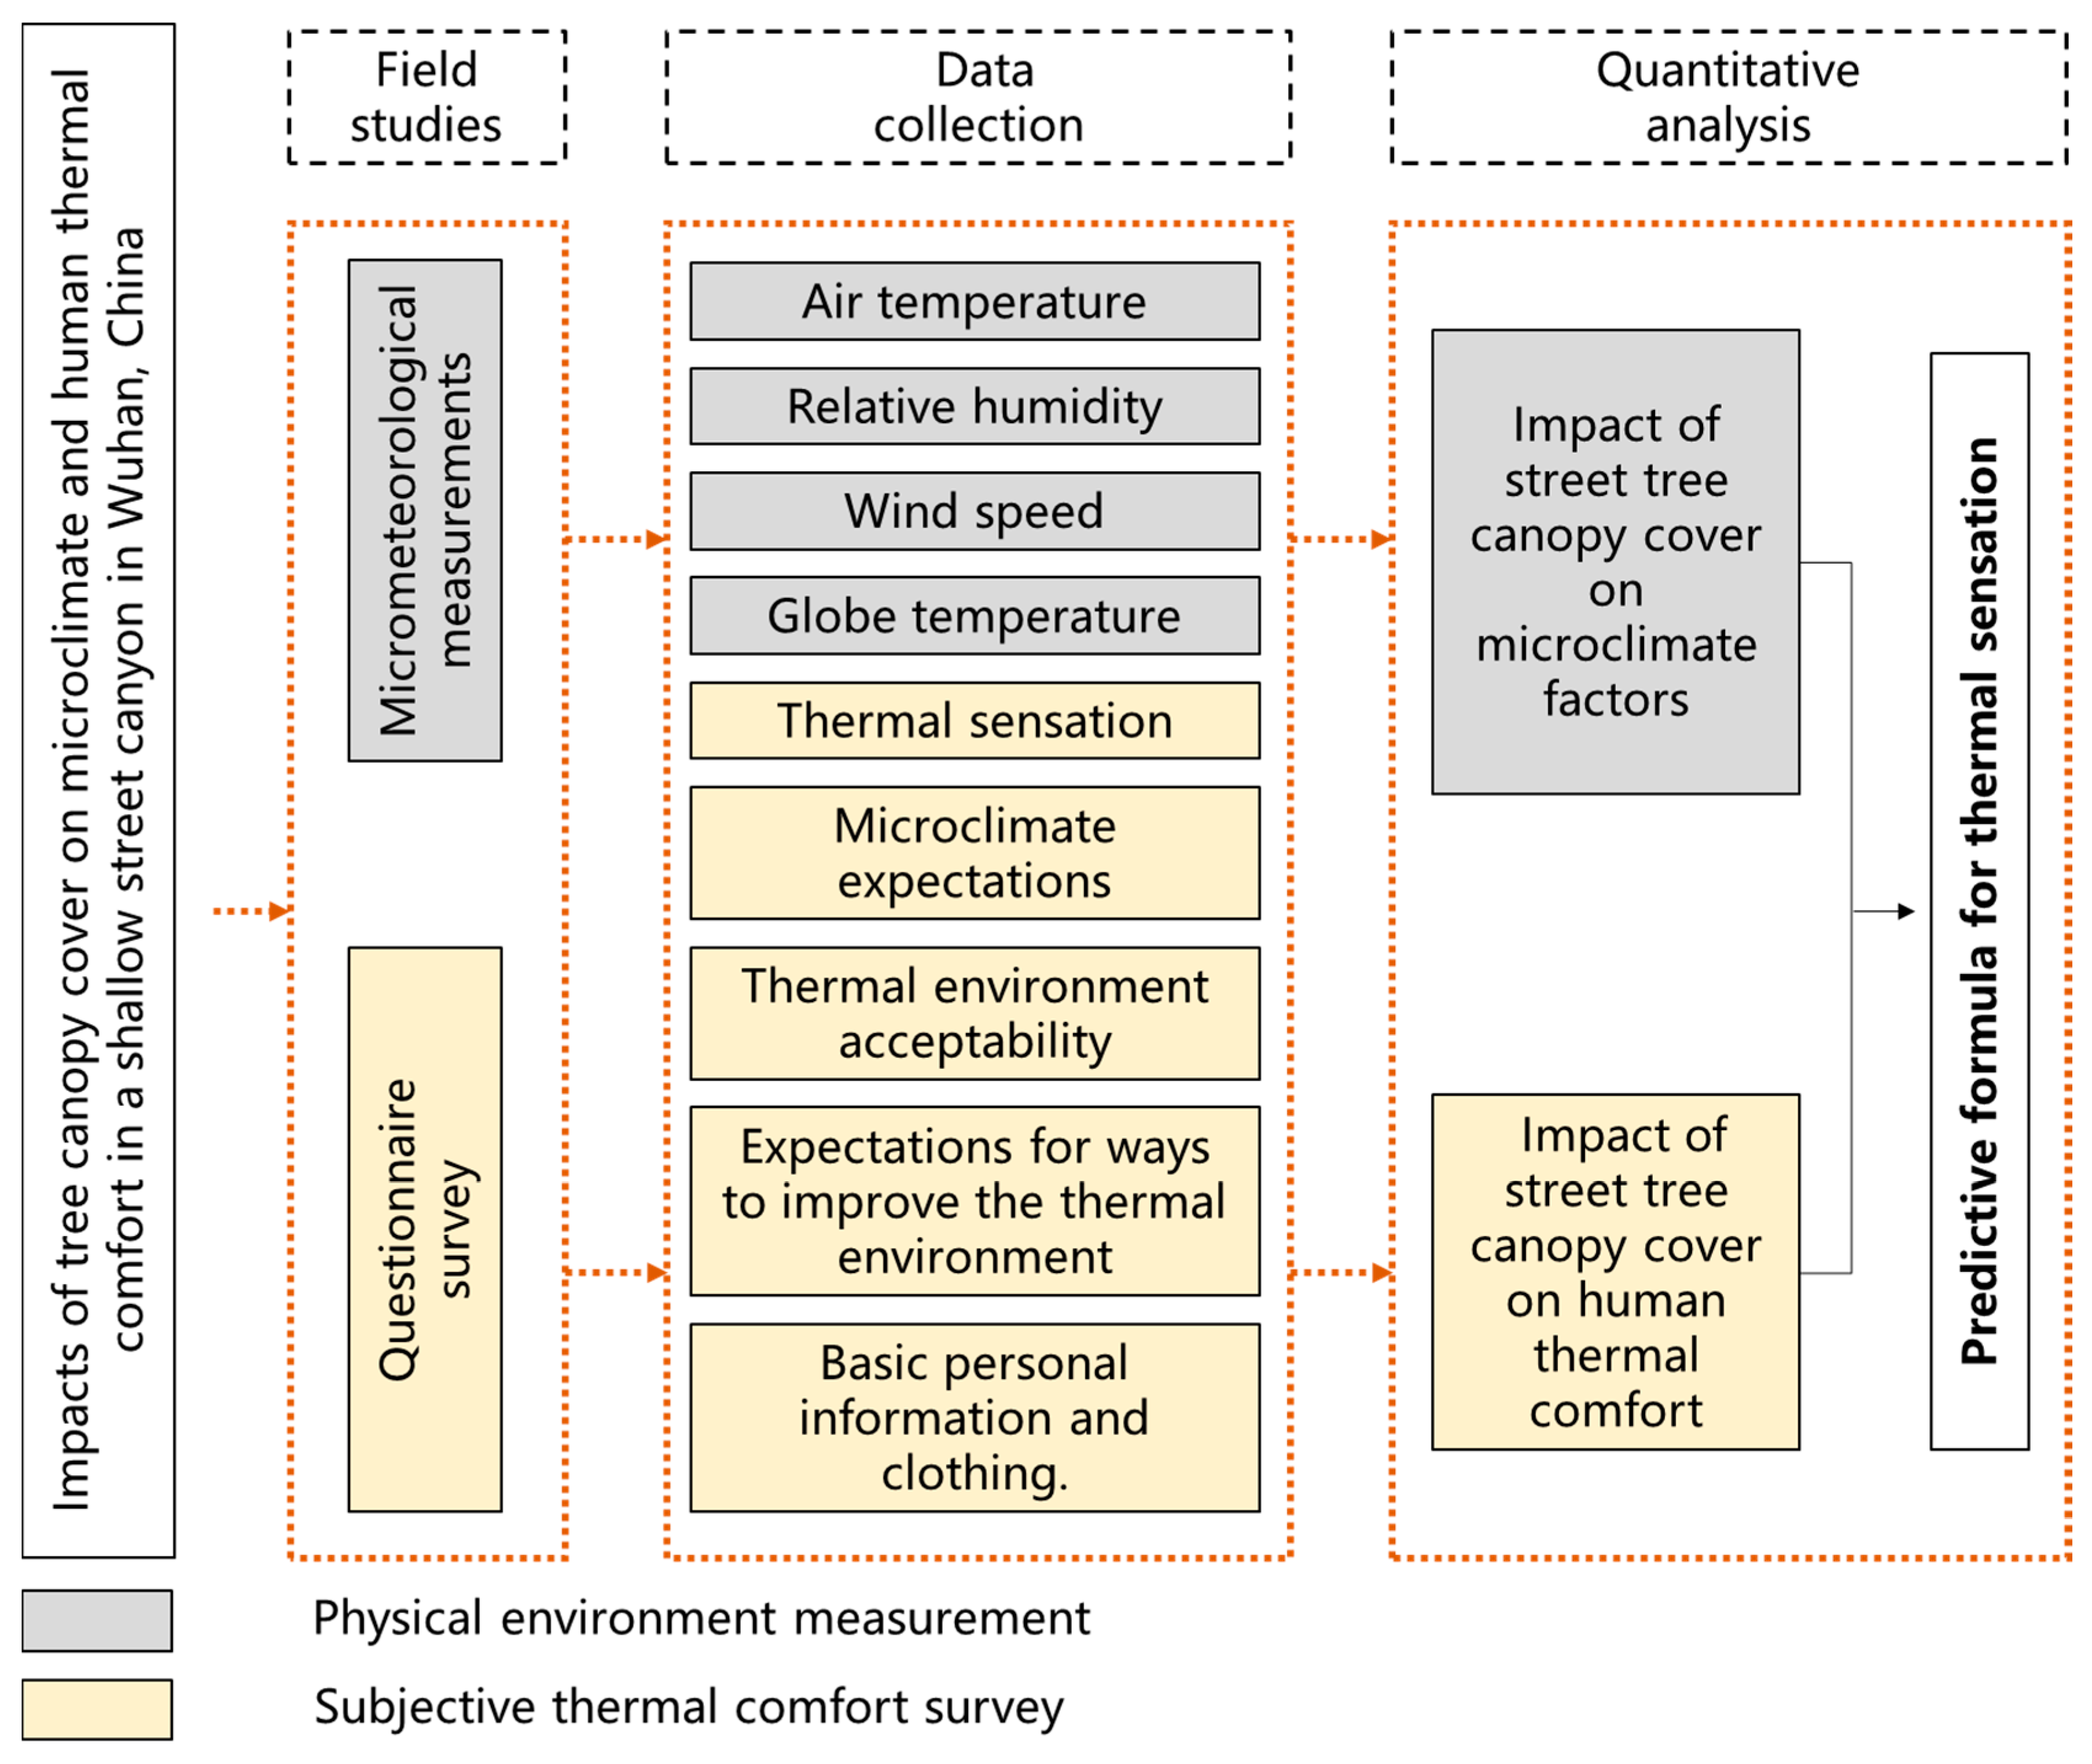
2. Materials and Methods

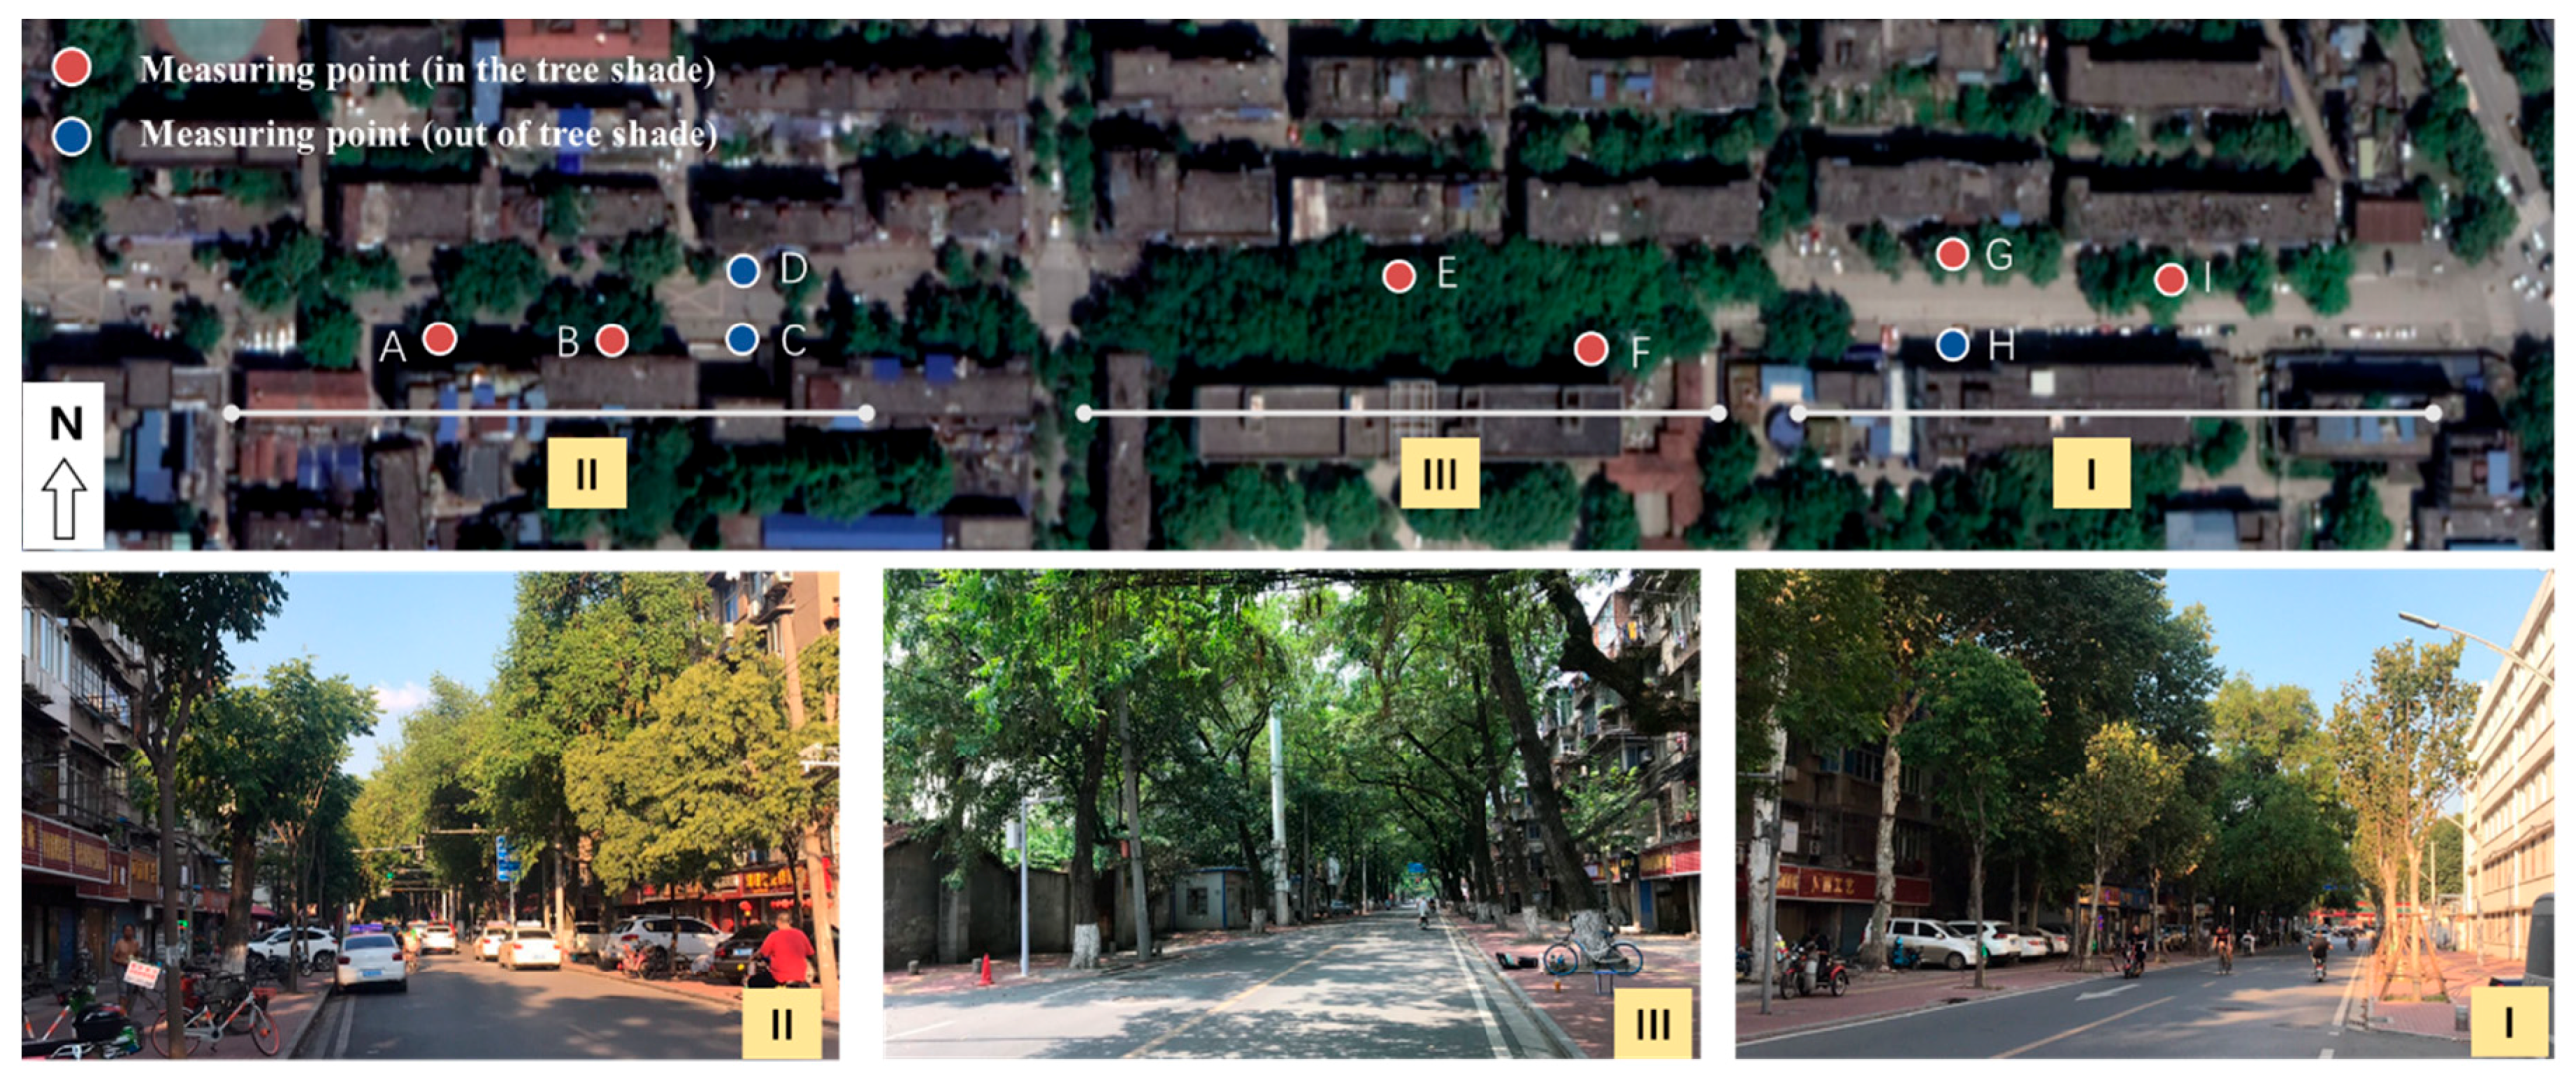
2.1. Study Area and Sampling Sites

Our study was conducted in the city of Wuhan (52°05′ N, 114°17′ E, altitude 23 m). Wuhan is the fifth largest city in China with a current population of 11 million. Wuhan’s climate is characterized by high temperature and humidity in the summer months (Köppen climate classification Cfa) of June to September. The hottest days typically occur in July and August, when average temperature is 29.8 °C, and the extreme maximum temperature reaches 39.4 °C. This is approximately 2 °C higher than other locations with the same latitude. The relative humidity in Wuhan exceeds 75% [31,32].
A street was selected with different degrees of tree canopy cover and E–W street orientations in residential areas. Both sides of the street were primarily occupied by multi-story buildings. The height and width ratios of the entire street were 0.5–0.7, hence, the street was regarded as a shallow street canyon. Four street sections were surveyed in total. Three 150-m-long sections on the street were selected with similar aspect ratios and different extents of tree canopy cover (categorized as low-, medium- and high-percentage tree canopy cover). A control site (i.e., an area with no tree cover) was also surveyed for comparison. Nine measurement points were defined outside and inside of tree-shaded areas (Table 1 and Figure 2). Two measurement points were taken in the tree shade of each section, and three measuring points were taken outside the tree shade.

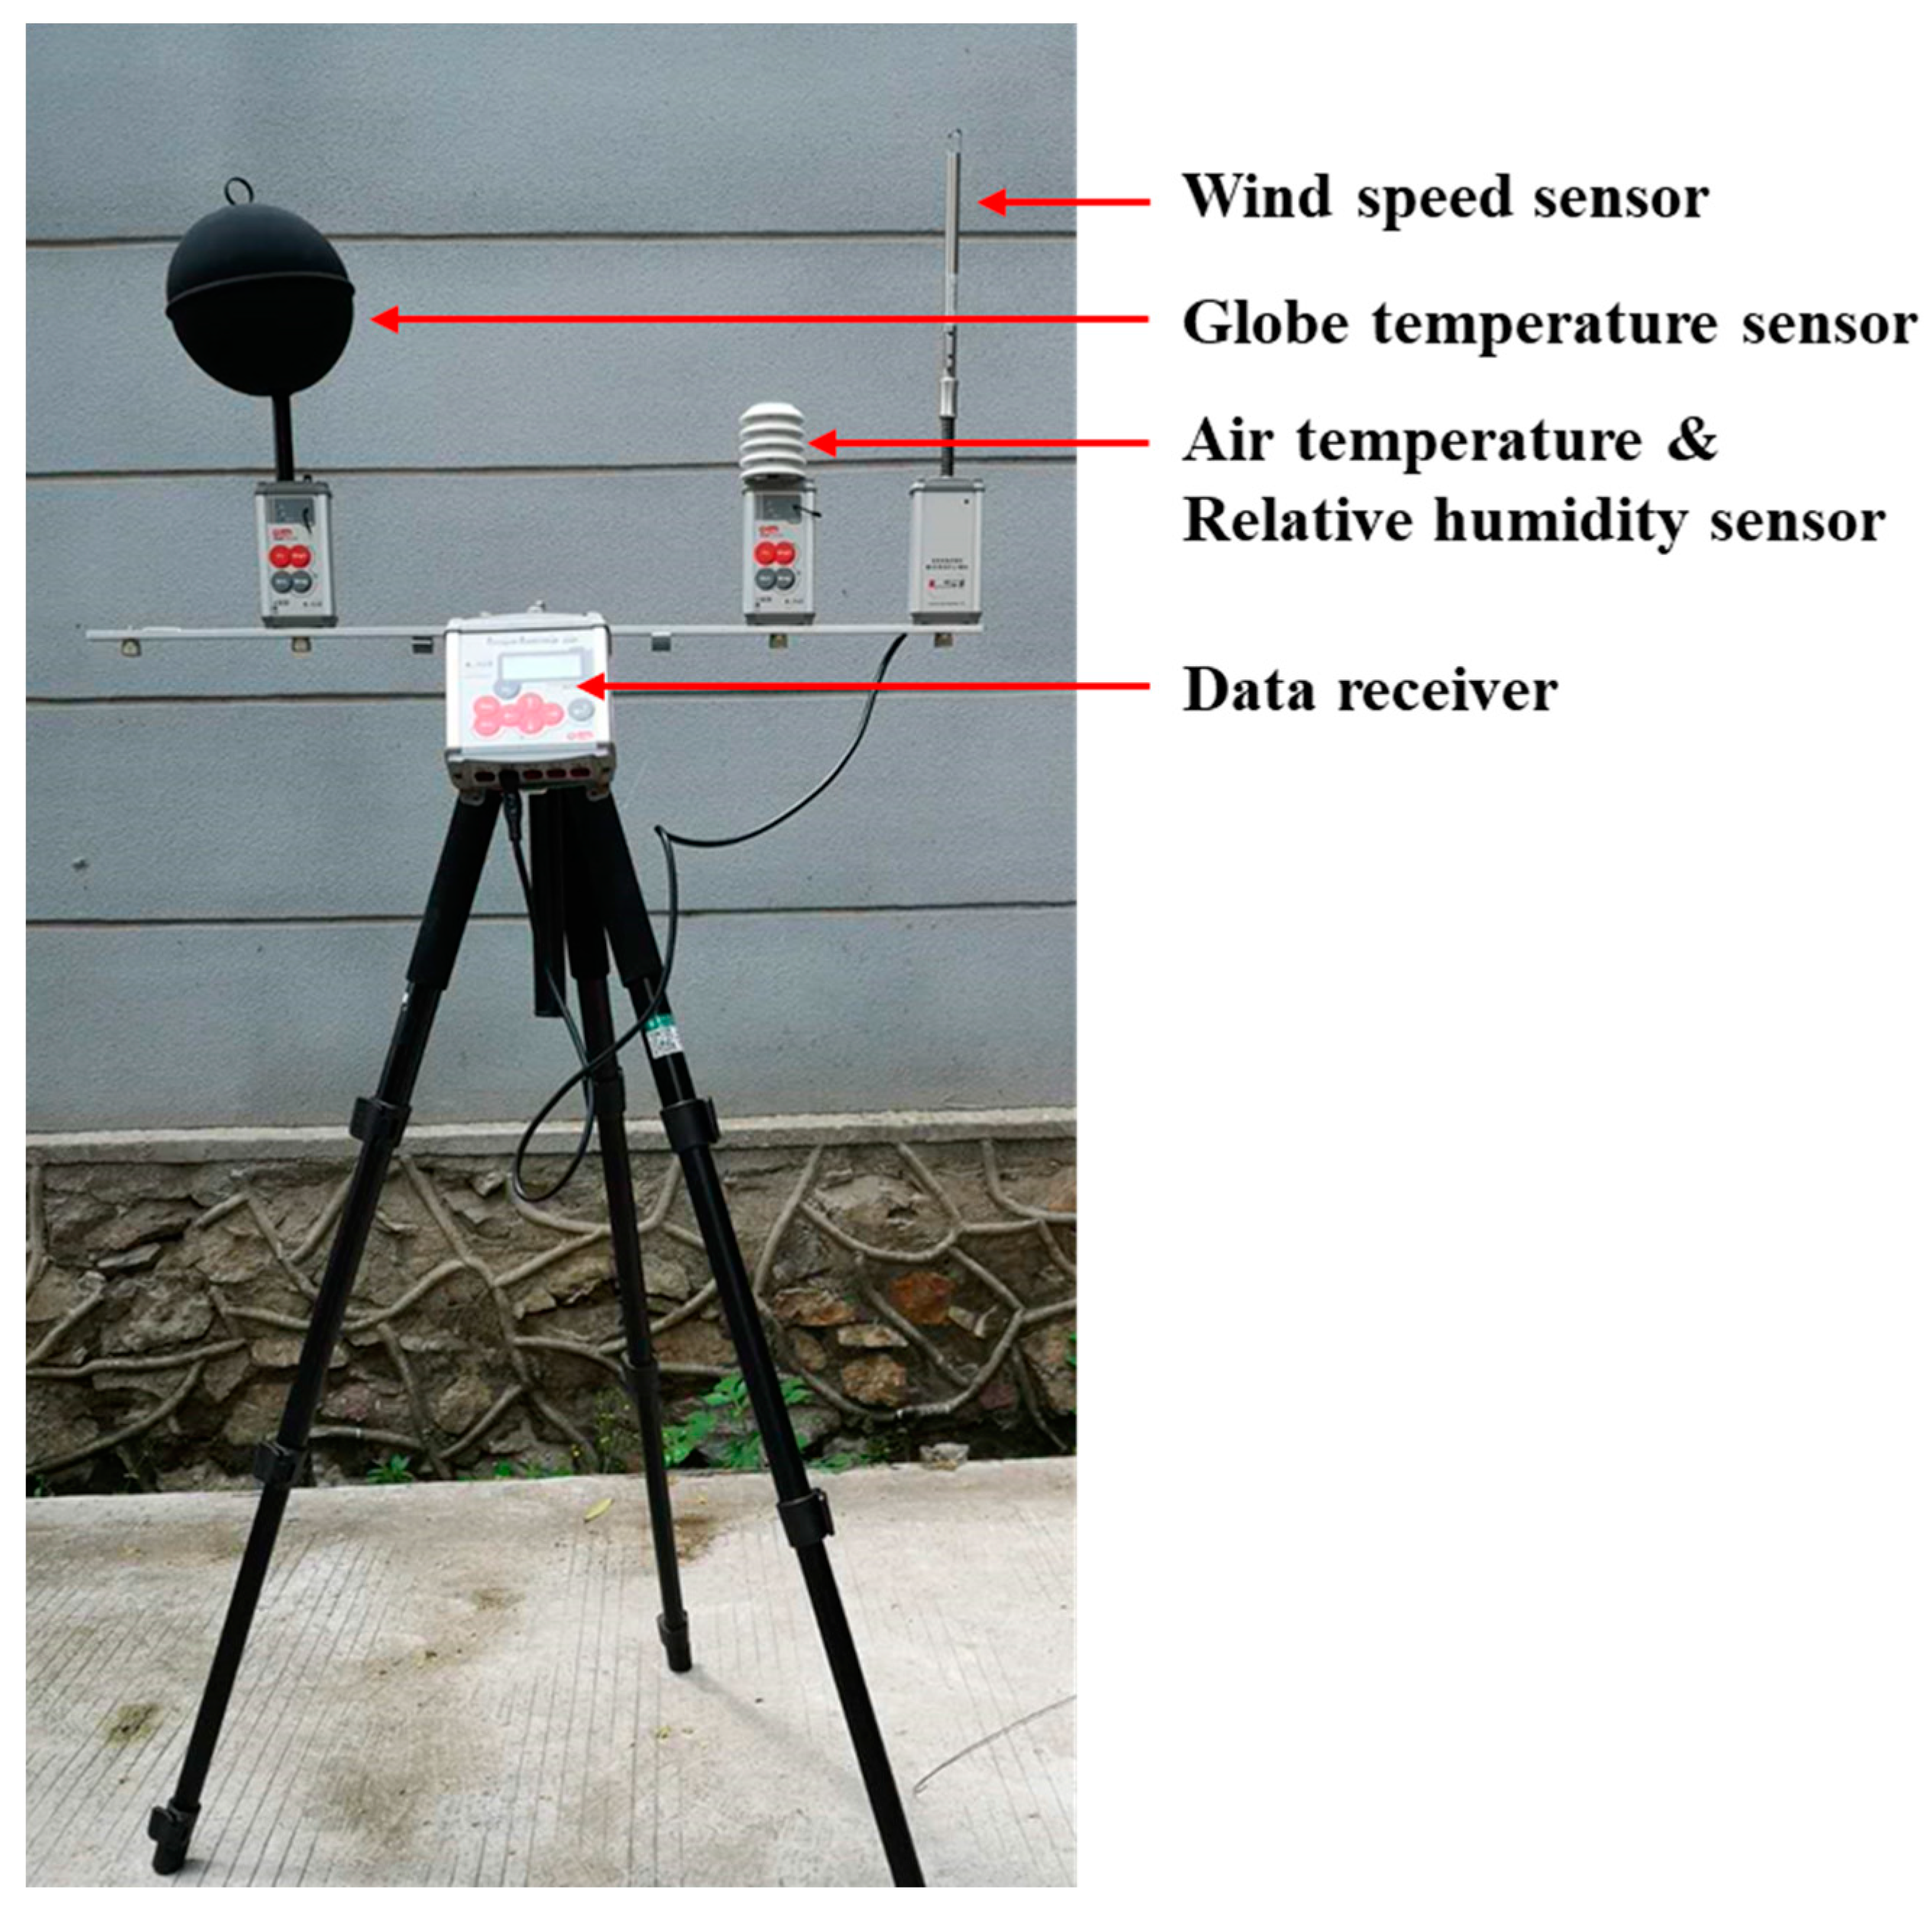
2.2. Micrometeorological Measurements

Micrometeorological measurements were performed from 07:00 to 22:00 on 18 August 2019 and 19 August 2019 using nine portable weather stations (Figure 3) which recorded air temperature (Ta), relative humidity (RH), wind speed (WS) and globe temperature (Tg). Because July and August are the hottest summer months in Wuhan, the measurements in these two months represent typical summer weather. Mean radiation temperature (Tmrt) was defined using Ta, Tg and WS data based on Equation (1) [33]:
T mrt = [ ( T g + 273.15 ) 4 + ( 1.1 × 10 8 × V 0.6 ) ε D 0.4 × ( T g T a ) ] 0.25 273.15 ,
where D = globe diameter (mm) (D is 150 mm) ε = globe emissivity (ε is 0.95). All readings were collected using an R-log data logger and an E-log data logging host, with data taken and stored every minute. All instruments were compliant with the ISO7726 standard (Table 2) and placed at a height of 1.5 m above ground level.

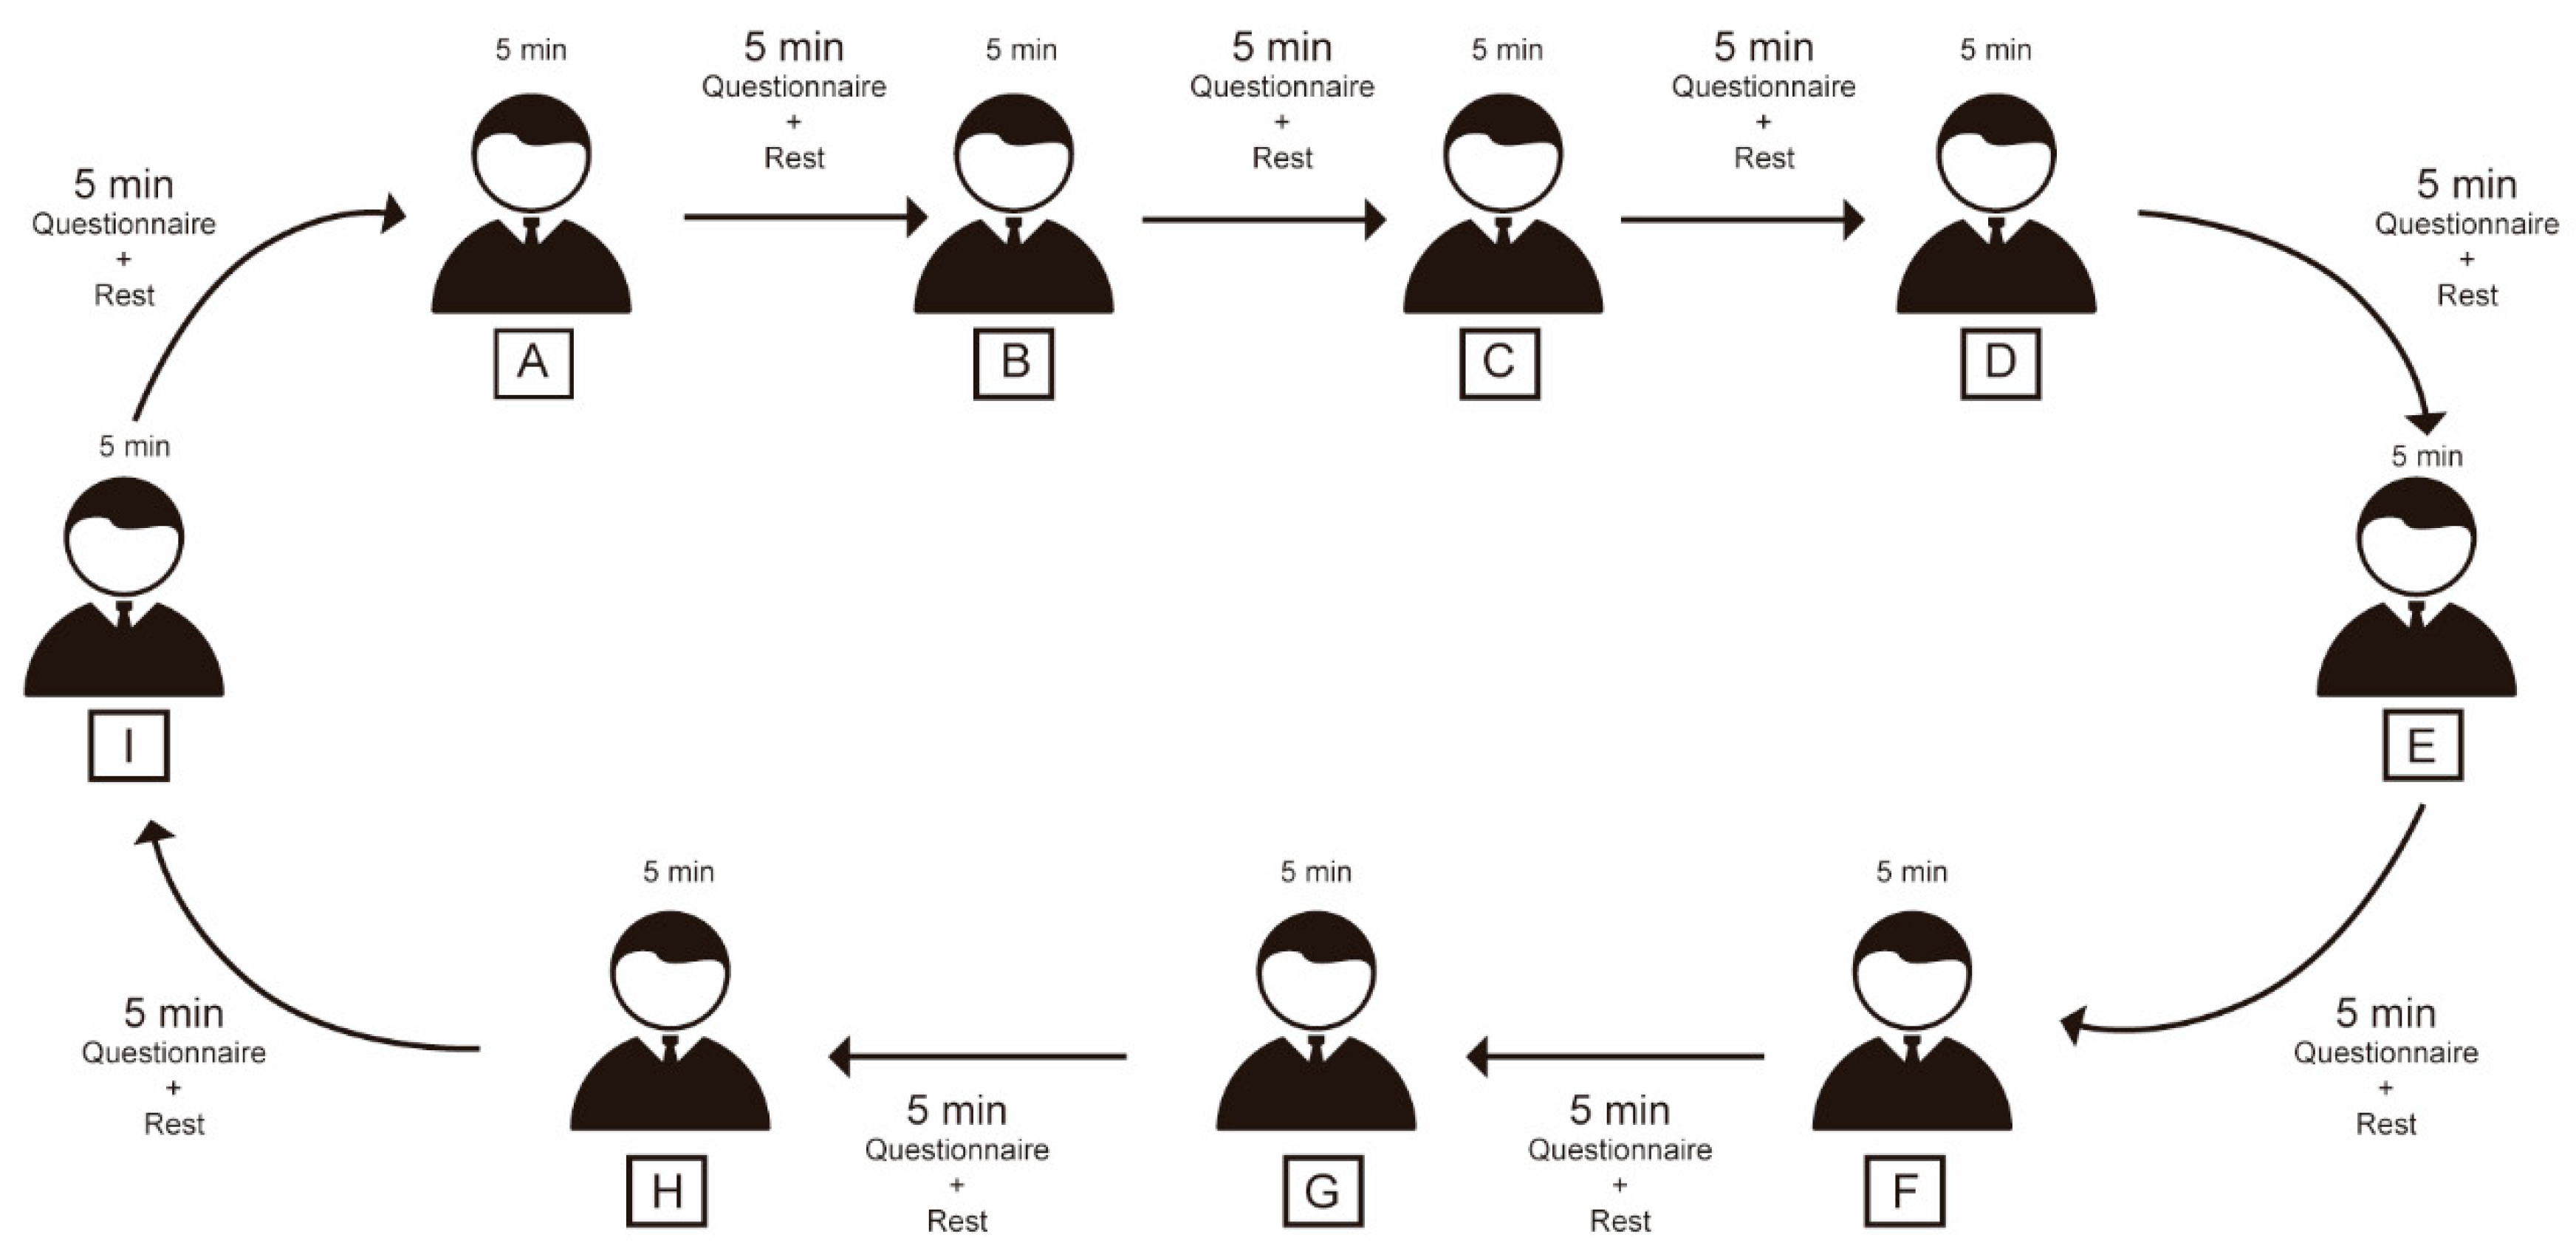
2.3. Questionnaire Survey

The subject group consisted of nine participants, four of whom were male and five were female. Participants aged between 18–50 years old. Participants had resided in Wuhan for a minimum of five years. In each session, each participant was instructed to sit stationary in one of the experimental settings for 5 min. Subsequently, each participant was asked to complete a thermal comfort questionnaire. They had 5 min to complete the questionnaire and rest before moving on to the next experimental setting (Figure 4). This procedure was repeated until each participant has completed all nine experimental settings. It took approximately 90 min for all participants to complete a round of experiments. This experimental design eliminates the sequential effect, in which an individual’s participation in an earlier treatment influences his or her score in later treatments [25]. In this experiment, each subject was placed in the experimental settings in a different order to ensure that the sequence effects were balanced.
The questionnaire included questions regarding the participant’s thermal sensation, microclimate expectations, thermal environment acceptability, expectations for ways to improve the thermal environment, basic personal information and clothing worn. The subjective thermal sensation rating was measured on a five-point scale from 0 (neutral) to 4 (very hot). A negative value for thermal sensation was not included as it does not feel cold during the hot summer months. Microclimate expectations (the expected change in current air temperature, relative humidity, wind speed and solar radiation) were rated on a three-point scale (lower, unchanged, higher). In this study, solar radiation expectation is defined as the perceived level of shading by the participants. This expectation can be higher or lower than the actual level of shading of the streets.
Two questionnaire surveys were conducted simultaneously as the micrometeorological measurements were taken on two dates (18 and 19 August 2019). Each survey consisted of three experimental sessions undertaken during three different periods of the day (morning 8:00–10:00, afternoon 12:00–14:00 and evening 19:00–21:00). The same participants received the questionnaire for the same location for both dates. A total of 486 questionnaires were received, of which ten were discarded due to missing data (n = 476).

3. Results and Discussion

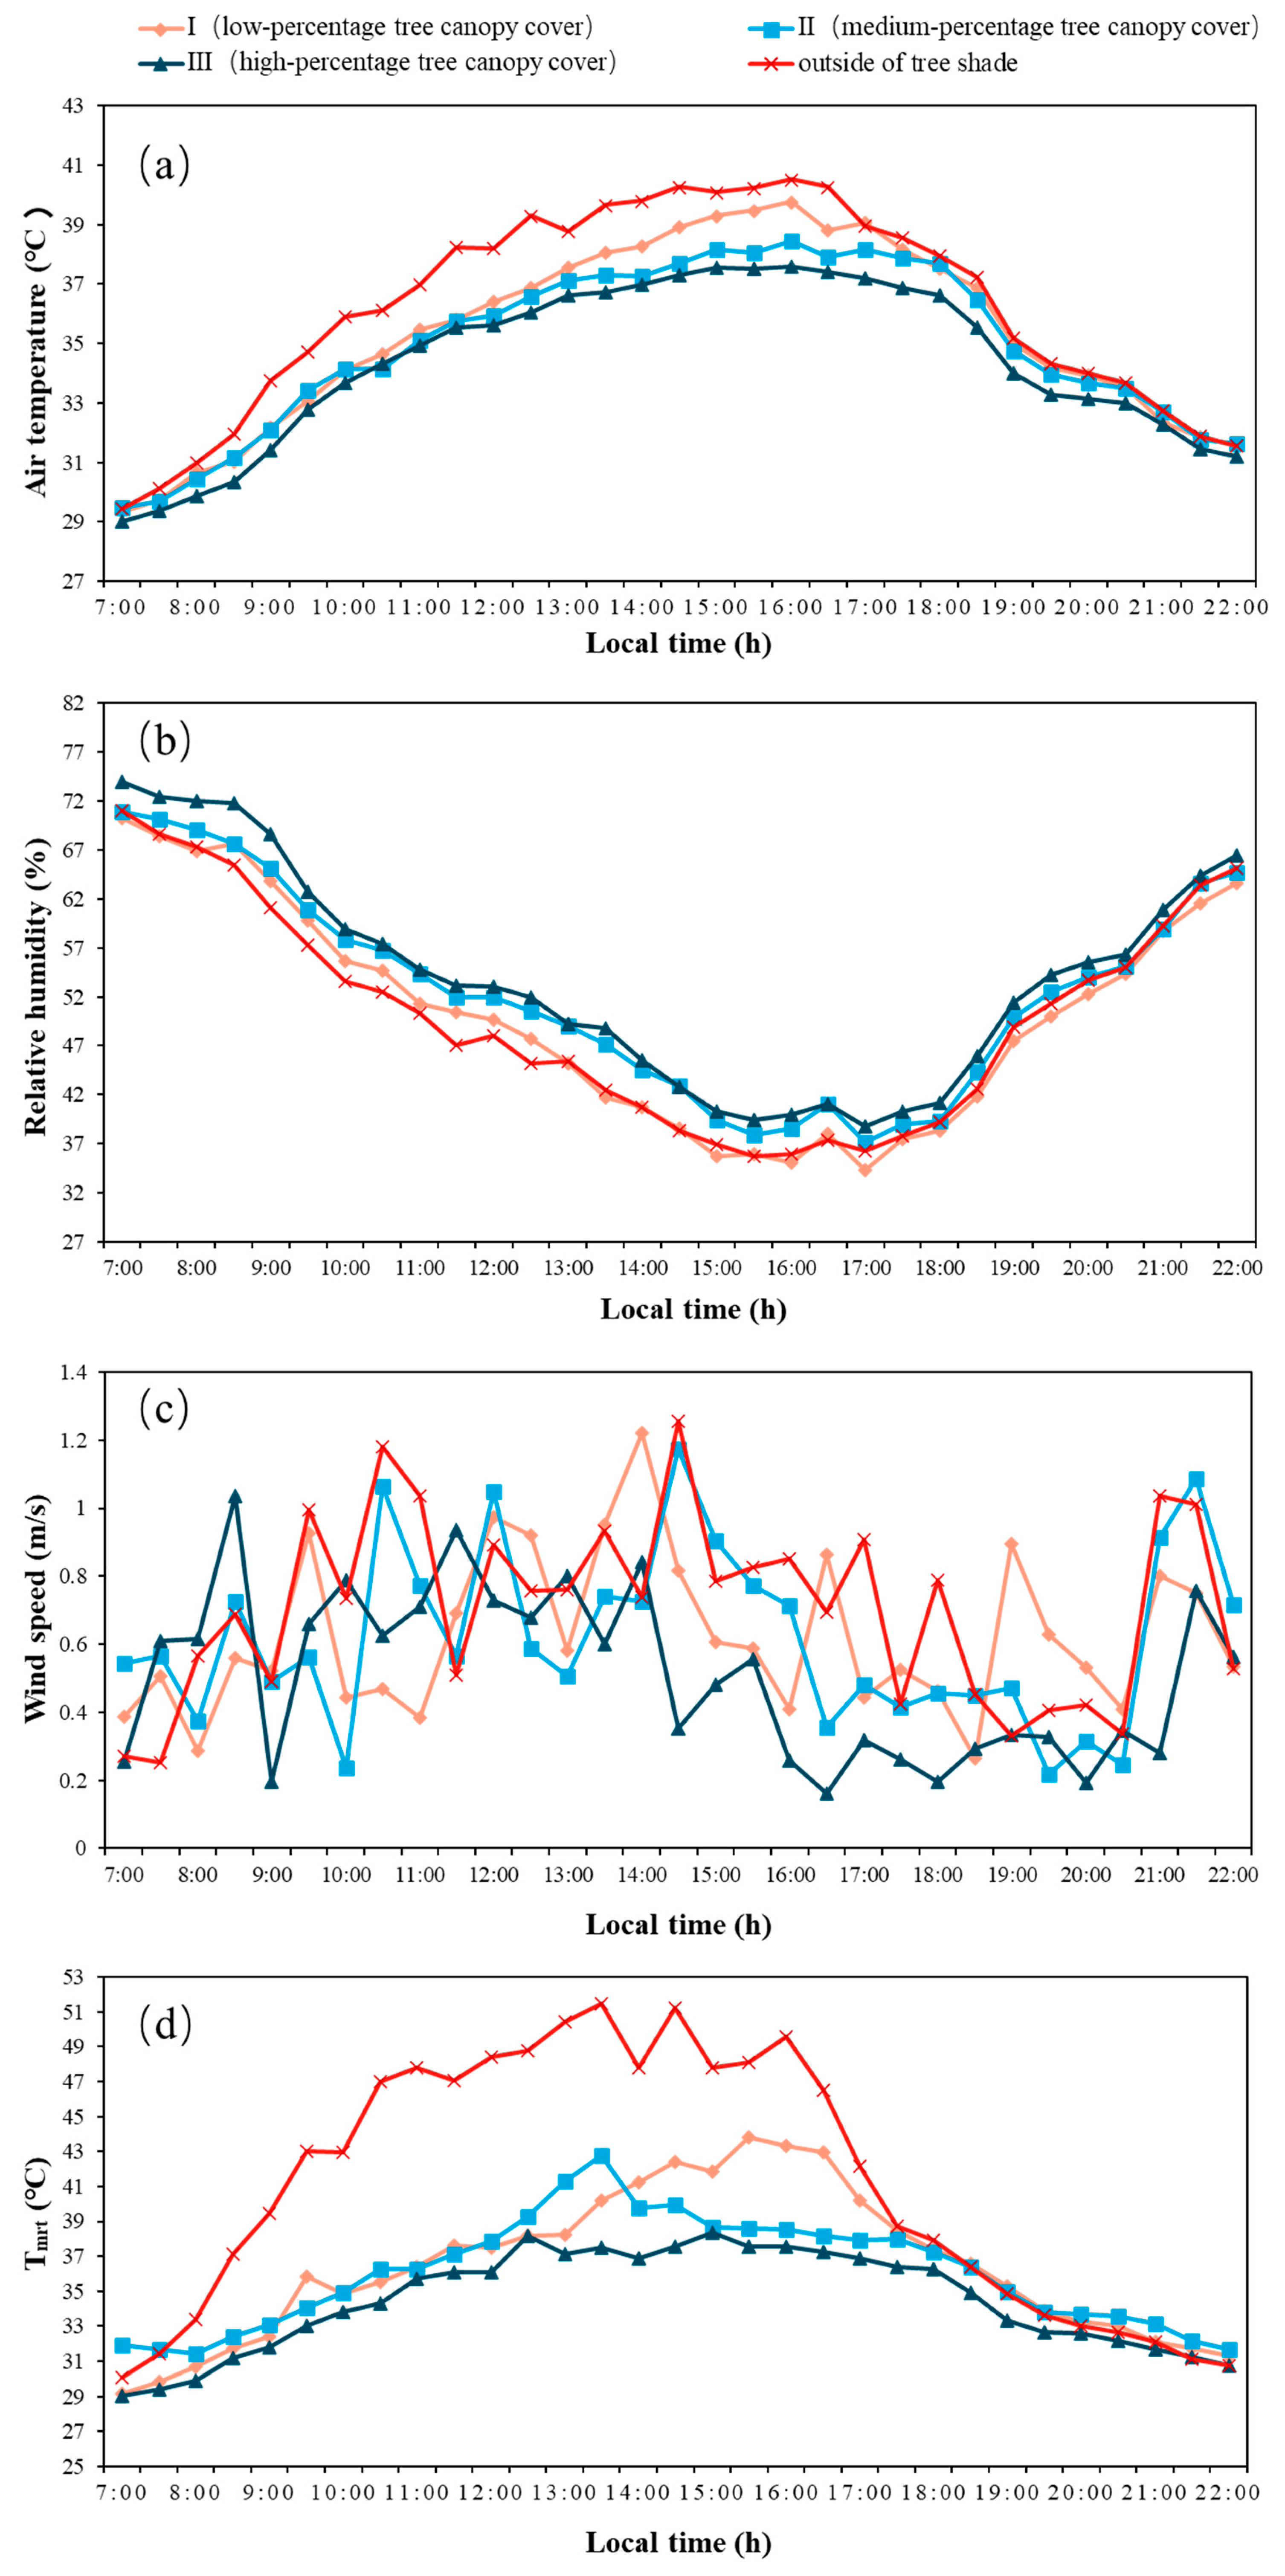
3.1. Impact of Street Tree Canopy Cover on Microclimate Factors

We collected data on 18, 19 August 2019 mainly between 7:00 and 22:00. The overall climatic conditions and the time of sunrise and sunset are shown in Table 3. Climatic conditions were similar during measurements days.

3.1.1. Air Temperature (Ta)

From the one-day temperature trend graph (Figure 5a), the air temperature in the high-percentage tree canopy cover section was the lowest of the four cases. However, the difference was not significant in the early morning and evening. At 12:30, the air temperature difference between the high-percentage tree canopy cover section and the area outside of tree shade was as high as 3.3 °C. The result is consistent with Souch and Souch [34] who noted that the effect of trees on air temperature was minor in early morning (07:00–09:00); however, the cooling effect became apparent by early afternoon (12:00–14:00), reducing air temperatures by 0.7 to 1.3 °C. Different climatic conditions also impact temperature differences. The warm temperate climate of Melbourne, Australia, recorded a reduction in midday air temperatures up to 2.1 °C in an E–W street with high-percentage tree canopy cover. In contrast, the Ta in streets with trees was up to 5.6 °C lower in a tropical climate [35] and up to 1.3 °C lower in a Mediterranean climate [36].

3.1.2. Relative Humidity (RH)

In general, the difference in relative humidity between different tree coverages is not large, and the maximum difference between high-percentage tree canopy cover section and low-percentage tree canopy cover section is 7.03% at 13:30 (Figure 5b). However, a significantly higher relative humidity was observed in the high-percentage canopy covered section. This is mainly due to the evapotranspiration of trees and high-percentage canopy covered section as this released more water vapor into the atmosphere from transpiration and increased the humidity of the air in the street canyon [37]. However, from the perspective of pedestrians, especially in high temperature and high humidity areas, higher humidity from transpiration will not be perceived as a benefit because this will lead to less efficient sweat evaporation from the human body, especially at high levels of physical activity (i.e., brisk walking) [38].

3.1.3. Wind Speed (WS)

During the day, the wind speed in all cases reached its peak at noon. The average wind speed in an unshaded area (measuring sites that were not in tree shade) was consistently the highest at 0.71 m/s (Figure 5c). The average wind speed in the high-percentage tree canopy cover section was the lowest at 0.51 m/s, and the average wind speed in the medium-percentage tree canopy cover section was 0.62 m/s. Where the unshaded area intersects another street, moving vehicles may have an effect on the wind speed. However, from the overall data, trees have a certain blocking effect on wind speed. This is similar to the results of Sanusi et al. ’s study, which concluded that high-percentage canopy cover reduced wind speed [37]. In a study by Park et al. [39], the presence of four street trees in street canyons was found to reduce wind speeds by up to 51% under the canopy.

3.1.4. Mean Radiant Temperature (Tmrt)

The overall trend of Tmrt during the day is similar to that exhibited by air temperature; the Tmrt in the high-percentage tree canopy cover section was the lowest (Figure 5d). At 13:30, the gap between the high-percentage tree canopy cover section and the location outside of tree shade reached a maximum of 13.9 °C. In the early morning and at noon, the Tmrt of the medium-percentage tree canopy cover section was suddenly higher than that of the low-percentage tree canopy cover section. This was primarily due to point B as a restaurant was located close to the measurement point, and its business hours were between 6:00 to 15:00. We hypothesize that the higher values of Tmrt recorded between 7:00–9:00 and 12:30–13:30 (i.e., breakfast and lunch hours) at measurement point B, and the similar differences identified between the Tmrt in the two sections over the two days was a result of increased flows in human and other traffic during this period within the medium-percentage tree canopy cover section. However, from the overall trend and the average value of the whole day, the Tmrt of the medium-percentage tree canopy cover section is lower than that of the low-percentage tree canopy cover section. At night (19:00–22:00), the Tmrt of the low- and medium-percentage tree canopy cover sections were 32.95 °C and 33.30 °C, respectively, which are both higher than the Tmrt of the site outside of tree shade (32.60 °C). This is because the canopy inhibits longwave radiative cooling from the surface [39]. The trees also absorb and (re)emit longwave radiation, which further contributes to higher Tmrt at night. This result is consistent with the results of Lee et al. [7], whose research demonstrated that the Tmrt of a street with trees increases by 0.8 °C at night compared with a street without trees. However, in the present study, the high-percentage tree canopy cover section recorded the lowest temperature at night of all the sections due to the low solar radiation received during the day. Therefore, although canopy cover may provide benefits during the day, it may also have negative effects at night.

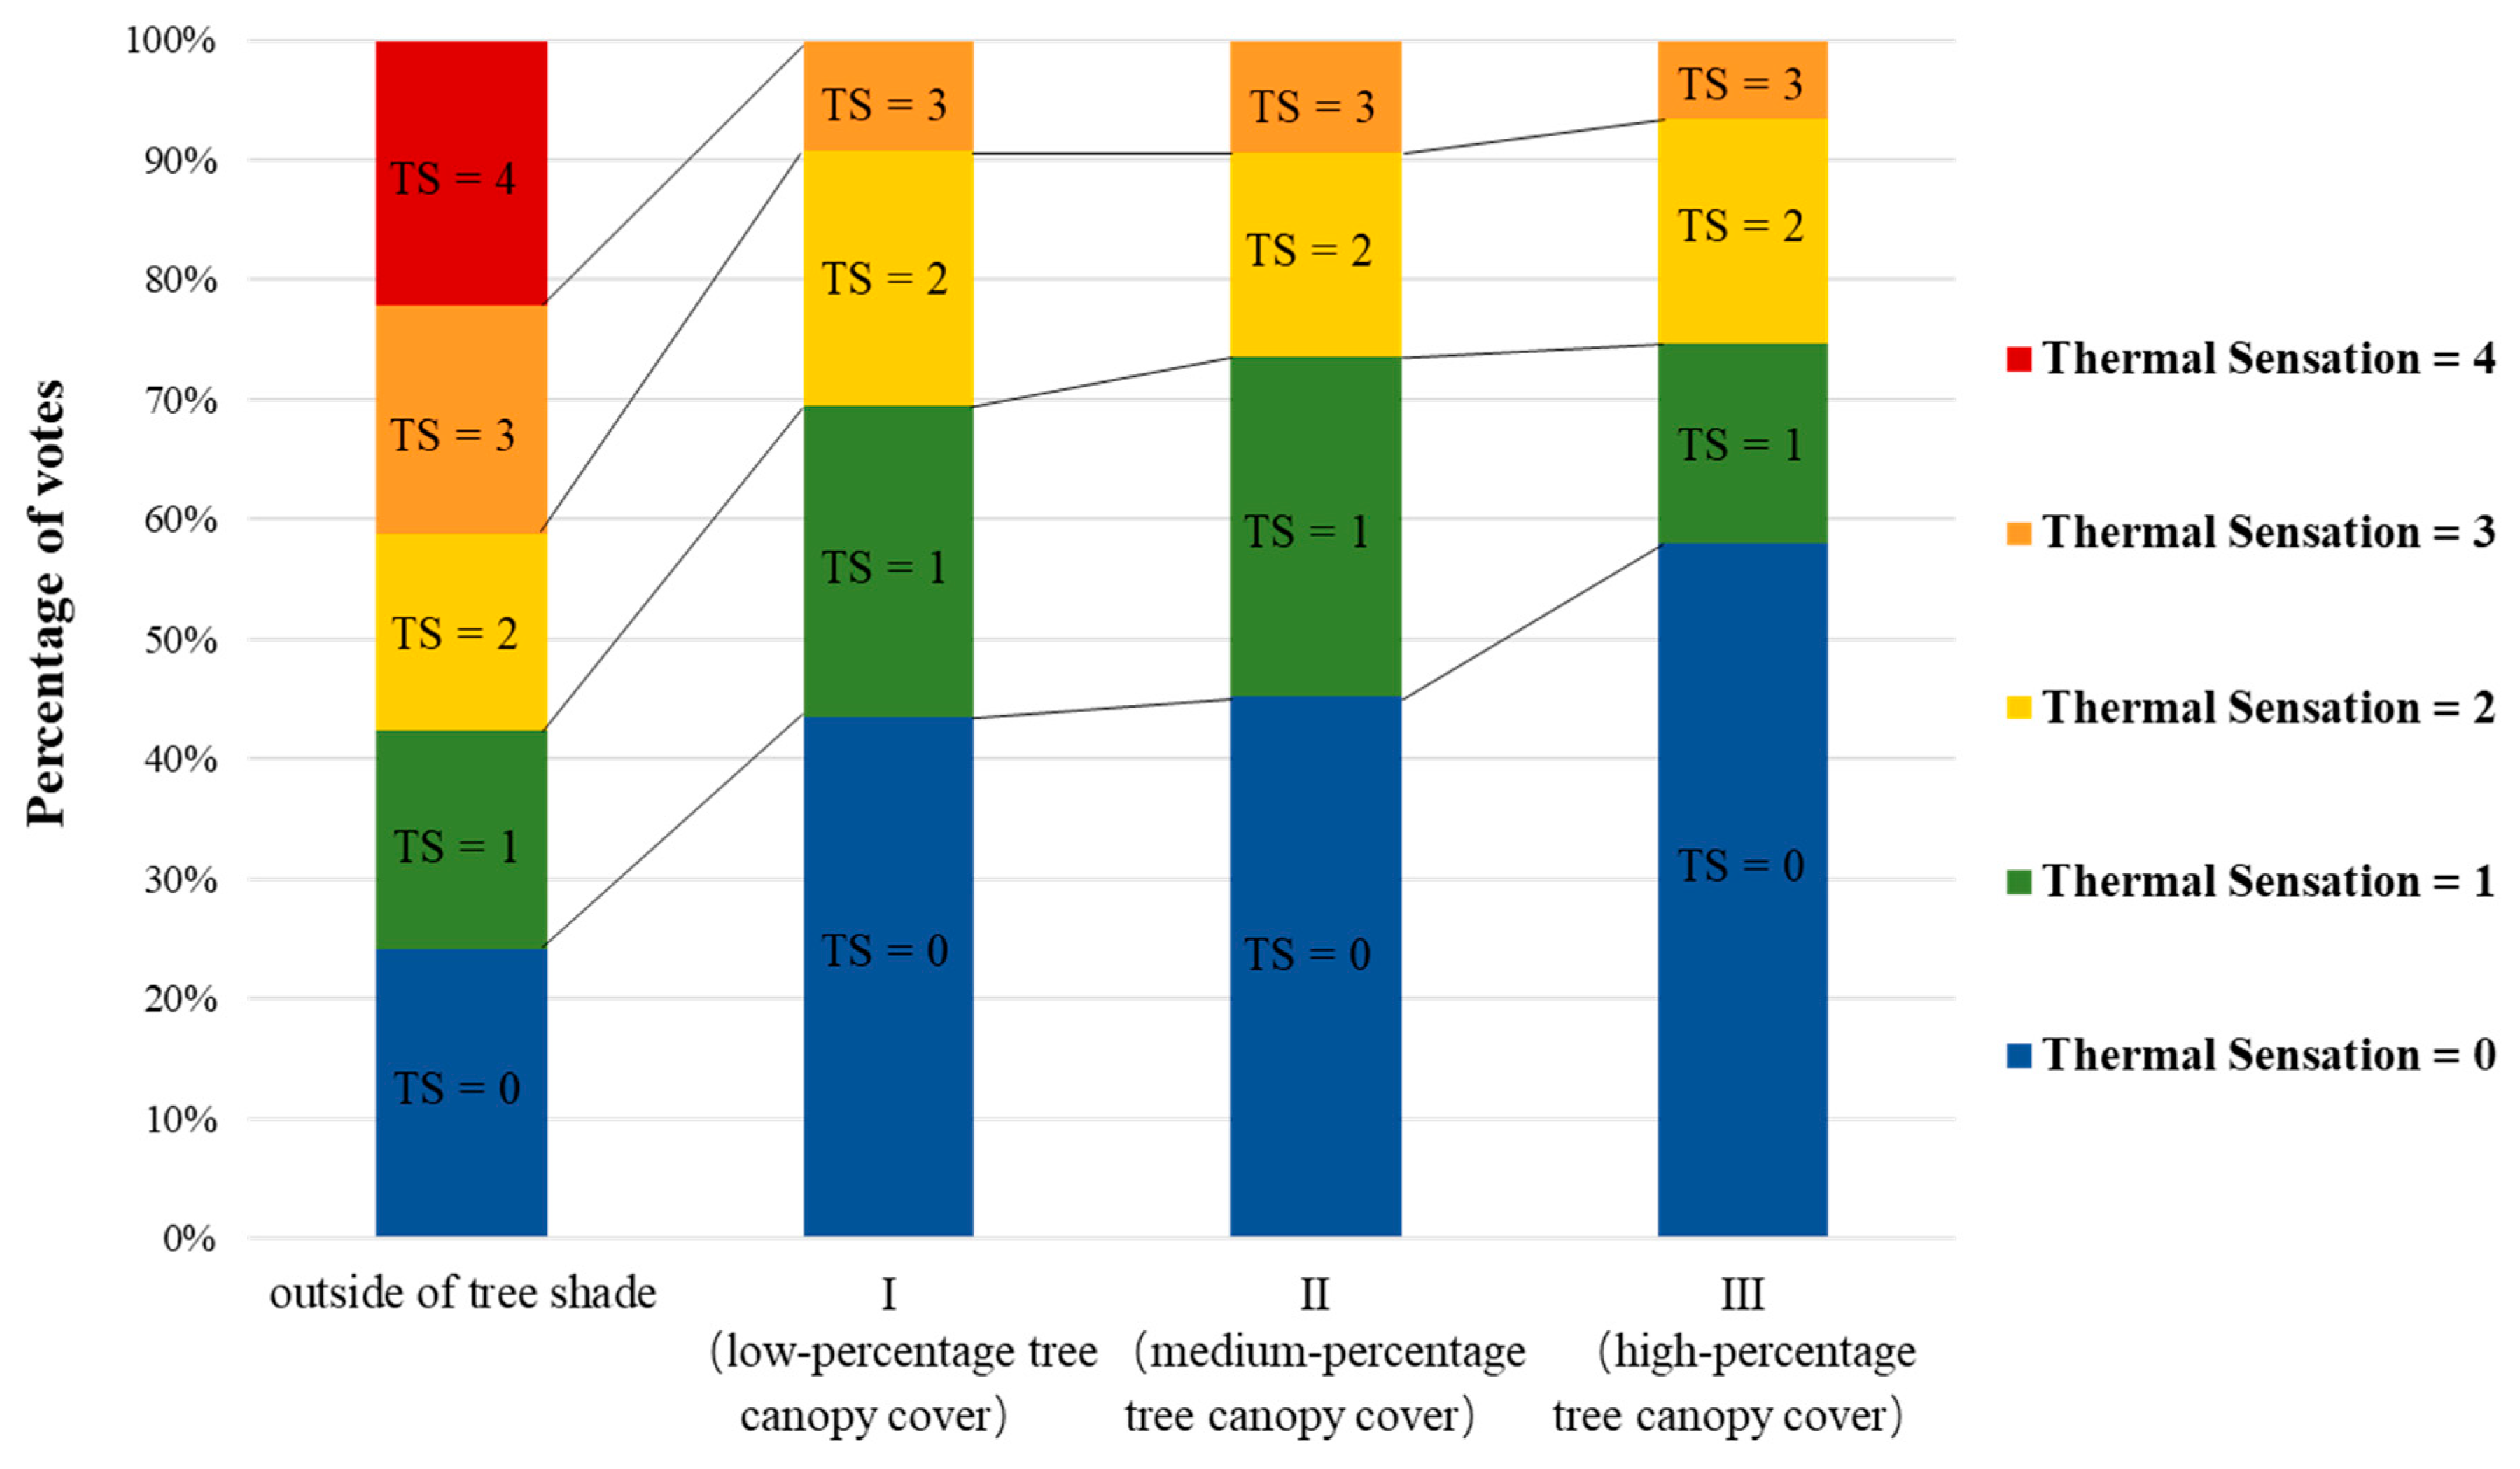
3.2. Impact of Street Tree Canopy Cover on Human Thermal Comfort

3.2.1. Thermal Sensation Vote (TSV) under Different Degrees of Tree Canopy Cover
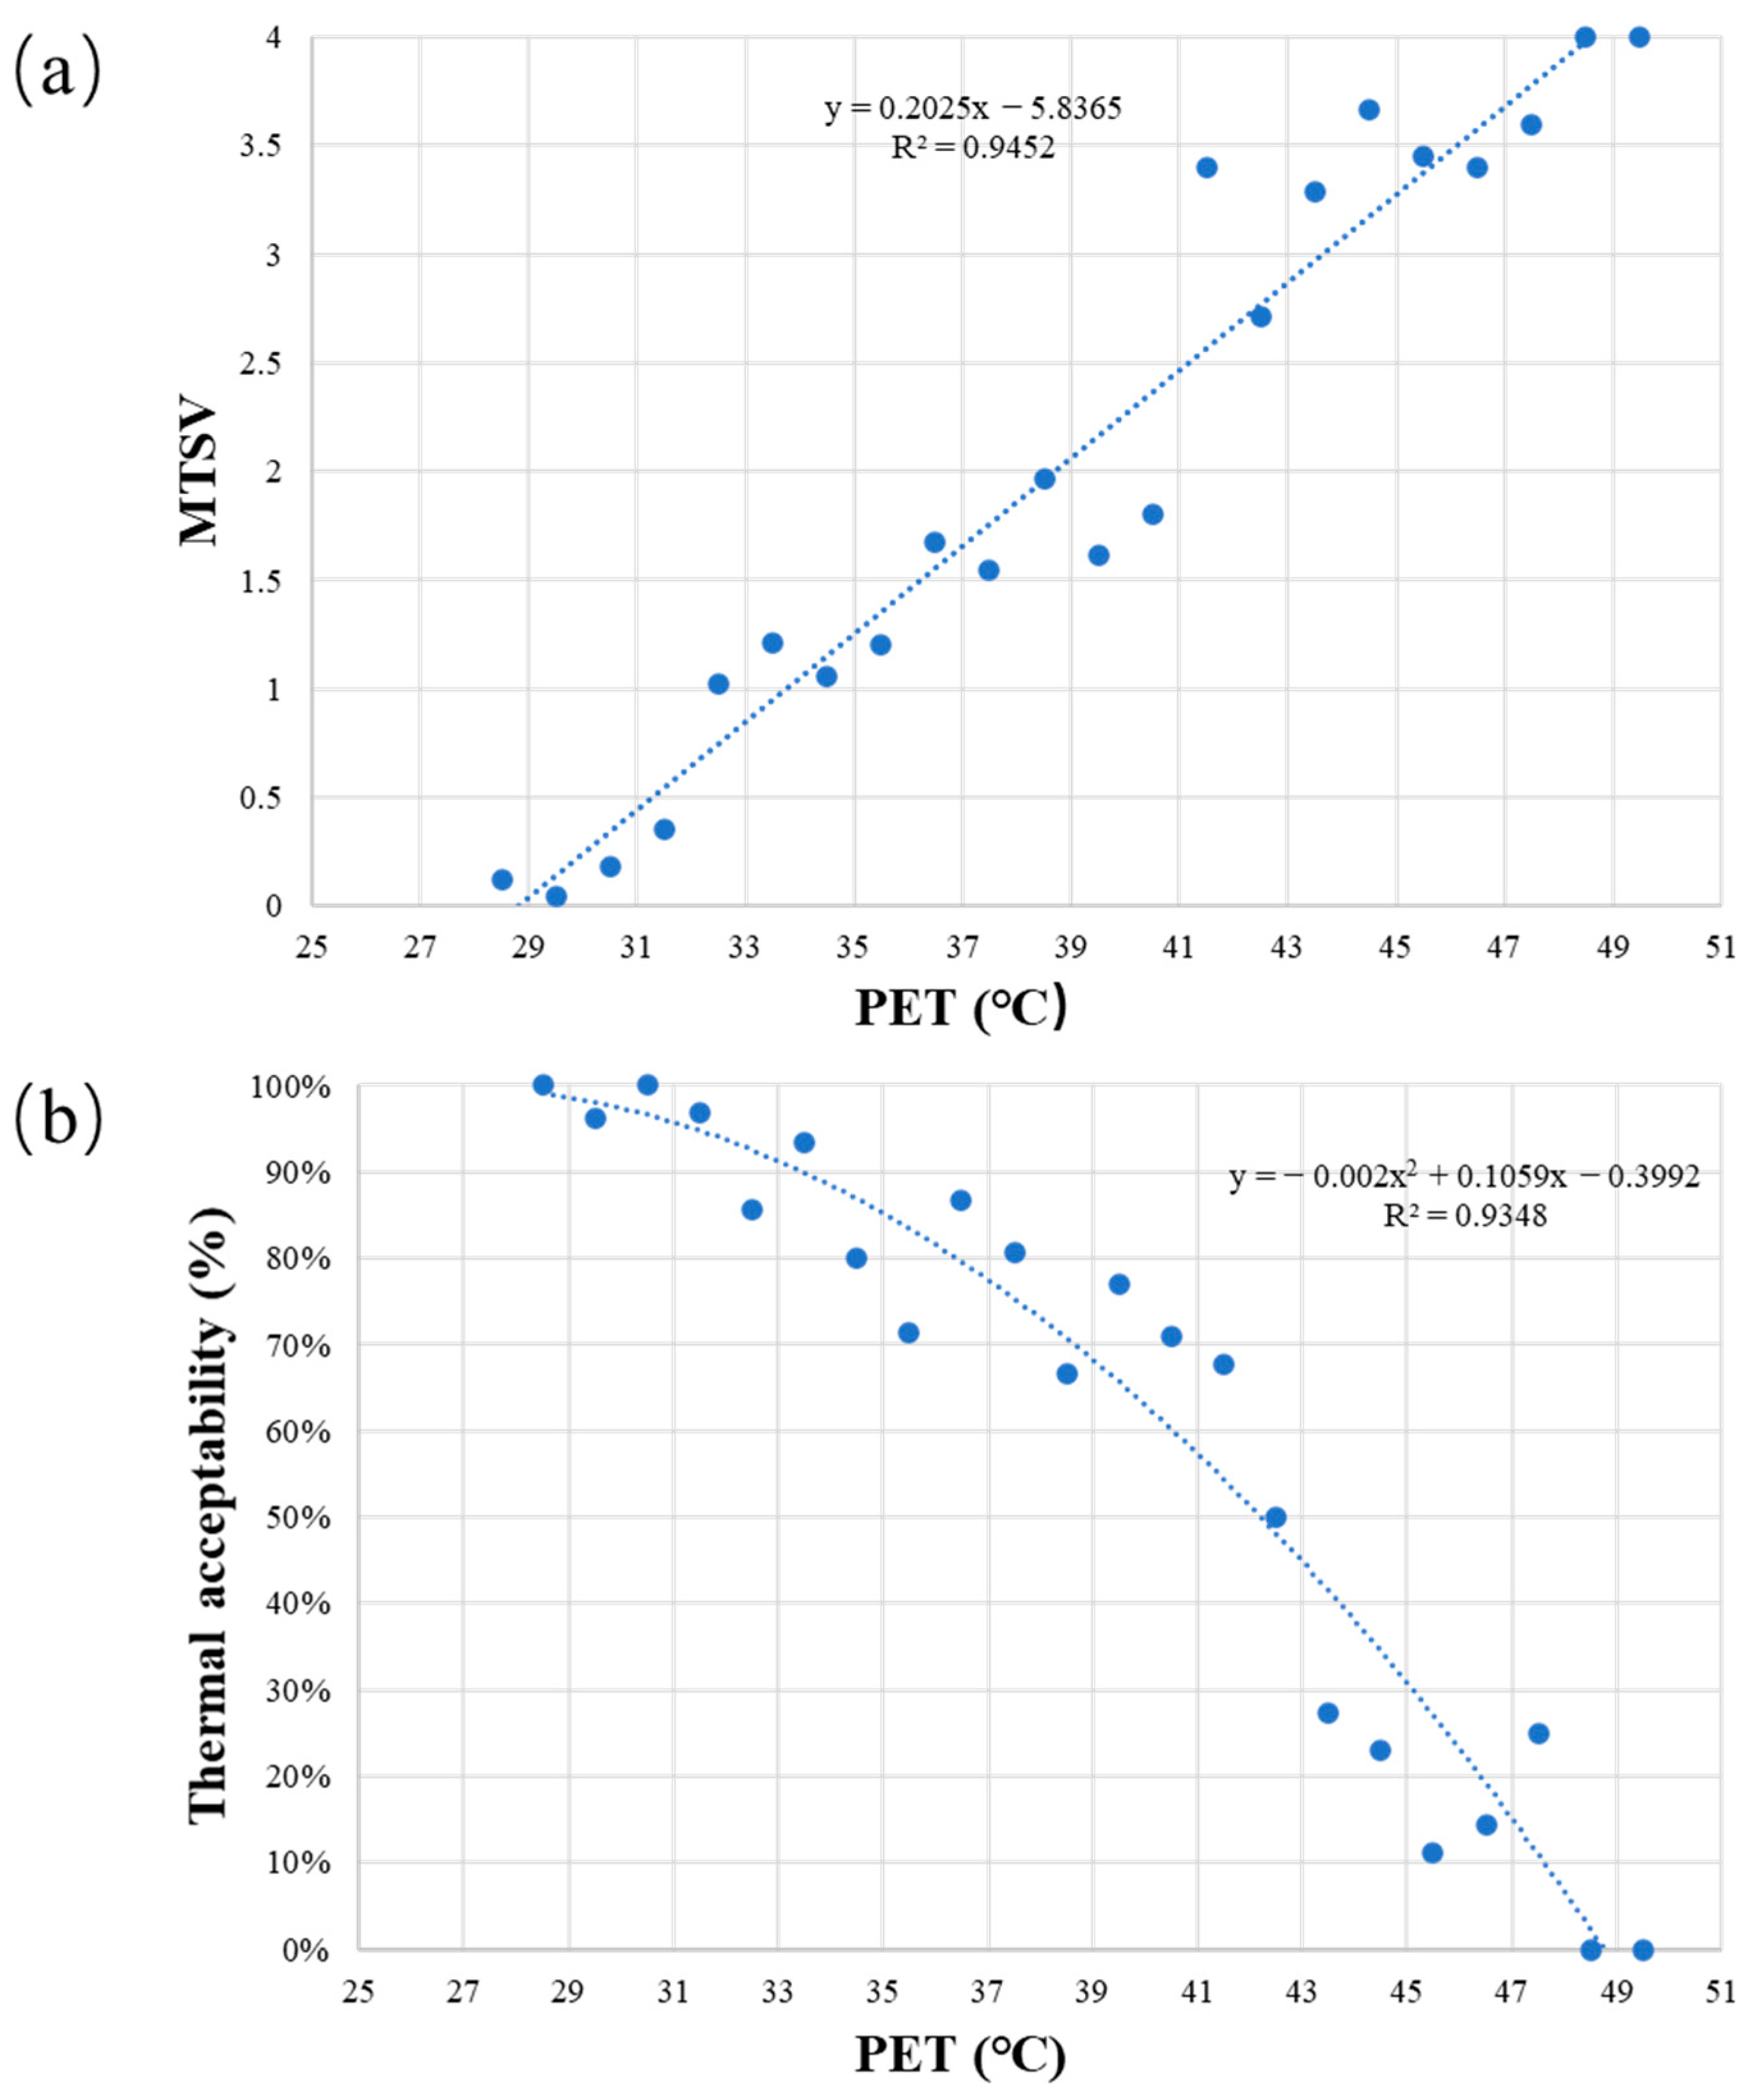
Thermal sensation (TS) refers to the cold and hot sensation of people to the thermal environment. It is the reaction of skin receptors to thermal stimulation. TS reflects a person’s physiological sensation. In this study, TS also involves sensuous satisfaction. The frequency distribution of thermal votes is shown in Figure 6. Due to its direct sun exposure, only the area outside of tree shade was voted as “very hot”. The TS of the high-percentage tree canopy cover section was most frequently considered “neutral” (TS = 0; 61%), while only 7% of the See earlier comment regarding using one term to describe your participants selected “hot” (TS = 3). For the low-percentage tree canopy cover section, the proportion of “neutral” responses was higher, and the proportion of “hot” responses was lower than those recorded for the medium-percentage tree canopy cover section. Figure 7 shows the microclimate expectations under different tree cover. When the TSV is “neutral” (TSV = 0), as tree coverage decreases, people expect temperature and solar radiation to decrease (Figure 7a,c). However, there is no clear pattern of relative humidity expectations (Figure 7b). This may be a result of the humidity difference between varying tree coverages is small, and because the participants have been in a highly humid environment for a long period of time which has made them insensitive to humidity. Moreover, approximately 70% of participants desired greater wind speeds, regardless of tree coverage (Figure 7d). This indicates that people were not necessarily satisfied with a moderately hot environment. In a high-temperature and high-humidity environment, people would expect lower temperatures and higher wind speeds in the shade of street trees.
Figure 8 demonstrates the effect of the different degrees of tree canopy cover on the thermal sensation of subjects as a function of air temperature, with corresponding regression lines. The regression lines indicate that the participants rated the settings with medium-percentage tree canopy cover approximately 0.34 units hotter compared with settings with low- and high-percentage tree canopy cover with the same air temperature. As tree coverage decreases, the slope of its regression formula increases. Thus, we conclude that higher temperature enhances the effect of solar radiation [26]. By extrapolating the regression lines to the x-axis, the order of neutral air temperature is: low-percentage tree canopy cover (29.95 °C) > high-percentage tree canopy cover (29.76 °C) > outside of tree shade (28.85 °C) > medium-percentage tree canopy cover (28.31 °C).
To understand this result, we counted the microclimate factors of different tree coverage sections during the three questionnaire periods (morning 8:00–10:00, afternoon 12:00–14:00 and evening 19:00–21:00). We found that the Tmrt of the medium-percentage tree canopy cover section was higher than that of the other sections (Figure 9). The medium-percentage tree canopy cover section had the lowest wind speed, while the low-percentage tree canopy cover had the highest wind speed (Figure 8). According to Cheng et al. [26], the lower the solar radiation or the higher the wind speed, the higher the temperature the neutral air. Conversely, participants often have higher psychological expectations for places with higher tree coverage. When the actual thermal environment does not meet the psychological expectation, the neutral air temperature will be reduced, and vice versa. This also explains the aforementioned “hot” vote the proportion of “neutral” responses in the low-percentage tree canopy cover section was higher than that of the medium-percentage tree canopy cover section, and the proportion of “hot” responses was lower than that of the medium-percentage tree canopy cover section.

3.2.2. Neutral PET

To further examine the relationship between PET and subjective thermal sensations and to determine the neutral PET, the mean thermal sensation votes (MTSV) were calculated with an interval of 1 °C PET. The relationships between MTSV and PET were plotted (Figure 10a). The regression function was fitted as follows:
MTSV = 0.2025 PET − 5.8365 (R2 = 0.9452, p < 0.001),
By substituting MTSV = 0 in Equation (2), the neutral PET in summer was determined (28.8 °C). This can be a temperature range when TSV is between −0.5 and 0.5. Thus, by substituting MTSV = ±0.5 in Equation (2), the PET range (i.e., the range in which people feel comfortable) was determined as 26.35–31.29 °C in this study. The American Society of Heating and Air Conditioning Engineers Standard 55 defines the thermal acceptability range as the temperature range that is acceptable to at least 80% of respondents (normal conditions) or 90% of respondents (strict conditions) [40]. The percentages of acceptability were obtained by calculating the thermally acceptable ratios in each 1 PET interval group (Figure 10b). The 90% acceptability limits are the intersections of the fitted curve and the 90% acceptability line, which is 16.42–33.64 °C. The upper limit of the acceptable temperature is higher than the neutral temperature because the thermal acceptability reflects people’s physical and psychological sensations, including the subjective factors of mood. Therefore, the thermal neutral range of PET in Wuhan is 26.35–31.29 °C.
The neutral PET and PET comfort ranges vary from region to region in China owing to the influence of thermal adaptation. The neutral PET and PET comfort ranges in Wuhan (28.82 °C and 26.35–31.29 °C, respectively) are higher than in other Chinese cities, such as Changsha, Guangzhou and other cities where similar studies have been conducted (Table 4). The physical thermal environment may provide a possible explanation for this. Although Wuhan, Changsha, Guangzhou and Shanghai all belong to the Cfa climate zone, the air temperature in Wuhan during the summer is reported to be higher than these other cities, except Changsha where temperature is similar (Figure 11). Ambient air temperature is an important variable in the PET model; provided that all other input variables stay constant, PET increases with increased air temperature [26]. A previous transverse survey conducted by Ng et al. [41] in Hong Kong was conducted in three different types of environment (streets, housing estates and urban parks). Their study demonstrated that the neutral PETs obtained in streets are significantly higher than in parks, because parks are generally cooler than other urban spaces. This results in a lower range of PETs and thus a potentially lower neutral PET. Similarly, the actual street air temperature will be higher than urban spaces, leading to a higher neutral PET.
The second possible explanation is psychological adaptation. Psychological adaptation describes the possibility of a person modifying their perceptions and reactions to maintain thermal comfort [42] due to past experience and expectations [43]. There is a consensus among the thermal comfort research community that people’s psychophysiological attributes together with human corporeal conditions largely dictate outdoor thermal satisfaction [44]. Several thermal comfort studies have suggested that promoting an environmental attitude would help visitors of outdoor spaces to compromise their thermal expectations and therefore produce better thermal perceptions [3,45,46]. Our surveying sites were located on the street and when compared with parks and other more recreational and functional locations, most people’s impression of streets is that they predominantly serve transportation functions. Therefore, the expectation of the thermal environment in streets is lower, and hence it is easier to be satisfied with the thermal environment in the street than in a recreational space, such as a park. Moreover, this study utilized a longitudinal experimental approach. Participants were required to stay in the outdoor thermal environment for an extended period of time to adapt and they also knew the location in advance, which includes the weather conditions they would be working in. These factors all mentally prepare the participants for the given thermal conditions [47]. Hence, it is likely that outdoor users attain thermal comfort if they know what to expect from imminent weather conditions.

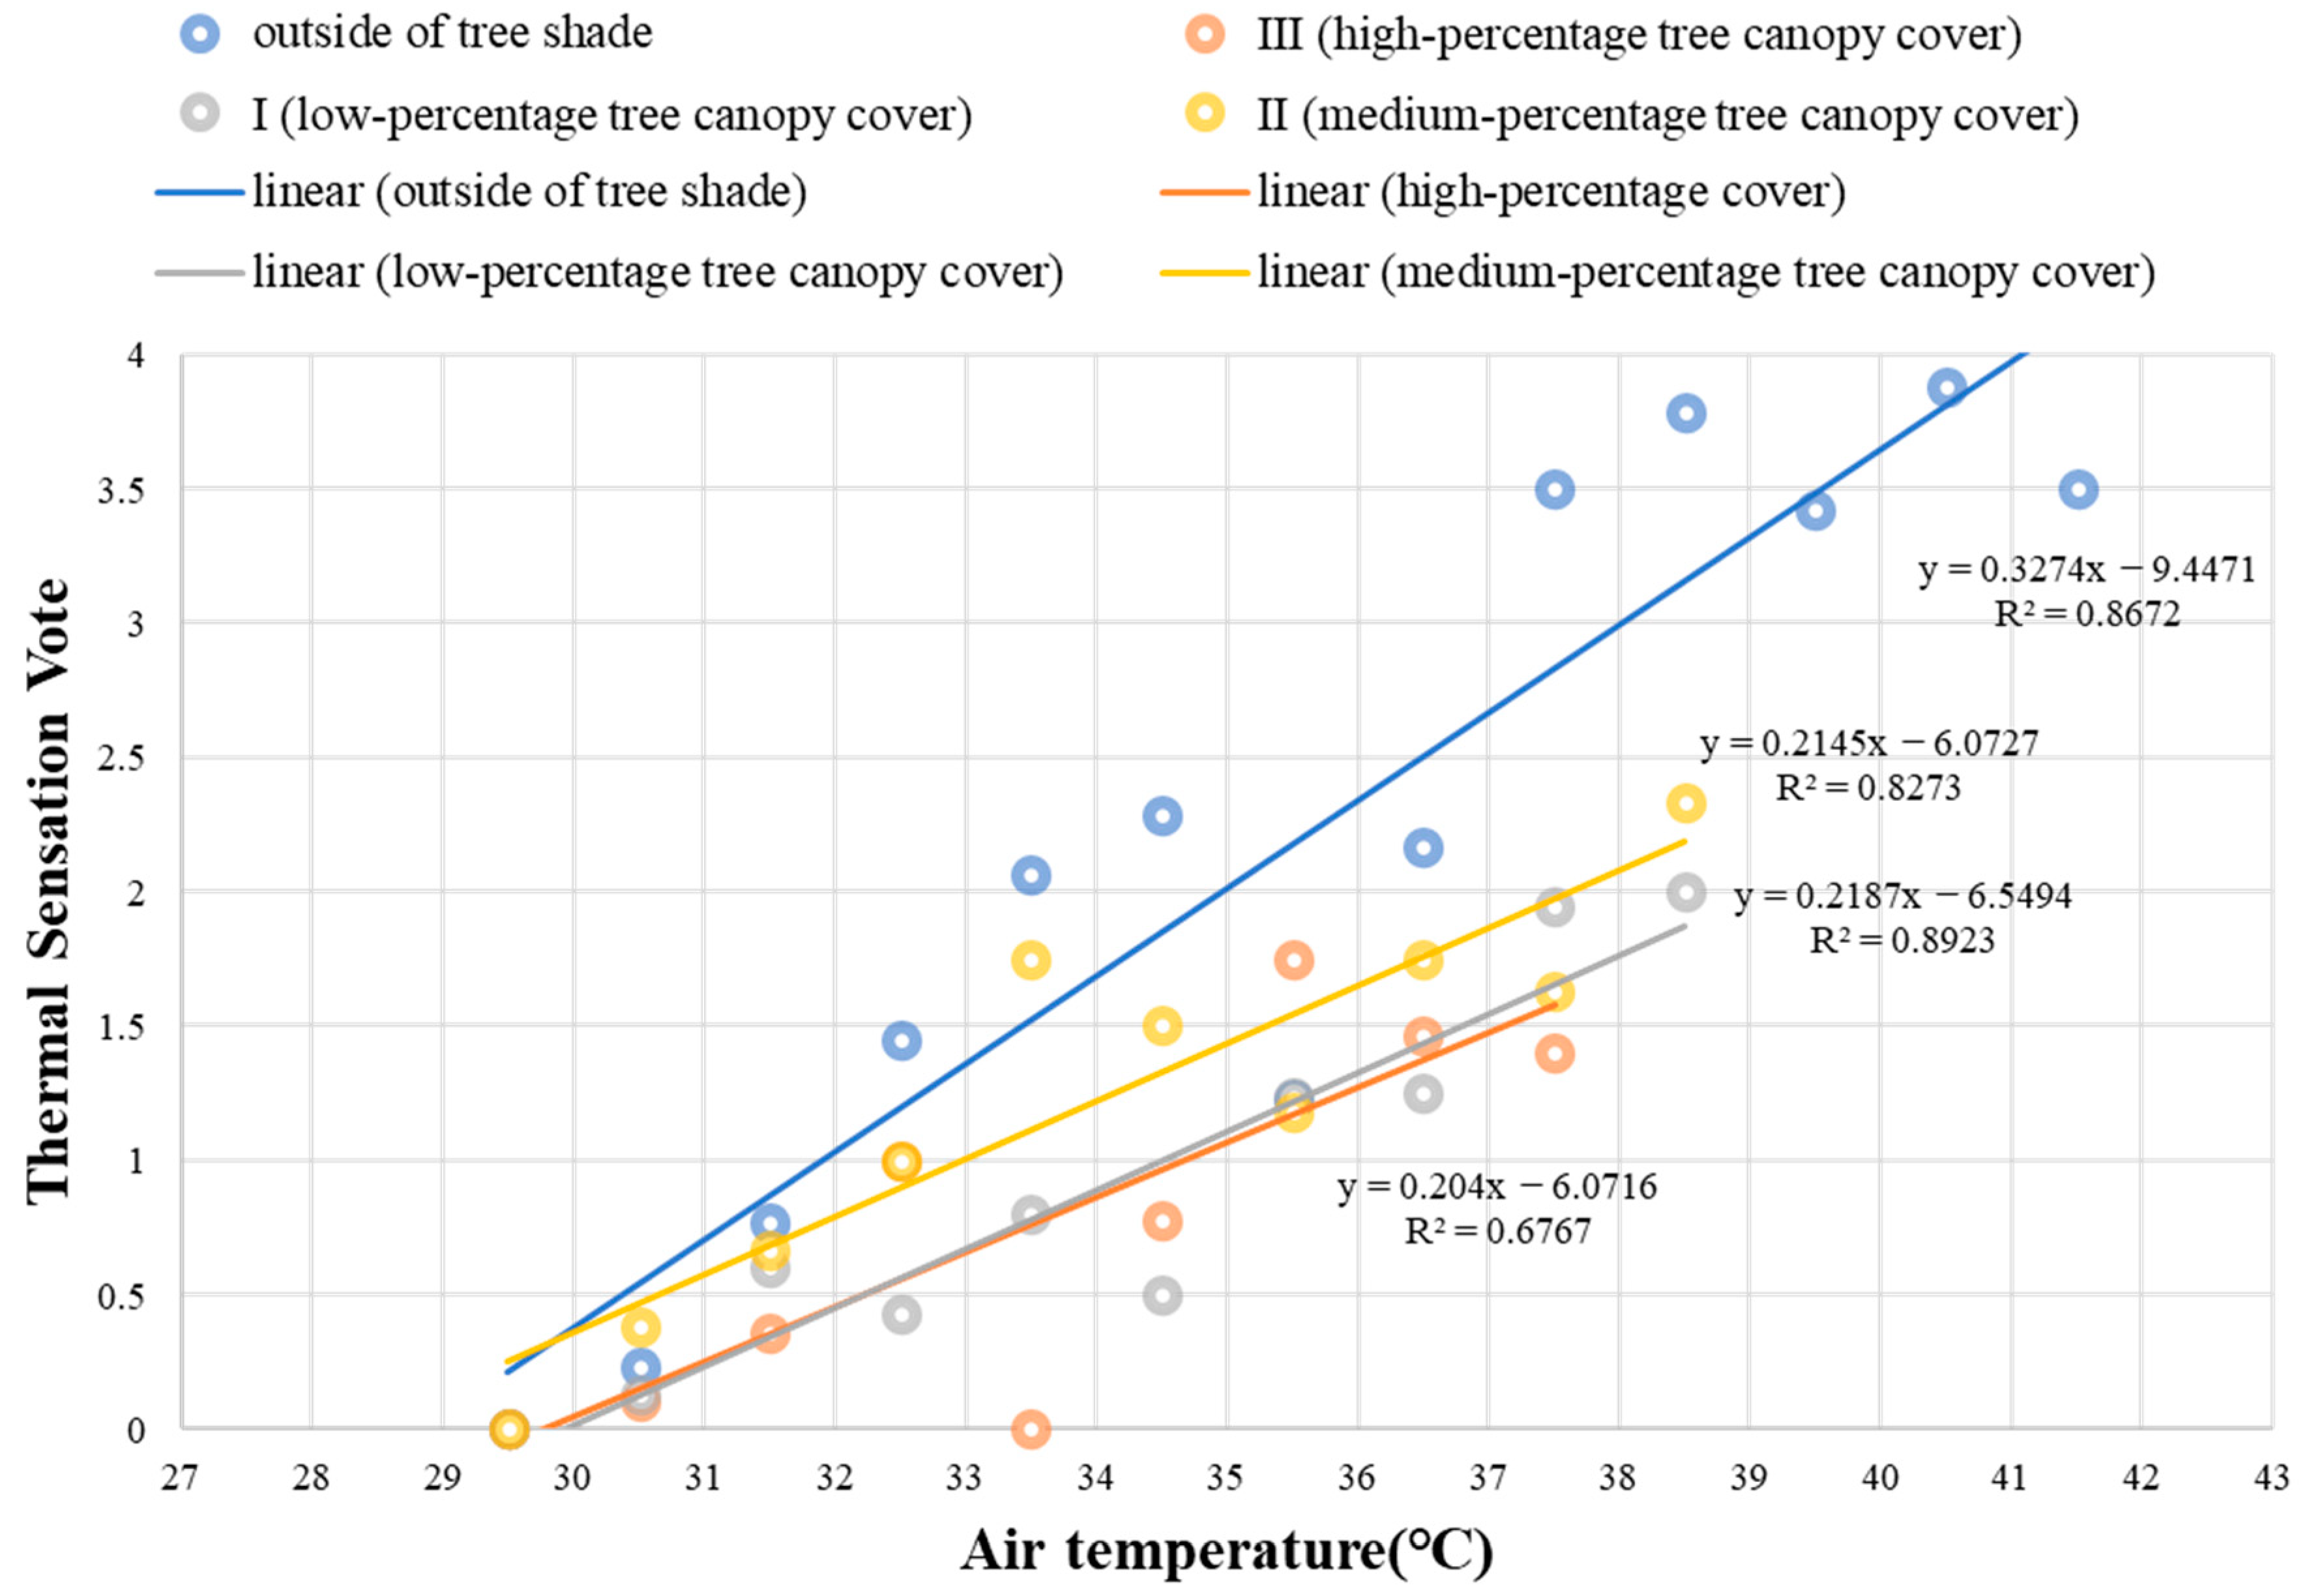
3.3. Predictive Formula for Thermal Sensation

By further exploring the relationship between street microclimate factors and thermal sensation in different degrees of tree canopy cover, the human thermal comfort of the street can be improved by controlling the physical environmental parameters in future planning and design. Formulas for predicting thermal sensation were simulated using linear regression analysis with four independent variables: air temperature, relative humidity, globe temperature and wind speed.
TSV = −0.057 Ta + 0.026 RH + 0.351 GT − 0.121 WS − 10.401 (R2 = 0.601),
where TSV is the predicted thermal sensation vote on a five-point scale from 0 (neutral) to 4 (very hot), Ta is the dry bulb air temperature (°C), RH is relative humidity (%), GT is globe temperature (°C) and WS is wind speed (m/s).
According to this model, in the high temperature and high humidity climate of Wuhan, the globe temperature was the most important meteorological parameter affecting human thermal comfort, followed by wind speed. Air temperature and relative humidity were less important. This differs from the findings of Cheng et al. [26] in Hong Kong which also has a hot and humid climate. In Cheng et al.’s study, wind speed had the greatest effect on thermal sensation, while solar radiation had a very minor effect. This may be because the measurement points were set in shady environments and the direct sunlight environments in this study. Participants were shown to feel more comfortable when moving from sunlit to shaded places, which also strengthened the role of solar radiation [52]. Participants that are accustomed to a high-temperature and high-humidity environment and are thus not sensitive to changes in temperature and humidity can lead to low or negative coefficients of temperature and humidity in the thermal prediction formula. As air temperature and relative humidity cannot be easily controlled in outdoor environments, blocking solar radiation and increasing wind speed are more feasible ways to improve human thermal comfort. Some previous studies have also confirmed this view [53,54]. The empirical formula can reflect the influence of the main microclimate parameters on human thermal sensation, and also provides a reference for designers towards sustainable tree planting in shallow street canyon.
The responses to questions regarding the evaluation of possible remediation methods to improve thermal comfort under different degrees of canopy coverage are displayed in Figure 12. For unshaded areas, most participants (36.92%) suggested that their thermal comfort could be improved by increasing tree coverage, and few (4.65%) chose to maintain the status quo. In the high-percentage tree canopy cover area, a quarter of people indicated that the status quo could be maintained. In the case of tree cover, the majorities of people chose the option of planting shrubs. This is consistent with the results of Klemm et al. [14], who demonstrated that the psychological recognition of rich levels of street greening can offset a situation in which the actual thermal comfort evaluation index is not high. Overall, adding plants was perceived as a better method for improving thermal comfort, in comparison with changing hard paving and buildings.

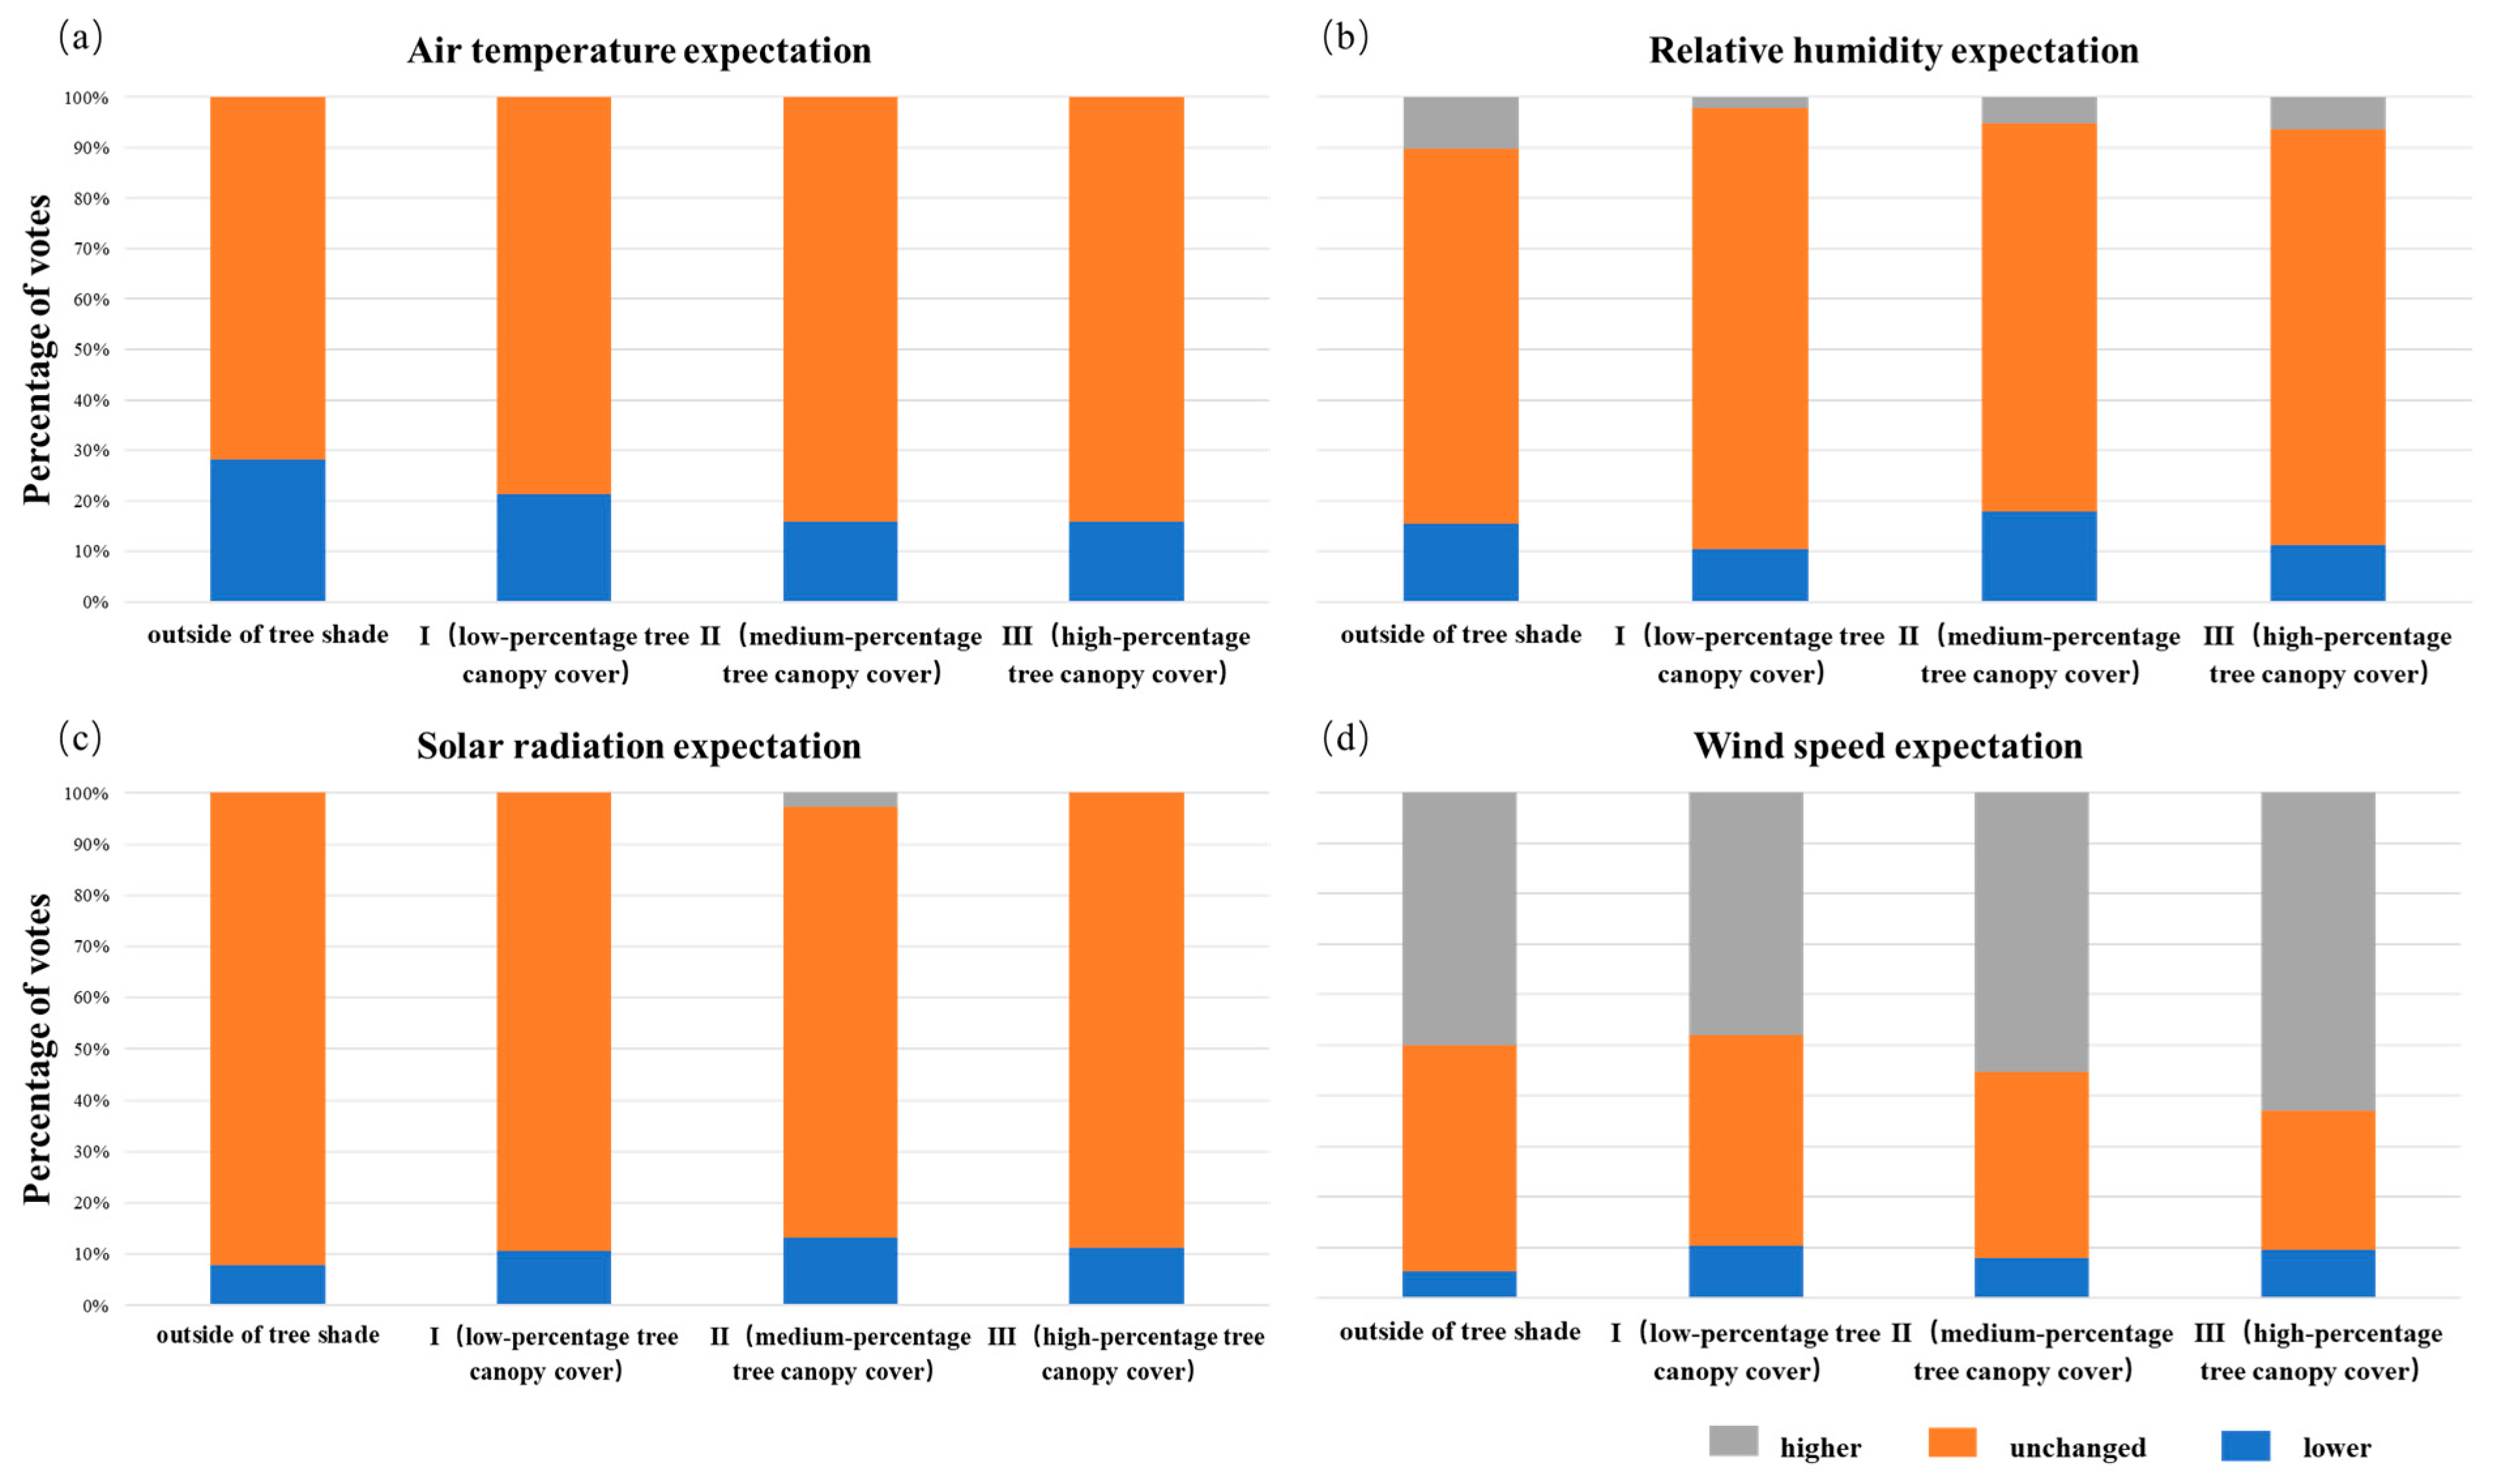
3.4. Limitations and Recommendations for Future Studies

There are several limitations in our study and hence it deserves further analysis and study. In the present study, our consideration of street morphology was relatively simple, and we only considered a situation along one street (E–W) and shallow street canyon. Previous studies have demonstrated that different street directions and different aspect ratios can also impact thermal comfort [37,55]. Further, the number of participants, gender and age were also restricted. In terms of measuring time, we only considered summer and our measurements were only for two days. In future research, we will consider additional diverse street patterns, different seasons and extend the measurement time. A wider age group and more diverse demographic composition will be considered when selecting participants.

4. Conclusions

This study presents the findings of a human thermal comfort study conducted in Wuhan using longitudinal experiments on a street with different degrees of tree canopy cover. We recorded physical measurements and conducted questionnaire surveys to determine the thermal comfort for humans in outdoor street spaces. The results revealed the characteristics of the effects of tree canopy cover on thermal comfort and microclimate given a shallow street canopy. The main conclusions are as follows:
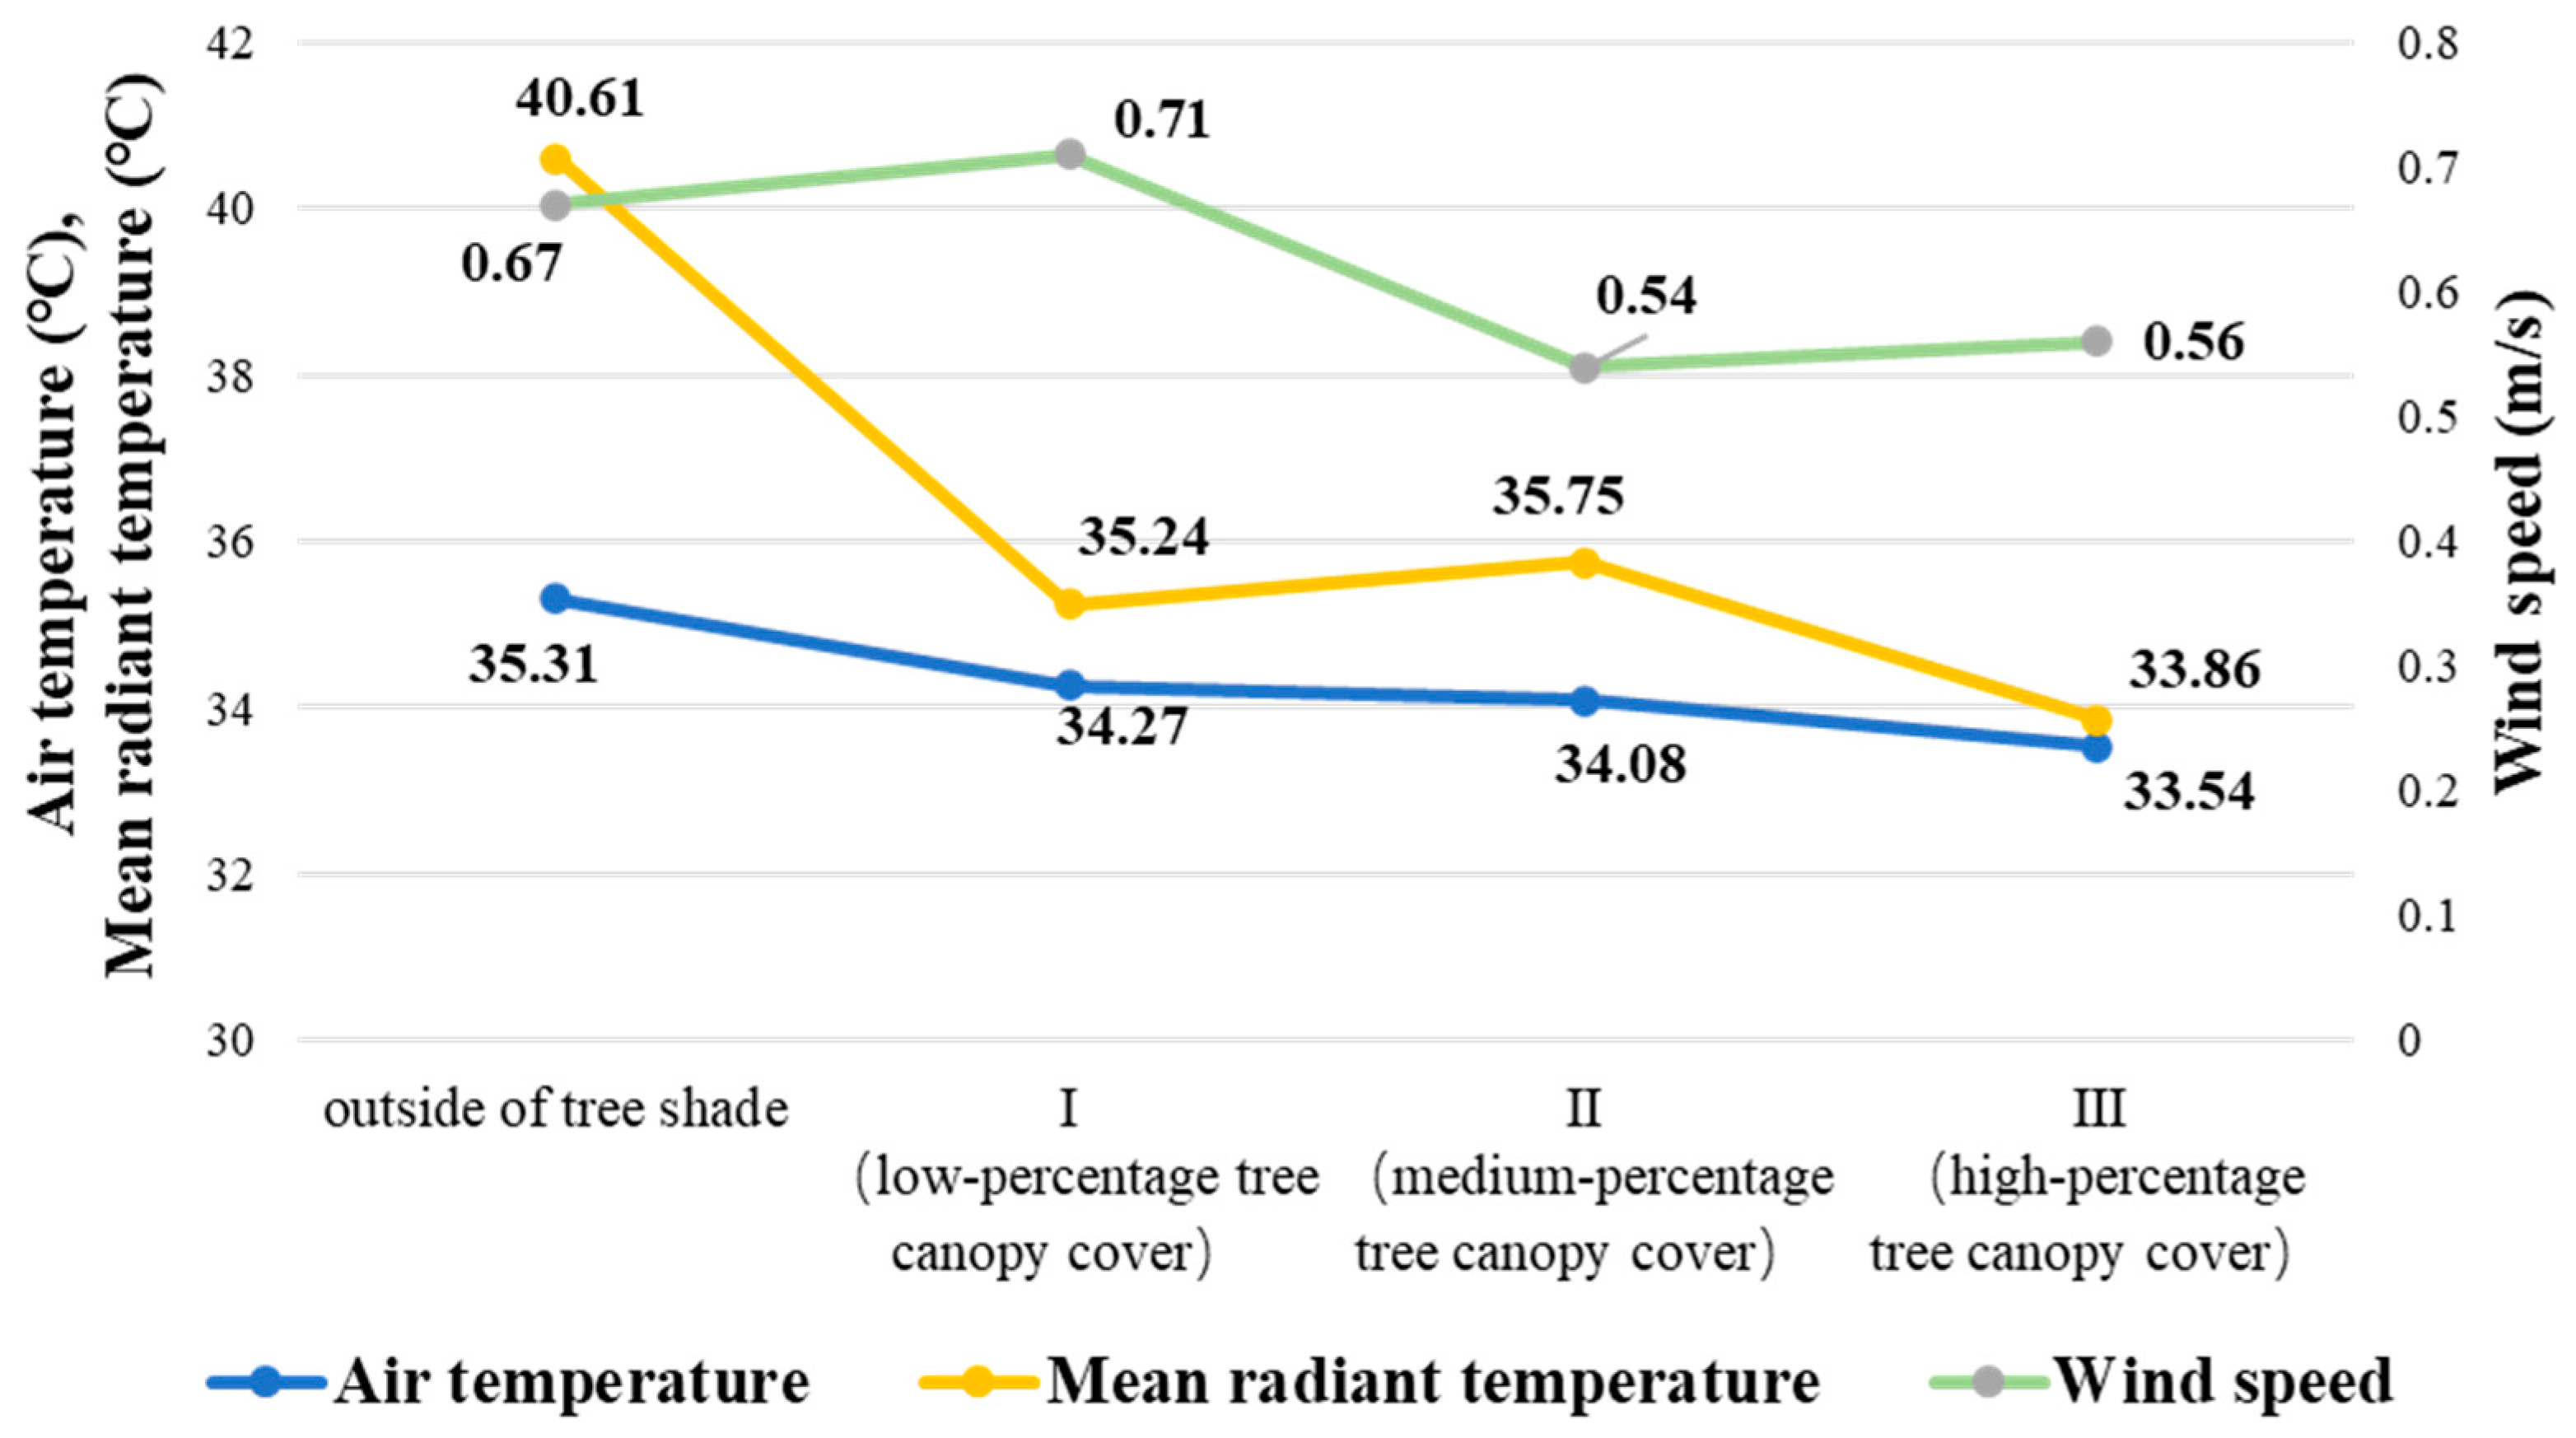
  • In the hot and humid climate of Wuhan, the microclimate benefits of a high-percentage tree canopy cover are greater than that from medium- and low-percentage tree canopy cover, particularly at noon. High-percentage tree canopy cover over a street can reduce midday (12:00–14:00) air temperature and mean radiant temperature by up to 3.3 °C and 13.9 °C, respectively, compared with a similar street lacking tree shade;
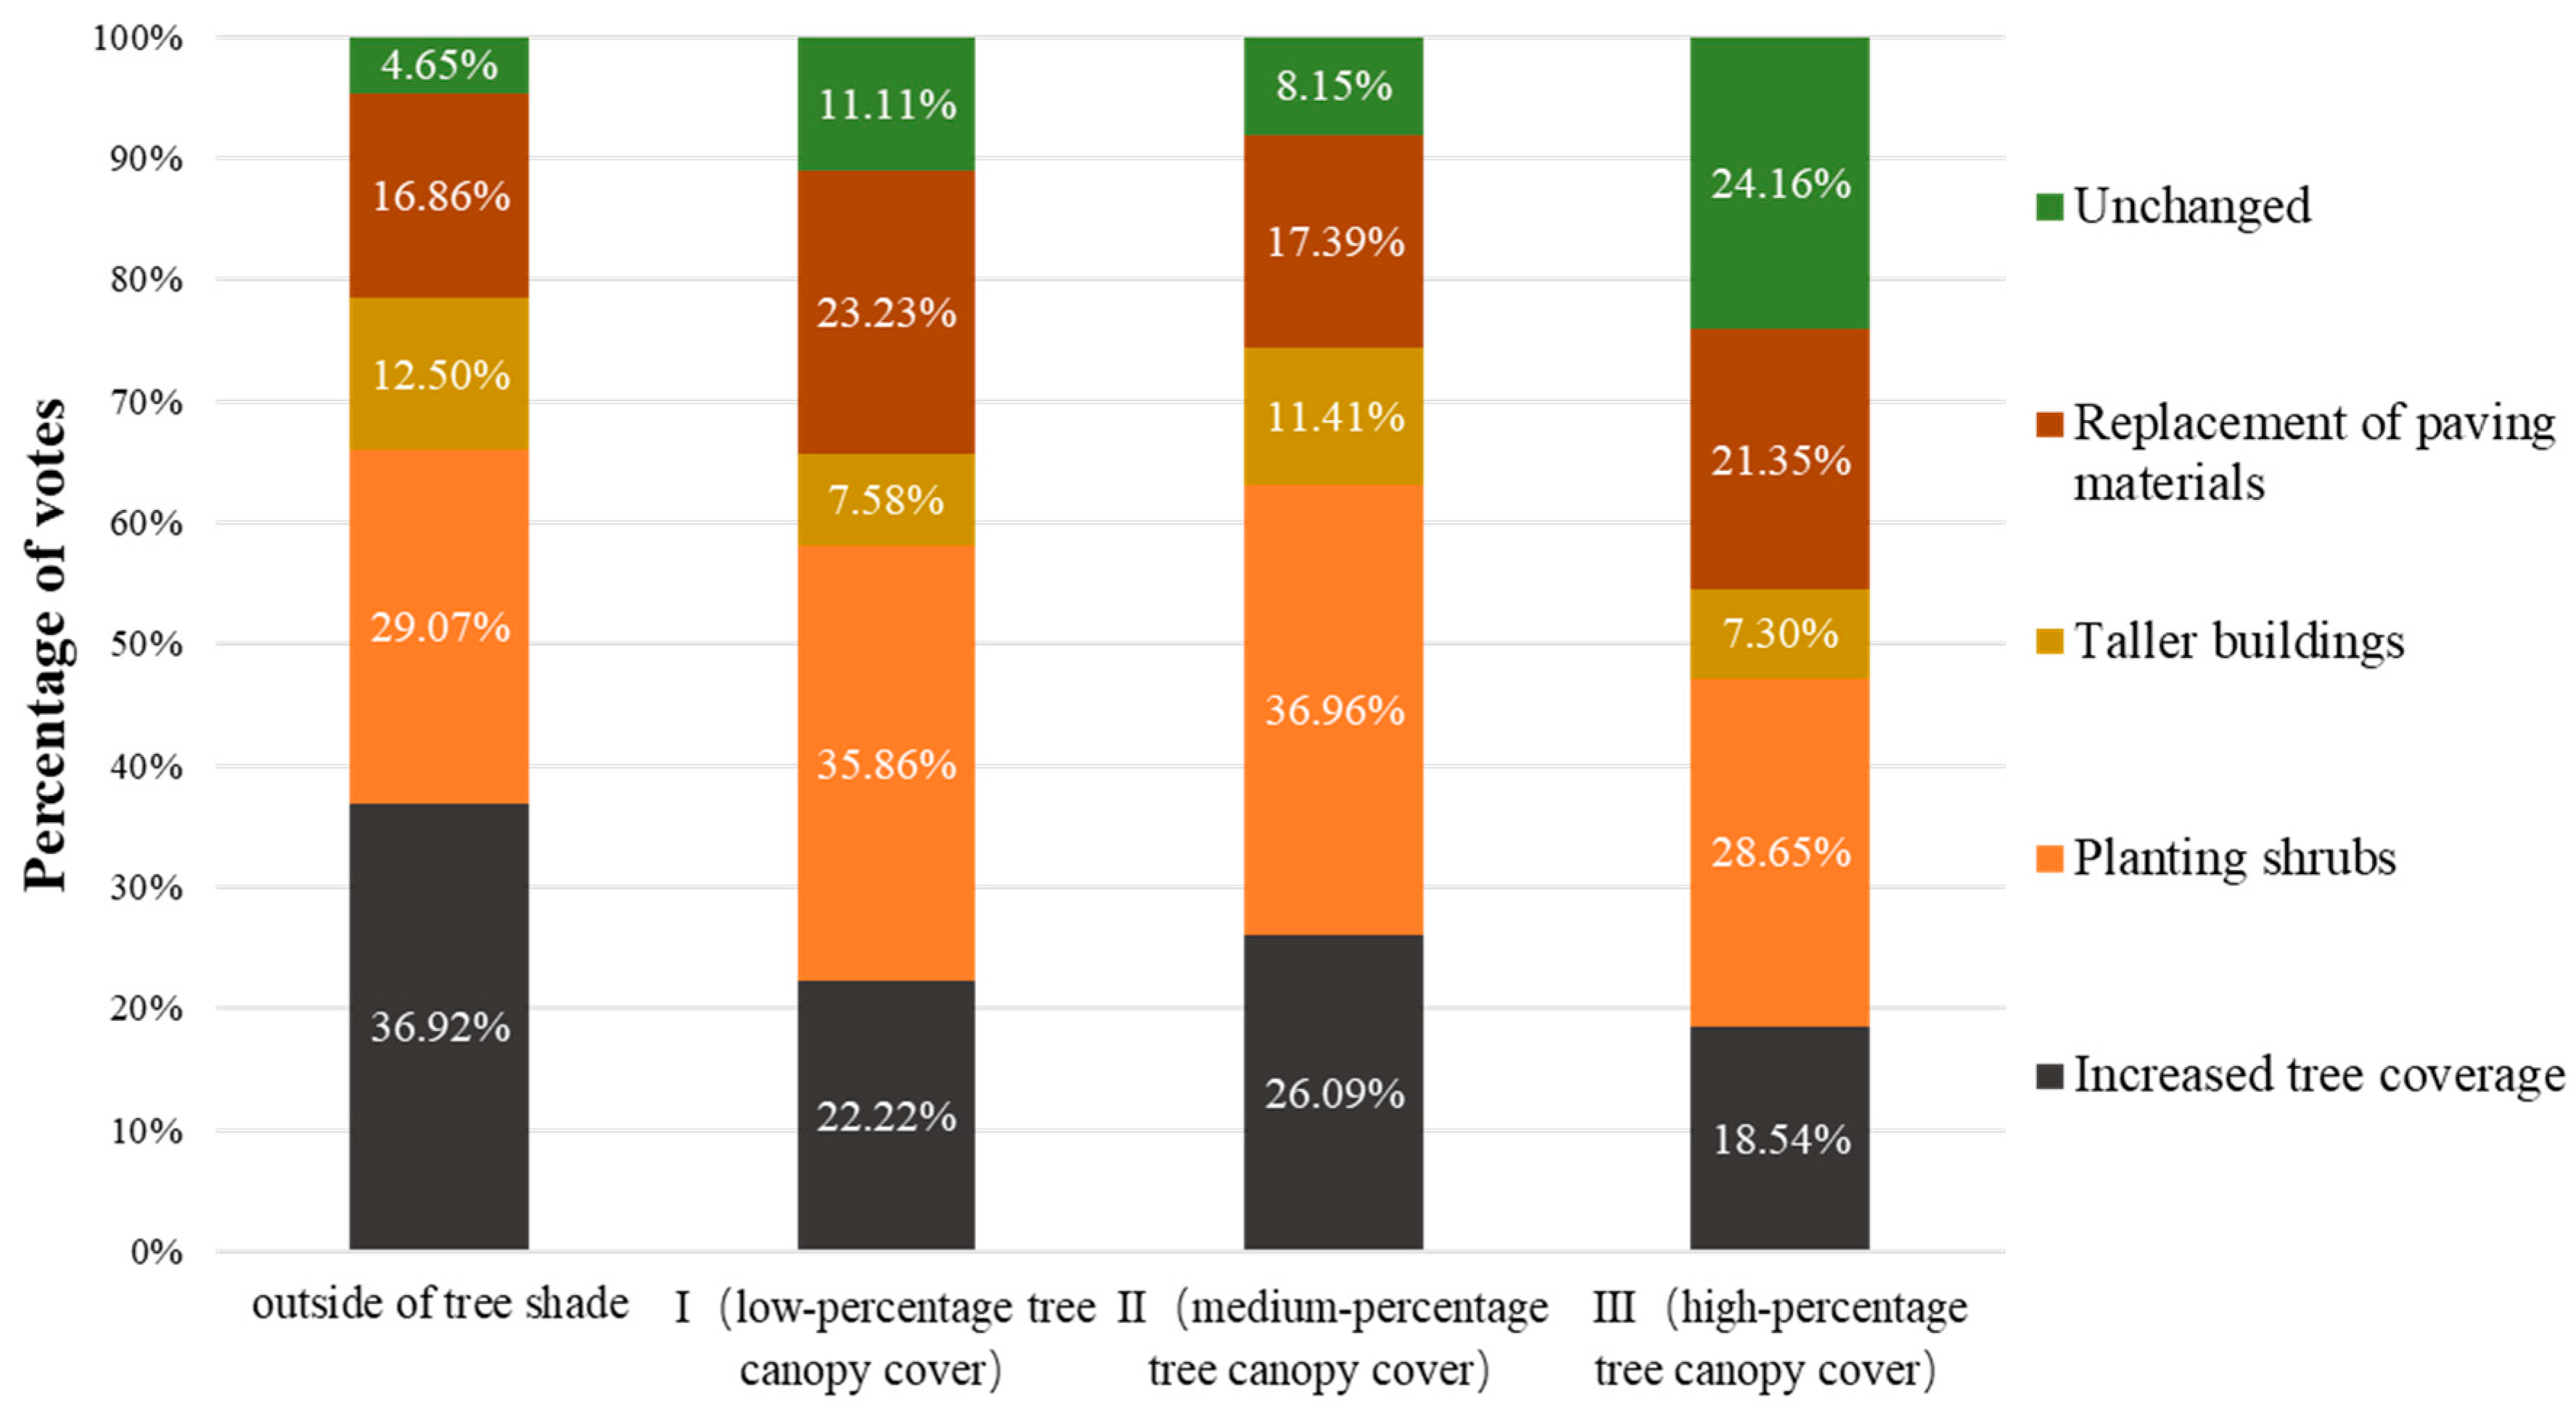
  • Human thermal sensations are affected by a combination of psychology and physiology. Psychological adaptations can help people cope better with their current thermal environment. Thermal sensations are related to the extent of street greenery; the higher the tree canopy cover, the easier it is for people to feel satisfied with their current thermal environment;
  • The neutral and moderate PET thermal ranges that represented the comfort of people on the streets in Wuhan in summer were found to be 28.8 °C and 26.35–31.29 °C, respectively.
  • The thermal sensation prediction formula is proposed and the relationship between human thermal sensation and microclimate factors is established. It is found that blocking solar radiation and increasing wind speed are more feasible than controlling air temperature and humidity as ways to improve human thermal comfort.

Author Contributions

Conceptualization, C.W. and Z.H.; methodology, C.W. and Z.H.; software, Z.H.; validation, C.W., Z.H. and M.T.; formal analysis, Z.H.; investigation, Z.H.; resources, Z.H.; data curation, Z.H.; writing—original draft preparation, Z.H.; writing—review and editing, C.W., M.T. and Y.L.; funding acquisition, C.W. All authors have read and agreed to the published version of the manuscript.

Funding

This research was funded by National Natural Science Foundation of China, Grant Number 31670705 & 31770748; Fundamental Research Funds for the Central Universities, Grant Number 2662017JC037; Wuhan Municipal Bureau of Garden and Forestry, Grant Number WHGF2019A01; State Key Laboratory of Subtropical Building Science, Grant Number 2017ZB06.

Acknowledgments

The authors would like to thank all respondents who participated in this study.

Conflicts of Interest

The authors declare no conflict of interest.

References

  1. Lee, H.; Holst, J.; Mayer, H. Modification of human-biometeorologically significant radiant flux densities by shading as local method to mitigate heat stress in summer within urban street canyons. Adv. Meteorol. 2013, 2013, 1–13. [Google Scholar] [CrossRef]
  2. Piselli, C.; Castaldo, V.; Pigliautile, I.; Pisello, A.; Cotana, F. Outdoor comfort conditions in urban areas: On citizens’ perspective about microclimate mitigation of urban transit areas. Sustain. Cities Soc. 2018, 39, 16–36. [Google Scholar] [CrossRef]
  3. Knez, I.; Thorsson, S. Influences of culture and environmental attitude on thermal, emotional and perceptual evaluations of a public square. Int. J. Biometeorol. 2006, 50, 258–268. [Google Scholar] [CrossRef] [PubMed]
  4. Armson, D.; Rahman, M.A.; Ennos, A.R. A comparison of the shading effectiveness of five different street tree species in Manchester, UK. Arboric. Urban For. 2013, 39, 157–164. [Google Scholar]
  5. Coutts, A.M.; White, E.C.; Tapper, N.J.; Beringer, J.; Livesley, S.J. Temperature and human thermal comfort effects of street trees across three contrasting street canyon environments. Theor. Appl. Climatol. 2016, 124, 55–68. [Google Scholar] [CrossRef]
  6. Kong, L.; Lau, K.K.-L.; Yuan, C.; Chen, Y.; Xu, Y.; Ren, C.; Ng, E. Regulation of outdoor thermal comfort by trees in Hong Kong. Sustain. Cities Soc. 2017, 31, 12–25. [Google Scholar] [CrossRef]
  7. Lee, H.; Mayer, H.; Chen, L. Contribution of trees and grasslands to the mitigation of human heat stress in a residential district of Freiburg, Southwest Germany. Landsc. Urban Plan. 2016, 148, 37–50. [Google Scholar] [CrossRef]
  8. Morakinyo, T.E.; Lau, K.K.-L.; Ren, C.; Ng, E. Performance of Hong Kong’s common trees species for outdoor temperature regulation, thermal comfort and energy saving. Build. Environ. 2018, 137, 157–170. [Google Scholar] [CrossRef]
  9. Santos Nouri, A.; Fröhlich, D.; Matos Silva, M.; Matzarakis, A. The impact of Tipuana tipu species on local human thermal comfort thresholds in different urban canyon cases in Mediterranean climates: Lisbon, Portugal. Atmosphere 2018, 9, 12. [Google Scholar] [CrossRef] [Green Version]
  10. Höppe, P. The physiological equivalent temperature—A universal index for the biometeorological assessment of the thermal environment. Int. J. Biometeorol. 1999, 43, 71–75. [Google Scholar] [CrossRef]
  11. Matzarakis, A.; Mayer, H.; Iziomon, M.G. Applications of a universal thermal index: Physiological equivalent temperature. Int. J. Biometeorol. 1999, 43, 76–84. [Google Scholar] [CrossRef] [PubMed]
  12. Shashua-Bar, L.; Potchter, O.; Bitan, A.; Boltansky, D.; Yaakov, Y. Microclimate modelling of street tree species effects within the varied urban morphology in the Mediterranean city of Tel Aviv, Israel. Int. J. Climatol. 2010, 30, 44–57. [Google Scholar] [CrossRef]
  13. Klemm, W.; Heusinkveld, B.G.; Lenzholzer, S.; Jacobs, M.H.; Van Hove, B. Psychological and physical impact of urban green spaces on outdoor thermal comfort during summertime in The Netherlands. Build. Environ. 2015, 83, 120–128. [Google Scholar] [CrossRef]
  14. Klemm, W.; Heusinkveld, B.G.; Lenzholzer, S.; van Hove, B. Street greenery and its physical and psychological impact on thermal comfort. Landsc. Urban Plan. 2015, 138, 87–98. [Google Scholar] [CrossRef]
  15. Elnabawi, M.H.; Hamza, N. Behavioural Perspectives of Outdoor Thermal Comfort in Urban Areas: A Critical Review. Atmosphere 2019, 11, 51. [Google Scholar] [CrossRef] [Green Version]
  16. Amindeldar, S.; Heidari, S.; Khalili, M. The effect of personal and microclimatic variables on outdoor thermal comfort: A field study in Tehran in cold season. Sustain. Cities Soc. 2017, 32, 153–159. [Google Scholar] [CrossRef]
  17. Krüger, E.L.; Rossi, F.A. Effect of personal and microclimatic variables on observed thermal sensation from a field study in southern Brazil. Build. Environ. 2011, 46, 690–697. [Google Scholar] [CrossRef]
  18. Fang, Z.; Lin, Z.; Mak, C.M.; Niu, J.; Tse, K.-T. Investigation into sensitivities of factors in outdoor thermal comfort indices. Build. Environ. 2018, 128, 129–142. [Google Scholar] [CrossRef]
  19. Lenzholzer, S.; Koh, J. Immersed in microclimatic space: Microclimate experience and perception of spatial configurations in Dutch squares. Landsc. Urban Plan. 2010, 95, 1–15. [Google Scholar] [CrossRef]
  20. Nikolopoulou, M.; Steemers, K. Thermal comfort and psychological adaptation as a guide for designing urban spaces. Energy Build. 2003, 35, 95–101. [Google Scholar] [CrossRef]
  21. Jin, H.; Liu, S.; Kang, J. Thermal comfort range and influence factor of urban pedestrian streets in severe cold regions. Energy Build. 2019, 198, 197–206. [Google Scholar] [CrossRef]
  22. Li, K.; Zhang, Y.; Zhao, L. Outdoor thermal comfort and activities in the urban residential community in a humid subtropical area of China. Energy Build. 2016, 133, 498–511. [Google Scholar] [CrossRef]
  23. Nikolopoulou, M.; Lykoudis, S. Thermal comfort in outdoor urban spaces: Analysis across different European countries. Build. Environ. 2006, 41, 1455–1470. [Google Scholar] [CrossRef] [Green Version]
  24. Gobo, J.P.A.; Faria, M.R.; Galvani, E.; Goncalves, F.L.T.; Monteiro, L.M. Empirical Model of Human Thermal Comfort in Subtropical Climates: A First Approach to the Brazilian Subtropical Index (BSI). Atmosphere 2018, 9, 391. [Google Scholar] [CrossRef] [Green Version]
  25. Gravetter, F.J.; Wallnau, L.B. Essentials of Statistics for the Behavioral Sciences; Wadsworth: Belmont, TN, USA, 2008. [Google Scholar]
  26. Cheng, V.; Ng, E.; Chan, C.; Givoni, B. Outdoor thermal comfort study in a sub-tropical climate: A longitudinal study based in Hong Kong. Int. J. Biometeorol. 2012, 56, 43–56. [Google Scholar] [CrossRef] [PubMed]
  27. Givoni, B.; Noguchi, M.; Saaroni, H.; Pochter, O.; Yaacov, Y.; Feller, N.; Becker, S. Outdoor comfort research issues. Energy Build. 2003, 35, 77–86. [Google Scholar] [CrossRef]
  28. Uchida, M.; Mochida, A.; Sasaki, K.; Tonouchi, T. Field measurements on turbulent flow field and thermal environment in and around biotope with pond and green space. In Proceedings of the Seventh International Conference on Urban Climate, Yokohama, Japan, 29 June–3 July 2009. [Google Scholar]
  29. Zhenghong, C.; Haijun, W.; Guoyu, R. Asymmetrical Change of Urban Heat Island Intensity in Wuhan, China. Adv. Clim. Chang. Res. 2007, 9, 282–286. [Google Scholar]
  30. The Second C40 Urban Sustainable Development Forum Held in Wuhan. Available online: http://www.hubei.gov.cn/xxbs/bmbs/sfgw1/201709/t20170925_1067458.shtml (accessed on 17 March 2020).
  31. Yu, J.; Yang, C.; Tian, L. Low-energy envelope design of residential building in hot summer and cold winter zone in China. Energy Build. 2008, 40, 1536–1546. [Google Scholar] [CrossRef]
  32. Zhang, L.; Zhan, Q.; Lan, Y. Effects of the tree distribution and species on outdoor environment conditions in a hot summer and cold winter zone: A case study in Wuhan residential quarters. Build. Environ. 2018, 130, 27–39. [Google Scholar] [CrossRef]
  33. Thorsson, S.; Lindberg, F.; Eliasson, I.; Holmer, B. Different methods for estimating the mean radiant temperature in an outdoor urban setting. Int. J. Climatol. 2007, 27, 1983–1993. [Google Scholar] [CrossRef]
  34. Souch, C. The effect of trees on summertime below canopy urban climates: A case study Bloomington, Indiana. J. Arboric. 1993, 19, 303–312. [Google Scholar]
  35. Vailshery, L.S.; Jaganmohan, M.; Nagendra, H. Effect of street trees on microclimate and air pollution in a tropical city. Urban For. Urban Green. 2013, 12, 408–415. [Google Scholar] [CrossRef]
  36. Shashua-Bar, L.; Hoffman, M.E. Vegetation as a climatic component in the design of an urban street: An empirical model for predicting the cooling effect of urban green areas with trees. Energy Build. 2000, 31, 221–235. [Google Scholar] [CrossRef]
  37. Sanusi, R.; Johnstone, D.; May, P.; Livesley, S.J. Street orientation and side of the street greatly influence the microclimatic benefits street trees can provide in summer. J. Environ. Qual. 2016, 45, 167–174. [Google Scholar] [CrossRef] [PubMed] [Green Version]
  38. McNall, P.; Jaax, J.; Rohles, F.; Nevins, R.; Springer, W. Thermal comfort (thermally neutral) conditions for three levels of activity. ASHRAE Trans. 1967, 73, 1–3. [Google Scholar]
  39. Park, M.; Hagishima, A.; Tanimoto, J.; Narita, K.-I. Effect of urban vegetation on outdoor thermal environment: Field measurement at a scale model site. Build. Environ. 2012, 56, 38–46. [Google Scholar] [CrossRef]
  40. Djamila, H.; Kumaresan, S.; Chu, C.-M. Standard 55-2004: Thermal Environment Conditions for Human Occupancy; American Society of Heating, Ventilating and Air-Conditioning Engineers, Inc.: Atlanta, GA, USA, 2004. [Google Scholar]
  41. Ng, E.; Yau, R.; Wong, K.; Ren, C.; Katszchner, L. Final Report of Hong Kong Urban Climatic Map and Standards for Wind Environment—Feasibility Study; Planning Department of Hong Kong Government: Hongkong, China, 2012.
  42. Williams, R. Field investigation of thermal comfort, environmental satisfaction and perceived control levels in UK office buildings. In Proceedings of the 4th International Conference Healthy Buildings, Milan, Italy, 10–14 September 1995; pp. 1181–1186. [Google Scholar]
  43. McIntyre, D.A. Indoor Climate; Applied Science: Essex, UK, 1980. [Google Scholar]
  44. Shooshtarian, S. Theoretical dimension of outdoor thermal comfort research. Sustain. Cities Soc. 2019, 47, 101495. [Google Scholar] [CrossRef]
  45. Kántor, N.; Unger, J.; Gulyás, Á. Subjective estimations of thermal environment in recreational urban spaces—Part 2: International comparison. Int. J. Biometeorol. 2012, 56, 1089–1101. [Google Scholar] [CrossRef]
  46. Thorsson, S.; Honjo, T.; Lindberg, F.; Eliasson, I.; Lim, E.-M. Thermal comfort and outdoor activity in Japanese urban public places. Environ. Behav. 2007, 39, 660–684. [Google Scholar] [CrossRef]
  47. Yin, J.; Zheng, Y.; Wu, R.; Tan, J.; Ye, D.; Wang, W. An analysis of influential factors on outdoor thermal comfort in summer. Int. J. Biometeorol. 2012, 56, 941–948. [Google Scholar] [CrossRef]
  48. Yang, W.; Wong, N.H.; Zhang, G. A comparative analysis of human thermal conditions in outdoor urban spaces in the summer season in Singapore and Changsha, China. Int. J. Biometeorol. 2013, 57, 895–907. [Google Scholar] [CrossRef] [PubMed]
  49. Chen, L.; Wen, Y.; Zhang, L.; Xiang, W.-N. Studies of thermal comfort and space use in an urban park square in cool and cold seasons in Shanghai. Build. Environ. 2015, 94, 644–653. [Google Scholar] [CrossRef]
  50. Lin, T.-P.; Matzarakis, A. Tourism climate and thermal comfort in Sun Moon Lake, Taiwan. Int. J. Biometeorol. 2008, 52, 281–290. [Google Scholar] [CrossRef] [PubMed]
  51. Climate Data for Cities Worldwide—Climate-Data.org. Available online: https://en.cliamte-data.org (accessed on 10 January 2020).
  52. Lau, K.K.-L.; Shi, Y.; Ng, E.Y.-Y. Dynamic response of pedestrian thermal comfort under outdoor transient conditions. Int. J. Biometeorol. 2019, 63, 979–989. [Google Scholar] [CrossRef]
  53. Johansson, E.; Yahia, M.W.; Arroyo, I.; Bengs, C. Outdoor thermal comfort in public space in warm-humid Guayaquil, Ecuador. Int. J. Biometeorol. 2018, 62, 387–399. [Google Scholar] [CrossRef] [Green Version]
  54. Potvin, A. Assessing the microclimate of urban transitional spaces. In Proceedings of the Passive Low Energy Architecture, Cambridge, UK, 2–5 July 2000; pp. 581–586. [Google Scholar]
  55. Tan, Z.; Lau, K.K.-L.; Ng, E. Planning strategies for roadside tree planting and outdoor comfort enhancement in subtropical high-density urban areas. Build. Environ. 2017, 120, 93–109. [Google Scholar] [CrossRef]
Figure 1. Flow chart of research framework.
Atmosphere 11 00588 g001
Figure 2. Aerial view of the street highlighting the extent of street segments according to the percentage of tree coverage. A–I indicate the nine measuring points.
Atmosphere 11 00588 g002
Figure 3. Mobile meteorological station used in the study.
Atmosphere 11 00588 g003
Figure 4. Illustration of the thermal comfort experimental procedure.
Atmosphere 11 00588 g004
Figure 5. Changes in microclimatic factors under different degrees of tree canopy cover: (a) Average air temperature; (b) average relative humidity; (c) average wind speed; (d) mean radiant temperature.
Atmosphere 11 00588 g005
Figure 6. Distribution of thermal sensation votes across different degrees of tree canopy cover.
Atmosphere 11 00588 g006
Figure 7. Microclimate expectations under different degrees of tree canopy cover when the thermal sensation vote is “neutral” (TSV = 0). (a) Air temperature expectation; (b) relative humidity expectation; (c) solar radiation expectation; (d) wind speed expectation.
Atmosphere 11 00588 g007
Figure 8. Correlation between thermal sensation vote (TSV) and air temperature (°C) in degrees of tree canopy cover.
Atmosphere 11 00588 g008
Figure 9. Mean values of air temperature, wind speed and radiation temperature under different degrees of tree canopy cover during the three questionnaire periods (morning 8:00–10:00, afternoon 12:00–14:00 and evening 19:00–21:00).
Atmosphere 11 00588 g009
Figure 10. (a) Correlation between the mean thermal sensation votes (MTSV) and physiologically equivalent temperature (PET); (b) correlation between the thermal acceptable rate and PET.
Atmosphere 11 00588 g010
Figure 11. Monthly mean air temperature of several large cities in China, as reported in this and previous studies [51].
Atmosphere 11 00588 g011
Figure 12. Participant responses regarding suggested methods to improve thermal comfort under different degrees of tree canopy cover.
Atmosphere 11 00588 g012
Table 1. Characteristics of the street used for data collection 1.
Section NumberTree Canopy Cover PercentageH/W RatioLengthMeasuring Point (in the Tree Shade)Measuring Point (out of Tree Shade)
I38.61% (low percentage)0.62150 mG/IH
II52.05% (medium percentage)0.57A/BC/D
III94.16% (high percentage)0.61E/F
1 Sections I–III and points A–H are shown in Figure 2.
Table 2. Sensor specification for the portable weather station used in the study.
ParameterInstrument/SensorSpecification (Accuracy)
Air temperatureRichter thermal comfort test system ISO7730±0.5 °C
Relative humidity±2%
Globe temperature±0.5 °C
Wind speed0–0.5 m/s: ±5 cm; 0.5–1.5 m/s: ±10 cm; >1.5 m/s: 4%
Table 3. General meteorological conditions on the micrometeorological measurement days and sunrise and sunset times in Wuhan, the China 1.
DateAir Temperature (°C)Relative Humidity (%)Wind Speed (m/s)Sunrise TimeSunset Time
MeanMaxMinMeanMaxMinMeanMaxMin
18 August 201932.938.228.160.888391.42.605:50:5419:02:33
19 August 201931.637.924.957.386341.52.70.45:51:3019:01:30
1 Data from the meteorological station of Wuhan meteorological bureau.
Table 4. Comparison of neutral physiologically equivalent temperature (PET) and PET comfort ranges in several large cities in China.
ReferenceCityClimate ZoneStudy AreaResearch TypeNeutral PET (°C)PET Comfort Range (°C)
The present studyWuhanWarm and temperate (Cfa)StreetLongitudinal28.8226.35–31.29
Yang et al., 2013 [48]ChangshaWarm and temperate (Cfa)Park/square/street/university campusHorizontal27.9224–31
Li et al., 2016 [22]GuangzhouWarm and temperate (Cfa)Residential areaHorizontal18.1–31.1
Chen et al., 2015 [49]ShanghaiWarm and temperate (Cfa)SquareHorizontal15–29
Cheng et al., 2012 [26]HongkongHumid subtropical (Cwa)SquareLongitudinal25.03≤28.67
Lin and Matzarakis, 2008 [50]Sun Moon Lake, TaiwanHumid subtropical (Cwa)ParkHorizontal27.226–30

