Article

Quantitative Determination Procedures for Regional Extreme Drought Conditions: Application to Historical Drought Events in South Korea

1
Department of Civil Engineering, University of Suwon, Hwaseong-si, Gyeonggi-do 445-743, Korea
2
Department of Aeronautics and Civil Engineering, Hanseo University, Seosan 31962, Korea
*
Author to whom correspondence should be addressed.
Atmosphere 2020, 11(6), 581; https://doi.org/10.3390/atmos11060581
Submission received: 30 March 2020 / Revised: 25 May 2020 / Accepted: 27 May 2020 / Published: 2 June 2020
(This article belongs to the Special Issue Meteorological Extremes in Korea: Prediction, Assessment, and Impact)

Abstract

:
Recently, the signs of extreme droughts, which were thought of as exceptional and unlikely, are being detected worldwide. It is necessary to prepare countermeasures against extreme droughts; however, current definitions of extreme drought are just used as only one or two indicators to represent the status or severity of a drought. More representative drought factors, which can show the status and severity that are relevant to extreme drought, need to be considered depending on the characteristics of the drought and comprehensive evaluation of various indices. Therefore, this study attempted to quantitatively define regional extreme droughts using more acceptable factors. The methodology comprises five factors that are indicative of extreme drought. The five factors are (1) duration (days), (2) number of consecutive years (years), (3) water availability, (4) return period, and (5) regional experience. The results were analyzed by applying the procedure to droughts that took place in 2014–2015 in South Korea. The results showed that the applied historical event did not enter the status of extreme drought, which is proposed in this study; however, the proposed methodology is applicable because it uses acceptable and reasonable factors to judge extreme drought, but it can also take into account the past regional experience of extreme drought.

1. Introduction

Recent meteorological events have been attributed to abnormal conditions such as changes in temperature and rainfall patterns. Global warming, which began in the late 19th century, has increased the global average surface temperature by approximately 1 °C from the early 2000s to 2018 [1]. In addition, the climate prediction model indicates that floods and droughts will occur frequently in the future [2,3]. The signs of “black swan”-type droughts, which were thought of as exceptional and unlikely, are being detected worldwide. Especially, in the case of Korea, it is predicted that a severe drought will occur in the future based on the climate change scenario [4,5,6].
Droughts are a particularly complex type of natural disaster. Kogan [7] suggested that frequent droughts, because of their complex nature, have a profound impact on all aspects of life, including the economy, agriculture, and nature. Traditional studies [8,9] have classified droughts into meteorological, agricultural, hydrological, and socioeconomic types. Accordingly, various drought indices have been developed and used to evaluate the different types of drought. Currently, the most frequently utilized drought indices include: Palmer Drought Severity Index (PDSI) [10], which is used to evaluate meteorological droughts, the Standardized Precipitation Index (SPI), which is used to analyze droughts based on shortage of precipitation [11], the Streamflow Drought Index (SDI) [12], and the Surface Water Supply Index (SWSI) [13]. In addition, studies have been conducted to quantify the causes of drought based on the Modified Surface Water Supply Index (MSWSI) [14] and the Soil Moisture Index (SMI) [15].
As the severity of droughts increases due to constant changes in climate, it is necessary to develop countermeasures against extreme phenomena. Regarding the definition of extreme drought, Woodhouse and Overpeck [16] defined extreme drought based on two major drought events that occurred between the 13th and 16th centuries by comparing the severity, duration, and spatial extent of drought by century. Stahle et al. [17] defined the most severe and long-lasting droughts on the American continent during the 20th century (1930 and 1950) as extreme droughts using the PDSI index. Woodhouse and Overpeck [16] and Stahle et al. [17] have reconstructed the PDSI based on proxy paleoclimate records quantified the severity and duration of paleo-droughts. In South Korea, the National Drought Information Analysis Center under the Ministry of Environment reports extreme droughts using drought indices such as the SPI index. The hydrological weather drought information system under the Korean Meteorological Administration (KMA) defines extreme droughts as events in which the extreme drought stage of the SPI index lasts longer than 20 days; however, current definitions use only one to two indicators to represent the severity of a drought. More representative drought factors that are applicable under extreme drought conditions need to be considered depending on the characteristics of the drought or to comprehensively evaluate various indices. Vicente-Serrano et al. [18] proposed the Standardized Precipitation Evapotranspiration Index (SPEI), which is used to assess drought by adding temperature parameters in addition to the representative drought index SPI. Kim et al. [19,20] evaluated drought in Korea using the SPEI to propose an operational plan to prepare for flood and drought simultaneously; however, this approach does not adequately define extreme drought resulting in comprehensive damage. To address this limitation, Park and Kim [21] evaluated extreme drought in Korea by evaluating the drought index as well as the reproduction period and water supply capacity; however, it did not reflect regional characteristics.
Therefore, in this study, we attempted to quantitatively define regional extreme droughts using more acceptable five factors, which can reflect the physical status and severity of the drought. The results were analyzed by applying the procedure to droughts that took place in 2014–2015, during which time drought was extremely severe in South Korea.

2. Methodology

2.1. Procedure for the Analysis of Extreme Drought

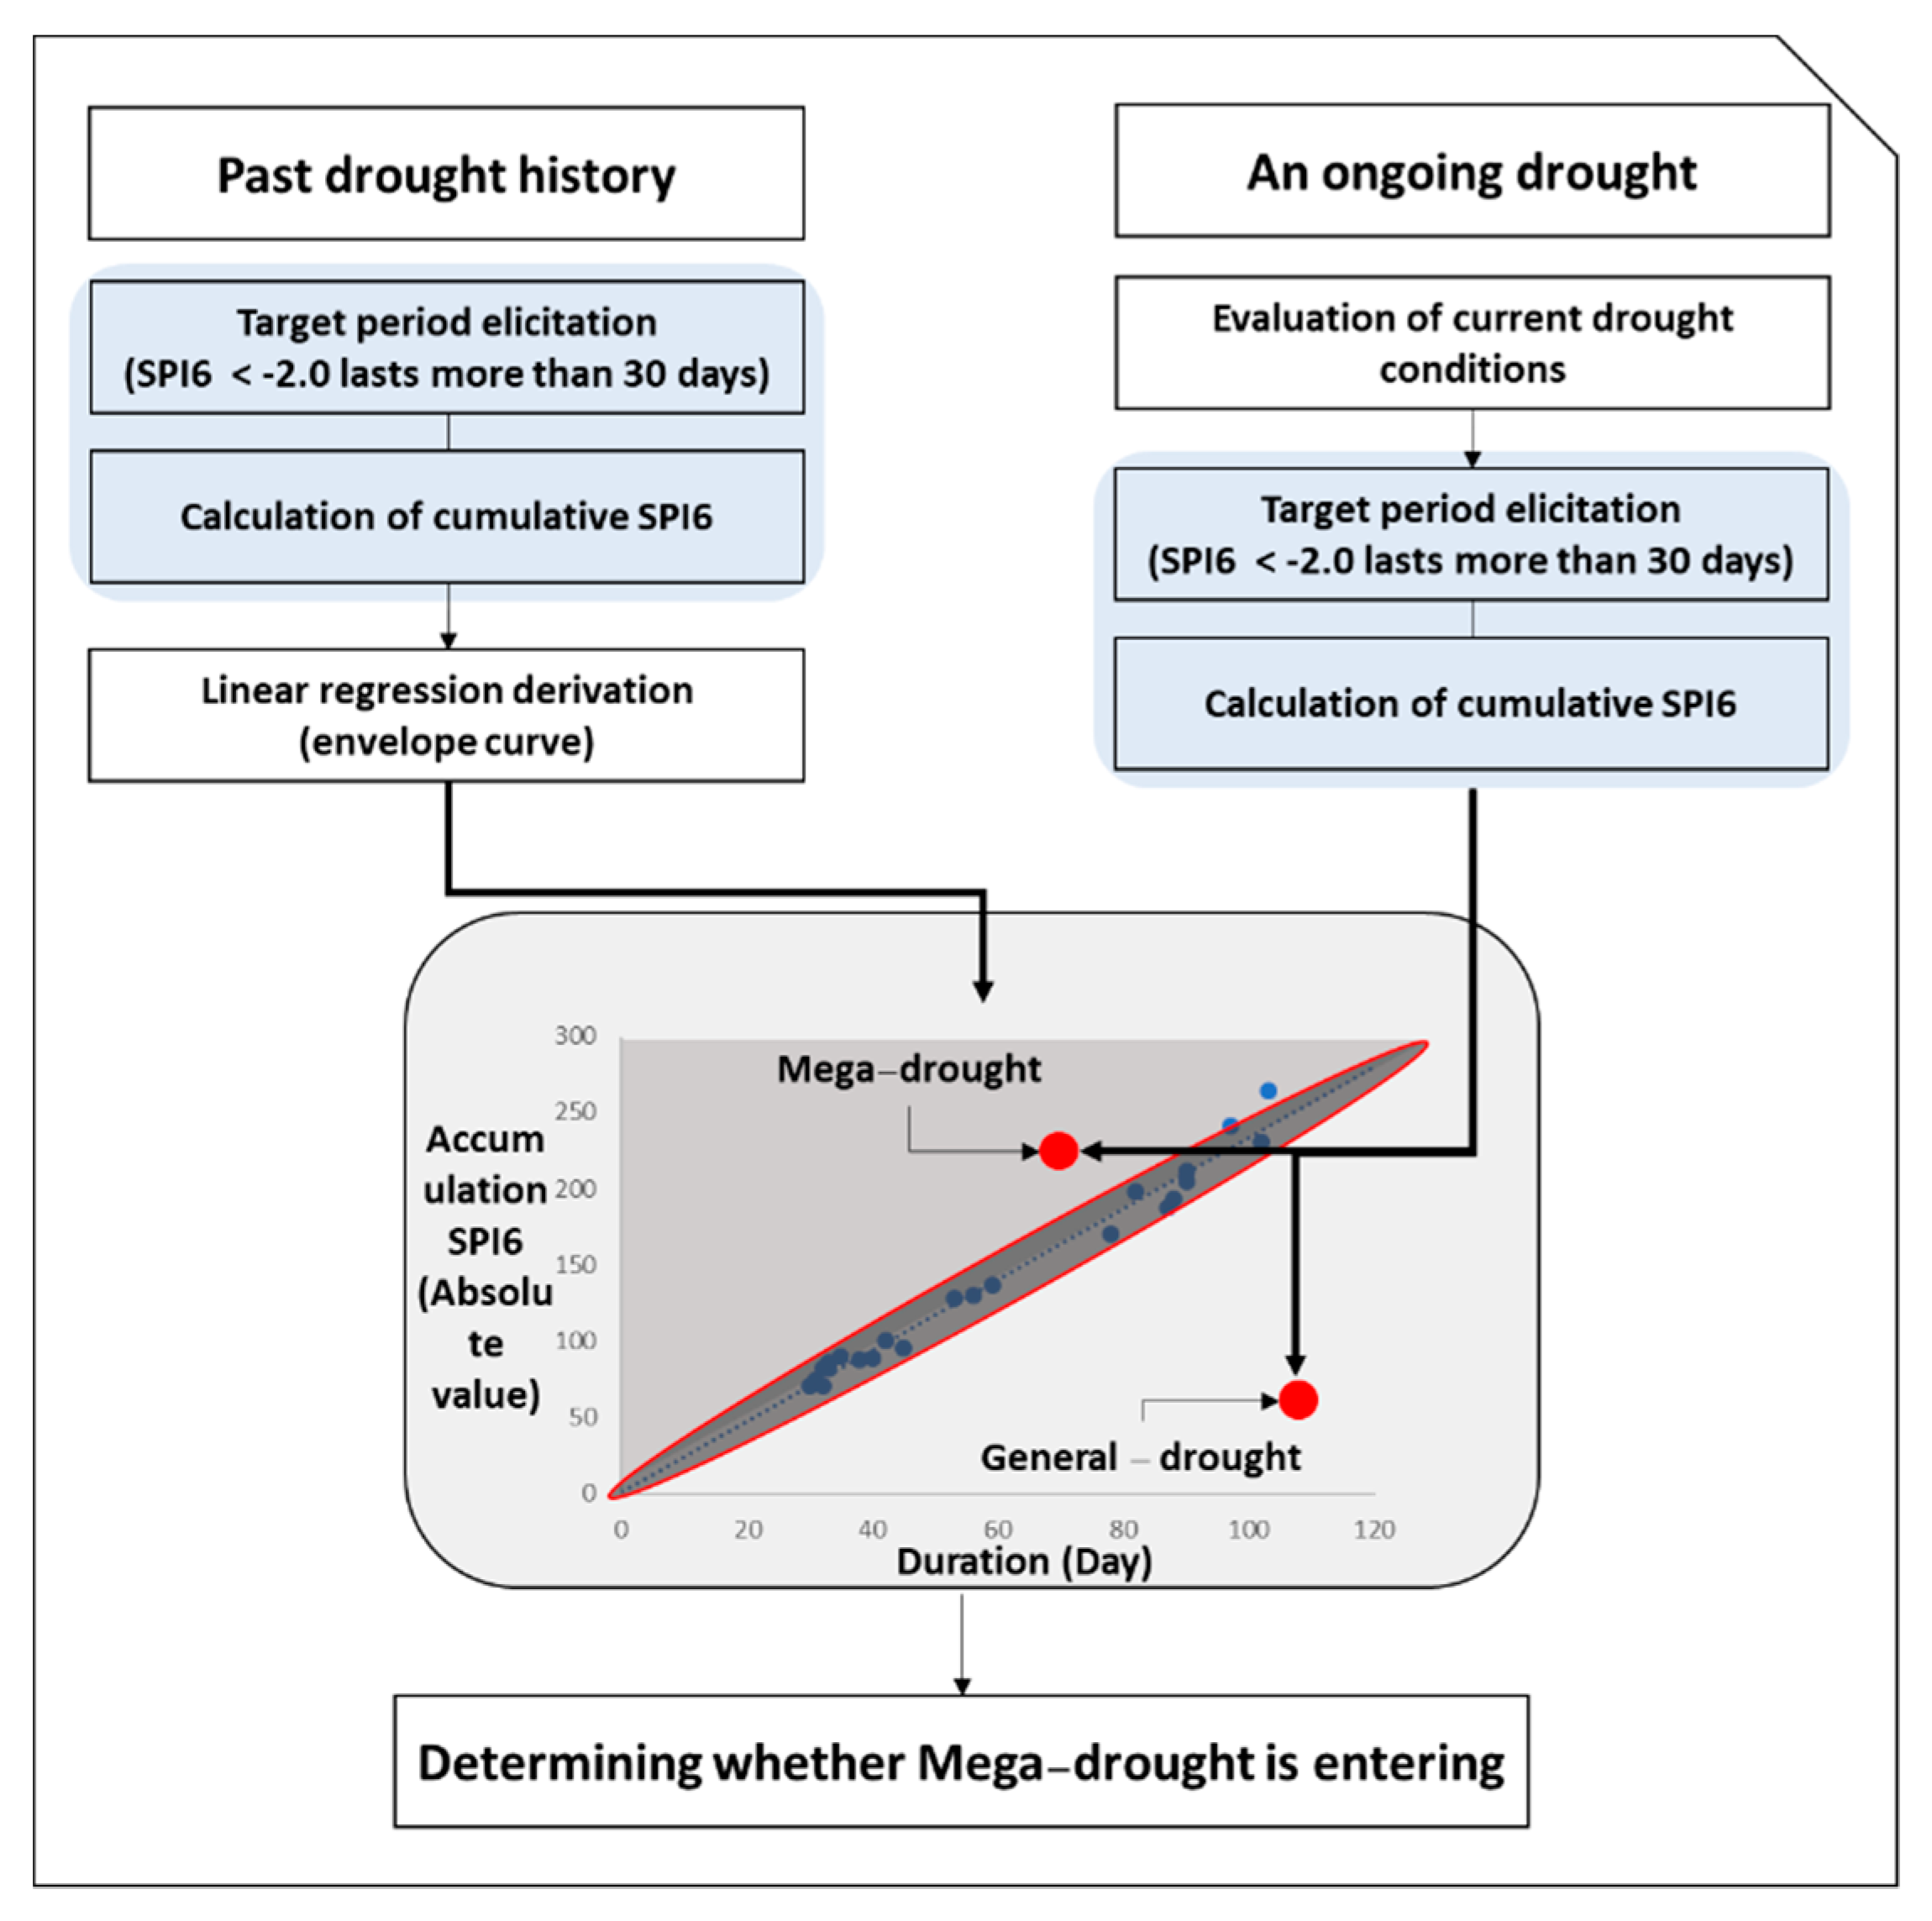
The procedure for identifying an extreme drought is shown in Figure 1. The following five factors were used to determine drought severity: (i) duration (days), (ii) number of consecutive years (years), (iii) water availability, (iv) return period, and (v) regional experience. Factor A refers to the duration (days) of extreme drought. If −2 or less value is maintained for more than 30 days based on the daily SPI, it is judged to be satisfied with the first criteria. Factor B can represent how long-lasting the drought is, and is repeated for several years (8 years in this study). Factor C refers to the period during which water resources are available; the water supply, derived from analysis of the regional water budget, is evaluated and a drought is labeled extreme if the water supply drops below the defined value. Factor D represents the recurrence interval. Finally, factor E reflects past occurrences of regional drought, and the envelope curve method was applied to determine extreme drought. If all the five factors are satisfied, the target region is considered to have entered extreme drought. The basis for calculating the values presented above is detailed in the next section.

2.2. Factors Determining Extreme Drought

2.2.1. Factor A: Drought Monitoring (Duration, Standardized Precipitation Index)

In South Korea, the Korean Meteorological Administration (KMA) officially evaluates drought based on six-month cumulative daily precipitation (SPI6) data [22,23], because SPI6 reflects South Korean climate characteristics, such as the amount of seasonal precipitation; therefore, the SPI6 data supplied by the KMA are used in this study. The SPI is a representative meteorological drought index that can be used to estimate the severity of drought using only the amount of precipitation. Based on the calculated SPI, the drought status classification according to the range of SPI values is presented in Table 1. The most severe level of drought among the drought categories presented was one with an SPI value of −2.00 or less. The Korea Meteorological Administration defines extreme droughts as those lasting more than 20 days and recurring in consecutive years; however, no clear evidence is available for the appropriateness of the 20-day cut-off value; it was based on the experience and opinions of experts. Therefore, to establish the duration criteria of extreme drought for factor A, historical SPI data in the jurisdiction (Figure 2) of 8 local governments in Korea from 1974 to 2019 were analyzed. Daily SPI6 (KMA data) was used for the analysis, and a case that lasted more than 20 days under −2.00 was derived (Table 2). A total of 21 cases included those in which SPI6 <−2.00 continued for more than 20 days, and half of them lasted less than 30 days. Therefore, the range of extreme drought duration defined in this study was considered appropriate for more than 30 days with a relatively low frequency. In addition, a survey was conducted to evaluate the appropriateness of the range of duration to be defined in this study. A total of 171 opinions were included, including opinions in the target area from experts (26 people) studying droughts, government officials (31 people) providing information on droughts, farmers (30 people) affected by droughts, and finally, the general public (84 people). The survey showed 32.4 days (Table 3). It was judged that the duration of 30 days or more defined in this study was more appropriate than the current extreme drought range of 20 days.

2.2.2. Factor B: Drought Monitoring (Consecutive Years of Drought)

Droughts occur over a long period of time, causing serious damage, and also occur repeatedly over several years. If the extent of drought can be judged according to its duration in days, it is necessary to also identify the degree of drought recurring over the years. Therefore, this study investigated whether a drought occurring for 8 consecutive years qualifies as extreme drought based on the data presented in Table 3 (SPI less than −1) and the same SPI6. The appropriate number of years of recurrence to qualify as extreme drought has yet to be defined, so we relied on the experience of experts. Accordingly, a survey was conducted to seek experts’ responses regarding the number of years of recurrence of extreme drought or SPI6 days of duration. The survey found that repeated droughts over more than eight years can be considered as extreme drought conditions. Therefore, this study analyzed droughts that continued for at least 8 consecutive years and determined whether they fall under the category of extreme drought. In the event of longer droughts, further quantitative analysis is needed to determine the range of recurrence over the years and define extreme drought conditions.

2.2.3. Factor C: Availability of Water Resources

One form of damage caused by drought involves the depletion of reservoirs, which results in a lack of water supply. Therefore, this study demonstrated that the period during which water resources can be utilized is necessary to determine whether a drought falls under the extreme category. Hashimoto et al. [24] proposed the evaluation of the water system using factors such as reliability, resilience, and vulnerability to estimate the period of water availability. To this end, Moy et al. [25] developed a plan for the evaluation of reservoir operating rules. Kang and Park [26] evaluated the water supply capacity to optimize reservoir operations. In addition, Lee and Kang [27] proposed the Water Supply Capacity Index (WSCI), which can be used for drought monitoring. The application of the proposed index was evaluated via a comparative analysis based on existing drought indices. The WSCI can be used to measure the duration for which a reservoir’s water supply will last based on the current amount of reservoir water and the amount of water that will be in demand in the future. It is calculated based on the monthly water supply, so the unit is set to months, and the amount of water remaining at the end of the month is subtracted from the amount supplied in the following month. If the remaining amount of water is greater than the planned supply, the same procedure is repeated to calculate whether the water supply will be satisfactory after a few months, based on the formulae defined in Equations (1) to (5) below.
The initial value of WSCI was assumed to be
W S C I 0 = 0
S t D t + 1
If   Equation   ( 2 )   is   true ,   W S C I 1 = 1 , S t , 1 = S t D t + 1 If   it   is   false ,   the   final   WSCI   value   is   obtained   as :   W S C I F i n a l = W S C I 0 + ( S t / D t + 1 )
If Equation (2) is true, then Equation (3) is calculated and determined whether it is S t , 1 D t + 2 , and Equation (3) is repeated until
S t , 1 D n D _ [ n ]
is false.
The final WSCI value is calculated as follows:
W S C I F i n a l = ( n 1 ) + ( S t , n 1 / D n ) ,
where S t denotes water supply at the end of the month, D t + 1 refers to water supply in the following month, and D n is the water supply for the subsequent month, (n − 1) is the current amount of reservoir water (number of months of supply), and S t , n 1 / D n is a measure of the water supply remaining after supplying water for (n − 1) months to cover the current water supply for n months starting from the present time.
In this study, based on the WSCI calculated above, the capacity to supply water given the currently available amount of reservoir water was evaluated to determine the classification of extreme drought. As the usage data, the monthly water supply of Boryeong Dam was used. Based on this data, the month of supply and the average monthly supply were calculated. Lastly, extreme drought was judged according to the ratio of average water supply capacity as shown in D in Figure 1.

2.2.4. Factor D: Return Period

In South Korea, typically, extreme droughts return after 50 years in the case of SPI when the level of severity for each drought index is considered. Notably, the concept of duration rather than severity is used as a criterion to define extreme drought [28]. Also, U.S. Drought Monitor (USDM; [29]) defines extreme drought anomalies as D4 (Exceptional Drought), which occurs once in a generation at a frequency of 50 years [30]. Therefore, in this study, a drought with a recurrence interval of 50 years, the SPI standard, was considered extreme drought.

2.2.5. Factor E: Determination of Past Regional Extreme Droughts

The damage caused by drought will increase depending on its severity, but the damage will also vary from region to region. For example, for a drought of a similar level of severity in regions A and B, region A is likely to have developed response plans for severe drought if it had experienced a similar level of drought in the past; however, if it has no history of such droughts, different, probably less-extreme responses and countermeasures will be implemented. Therefore, in this study, the envelope curve method was applied to analyze the regional characteristics associated with the occurrence of past droughts. The envelope curve is generally used to identify peaks in rainfall and runoff on a hydrograph, with a graph incorporating a specific number of peaks or all points. A schematic showing the application of this method to drought is shown in Figure 3. First, the cumulative SPI6 and cumulative duration (days) are calculated by counting the number of cases where SPI6 > −2.00 continued for more than 30 days in the region of interest, and the envelope curve for the region was drawn. The cumulative SPI6 and duration (days) of the SPI6 of the current drought are calculated and substituted for the existing envelope curve to determine whether the drought is extreme. This study analyzed the regional characteristics of extreme drought using this method and determined whether a region experienced extreme drought. We applied this method to Chungcheongnam-do, Korea to analyze the results.

3. Application and Results

3.1. Status of Applicable Regions

Chungcheongnam-do is divided into 15 districts, as shown in Figure 4. Dangshin, Boryeong, and Seosan in the northwestern region are included in the Boryeong Dam basin zone. Due to decreasing water volume, the conditions fall into the ‘attention’ stage each year, which is the second of five stages of drought warning. In 2015, the water capacity of Boryeong Dam declined to 18.9%, reaching a ‘serious’ level of water storage, which was equivalent to one-third of the water that was available in previous years, and was, therefore, regarded as an unprecedented drought in Korea. In this study, the methodology used to determine extreme cases of drought was applied to Dangjin, Boryeong, and Seosan, where extreme drought occurred. The time period ranged from 1974 to 2015, and further analysis was conducted to determine whether the drought that occurred in 2015 was extreme.

3.2. Analysis of Each Factor

3.2.1. Drought Monitoring (Days of Duration, SPI)

Based on the daily SPI6 data from the western Chungcheongnam-do region supplied by the Korean Meteorological Administration, an estimate of the number of cases in which SPI6 of −2.0 or less continued for 30 days or more since 1978 is shown in Table 4. Drought monitoring in Dangjin, Seosan, and Boryeong revealed that extreme drought conditions occurred three times in 2000, four times between 2007 and 2008, and two times in 2015. In 2015, in which severe drought occurred, the cumulative SPI6 value was the lowest compared with the cumulative number of days, but the number of cumulative days was the highest measured. The SPI classifies drought using only precipitation data, and it is generally accepted that it appropriately represented the drought scenario in 2015, when the precipitation shortage was severe.

3.2.2. Drought Monitoring (Consecutive Years of Drought)

The monthly SPI is calculated for years of recurrence. The results of the analysis of droughts in Dangjin, Seosan, and Boryeong from 1974 to 2015 are shown in Figure 5. The results are based on the SPI monthly data presented by the Korean Meteorological Administration. Dangjin City experienced drought (SPI6 < −1.00) in August for three consecutive years, from 2013 to 2015, and drought occurred in Seosan and Boryeong in August for two years (2014 and 2015). This analysis assumes that the present time is 31 December 2015. If drought continues to occur after 2015, it will meet the eight-consecutive-year benchmark outlined in this study; however, it has yet to be defined as extreme drought.

3.2.3. Water Resource Availability

The water supply capacity is calculated based on water balance analysis using data pertaining to dam water levels. However, the objective of this study is to propose procedures determining whether a drought can be categorized as extreme. Therefore, we analyzed the capacity of Boryeong Dam using the proposed procedure and the results obtained. Since Dangjin, Seosan, and Boryeong lie within the Boryeong Dam basin zone, we determine whether a drought should be categorized as extreme considering the availability of water in the Boryeong Dam. We found that the water supply was limited to two months in 2014 and six months beginning in July of 2015 (summer season in South Korea), as shown in Figure 6. Similarly, as can be seen in Table 4, the SPI value in Dangjin, Seosan from August 2015 sharply increased. The water supply was never at 60% of capacity for more than 10 months, which is an existing definition of extreme drought. However, these results are based on the assumption that the current date is January 2016, and we used the procedure to determine whether the drought of 2015 could be categorized as extreme. If the graph shown in Figure 6 persists in 2016, the results that satisfy both assumptions will be obtained. Of course, if one of the two assumptions is satisfied, the drought in 2015 will be defined as extreme.

3.2.4. Drought Recurrence Interval

The drought recurrence interval can differ greatly depending on the method and data set used to calculate. Since the purpose of this study was to propose a methodology for the determination of extreme drought, the period of drought recurrence calculated as described previously [20] was used and the results were analyzed. To quantify past droughts in Korea, [20] we derived a Severity–Duration–Frequency (SDF) curve using the SPI index, and the period of recurrence of drought for each observation was presented. In addition, SPI6 was used to define the SDF curve, and the results of the verification of past droughts were presented. As a result, the three-month average SPI6 values for Dangjin and Seosan were obtained and substituted for the corresponding curves. The derived value is −2.1, which corresponds to a frequency of about 20 years. In Boryeong, the drought did not last for more than one month, and was excluded from the calculation of recurrence interval. Dangjin, Seosan, and Boryeong did not meet the criteria for the recurrence interval to be categorized as extreme drought.

3.2.5. Determination of Extreme Regional Drought in the Past

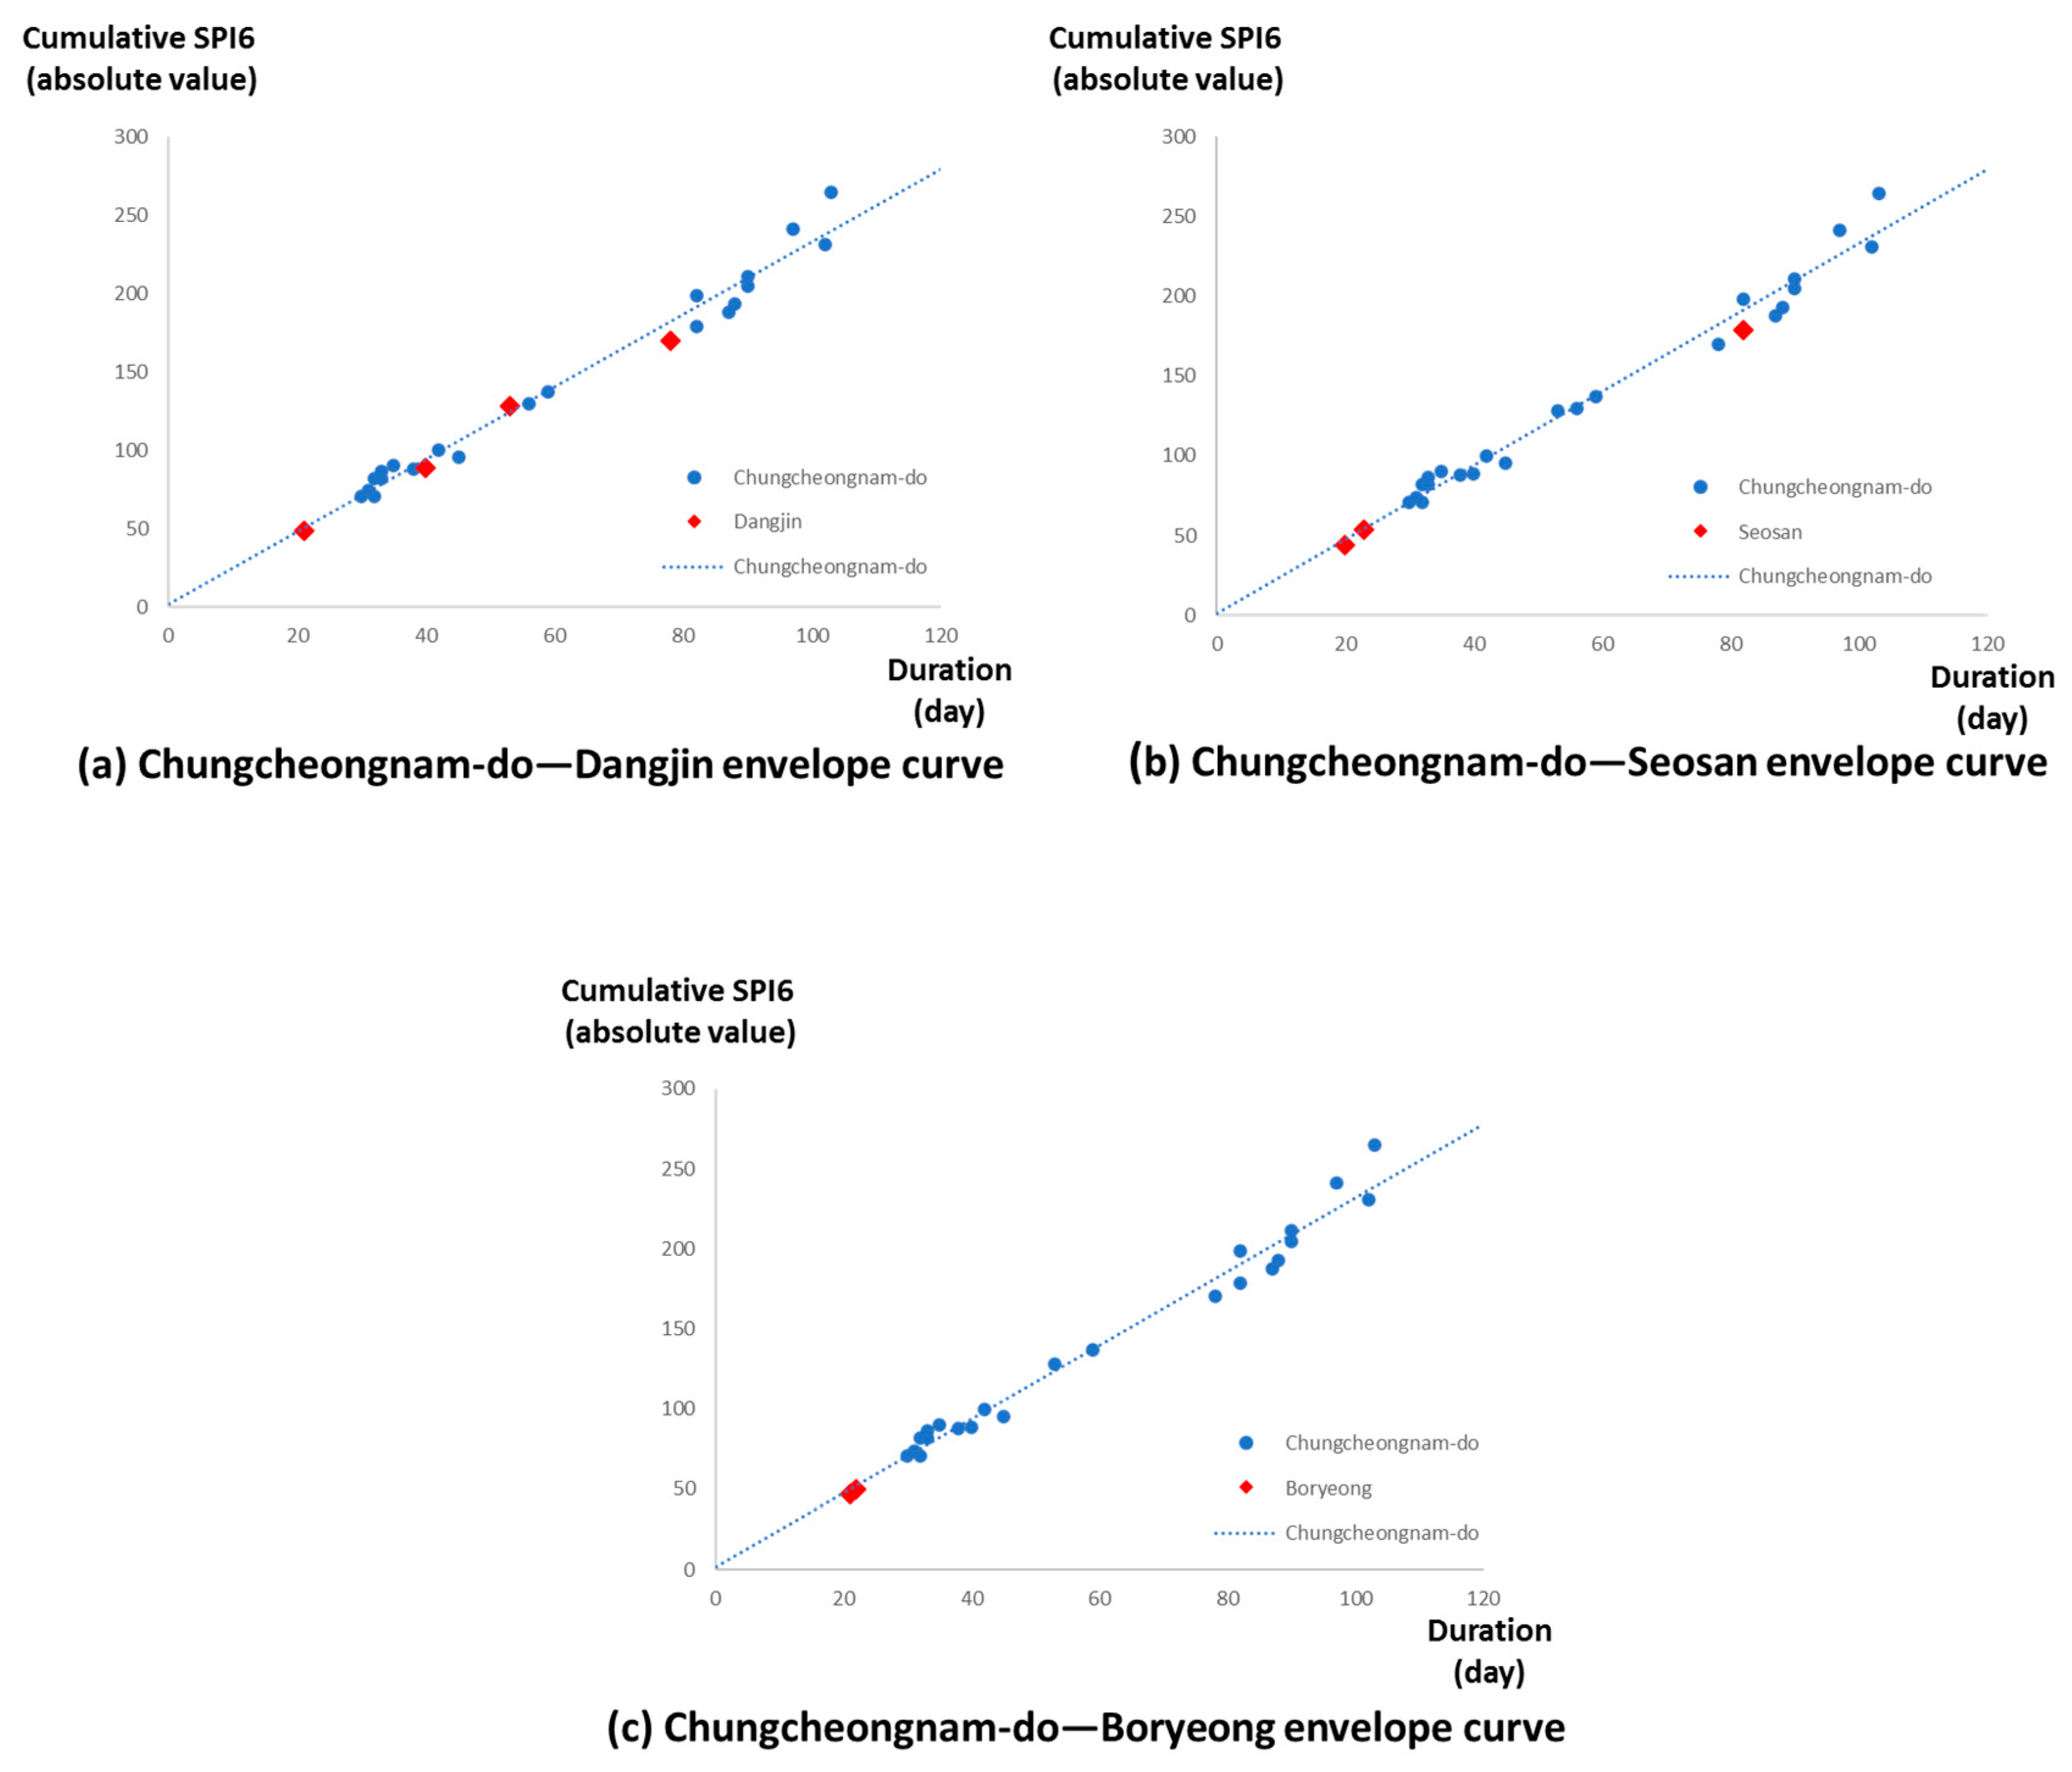
Based on daily SPI6 data for the entire Chungcheongnam-do region, we identified cases where SPI6 was less than −2.0 and drought continued for less than 30 days from 1975 to 2015, as shown in Table 5. As shown in the Table, extreme drought prevailed in all regions of Chungcheongnam-do in 2015. The envelope curves for cumulative SPI6 and cumulative days were calculated, and the droughts in Boryeong, Dangjin, and Seosan derived from Table 5 (diamonds) are shown in Figure 7. In the case of Dangjin, only the drought that occurred in May 2000 lay above the trend line of the envelope curve, so the drought in 2015 in the Chungcheongnam-do region is considered to exhibit a level of severity that is less than extreme. Seosan also showed a lower drought severity compared with the drought occurring throughout the whole of the Chungcheongnam-do region. In Boryeong, the cumulative number of days of drought based on SPI6 was not greater than 30, so it was not defined as extreme drought. In the envelope curve, the drought was below the trend line and therefore did not meet the definition of extreme drought in the Chungcheongnam-do region.

3.3. Discussion

Table 6 shows the satisfaction with the proposed procedure in each region. Based on the proposed procedure, in the cases of Dangjin and Seosan, the 2015 drought met the extreme drought criteria of A (days) and C (availability of water resources), but B (years), D (period of recurrence), and E (envelope curve) did not meet the criteria for classification as extreme (Table 6). In the case of Boryeong, the factor C criterion was met, but otherwise did not meet the defined criteria. Therefore, it was decided that the drought in Korea in 2015 was not extreme. However, if the drought occurs repeatedly after 2015, there is a possibility that it will be included subsequently in the region-based envelope curve as well as the years of recurrence.
Although many factors were not considered as suggested in this study, several studies have been conducted to evaluate the extreme drought conditions in South Korea [31,32]. First, Yoon et al. [31] evaluated the same area analyzed in the present study (Boryeong dam basin) and considered extreme drought conditions in Dangjin, Seosan, and Boryeong during 2015. However, this study found that the drought condition of Boryeong did not meet the criteria for extreme drought. This study considered the defining factor for extreme drought as less than −2 and lasting more than 30 days in SPI6 data. Second, Kim et al. [32] analyzed the return period of drought by major watersheds in Korea and ruled out severe drought. Although the results were similar to those of this study, the criteria for extreme drought were not adequately defined in previous studies.

4. Conclusions

Climate change is expected not only to increase the frequency of droughts worldwide, but also to trigger regional drought conditions that are extreme in severity. To express the condition of extreme drought, more representative drought factors are needed under an extreme drought situation. It is more natural to consider more factors depending on the characteristics of the drought or to comprehensively view and judge various indices. Therefore, this study attempted to quantitatively define regional extreme droughts using more acceptable factors. The methodology comprises five factors that are indicative of extreme drought. The five factors include: (1) duration (days), (2) number of consecutive years (years), (3) water availability, (4) return period, and (5) regional experience. The procedure was adopted to analyze drought patterns in South Chungcheong Province during 2014–2015. In conclusion, the drought defined by the methodology described in this study was not considered as an extreme event. However, the proposed methodology used acceptable and reasonable factors to evaluate extreme drought conditions as well as past regional experience of extreme drought. In the future, additional historical events of drought should be analyzed. The revised approaches are based not only on the regional meteorological and hydrological characteristics, but also the water supply and socio-economic characteristics. In addition, efforts are needed to determine the factors for the evaluation of drought more quantitatively.

Author Contributions

C.W.L. surveyed the previous studies. C.W.L. wrote the original manuscript. C.W.L. conducted simulations. C.W.L., M.J.P., and D.G.Y. conceived the original idea of the proposed method. All authors have read and agreed to the published version of the manuscript.

Funding

This research was supported by a grant (2019-MOIS31-010) from Fundamental Technology Development Program for Extreme Disaster Response funded by Korean Ministry of Interior and Safety (MOIS).

Conflicts of Interest

The authors declare no conflict of interest.

References

  1. National Research Council. America’s Climate Choices; National Academies Press: Washington, DC, USA, 2011. [Google Scholar]
  2. Rind, D. Models see hard rain, drought if CO2 doubles. Clim. Alert Newsl. 1993, 6, 120–125. [Google Scholar]
  3. Kitoh, A.; Yukimoto, S.; Noda, A.; Motoi, T. Simulated changes in the Asian summer monsoon at times of increased atmospheric CO2. J. Meteorol. Soc. Jpn. 1997, 75, 1019–1031. [Google Scholar] [CrossRef] [Green Version]
  4. Kim, B.S.; Chang, I.G.; Sung, J.; Han, H.J. Projection in Future Drought Hazard of South Korea Based on RCP Climate Change Scenario 8.5 Using SPEI. Adv. Meteorol. 2016, 2016, 1–23. [Google Scholar] [CrossRef] [Green Version]
  5. Nam, W.H.; Hayes, M.J.; Wall, N.; Yun, D.H. Public Participation and Outreach Program of Stakeholders for Drought Preparedness: Invitational Drought Tournament. Mag. Korean Soc. Agric. Eng. 2017, 59, 10–16. [Google Scholar]
  6. Sung, J.; Chung, E.-S.; Shahid, S. Reliability–Resiliency–Vulnerability Approach for Drought Analysis in South Korea Using 28 GCMs. Sustainability 2018, 10, 3043. [Google Scholar] [CrossRef] [Green Version]
  7. Kogan, F. Application of vegetation index and brightness temperature for drought detection. Adv. Space Res. 1995, 15, 91–100. [Google Scholar] [CrossRef]
  8. World Meteorological Organization. Droughts and Agriculture, WMO Technical Note 138; World Meteorological Organization: Geneva, Switzerland, 1975. [Google Scholar]
  9. White, D.H.; O’Meagher, B. Coping with exceptional droughts in Australia. In Drought Network News 7; Wilhite, D.A., Ed.; University of Nebraska: Lincoln, NE, USA, 1995; pp. 13–17. [Google Scholar]
  10. Palmer, W.C. Meteorological Drought, Research Paper, 45; National Weather Service: Silver Spring, MD, USA, 1965.
  11. McKee, T.B.; Doesken, N.J.; Kleist, J. The relationship of drought frequency and duration to time scales. In Proceedings of the 8th Conference on Applied Climatology, Boston, FL, USA, 17–22 January 1993. [Google Scholar]
  12. Nalbantis, I. Evaluation of a hydrological drought index. Eur. Water 2008, 23, 67–77. [Google Scholar]
  13. Shafer, B.A.; Dezman, L.E. Development of surface water supply index–A drought severity indicator for Colorado. In Proceedings of the International Symposium on Hydrometeorology, Denver, CO, USA, 13–17 June 1982. [Google Scholar]
  14. Kwon, H.-J.; Kim, S.-J. Evaluation of Semi-Distributed Hydrological Drought using SWSI (Surface Water Supply Index). J. Korean Soc. Agric. Eng. 2006, 48, 37–43. [Google Scholar] [CrossRef]
  15. Baier, W. Concepts of soil moisture availability and their effect on soil moisture estimates from a meteorological budget. Agric. Meteorol. 1969, 6, 165–178. [Google Scholar] [CrossRef]
  16. Woodhouse, C.A.; Overpeck, T. 2000 years of drought variability in the central United States. Bull. Am. Meteorol. Soc. 1998, 79, 2693–2714. [Google Scholar] [CrossRef]
  17. Stahle, D.W.; Cook, E.R.; Cleaveland, M.K.; Therrell, M.D.; Meko, D.M.; Grissino-Mayer, H.D.; Watson, E.; Luckman, B.H. Tree-ring data document sixteenth-century megadrought over NorthAmerica. Eos Trans. Am. Geophys. Union 2000, 81, 121–125. [Google Scholar] [CrossRef]
  18. Vicente-Serrano, S.M.; Begueria, S.; Lopez-Moreno, J.I. A Multi-scalar Drought Index Sensitive to Global Warming: The Standardized Precipitation Evapotrans-piration Index. J. Clim. 2010, 23, 1696–1718. [Google Scholar] [CrossRef] [Green Version]
  19. Kim, B.G.; Chung, D.B.; Shin, C.S. Statistical Analysis of Changes in Reservoir Storage According to Standard Precipitation Evapotranspiration Index (SPEI) and Dam Water Release. J. Korean Soc. Hazard Mitig. 2018, 18, 409–415. [Google Scholar] [CrossRef]
  20. Kim, J.H.; Jeung, S.J.; Lee, S.H.; Kim, B.S. Han River Basin Drought Disaster Analysis Using Extreme Drought Index. In Proceedings of the Korea Water Resources Association Conference, Daejeon, Korea, 26–27 May 2016; p. 243. [Google Scholar]
  21. Park, D.H.; Kim, T.U. Establishment of Emergency Plan for Extreme Water Insufficient by Catchment and Region. Water Future 2015, 48, 30–36. [Google Scholar]
  22. Hydrological Weather Drought Information System [Drought Analysis Menu] in KMA. Available online: http://hydro.kma.go.kr/drought/obsAdm.do (accessed on 5 May 2020).
  23. Hydrological Weather Drought Information System [Drought Index Menu] in KMA. Available online: http://hydro.kma.go.kr/help/menu902.do (accessed on 5 May 2020).
  24. Hashimoto, T.; Stedinger, J.R.; Loucks, D.P. Reliabilty, resilency, and vulnerabilty criteria forwater resources system performance evaluation. Water Resour. Res. 1982, 18, 14–20. [Google Scholar] [CrossRef] [Green Version]
  25. Moy, W.S.; Cohon, J.L.; Revele, C.S. Aprogramming model for analysis of the reliabilty, resilence, and vulnerabilty of a water suply reservoir. Water Resour. Res. 1986, 2, 489–498. [Google Scholar] [CrossRef]
  26. Kang, M.G.; Park, S.W. Asesment ofaditonal water suply capacity using a reservoiroptimal operation model. J. Korea Water Resour. Asoc. KWRA 2005, 38, 937–946. [Google Scholar] [CrossRef]
  27. Lee, S.H.; Kang, T.U. An evaluation methodof water suply reliabilty for a dam by firm yieldanalysis. J. Korea Water Resour. Asoc. KWRA 2006, 39, 467–478. [Google Scholar]
  28. Lee, J.H.; Kim, C.J. Drought Hearts-Drought Time-Birth Frequency Curve through Drought Frequency Analysis. J. Korea Water Resour. Asoc. 2011, 44, 889–902. [Google Scholar] [CrossRef] [Green Version]
  29. Artusa, A. Drought Map. U.S. Drought Monitor. Available online: http://droughtmonitor.unl.edu/ (accessed on 5 May 2020).
  30. Svoboda, M.; LeComte, D.; Hayes, M.; Heim, R.; Gleason, K.; Angel, J.; Miskus, D. The drought monitor. Bull. Am. Meteorol. Soc. 2002, 83, 1181–1190. [Google Scholar] [CrossRef] [Green Version]
  31. Yoon, Y.S.; Lee, Y.G.; Lee, J.W.; Kim, S. Short Term Drought Forecasting using Seasonal ARIMA Model Based on SPI and SDI- For Chungju Dam and Boryeong Dam Waterhseds. J. Korean Soc. Agric. Eng. 2019, 61, 61–74. [Google Scholar]
  32. Yong-Tak Kim, Y.T.; Kim, J.Y.; Lee, J.J.; Kwon, H. Assessment of Drought Characteristics and Return Period for 2015. Korean Soc. Civ. Eng. 2015, 63, 14–24. [Google Scholar]
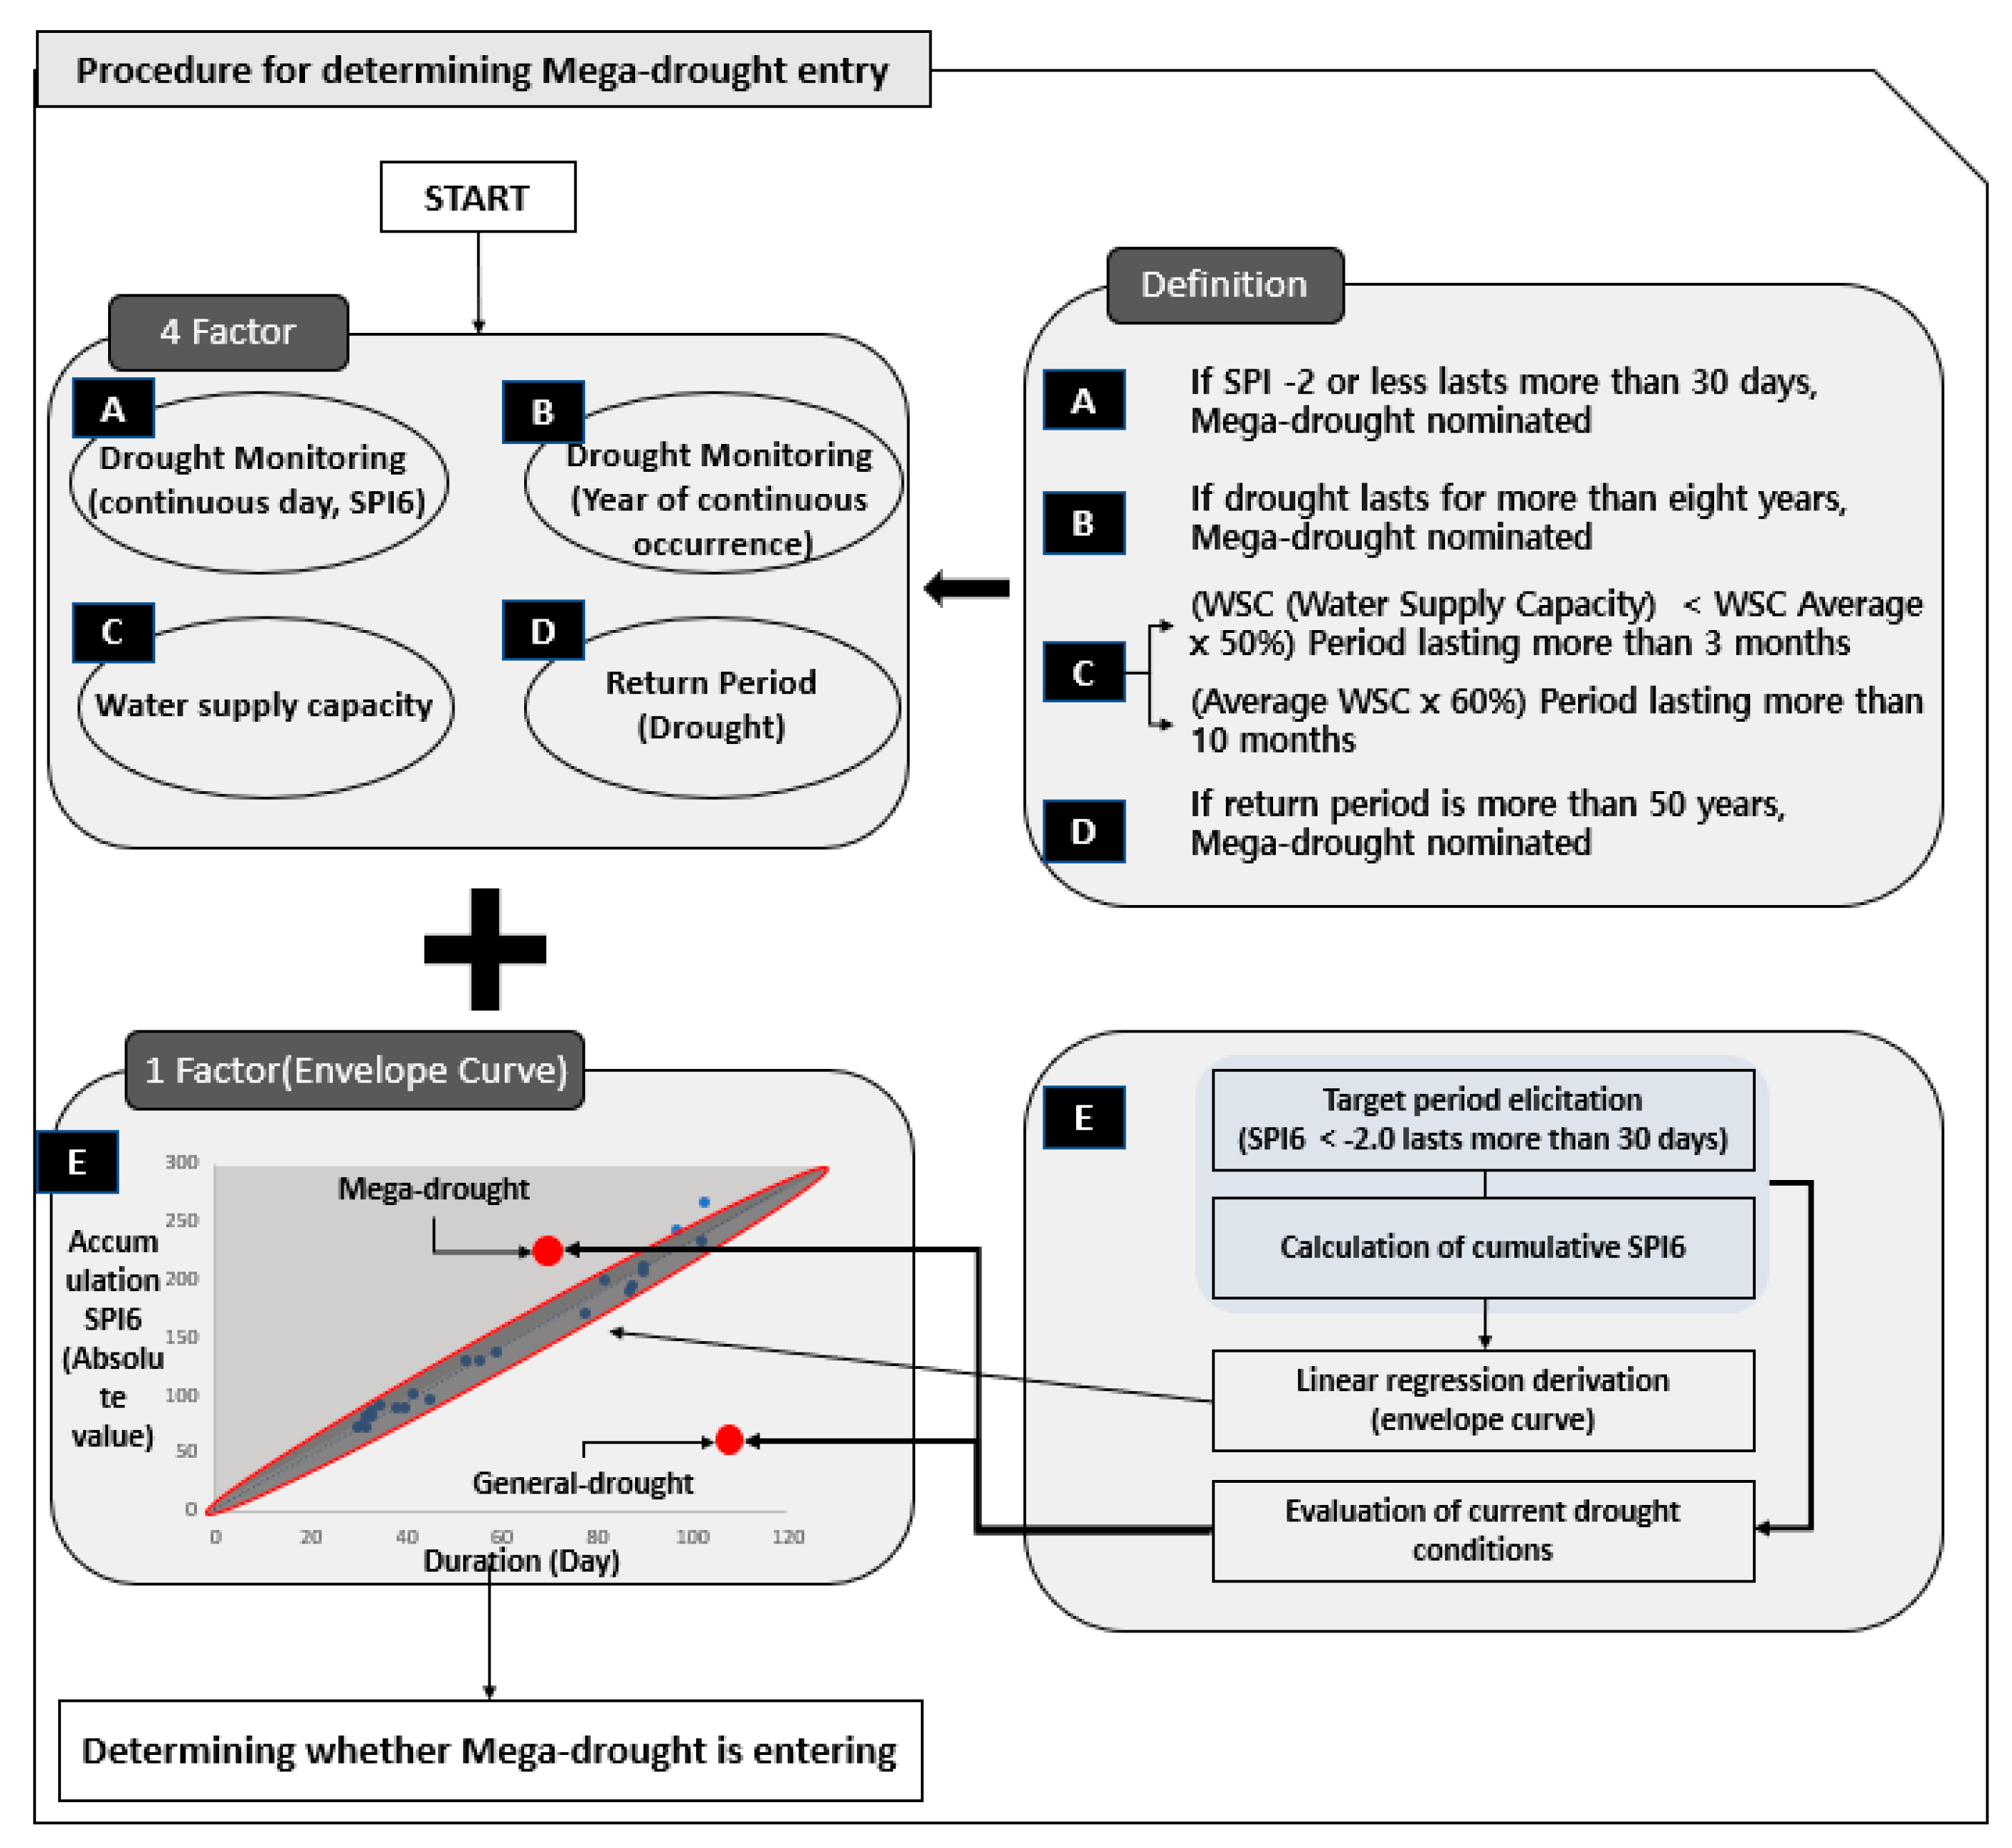
Figure 1. The methodology used to determine extreme drought conditions.
Atmosphere 11 00581 g001
Figure 2. Local governments identified by case studies of severe drought.
Atmosphere 11 00581 g002
Figure 3. Envelope curve procedure for the determination of extreme drought.
Atmosphere 11 00581 g003
Figure 4. Target area (Chungcheongnam-do).
Atmosphere 11 00581 g004
Figure 5. Status of drought in the target regions (consecutive years of drought), (a) Dangjin, (b) Seosan, (c) Boryeong.
Atmosphere 11 00581 g005
Figure 6. Availability of Boryeong Dam water resources (January 2013–December 2015).
Atmosphere 11 00581 g006
Figure 7. Chungcheongnam-do: Target area envelope curves, (a) Dangjin, (b) Seosan, (c) Boryeong.
Atmosphere 11 00581 g007
Table 1. Standardized Precipitation Index (SPI) index range based on drought stage.
Drought CategorySPI ValuesSource
Mild drought 0 ~ −0.99Mckee et al. (1993) [11]
Moderate drought −1.00 ~ −1.49
Severe drought 1.50 ~ −1.99
Extreme drought −2.00 ≥ SPI
ExperienceLess than −2.0 lasting for more than 20 daysKorea Meteorological Administration [23]
Analysis & surveyLess than −2.0 lasting for more than 30 daysThis study
Table 2. Cumulative SPI6 scores and cumulative days of drought across major regions in Korea (Factor A).
Name of RegionNo.DurationAbsolute Cumulative Sum of SPI6Source
Start End Days
Suwon114 March 19978 April 19972553.14Korean Meteorological Administration [22]
25 April 197824 April 19782044.79
322 August 201530 December 2015131299.78
Geochang41 April 200927 May 200957127.8
Yeongcheon510 March 199517 April 19953983.75
68 May 200930 May 20092351.61
Cheorwon77 October 20142 April 2015178386.63
Seosan82 June 197823 June 19782248.29
927 November 198820 January 198955110.81
1020 July 199212 August 19922451.17
1110 September 20147 November 201559127.46
Cheonan129 August 201524 November 2015108283.61
Buyeo132 May 197823 May 19782247.79
143 July 198225 July 19822348.38
1518 November 200128 December 20014189.42
1615 August 201512 November 201590215.07
Boryeong1719 July 198214 August 19822756.75
181 October 198211 November 19824286.55
1914 July 199520 August 19953879.03
208 June 201230 June 20122348.89
211 July 201925 July 20192552.19
Average51.05113.95
Table 3. Survey of appropriate temporal definitions of extreme drought (Factors A and B).
Survey SubjectAveragePersonnel
(A) Duration (Days)(B) Consecutive Years (Years)
Expert66.58.326
Public Official22.27.931
Farmers18.87.230
Public21.98.584
Average (total)32.48.0171
Table 4. Conditions associated with drought monitoring (days of duration) for Chungcheongnam-do (Dangjin, Seosan, and Boryeong) (SPI6).
Name of RegionDuration (days)Cumulative SPI6 (Absolute Value)Cumulative SPI6/Cumulative Days
StartEndCumulative Days
Dangjin5 May 200026 June 200053128.042.42
11 July 200019 August 20004088.952.22
27 April 200817 May 20082148.812.32
23 August 20158 November 201578170.182.18
Seosan23 January 200714 February 20072353.582.33
28 April 200817 May 20082044.022.20
13 August 20152 November 201582178.592.18
Boryeong5 May 200025 May 20002146.812.23
22 January 200712 February 20072249.642.26
Table 5. Cumulative SPI6 and cumulative days.
Target AreaArea NameStartEndCumulative DaysCumulative SPI6 (Absolute Value)
Chungcheongnam-doGyeryong22 August 200111 November 200182198.45
8 December 201522 November 2015103264.63
Hongseong8 February 200217 March 20023887.92
12 January 200712 February 20073270.62
Nonsan25 August 20018 October 20014595.4
13 August 201522 November 2015102231.04
Gongju17 August 201512 November 201588193.04
Sejong17 August 201511 November 201587187.72
Taean1 June 19782 July 19783282.02
16 May 200017 June 20003382.03
12 January 200715 February 20073590.24
21 August 201525 November 201597241.01
Seosan12 January 200713 February 20073386.24
15 August 201512 November 201590211.08
Cheongyang9 February 200910 March 20093070.97
Seocheon29 April 20009 June 20004299.9
Asan29 April 200026 June 200059137.15
15 August 201512 November 201590204.49
Cheonan29 April 200029 May 20003174.05
Buyeo15 August 20159 October 201556129.78
Table 6. Determination of extreme drought (2015 drought).
Extreme Drought FactorsConditions
DangjinSeosanBoryeong
(A) Drought monitoring (Days of continuation, under SPI −2 and continuing for less than 30 days)×
(B) Drought monitoring (Consecutive Years of Drought)×××
(C) Period of water availability
(D) Period of drought recurrence (Period of recurrence of 50 years or more)×××
(E) Region-based envelope curve×××