Abstract
The size distribution of volcanic ash is rarely measured in real time and Volcanic Ash Advisory Centres (VAACs) often rely on a default particle size distribution (PSD) to initialise their dispersion models when forecasting the movement of ash clouds. We conducted a sensitivity study to investigate the impact of PSD on model output and consider how best to apply default PSDs in operational dispersion modelling. Compiled grain size data confirm that, when considering particles likely to be in the distal ash cloud (< 125 µm diameter), magma composition and eruption size are the dominant controls on grain size distribution. Constraining the PSD is challenging but we find that the grain size of deposits from large hydromagmatic eruptions remains relatively constant with distance, suggesting that total (whole-deposit) grain size distributions (TGSDs) for these eruptions could be estimated from a few samples. We investigated the sensitivity of modelled ash mass loadings (in the air and on the ground) to input PSDs based on coarse to fine TGSDs from our dataset. We found clear differences between modelled mass loadings and the extent of the plume. Comparing TGSDs based on ground-only and ground-plus-satellite data for the Eyjafjallajökull 2010 eruption, we found that basing input PSDs on TGSDs from deposits alone (likely missing the finest particles) led to lower modelled peak ash concentrations and a smaller plume.
1. Introduction
Ash clouds from explosive volcanic eruptions can travel huge distances and cause severe disruption to air traffic (e.g., [1]). To mitigate against aircraft encounters with ash clouds, Volcanic Ash Advisory Centres (VAACs) issue Volcanic Ash Advisories (VAAs) and Volcanic Ash Graphics (VAGs) which indicate the expected location of the ash cloud up to 18 h ahead. In Europe, there is an additional requirement to provide forecasts of ash concentrations [2]. As part of their forecasting process, the VAACs use atmospheric dispersion models to simulate the transport, dispersion and removal of ash from the atmosphere [3,4,5]. Where ash falls as individual particles, residence time in the atmosphere is controlled by particle parameters (grain size, density and shape), vertical advection and turbulence. Grain size is typically the dominant particle parameter in controlling the ash settling velocity and whether the ash residence time is significantly affected by turbulence [6,7,8,9,10]. It is, therefore, important to select an appropriate particle size distribution (PSD) to initialise model runs, but data on the size distribution of ash are rarely available in near real time and so most VAACs use default PSDs (e.g., [3,11,12]). In addition, many assume that only the smallest particles survive near-source removal processes, i.e., they only consider particles with diameters, e.g., ~< 100 µm (e.g., [3,4]). All of the ash in the air eventually falls to the ground and previous studies of the deposits show that grain size distribution varies greatly between eruptions, reflecting eruption intensity, magma composition and whether the eruption is wet or dry (hydromagmatic or magmatic) (e.g., [13,14]). It is still not clear how best to set a default PSD when measurements are not available. In this study, we test the sensitivity of modelled ash plumes to the input PSD and investigate how best to apply default PSDs in operational dispersion modelling.
The PSD of volcanic ash can be determined using a variety of methods but each approach has its limitations. The ash cloud can be directly sampled with research aircraft, but sampling is usually restricted to relatively dilute portions of the cloud over short periods (e.g., [15,16,17,18]). Remote sensing can provide data on plume evolution, but standard retrieval techniques are only sensitive to particles up to ~32 µm diameter (e.g., [19,20]). As the PSD of ash in the air is reflected in the PSDs of deposits at different distances from the source, ground sampling is also a useful technique. The total grain size distribution (TGSD) of the deposit can be determined from multiple samples (e.g., [21,22]), but compilation of a reliable TGSD requires well-preserved deposits and spatially extensive sampling, particularly when the range of grain sizes is large [23,24,25]. Sampling the whole extent of a deposit can be difficult because, in the short term, there can be safety concerns in very proximal areas, whereas over time, preservation will deteriorate in distal areas. In any case, deposit TGSDs do not include the most distal material that is inaccessible (e.g., in the sea) or too thin and fine-grained to be visible (e.g., [26]). It is traditional to use the term total grain size distribution (TGSD) when referring to the size distribution of grains of an entire volcanic deposit and to use particle size distribution (PSD) for dispersion model inputs. Of course an ash grain is a type of particle but we have kept the distinction in this paper to make clear whether we are referring to model inputs (PSD) or deposit data (TGSD); in particular, we use deposit TGSDs as the basis for model input PSDs.
We collate TGSDs from the literature and investigate dispersion model sensitivity to input grain size distribution, considering both hydromagmatic and magmatic eruptions. We use the fine fraction of TGSDs (<125 μm diameter) to initialise our model, as these particles travel the furthest and are therefore the most important for modelling the long-range transport of volcanic ash. Deposit TGSDs are determined after an eruption has ended (unlike direct sampling in the air and remote sensing) and they can therefore be used to investigate ash emissions from past eruptions. Importantly, deposits provide information on grain size and transport of ash from eruptions from potentially active volcanoes that have not erupted historically and eruptions of higher intensity and magnitude than have occurred since satellite remote sensing of ash was possible.
Unlike magmatic eruptions, where the grain size becomes more fine-grained with increasing distance from the vent (reflecting sorting by particle terminal velocity until the ash is sufficiently fine that turbulence dominates), when water interacts with magma (hydromagmatic conditions), grain size in the deposit is often relatively constant with distance [14]. This raises the possibility that TGSDs for hydromagmatic eruptions could be constructed from a limited set of samples. The lack of a fining trend with distance from source may result from more efficient initial fragmentation conditions [27] and/or distinct sedimentation processes. For example, water can enhance aggregation, with small particles falling out in clusters close to source (e.g., [28,29]) or sedimentation of fine particles can be driven by gravitational instabilities in the plume [30,31,32].
We undertake a sensitivity study of dispersion model forecasts to the PSD used to initialise the simulation by using PSDs representing the range of coarse to fine grain size distributions from our hydromagmatic and magmatic eruption TGSD dataset. We compare results to simulations using the default PSD used by the London VAAC during operational response. Almost all published TGSDs, and so almost all our model PSDs, are determined from deposit samples only. We also investigate the impact of the ash beyond the mapped deposit for the Eyjafjallajökull 2010 eruption for which there is a TGSD based on a combination of deposit (ground) and satellite data. For this case, we compare model results for PSDs based on ground-only and ground-plus-satellite data to identify the impact of the finest particles, while acknowledging that satellite retrievals have their own limitations (discussed further in Section 5.2). Based on our results, we make recommendations for how to apply default PSDs in operational atmospheric dispersion models. Our choice of dispersion model and model source location in Iceland, and our emphasis on Icelandic eruptions in the TGSD compilation, make the results particularly useful for the London VAAC, but the conclusions are more broadly applicable.
2. Compilation of Published Grain Size Data and Selection of PSDs for Modelling
We compiled published grain size distributions from hydromagmatic and magmatic eruptions (Table 1 and Table 2, respectively). The compilation includes eruptions for which at least one of the following datasets was available:

Table 1.
Details of hydromagmatic eruptions. VEI (Volcanic Explosivity Index), magnitude and intensity details come from references shown, the LaMEVE database [34] and the Global Volcanism Program catalogue of Holocene eruptions [35].

Table 2.
Details of magmatic eruptions. VEI, magnitude and intensity details come from references shown, the LaMEVE database [34] and the Global Volcanism Program catalogue of Holocene eruptions [35].
- TGSD, compiled from samples collected at a range of distances from source and including grains in the size range used by the VAAC default PSD (≤ 100 µm).
- Grain size distributions or median grain size at a range of distances from the source.
We have limited our investigations to vent-derived plumes and eruptions of juvenile magma and so we excluded TGSDs from phreatic eruptions. We have not interrogated the quality of the grain size data, but see, for example, [23,24] for recent discussions of how sampling strategy affects the reliability of TGSD.
The eruptions (detailed in Supplementary Materials Section S1) range in composition from basaltic (e.g., Hverfjall 2000 BP) to rhyolitic (e.g., Taupo 130 CE) and in eruption size (as measured by the Volcanic Explosivity Index (VEI)) from VEI 2 (e.g., Hverfjall 2000 BP) to VEI 8 (e.g., Taupo 25.4 ka BP). For the magmatic eruptions, we have focused on Iceland, as it is within the London VAAC’s area of responsibility (e.g., basaltic Eldgja 10th Century, andesitic Hekla 1693 and rhyolitic Askja 1875 Layer D) but include some other eruptions. TGSDs have been compiled from ground samples except for Eyjafjallajökull 2010, where TGSDs from ground observations alone and from ground observations plus satellite data are both available [33].
Data on median grain size were included because they provide a simple measure of the stability of grain size with distance from source and are reported as a function of distance for a wider range of hydromagmatic eruptions than full grain size distributions.
2.1. Total Grain Size Distributions
Figure 1 and Figure 2 show TGSDs for the hydromagmatic and magmatic eruptions listed in Table 1 and Table 2, respectively. The eruptions cover a wide range of magma compositions from mafic (basalt, ≤ 52% SiO2) and intermediate (basaltic andesite—andesite, 52%–63% SiO2) to silicic (dacite—rhyolite, > 63% SiO2). Hydromagmatic eruptions show a smaller range of grain sizes than magmatic eruptions, with medians from 0 to 4 Φ (62.5–1000 µm), with the larger eruptions (which are also all silicic), e.g., Taupo Oruanui, Rotongaio and Hatepe and Towada (all VEI ≥ 6) having the finest TGSDs. The magmatic eruptions have median values of −2–4 Φ (62.5–4000 µm). However, when we consider only particles likely to be in the distal ash cloud (> 3 Φ, < 125 µm), TGSD is not a significant indicator of the presence of external water, with a large overlap between hydromagmatic and magmatic eruptions (Figure 3a). Magma composition and VEI seem to be more significant, with lower VEI and mafic or intermediate eruptions having generally coarser TGSDs than silicic ones (Figure 3b). The link between eruption size and magma composition is expected, both because melt viscosity (which depends on composition) affects vesiculation kinetics (e.g., [13]), and the largest explosive eruptions tend to be silicic. A limitation of this analysis is that we are not aware of any published TGSDs for large (VEI ≥5) mafic or intermediate-composition hydromagmatic eruptions.
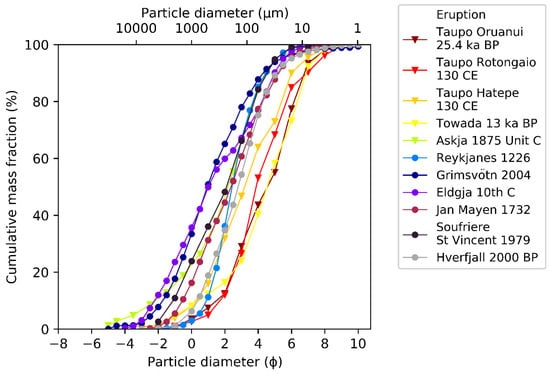
Figure 1.
Total grain size distributions for hydromagmatic eruptions based on deposits. The legend lists eruptions in order of VEI (large to small; see Table 1). Magma composition: ▽ silicic, o mafic/intermediate.
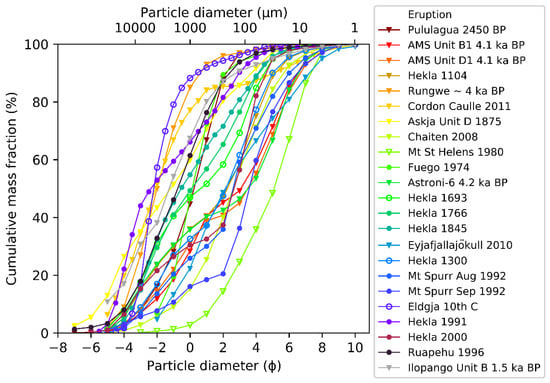
Figure 2.
Total grain size distributions for selected magmatic eruptions based on deposits. The legend lists eruptions in order of VEI (large to small; see Table 2). AMS = Campi Flegrei, Agnano Monte Spina. Magma composition: ▽ silicic, o mafic/intermediate.
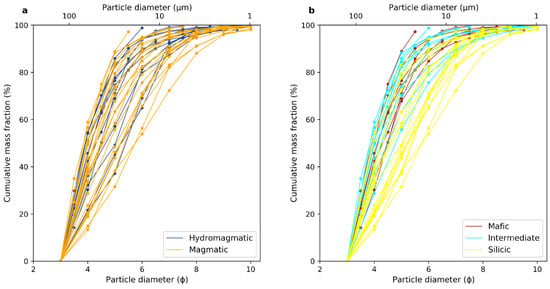
Figure 3.
The < 125 µm fraction of total grain size distributions based on deposits for all eruptions from Figure 1 and Figure 2 (i.e., normalized to 125 µm), highlighting (a) hydromagmatic vs. magmatic eruptions, (b) mafic (≤ 52% SiO2) vs. intermediate (52–63% SiO2) vs. silicic (> 63% SiO2) eruptions.
2.2. Change in Grain Size with Distances from Source
Many of the hydromagmatic eruptions show little variation in PSD with distance, particularly for larger eruptions (Figure 4). Similarly, when considering locations beyond the influence of near-source processes (> ~20 km from source), median grain size is relatively constant (or even coarsens slightly with distance) at tens or even hundreds of km from source for larger hydromagmatic eruptions (Figure 5). These data include the silicic eruptions of Oruanui 25.4 ka BP, and Rotongaio and Hatepe 130 CE, and the mafic/intermediate eruptions of Reykjanes 1226 and Kelut 1919. For El Chichón 1982 Layer A (VEI 5), this trend is seen ≥ 65 km from source, but we have no medial data (between 22 and 65 km).
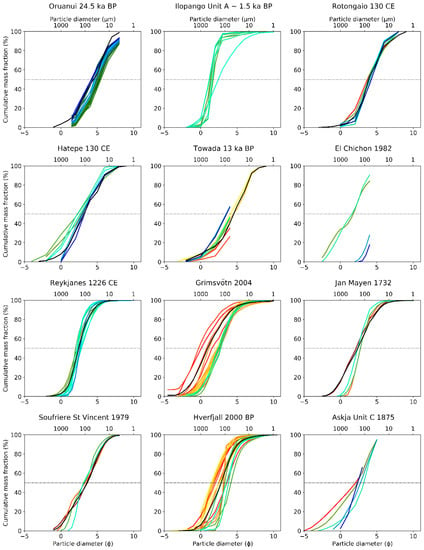
Figure 4.
Hydromagmatic total grain size distributions (TGSDs) and particle size distributions (PSDs) at varying distance from source. Colours indicate distance of PSD from source: < 10 km red/yellow; 10–50 km greens; > 50 km blues. TGSDs are in black. Dotted line shows the median grain size (i.e., 50% mass fraction). PSDs for Towada and El Chichón are only for grain size ≤ 4 Φ. TGSD for Ilopango Unit A [43] was not included as it seems inconsistent (too coarse) with grain size data from the individual sites.
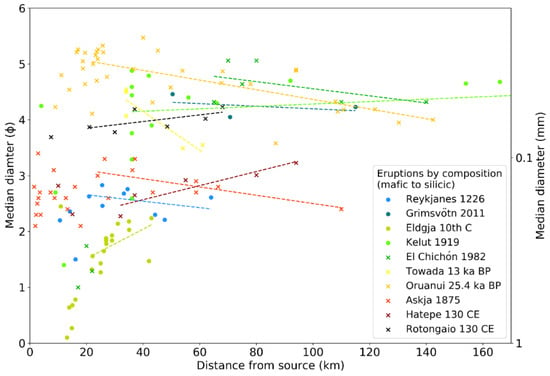
Figure 5.
Change in median grain size with distance from source for hydromagmatic eruptions sampled > 20 km from source. Symbols represent eruption size: x VEI ≥ 5, o VEI ≤ 4. Dashed lines are straight-line fits to data > 20 km, except for El Chichon which uses ≥ 65 km.
The only dataset which has sufficient samples to allow a robust comparison of the hydromagmatic and magmatic phases from the same eruption is from Askja 1875 (units C and D, respectively; [36]). Figure 6 shows a more constant median for the hydromagmatic phase of this eruption than for the magmatic phase, where there is a significant fining with increasing distance from the vent. Other median grain sizes for the hydromagmatic and magmatic phases from the same eruption are included in Supplementary Materials Section S2; for Eldgja 10th century and Ilopango ~1.5 ka BP, samples from > 20 km from source are available for only one phase and for Grímsvötn 2011, there are only three hydromagmatic data points, prohibiting robust conclusions.
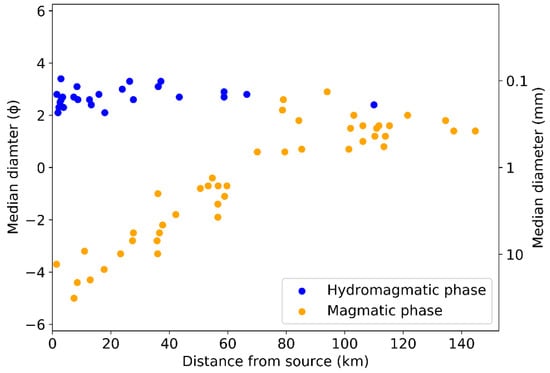
Figure 6.
Change in median grain size with distance from source for hydromagmatic (Unit C) and magmatic (Unit D) phases of Askja 1875 [36]. Note: hydromagmatic data point at 110 km is reweighed sample AS82 described in Supplementary Materials Section S2.
3. Methods
We perform a sensitivity study using the dispersion model Numerical Atmospheric Dispersion Modelling Environment (NAME) [67] to investigate how the PSD used to initialise a simulation affects the model output. NAME is used by the London VAAC and has been extensively validated against observations, including satellite retrievals, lidar data and measurements taken by research aircraft (see for example, [16,68,69,70,71]). We use coarse to fine grain size distributions from across the range of our dataset to initialise simulations and compare the results to simulations initialised with the default PSD currently used at the London VAAC.
3.1. The London VAAC Default PSD
The London VAAC uses a default PSD, given in Table 3, which is based on airborne measurements of an ash cloud taken on January 8, 1990 following the eruption of Mount Redoubt, USA [4]. Figure 7 shows the size distribution of ash particles in samples taken 2.5 and 7 h after the eruption [15]. The simplified curve used for the default NAME modelling, based on these samples is also shown, and includes linear extrapolation for particle diameters > 30 µm. To obtain the default PSD, the mass distribution for each particle size bin was calculated assuming particles are spheres of constant density (i.e., volume is proportional to mass). In addition, a ‘token’ percentage of mass was added in the 30–100 µm bin to account for large particles in the distal ash plume [72].

Table 3.
Default particle size distribution (equivalent sphere diameters) used by the London Volcanic Ash Advisory Centre (VAAC) for forecasting ash dispersion.
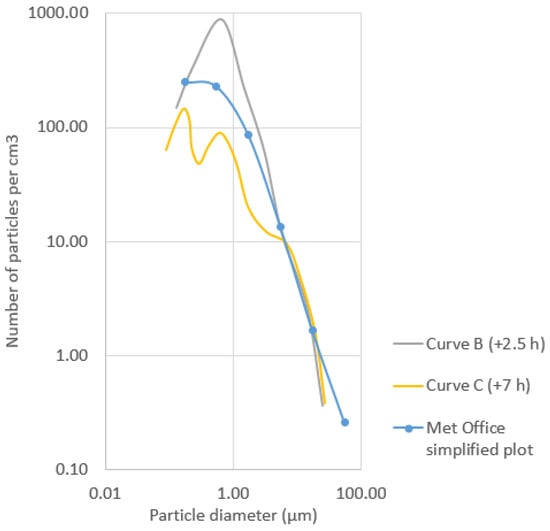
Figure 7.
Particle number size distributions in emissions from Mount Redoubt, January 8, 1990 eruption. Curve B: 4.0 km above sea level (asl), ~130 km downwind and ~2.5 h after eruption. Curve C: 2.6 km asl, ~170 km downwind and ~7 h after eruption [15]. Met Office simplified plot is used for NAME default particle size distribution from data in [72].
3.2. The Phi (Φ) scale for PSDs
NAME defines particle size in microns (µm) but grain size measurements of ash samples taken from deposits often use the phi (Φ) scale [73]:
where D is the particle size in mm, and D0 is a reference value of 1 mm. To make it easier to compare results from NAME simulations using TGSDs defined in the phi scale, we compiled micron equivalents of whole-Φ and half-Φ scales (Tables S1 and S2). We then calculated mass fractions equivalent to the VAAC default PSD and compared results from NAME simulations of the Eyjafjallajökull 2010 eruption using the new scales and the current VAAC default. Air mass loadings showed very little difference between the three scales for all cases where the plume is dispersed beyond the immediate source area. Further details of the calculations and the tests are shown in Supplementary Materials Section S3; statistical tests are defined in Supplementary Materials Section S4.
Φ = −log2 (D/D0)
3.3. Normalising TGSDs to ≤ 125 µm and Selecting Eruptions for Modelling
We selected TGSDs from four hydromagmatic eruptions that cover the range of coarse to fine TGSDs (Eldgja, Grímsvötn 2004, Rotongaio and Oruanui). In addition, one fine (Eyjafjallajökull 2010) and one coarse (Hekla 1991) magmatic TGSD were included. The Eyjafjallajökull 2010 TGSD is compiled from both ground samples and satellite data [33] and so, to investigate the impact of including satellite retrievals in TGSDs, we also added the Eyjafjallajökull 2010 TGSD derived only from ground samples (Figure 8).
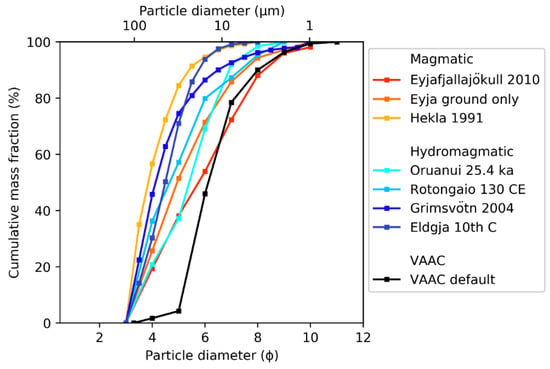
Figure 8.
TGSDs, normalised to 125 µm, selected for the Numerical Atmospheric Dispersion Modelling Environment (NAME) model runs.
The TGSDs were then normalised to include only grains ≤ 125 µm diameter to assist comparison of model outputs with those using the VAAC default PSD (≤ 100 µm). On the Φ scale, we selected reported grain sizes ≥ 4 Φ (3.5 Φ for results reported on the half-Φ scale), because although 4 Φ = 62.5 µm, for sieve results, the 4 Φ bin contains particles from 3 to 4 Φ, i.e., from 62.5 to 125 µm. Similarly, on the half Φ scale, the 3.5 Φ bin contains particles from 3 to 3.5 Φ (88.4–125 µm).
3.4. NAME Simulations
NAME was run on the JASMIN scientific data analysis environment [74] with the input parameters shown in Table 4. The PSD used to initialise the run was varied and all other eruption source parameters and met data were kept the same. Particles were assumed to be spherical and to have a density of 2300 kg m−3 (see Appendix A, Table A1 for a list of the PSDs considered).

Table 4.
Input parameters for NAME runs.
NAME represents the long-range transport of volcanic ash in the atmosphere [67]. It also includes schemes to represent near-source processes such as buoyant plumes [77] and umbrella clouds [78] but does not explicitly represent all near-source processes. Particles only fall out individually under gravity, with no collective settling as aggregates or from density-driven (‘en masse’ or ‘streaking’) instabilities [4].
As we are investigating the extent to which input PSD influences cloud size and ash concentration, we are interested in relative rather than absolute changes in the cloud. For each simulation, particles were released above the vent of Eyjafjallajökull volcano with a uniform distribution, from the vent to the plume top. The source strength was calculated from reported plume heights [79] using the method of Mastin et al. [6], and we took just 5% of the calculated MER to represent the total erupted material in the distal plume. The buoyant plume and umbrella cloud schemes were not invoked. This follows the London VAAC default approach; it accounts for the largest particles falling out close to source and the fact that NAME does not represent all near-source processes [4].
Modelled ash mass loadings in the air and on the ground were output onto a grid with a horizontal resolution of 33 km and a 3 h temporal resolution. These were chosen as a balance between time taken for the simulations to run and resolution required to identify the impact of changing PSD on modelled ash mass loadings.
Results were compared to runs using the VAAC default PSD for the period 4–8 May 2010, chosen as this was the period relating to the published Eyjafjallajökull 2010 TGSD [33]. However, we were not aiming to replicate the Eyjafjallajökull 2010 cloud and deposit, rather, we used it as a benchmark from which to consider the sensitivity of the simulated plume to the input PSD. Within this time frame, total column mass loadings in the air (g m−2) were selected for comparison on 2 days: one with a narrow plume (6 May 12:00 UTC) and one with a more extensive plume (8 May 00:00 UTC). Deposition for the period 4–12 May was considered, as ~95% of the mass was found to deposit within this timeframe.
3.5. Quantifying the Impact on Dispersion Model Forecasts
To investigate the sensitivity of the model output to the input PSD used, we compared NAME simulations initialised using the VAAC default to those using our other selected PSDs. We compared ash concentration within the model plumes, the different spatial extents of the model plumes, and differences in deposit concentrations. No one statistical test can comprehensively describe differences for dispersion model results and so we selected four tests (used in previous studies [8,80] and described in detail in the Supplementary Materials Section S4), to give a broad evaluation of the samples being compared:
- Fractional bias (FB) measures systematic bias, with values ranging from +2 to −2 and positive values indicating an overprediction.
- Pearson’s Correlation Coefficient (PCC) tests ash mass loadings paired in time and space and quantifies differences in extent and concentration of the plumes, with values of +1 and −1 indicating a positive and negative linear relationship, respectively.
- Figure of Merit in Space (FoM) compares the spatial extents of the plumes, with values of 0 for no overlap to 100 for complete overlap.
- The Kolmogorov–Smirnov Parameter (KSP) represents the difference between concentration distributions, but takes no account of the spatial distribution. Values vary between 0 for identical distributions and 100 for distributions with no common values.
Statistical analyses are usually used to compare model results with a limited set of observed values, and hence to make the tests meaningful we applied thresholds before comparing model runs with different input parameters. We considered ash mass loadings > 0.2 g m−2, which is the minimum threshold represented by ash concentration charts (assuming a 1 km deep plume) and ash deposits with mass loadings > 0.1 g m−2, chosen as it covers a similar area to the air concentrations.
4. Results
This section presents our results on the sensitivity of dispersion model outputs to the initialising grain size distribution. We compare results from model simulations using the London VAAC default PSD to simulations initialised using varying PSDs which reflect different magma compositions and eruption styles.
4.1. Total Column Mass Loading and Sensitivity to PSD
Figure 9 and Figure 10 show modelled total column mass loadings on 6 May 2010 12:00 UTC (high plume) and 8 May 2010 00:00 UTC (low plume), respectively. In each case, when the VAAC default PSD is used, the plume extends further than when any of the other PSDs are used to initialise the model run.
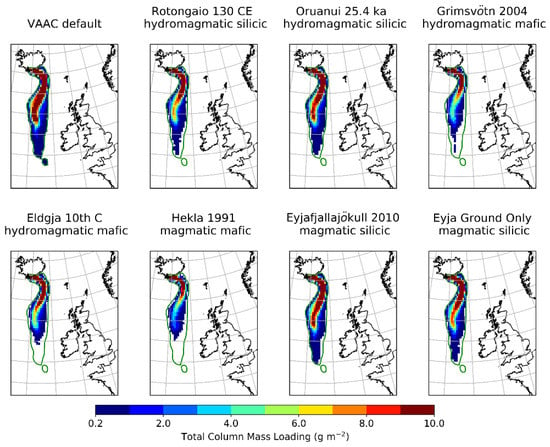
Figure 9.
Total column mass loadings for 6 May 2010 12:00 UTC using a range of input PSDs. The extent of plume using VAAC default PSD is shown as a green outline on each plot.
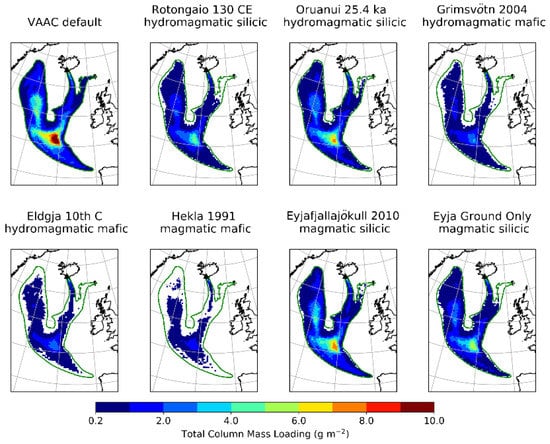
Figure 10.
Total column mass loadings for 8 May 2010 00:00 UTC using a range of input PSDs. The extent of the plume simulated using the VAAC default PSD is shown as a green outline on each plot.
Residual ash mass loading was calculated by subtracting the modelled ash concentrations simulated using the VAAC default PSD from the modelled concentrations when the input PSD is varied. Figure 11 shows the results for total column mass loadings on 6 May 2010 12:00 UTC and 8 May 2010 00:00 UTC, for the coarsest (Hekla 1991) and finest (Eyjafjallajökull 2010) PSDs. Values for the remaining PSDs are shown in Figures S5 and S6. Peak values of total column mass loading are up to 5-fold greater using the VAAC default PSD than for all other PSDs, with the most extreme differences observed when comparing the VAAC default to the coarsest PSDs (Eldgja and Hekla) (Figure 10).
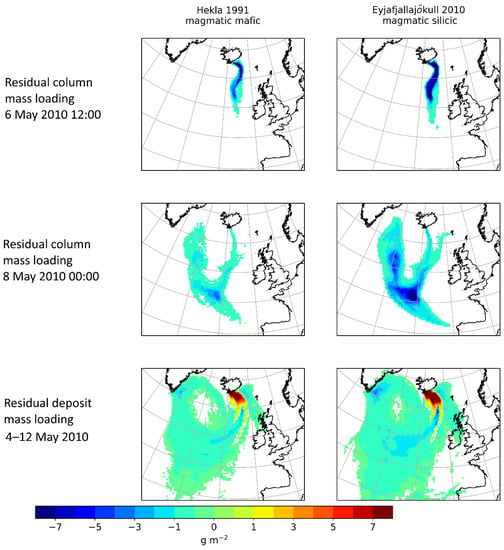
Figure 11.
Residual mass loadings derived by subtracting the modelled mass loading using the VAAC default PSD from the result with either the coarse (Hekla 1991; left) or fine (Eyjafjallajökull 2010; right) PSD. The top two rows are residual total column mass loadings (in the air) on 6 May 2010 12:00 UTC and 8 May 2010 00:00 UTC (see Figure 10 for equivalent non-residual maps); the bottom row is residual deposit mass loadings (on the ground) for the period 4–12 May 2010 (see Figure 12 for equivalent non-residual maps).
Table 5 summarises statistical comparisons of the modelled total column mass loadings using the VAAC default PSD compared to simulations initialized with the other PSDs. All PSDs produced lower total column mass loadings than the VAAC default, as shown by the negative FB (−0.218–−1.522). Bias was more extreme when the plume was more dispersed on 8 May. PCC values were high for total column mass loadings, ranging from 0.846 to 0.992, with the highest values seen with the more concentrated plume. The pattern was similar for FoM, where values for total column mass loadings ranged from 38.68 to 90.25 and again the highest values were seen with the more concentrated plume. The modelled total column mass loadings using the finest PSD (Eyjafjallajökull 2010 including satellite observations) to initialise NAME were most similar to the modelled mass loadings using the VAAC default PSD across all measures. Using the coarsest PSD (Hekla 1991) resulted in the biggest differences in the modelled plume, except for KSP values for 6 May, where Eldgja had the highest value. It should be noted that the discrepancies in modelled plumes using different PSDs to initialise the simulation will grow with time and as the plume becomes more dispersed.

Table 5.
Statistical differences between VAAC default PSD and all other PSD results. FB = fractional bias; PCC = Pearson’s Correlation Coefficient; FoM = Figure of Merit in Space; KSP = Kolmogorov–Smirnov Parameter. Pink indicates closest to VAAC default, and blue is furthest away.
Supplementary Materials Section S4 includes tables comparing values of FB, PCC, FoM and KSP among PSDs. The tables show each statistic for pairwise comparisons of all eruptions considered. Eruptions with the finest PSDs (Eyjafjallajökull 2010, Oruanui and VAAC default) rank highest across all measures (lower FB, higher PCC and FoM and lower KSP) when compared with each other, and lowest when compared to eruptions with the coarsest PSDs (Hekla 1991 and Eldgja).
4.2. Deposit Mass Loading
Figure 12 shows the modelled deposit mass loading for the period 4–12 May 2010. Using the VAAC default PSD extends the deposit further than when using any other input PSD, but proximal deposit mass loadings are lower (and so show positive residuals in Figure 11 and Figure S7), reflecting the low mass fraction of larger particles (≤ 5 Φ, ≥ 31.25 µm). Proximal mass loadings of these relatively coarse particles are high for all other input PSDs, covering the whole range of magma compositions from basaltic, e.g., Hekla 1991, to rhyolitic, e.g., Rotongaio (Figure 13).
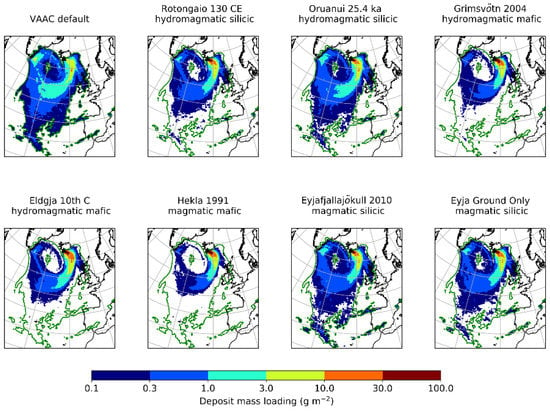
Figure 12.
Deposition for the period 4–12 May 2010 using a range of input PSDs. The extent of the simulated deposit using the VAAC default PSD is shown as a green outline on each plot.
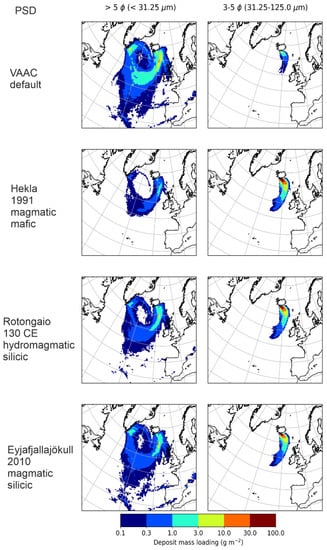
Figure 13.
Deposit mass loadings binned at > 5 Φ (< 31.25 µm) and 3–5 Φ (31.25–125 µm) for a range of PSDs.
Particles ≤ 5 Φ (≥ 31.25 µm) reached distances up to ~1500 km from source (Figure 13), highlighting a limitation of using remote sensing alone when compiling grain size distributions, as satellite retrievals are usually not configured to identify such large particles [19]. For the smaller particles (> 5 Φ, < 31.25 µm), using the VAAC default PSD results in a more extensive deposit with higher mass loading of ash, and the difference is largest when compared with using the coarsest (mafic/intermediate) PSD (Hekla 1991). In this case, the VAAC PSD is likely to substantially overestimate the extent of the plume and the distance travelled by the small particles before deposition, because there is too much mass on small particles.
Statistical comparisons of the VAAC default PSD with all other PSDs (Table 5) show that using the Eyjafjallajökull PSD produced deposits with the lowest bias; the Oruanui PSD produced deposits that were most similar in the other measures, and the Hekla 1991 PSD produced a deposit that was most different. All PSDs resulted in higher deposit mass loadings compared to using the VAAC default PSD, although FB values were smaller (0.068–0.398) than when comparing column mass loadings. PCC values were 0.542 to 0.686, FoM values were between 35.97 and 82.04 and KSP ranged from 9.4 to 38.5.
Binned median values of the modelled deposit grain size, calculated at each grid point (Figure 14), show that the median modelled grain size is ≤ 5 Φ (≥ 31.25 µm) to ~1400 km from source. The VAAC default deposit most closely matches deposits modelled with the finest input PSDs (Eyjafjallajökull 2010 and Oruanui ~25.4 ka BP).
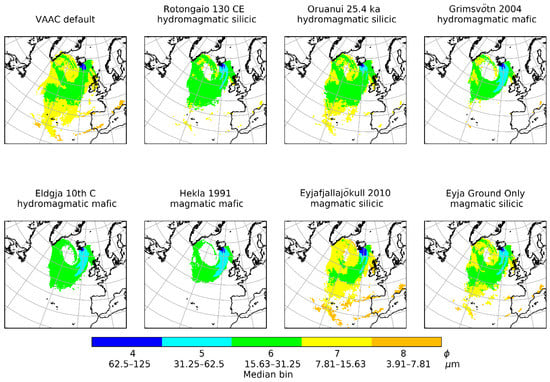
Figure 14.
Modelled median grain size of deposits using PSDs from hydromagmatic and magmatic eruptions with silicic and mafic/intermediate compositions.
5. Discussion
5.1. Grain Size Distributions for Hydromagmatic Eruptions
Grain size distributions of deposits from hydromagmatic eruptions can be relatively constant over large distances from source (Figure 4, Figure 5 and Figure 6). This is in contrast to magmatic eruptions, where the deposits (and therefore, median grain size) become finer as distance increases (e.g., Figure 6 and Figure S1). The lack of fining with distance in large hydromagmatic deposits suggests that it may be possible to obtain reliable estimates of TGSD from relatively few sampling locations, at least for the largest eruptions. This could be valuable in enlarging the dataset available to dispersion modellers and would aid studies of the fundamental physics of magma fragmentation and controls of eruption intensity. However, the consistency in grain size with distance indicates that the addition of water promotes aggregation and/or en masse settling of particles, which needs to be considered in forecasts of hydromagmatic ash clouds. Both of these processes are promoted by high ash concentrations and so tend to be more important close to source. Accretionary lapilli (compound particles much larger than their component ash particles) found in proximal samples (e.g., [46,51]) can help to explain the relative abundance of fine particles close to source and may account for slight increases in median grain size with distance as seen in Figure 5. Gravitational instabilities in the plume can cause en masse settling of a range of grain sizes including the finest particles, resulting in deposition where grain size is independent of distance [30]. Sedimentation by gravitational instabilities has been observed, for example during eruptions at Eyjafjallajökull in 2010 and Sakurajima in 2015 [17,32].
Questions remain about the extent of water-induced secondary fragmentation of particles in large explosive eruptions, especially ‘phreatoplinean’ (hydromagmatic Plinian) eruptions. It may be that in the largest hydromagmatic eruptions, water has relatively little effect on the ash size distribution (i.e., the ash is dominantly the result of primary fragmentation) [81]. If this is the case, the hydromagmatic TGSDs could also be useful for estimating TGSD of equivalent magmatic eruptions, particularly where the most distal (fine-grained and thin) portions of the deposits are not mapped and so are not readily included in TGSDs [82,83].
5.2. Sensitivity of Modelled Ash Mass Loadings to Input PSDs
Modelled total column and deposit mass loadings show significant differences depending on the input PSD used, with results using the VAAC default PSD being most similar to the finest PSDs tested, which are from silicic eruptions. However, the VAAC default PSD is based on measurements in the air [15,72], and the PSDs compiled in this study, with the exception Eyjafjallajökull 2010, were determined using only samples collected on the ground. Ground-based TGSDs will generally underestimate the mass fraction of the finest material because there is fine ash beyond the mapped deposit (e.g., [83]) and indeed satellite data for Eyjafjallajökull 2010 added significant mass on particles ≥ 7 Φ (≤ 7.8 µm) [33]. This is important because VAAC dispersion modelling aims to quantify distal airborne concentrations of the smallest particles.
Comparison of the results for Eyjafjallajökull 2010 using PSDs defined by (1) the TGSD based on ground-only, and (2) ground-plus-satellite data shows that using ground-based TGSDs produces lower peak ash concentrations and reduces the spatial extent of the plume. This accords with results of other studies highlighting the importance of compiling TGSDs from both ground and airborne measurements (e.g., [84,85]). However, satellite retrieval data can also be problematic as the particles are generally assumed to be dense spheres and the retrieval algorithm is set to interpret brightness temperature difference as coming from particles with effective radius < ~16 μm. This does not take into account that reflection off bubble walls of larger particles would also give the same brightness temperature difference [19]. Further work is required to understand how satellite data can best be used to improve TGSDs of modern historic eruptions. In addition, we have no satellite and aircraft sampling for some types and sizes of eruptions that have not occurred in recent decades (e.g., VEI 7 eruptions) and for these, deposit-only TGSDs are key for assessing suitable PSDs for simulations.
Our study focused on particle size, but shape and density are also important factors when considering ash transport and deposition (e.g., [7,9,86]) and the mass fraction held within the finest particles also affects plume and deposit concentrations. For the eruptions selected for our sensitivity tests, we used the London VAAC assumption that particles in the distal ash cloud (which we have taken as ≤ 125 µm) represent 5% of the mass erupted. However the mapped deposits (TGSD) in our entire dataset have mass fractions of particles > 3 Φ (≤ 125 µm) ranging from 3% to 73%. The range for those that are the basis of the PSD for our simulations is 14% to 73%. So including only 5% of total mass erupted in the simulations implies that most of the fine ash is deposited sufficiently close to source that it is not of interest for the applications of the modelling results. There is debate about the mass fraction typically in the distal ash cloud, with comparisons of masses of distal ash based on satellite data to total masses based on ground data, suggesting that the distal ash fraction may be only 0.1% of erupted mass for the largest eruptions [87], but other analyses of the spatial distributions of tephra and fine ash contents of deposits suggest much higher distal fine ash fractions [26,83].
5.3. PSDs for Real-Time Forecasting During an Eruption
In this study, we ran simulations with PSDs based on the TGSDs of hydromagmatic and magmatic deposits of a range of compositions. The TGSDs for hydromagmatic eruptions (Figure 1) fall within the range of TGSDs for magmatic eruptions (Figure 2) but are less variable and tend to be finer (greater in Φ scale); however, when we consider only particles likely to be in the distal ash cloud (> 3Φ, < 125 µm), there is almost total overlap of hydromagamatic and magmatic grain size distribution data, with composition (and VEI) being the most important factor (Figure 3). Our NAME simulations using PSDs based on the < 125 µm portion of deposit TGSDs show clear differences between total column mass loadings for mafic/intermediate and silicic eruptions, with modelled concentrations using the current VAAC default PSD more closely matching results for silicic eruptions with the finest PSDs. This could be a problem particularly for forecasting ash plumes from coarse-grained, mafic/intermediate eruptions which occur frequently in Iceland (as shown in Table 1 and Table 2).
Model PSDs derived only from ground samples are likely to underestimate the mass of the finest particles and this would need to be considered when choosing any new coarse-grained default PSD. One option would be to explore more sample eruptions where satellite data are also available, as done for Eyjafjallajökull 2010 [33]. Alternatively, a statistical distribution could be used, based on best fit with sampled data (e.g., [59]). Pioli et al. [23] suggest lognormal and Weibull (Rosin–Rammler) distributions are suitable for modelling deposits with fine tails.
The default PSD used by the London VAAC is from aircraft samples, taken from the margin of the ash cloud, during the 1990 eruption of Mount Redoubt and so it represents only a snapshot from that eruption. The ash cloud was generated when a (possibly hydromagmatic) vent explosion and dome collapse created a co-pyroclastic density current (co-PDC) andesitic–dacitic plume [15,72,88]. Because only the finest particles are entrained into co-PDC plumes, the resulting TGSD is likely to be finer than for a vent-derived plume [89].
6. Conclusions
The grain size distribution of an ash cloud is rarely measured in real time but operational dispersion model simulations used to forecast the location and concentration of ash in the atmosphere are highly sensitive to this parameter. VAACs often rely on using a default PSD to initialise model runs but it has not been clear how best to constrain these.
In this study, we have focused on constraints on PSD from the deposits resulting from ash in the air landing on the ground. We compiled published grain size data from the deposits of hydromagmatic and magmatic eruptions and found that, while grain size distributions for magmatic eruptions change with distance from source, for large hydromagmatic eruptions, grain size remains relatively constant with distance. This suggests that TGSDs for these eruptions could be compiled from fewer samples than are required for typical magmatic eruptions, potentially providing a larger dataset of TGSDs in the future. For the largest hydromagmatic eruptions, if water impacts transport and deposition of particles but has relatively little effect on the ash size distribution, the TGSDs could also provide useful estimates of PSDs for modelling ash dispersion from the equivalent magmatic eruptions.
Although TGSDs for hydromagmatic eruptions tend to be finer than for magmatic eruptions (c.f. Figure 1 and Figure 2), they are similar for the fine portion (< 125 μm) that is likely to be in the distal ash cloud (Figure 3a). Previous studies, focusing on the whole range of grain sizes, have found that TGSD is dominantly controlled by magma composition (and eruption size), with silicic eruptions (> 63% SiO2) typically generating finer TGSDs than eruptions of more mafic magma (e.g., [13,24]). We have found that this relationship also holds true for this fine fraction.
We investigated the sensitivity of modelled ash mass loadings to input PSDs using end-members which represented a coarse PSD from a mafic/intermediate eruption and a fine PSD from a silicic eruption. There are clear differences between mass loadings for forecasts with PSDs based on mafic/intermediate and silicic eruption TGSDs. For the default PSD used by the London VAAC, simulations were most similar to those generated using the finest PSDs based on silicic eruptions and peak values of total column mass loading were up to 5-fold greater than for the coarsest PSD (based on Hekla 1991).
Our input PSDs were based on ground samples, which are likely to lack the most distal material and so adding mass on the finest particles could produce more representative results. Nevertheless, we have constrained end-members representing coarse- and fine-grained PSDs, which could be used by the VAACs to assess the sensitivity of their forecasts to the PSD applied (within the caveats of the limitations associated with the measurement methods).
Supplementary Materials
The following are available online at https://www.mdpi.com/2073-4433/11/6/567/s1, Section S1: details of eruptions considered; Section S2: Change in median grain size with distance from source for eruptions with samples for both the hydromagmatic and magmatic phases; Section S3: Comparison of current VAAC default particle size distribution (PSD) with equivalent values on whole-Φ and half-Φ scales; Section S4: Statistical tests and residual mass loadings; Section S5: References to supplementary material. Figure S1 Change of median grain size with distance from source for eruptions having both phreatomagmatic and magmatic phases, Figure S2 VAAC default particle size bins and Φ values plotted on a log scale Φ bins, Figure S3 Log values of Φ and micron scales a) general case. b) example for 8—9 Φ bin, Figure S4 Comparison of NAME output for total column mass loading using VAAC default PSD, whole-Φ scale PSD, half-Φ scale PSD, for times of high and low wind and high and low plume during the Eyjafjallajökull eruption 2010, Figure S5 Residuals for total column mass loading for 6 May 2010 12:00 UTC after removing VAAC default PSD values, Figure S6 Residuals for total column mass loading for 8 May 2010 00:00 UTC after removing VAAC default PSD values, Figure S7 Residuals for deposit mass loadings for 4–12 May 2010 after removing VAAC default PSD values. Table S1 Micron equivalents of whole-Φ particle size scale and corresponding mass fractions for the VAAC default particle size distribution, Table S2 Micron equivalents of half-Φ particle size scale and corresponding mass fractions for the VAAC default particle size distribution, Table S3 Fractional bias of whole-Φ and half-Φ results (Figure S4) when compared with the VAAC default PSD.
Author Contributions
Conceptualization, F.B. and A.R.; data curation, S.O. and E.S.; formal analysis, S.O.; supervision, F.B. and A.R.; writing—original draft, S.O.; writing—review and editing, S.O., F.B., A.R. and E.S. All authors have read and agreed to the published version of the manuscript.
Funding
This research received no external funding.
Acknowledgments
This work has received funding from the Aviation Business group at the Met Office. The authors would like to thank the Atmospheric Dispersion and Air Quality group at the Met Office, especially Emma Kendall for her help with Python and Susan Leadbetter for help with the statistical tests. Thanks also to Kathy Cashman for helpful suggestions on the draft manuscript, David Thomson and Ben Devenish for interesting conversations on NAME model physics and Jen Saxby for help with NAME and JASMIN. We also thank three reviewers, whose comments have assisted us in substantially improving the manuscript.
Conflicts of Interest
The authors declare no conflict of interest.
Appendix A. NAME Input Data

Table A1.
Input file particle size distributions and cumulative mass fractions for NAME runs.
Table A1.
Input file particle size distributions and cumulative mass fractions for NAME runs.
| Phi | PSD | Cumulative Fraction | ||||||
|---|---|---|---|---|---|---|---|---|
| Diameter Range Boundary (µm) | Oruanui | Rotongaio | Grímsvötn 2004 | Eldgja 10th C | Eyjafjallajökull 2010 | Eyjafjallajökull 2010 Ground Only | Hekla 1991 | |
| 11 | 0.4883 | 0 | ||||||
| 10 | 0.9766 | 0 | 0.0186 | 0 | ||||
| 9.5 | 1.3811 | 0.0198 | ||||||
| 9 | 1.9531 | 0 | 0 | 0.0221 | 0.04 | 0.0283 | ||
| 8.5 | 2.7613 | 0.0292 | ||||||
| 8 | 3.9063 | 0.0157 | 0.0466 | 0.0381 | 0 | 0.1194 | 0.0566 | 0 |
| 7.5 | 5.5243 | 0.0541 | 0.0031 | 0.008 | ||||
| 7 | 7.8125 | 0.08 | 0.1274 | 0.0734 | 0.0093 | 0.2767 | 0.1419 | 0.0138 |
| 6.5 | 11.049 | 0.0992 | 0.0247 | 0.0291 | ||||
| 6 | 15.625 | 0.3086 | 0.2014 | 0.1353 | 0.0617 | 0.4609 | 0.2855 | 0.0539 |
| 5.5 | 22.097 | 0.1906 | 0.142 | 0.0859 | ||||
| 5 | 31.25 | 0.6286 | 0.4288 | 0.254 | 0.2901 | 0.6184 | 0.4851 | 0.155 |
| 4.5 | 44.194 | 0.3723 | 0.4969 | 0.2766 | ||||
| 4 | 62.5 | 0.7914 | 0.637 | 0.5425 | 0.6975 | 0.8063 | 0.7428 | 0.4338 |
| 3.5 | 88.388 | 0.7756 | 0.858 | 0.6499 | ||||
| 3 | 125 | 1 | 1 | 1 | 1 | 1 | 1 | 1 |
References
- Budd, L.; Griggs, S.; Howarth, D.; Ison, S. A fiasco of volcanic proportions? Eyjafjallajökull and the closure of European airspace. Mobilities 2011, 6, 31–40. [Google Scholar] [CrossRef]
- Civil Aviation Authority Guidance Regarding Flight Operations in the Vicinity of Volcanic Ash. CAP1236. Available online: http://publicapps.caa.co.uk/docs/33/CAP1236FEB17.pdf (accessed on 3 February 2020).
- Hort, M. VAAC Operational Dispersion Model Configuration Snap Shot. Available online: https://www.wmo.int/aemp/sites/default/files/VAAC_Modelling_OperationalModelConfiguration-2018.pdf (accessed on 3 February 2020).
- Witham, C.; Hort, M.; Thomson, D.; Leadbetter, S.J.; Devenish, B.J.; Webster, H.; Beckett, F.M.; Kristiansen, N. The Current Volcanic Ash Modelling Set-Up at the London VAAC. Met Office Technical Summary. Available online: https://www.metoffice.gov.uk/binaries/content/assets/metofficegovuk/pdf/services/transport/aviation/vaac/london_vaac_current_modelling_setup.pdf (accessed on 16 April 2020).
- Beckett, F.M.; Witham, C.; Leadbetter, S.J.; Crocker, R.; Webster, H.; Hort, M.; Jones, A.; Devenish, B.; Thomson, D. Atmospheric dispersion modelling at the London VAAC: A review of developments since the 2010 Eyjafjajokull eruption. Atmosphere 2020, 11, 352. [Google Scholar] [CrossRef]
- Mastin, L.G.; Guffanti, M.; Servranckx, R.; Webley, P.; Barsotti, S.; Dean, K.; Durant, A.; Ewert, J.W.; Neri, A.; Rose, W.I.; et al. A multidisciplinary effort to assign realistic source parameters to models of volcanic ash-cloud transport and dispersion during eruptions. J. Volcanol. Geotherm. Res. 2009, 186, 10–21. [Google Scholar] [CrossRef]
- Bagheri, G.; Bonadonna, C. Aerodynamics of volcanic particles: Characterization of size, shape, and settling velocity. In Volcanic Ash: Hazard Observation; Mackie, S., Cashman, K.V., Ricketts, H., Rust, A.C., Watson, M., Eds.; Elsevier: London, UK, 2016; pp. 39–52. [Google Scholar]
- Beckett, F.M.; Witham, C.S.; Hort, M.C.; Stevenson, J.A.; Bonadonna, C.; Millington, S.C. Sensitivity of dispersion model forecasts of volcanic ash clouds to the physical characteristics of the particles. J. Geophys. Res. Atmos. 2015, 120, 11636–11652. [Google Scholar] [CrossRef]
- Saxby, J.; Beckett, F.; Cashman, K.; Rust, A.; Tennant, E. The impact of particle shape on fall velocity: Implications for volcanic ash dispersion modelling. J. Volcanol. Geotherm. Res. 2018, 362, 32–48. [Google Scholar]
- Scollo, S.; Folch, A.; Costa, A. A parametric and comparative study of different tephra fallout models. J. Volcanol. Geotherm. Res. 2008, 176, 199–211. [Google Scholar]
- Osores, S.; Ruiz, J.; Folch, A.; Collini, E. Volcanic ash forecast using ensemble-based data assimilation: An ensemble transform Kalman filter coupled with the FALL3D-7.2 model (ETKF-FALL3D version 1.0). Geosci. Model Dev. 2020, 13, 1–22. [Google Scholar]
- Zidikheri, M.J.; Lucas, C.; Potts, R.J. Estimation of optimal dispersion model source parameters using satellite detections of volcanic ash. J. Geophys. Res. Atmos. 2017, 122, 8207–8232. [Google Scholar] [CrossRef]
- Rust, A.C.; Cashman, K.V. Permeability controls on expansion and size distributions of pyroclasts. J. Geophys. Res. Solid Earth 2011, 116, B11202. [Google Scholar]
- Cashman, K.V.; Rust, A.C. Volcanic ash: Generation and spatial variations. In Volcanic Ash: Hazard Observation; Mackie, S., Cashman, K.V., Ricketts, H., Rust, A.C., Watson, M., Eds.; Elsevier: Amsterdam, The Netherlands, 2016; pp. 5–22. [Google Scholar]
- Hobbs, P.V.; Radke, L.F.; Lyons, J.H.; Ferek, R.J.; Coffman, D.J. Airborne measurements of particle and gas emissions from the 1990 volcanic eruptions of Mount Redoubt. J. Geophys. Res. 1991, 96, 18735–18752. [Google Scholar] [CrossRef]
- Johnson, B.; Turnbull, K.; Brown, P.; Burgess, R.; Dorsey, J.; Baran, A.J.; Webster, H.; Haywood, J.; Cotton, R.; Ulanowski, Z.; et al. In situ observations of volcanic ash clouds from the FAAM aircraft during the eruption of Eyjafjallajökull in 2010. J. Geophys. Res. Atmos. 2012, 117, D20. [Google Scholar]
- Eliasson, J.; Watson, I.M. In situ observations of airborne ash from manned aircraft. In Volcanic Ash: Hazard Observation; Mackie, S., Cashman, K.V., Ricketts, H., Rust, A.C., Watson, M., Eds.; Elsevier: Amsterdam, The Netherlands, 2016; pp. 89–98. [Google Scholar]
- Schumann, U.; Weinzierl, B.; Reitebuch, O.; Schlager, H.; Minikin, A.; Forster, C.; Baumann, R.; Sailer, T.; Graf, K.; Mannstein, H.; et al. Airborne observations of the Eyjafjalla volcano ash cloud over Europe during air space closure in April and May 2010. Atmos. Chem. Phys. 2011, 11, 2245–2279. [Google Scholar] [CrossRef]
- Stevenson, J.A.; Millington, S.C.; Beckett, F.M.; Swindles, G.T.; Thordarson, T. Big grains go far: Understanding the discrepancy between tephrochronology and satellite infrared measurements of volcanic ash. Atmos. Meas. Tech. 2015, 8, 2069–2091. [Google Scholar]
- Corradini, S.; Montopoli, M.; Guerrieri, L.; Ricci, M.; Scollo, S.; Merucci, L.; Marzano, F.; Pugnaghi, S.; Prestifilippo, M.; Ventress, L.; et al. A multi-sensor approach for volcanic ash cloud retrieval and eruption characterization: The 23 November 2013 Etna lava fountain. Remote Sens. 2016, 8, 58. [Google Scholar] [CrossRef]
- Janebo, M.H.; Houghton, B.F.; Thordarson, T.; Bonadonna, C.; Carey, R.J. Total grain-size distribution of four Subplinian–Plinian tephras from Hekla volcano, Iceland: Implications for sedimentation dynamics and eruption source parameters. J. Volcanol. Geotherm. Res. 2018, 357, 25–38. [Google Scholar] [CrossRef]
- Gudnason, J.; Thordarson, T.; Houghton, B.F.; Larsen, G. The opening subplinian phase of the Hekla 1991 eruption: Properties of the tephra fall deposit. Bull. Volcanol. 2017, 79, 34. [Google Scholar] [CrossRef]
- Pioli, L.; Bonadonna, C.; Pistolesi, M. Reliability of total grain-size distribution of tephra deposits. Sci. Rep. 2019, 9, 10006. [Google Scholar]
- Costa, A.; Pioli, L.; Bonadonna, C. Assessing tephra total grain-size distribution: Insights from field data analysis. Earth Planet. Sci. Lett. 2016, 443, 90–107. [Google Scholar]
- Bonadonna, C.; Houghton, B.F. Total grain-size distribution and volume of tephra-fall deposits. Bull. Volcanol. 2005, 67, 441–456. [Google Scholar] [CrossRef]
- Cashman, K.V.; Rust, A.C. Far-travelled ash in past and future eruptions: Combining tephrochronology with volcanic studies. J. Quat. Sci. 2019, 35, 11–22. [Google Scholar]
- Liu, E.J.; Cashman, K.V.; Rust, A.C.; Höskuldsson, A. Contrasting mechanisms of magma fragmentation during coeval magmatic and hydromagmatic activity: The Hverfjall Fires fissure eruption, Iceland. Bull. Volcanol. 2017, 79, 68. [Google Scholar] [CrossRef]
- Stevenson, J.A.; Loughlin, S.C.; Font, A.; Fuller, G.W.; MacLeod, A.; Oliver, I.W.; Jackson, B.; Horwell, C.J.; Thordarson, T.; Dawson, I. UK monitoring and deposition of tephra from the May 2011 eruption of Grímsvötn, Iceland. J. Appl. Volcanol. 2013, 2, 3. [Google Scholar] [CrossRef]
- Mueller, S.B.; Kueppers, U.; Huber, M.S.; Hess, K.-U.; Poesges, G.; Ruthensteiner, B.; Dingwell, D.B. Aggregation in particle rich environments: A textural study of examples from volcanic eruptions, meteorite impacts, and fluidized bed processing. Bull. Volcanol. 2018, 80, 32. [Google Scholar] [CrossRef]
- Koyaguchi, T.; Ohno, M. Reconstruction of eruption column dynamics on the basis of grain size of tephra fall deposits: 2. Application to the Pinatubo 1991 eruption. J. Geophys. Res. Solid Earth 2001, 106, 6513–6533. [Google Scholar] [CrossRef]
- Carazzo, G.; Jellinek, A.M. Particle sedimentation and diffusive convection in volcanic ash-clouds. J. Geophys. Res. Solid Earth 2013, 118, 1420–1437. [Google Scholar] [CrossRef]
- Manzella, I.; Bonadonna, C.; Phillips, J.C.; Monnard, H. The role of gravitational instabilities in deposition of volcanic ash. Geology 2015, 43, 211–214. [Google Scholar] [CrossRef]
- Bonadonna, C.; Genco, R.; Gouhier, M.; Pistolesi, M.; Cioni, R.; Alfano, F.; Hoskuldsson, A.; Ripepe, M. Tephra sedimentation during the 2010 Eyjafjallajökull eruption (Iceland) from deposit, radar, and satellite observations. J. Geophys. Res. 2011, 116, B12202. [Google Scholar]
- Crosweller, H.S.; Arora, B.; Brown, S.K.; Cottrell, E.; Deligne, N.I.; Guerrero, N.O.; Hobbs, L.; Kiyosugi, K.; Loughlin, S.C.; Lowndes, J.; et al. Global database on large magnitude explosive volcanic eruptions (LaMEVE). J. Appl. Volcanol. 2012, 1, 4. [Google Scholar]
- Venzke, E. Global Volcanism Program: Volcanoes of the World, v. 4.8.5. Available online: https://volcano.si.edu/gvp_votw.cfm (accessed on 20 April 2020).
- Sparks, R.S.J.; Wilson, L.; Sigurdsson, H. The pyroclastic deposits of the 1875 eruption of Askja, Iceland. Philos. Trans. R. Soc. A Math. Phys. Eng. Sci. 1981, 299, 241–273. [Google Scholar]
- Moreland, W.M. Explosive Activity in Flood Lava Eruptions: A Case Study of the 10th Century Eldgja Eruption, Iceland. Ph.D. Thesis, University of Iceland, Reykjavík, Iceland, 2017. [Google Scholar]
- Jude-Eton, T.C. Eruption Dynamics within an Emergent Subglacial Setting: A Case Study of the 2004 Eruption at Grímsvötn Volcano, Iceland. Ph.D. Thesis, University of Edinburgh, Edinburgh, UK, 2013. [Google Scholar]
- Olsson, J.; Stipp, S.L.S.; Dalby, K.N.; Gislason, S.R. Rapid release of metal salts and nutrients from the 2011 Grímsvötn, Iceland volcanic ash. Geochim. Cosmochim. Acta 2013, 123, 134–149. [Google Scholar]
- Gjerløw, E.; Höskuldsson, A.; Pedersen, R.-B. The 1732 Surtseyan eruption of Eggøya, Jan Mayen, North Atlantic: Deposits, distribution, chemistry and chronology. Bull. Volcanol. 2015, 77, 14. [Google Scholar] [CrossRef]
- Magnúsdóttir, A.Ö. Characteristics of the CE 1226 Medieval Tephra Layer from the Reykjanes Volcanic System. Master’s Thesis, University of Iceland, Reykjavík, Iceland, 2015. [Google Scholar]
- Varekamp, J.C.; Luhr, J.F.; Prestegaard, K.L. The 1982 eruptions of El Chichón Volcano (Chiapas, Mexico): Character of the eruptions, ash-fall deposits, and gasphase. J. Volcanol. Geotherm. Res. 1984, 23, 39–68. [Google Scholar] [CrossRef]
- Pedrazzi, D.; Suñe-Puchol, I.; Aguirre-Díaz, G.J.; Costa, A.; Smith, V.C.; Poret, M.; Dávila-Harris, P.; Miggins, D.P.; Hernández, W.; Gutierrez, E. The Ilopango Tierra Blanca Joven (TBJ) eruption, El Salvador: Volcano-stratigraphy and physical characterization of the major Holocene event of Central America. J. Volcanol. Geotherm. Res. 2019, 377, 81–102. [Google Scholar] [CrossRef]
- Fisher, R.V. Maximum size, median diameter, sorting of tephra. J. Geophys. Res. 1964, 69, 341–355. [Google Scholar] [CrossRef]
- Mohr, E.C.J.; Van Baren, F.A. Tropical Soils: A Critical Study of Soil Genesis as Related to Climate, Rock and Vegetation; W. Van Hoeve: The Hague, The Netherlands, 1954. [Google Scholar]
- Brazier, S.; Davis, A.N.; Sigurdsson, H.; Sparks, R.S.J. Fall-out and deposition of volcanic ash during the 1979 explosive eruption of the Soufrière of St. Vincent. J. Volcanol. Geotherm. Res. 1982, 14, 335–359. [Google Scholar] [CrossRef]
- Walker, G.P.L. Characteristics of two phreatoplinian ashes, and their water-flushed origin. J. Volcanol. Geotherm. Res. 1981, 9, 395–407. [Google Scholar] [CrossRef]
- Self, S. Large-scale phreatomagmatic silicic volcanism: A case study from New Zealand. J. Volcanol. Geotherm. Res. 1983, 17, 433–469. [Google Scholar] [CrossRef]
- Van Eaton, A.R.; Wilson, C.J.N. The nature, origins and distribution of ash aggregates in a large-scale wet eruption deposit: Oruanui, New Zealand. J. Volcanol. Geotherm. Res. 2013, 250, 129–154. [Google Scholar] [CrossRef]
- Hayakawa, Y. Pyroclastic geology of Towada volcano. Bull. Earthq. Res. Inst. Univ. Tokyo 1985, 60, 507–592. [Google Scholar]
- Hayakawa, Y. The Hachinohe ash: An example of an accretionary lapilli fall deposit from Towada Volcano, Japan. Bull. Volcanol. Soc. Jpn. Ser. 2 1983, 28, 25–40. [Google Scholar]
- Janebo, M.H. Historic Explosive Eruptions of Hekla and Askja Volcanoes, Iceland: Eruption Dynamics and Source Parameters. Ph.D. Thesis, University of Hawai’i at Manoa, Honolulu, HI, USA, 2016. [Google Scholar]
- Gudmundsson, M.T.; Larsen, G. Catalogue of Icelandic Volcanoes: Grímsvötn. Available online: http://icelandicvolcanos.is (accessed on 19 April 2020).
- Gudnason, J.; Thordarson, T.; Houghton, B.F.; Larsen, G. The 1845 Hekla eruption: Grain-size characteristics of a tephra layer. J. Volcanol. Geotherm. Res. 2018, 350, 33–46. [Google Scholar] [CrossRef]
- Biass, S.; Scaini, C.; Bonadonna, C.; Folch, A.; Smith, K.; Höskuldsson, A. A multi-scale risk assessment for tephra fallout and airborne concentration from multiple Icelandic volcanoes. Part 1: Hazard assessment. Nat. Hazards Earth Syst. Sci. 2014, 14, 2265–2287. [Google Scholar] [CrossRef]
- Höskuldsson, Á.; Óskarsson, N.; Pedersen, R.; Grönvold, K.; Vogfjörð, K.; Ólafsdóttir, R. The millennium eruption of Hekla in February 2000. Bull. Volcanol. 2007, 70, 169–182. [Google Scholar] [CrossRef]
- Mele, D.; Costa, A.; Dellino, P.; Sulpizio, R.; Dioguardi, F.; Isaia, R.; Macedonio, G. Total grain size distribution of components of fallout deposits and implications for magma fragmentation mechanisms: Examples from Campi Flegrei caldera (Italy). Bull. Volcanol. 2020, 82, 1–12. [Google Scholar] [CrossRef]
- Alfano, F.; Bonadonna, C.; Watt, S.; Connor, C.; Volentik, A.; Pyle, D.M. Reconstruction of total grain size distribution of the climactic phase of a long-lasting eruption: The example of the 2008–2013 Chaitén eruption. Bull. Volcanol. 2016, 78, 46. [Google Scholar] [CrossRef]
- Bonadonna, C.; Cioni, R.; Pistolesi, M.; Elissondo, M.; Baumann, V. Sedimentation of long-lasting wind-affected volcanic plumes: The example of the 2011 rhyolitic Cordón Caulle eruption, Chile. Bull. Volcanol. 2015, 77, 13. [Google Scholar] [CrossRef]
- Rose, W.I.; Self, S.; Murrow, P.J.; Bonadonna, C.; Durant, A.J.; Ernst, G.G.J. Nature and significance of small volume fall deposits at composite volcanoes: Insights from the October 14, 1974 Fuego eruption, Guatemala. Bull. Volcanol. 2008, 70, 1043–1067. [Google Scholar] [CrossRef]
- Volentik, A.C.M. Tephra Transport, Sedimentation and Hazards. Ph.D. Thesis, University of South Florida, Tampa, FL, USA, 2009. [Google Scholar]
- Bonadonna, C.; Phillips, J.C.; Houghton, B.F. Modeling tephra sedimentation from a Ruapehu weak plume eruption. J. Geophys. Res. 2005, 110, B08209. [Google Scholar] [CrossRef]
- Fontijn, K.; Ernst, G.G.J.; Bonadonna, C.; Elburg, M.A.; Mbede, E.; Jacobs, P. The ~4-ka Rungwe Pumice (south-western Tanzania): A wind-still Plinian eruption. Bull. Volcanol. 2011, 73, 1353–1368. [Google Scholar] [CrossRef]
- Carey, S.N.; Sigurdsson, H. Influence of particle aggregation on deposition of distal tephra from the May 18, 1980, eruption of Mount St. Helens volcano. J. Geophys. Res. Solid Earth 1982, 87, 7061–7072. [Google Scholar] [CrossRef]
- Durant, A.J.; Rose, W.I. Sedimentological constraints on hydrometeor-enhanced particle deposition: 1992 Eruptions of Crater Peak, Alaska. J. Volcanol. Geotherm. Res. 2009, 186, 40–59. [Google Scholar] [CrossRef]
- Carey, R.J.; Houghton, B.F.; Thordarson, T. Tephra dispersal and eruption dynamics of wet and dry phases of the 1875 eruption of Askja Volcano, Iceland. Bull. Volcanol. 2010, 72, 259–278. [Google Scholar] [CrossRef]
- Jones, A.; Thomson, D.; Hort, M.; Devenish, B. The U.K. Met Office’s next-generation atmospheric dispersion model, NAME III. In Air Pollution Modeling and Its Application XVII; Springer: Boston, MA, USA, 2007; pp. 580–589. [Google Scholar]
- Devenish, B.J.; Francis, P.N.; Johnson, B.T.; Sparks, R.S.J.; Thomson, D.J. Sensitivity analysis of dispersion modeling of volcanic ash from Eyjafjallajokull in May 2010. J. Geophys. Res. 2012, 117, D00U21. [Google Scholar] [CrossRef]
- Grant, A.L.M.; Dacre, H.F.; Thomson, D.J.; Marenco, F. Horizontal and vertical structure of the Eyjafjallajökull ash cloud over the UK: A comparison of airborne lidar observations and simulations. Atmos. Chem. Phys. 2012, 12, 10145–10159. [Google Scholar] [CrossRef]
- Millington, S.C.; Saunders, R.W.; Francis, P.N.; Webster, H.N. Simulated volcanic ash imagery: A method to compare NAME ash concentration forecasts with SEVIRI imagery for the Eyjafjallajokull eruption in 2010. J. Geophys. Res. 2012, 117, D00U17. [Google Scholar] [CrossRef]
- Harvey, N.J.; Dacre, H.F. Spatial evaluation of volcanic ash forecasts using satellite observations. Atmos. Chem. Phys. 2016, 16, 861–872. [Google Scholar] [CrossRef]
- Maryon, R.H.; Ryall, D.B.; Malcolm, A.L. The NAME 4 dispersion model: Science documentation. In Turbulence and Diffusion Note No 262; Met Office: Exeter, UK, 1999. [Google Scholar]
- Krumbein, W.C. The use of quartile measures in describing and comparing sediments. Am. J. Sci. 1936, 32, 98–111. [Google Scholar] [CrossRef]
- Lawrence, B.N.; Bennett, V.L.; Churchill, J.; Juckes, M.; Kershaw, P.; Pascoe, S.; Pepler, S.; Pritchard, M.; Stephens, A. Storing and manipulating environmental big data with JASMIN. In Proceedings of the 2013 IEEE International Conference on Big Data, Silicon Valley, CA, USA, 6–9 October 2013; pp. 68–75. [Google Scholar]
- Thomson, D.J.; Jones, A.R.; Devenish, B.J.; Hort, M.C.; Webster, H.N.; Muller, E.; Meneguz, E.; Beckett, F.M.; Hugget, L.; Selvaratnam, V. Input. NAME Technical Specification Document B01; Met Office: Exeter, UK, 2018.
- Jones, A. Using NWP data in NAME: A practical guide. In NAME Technical Specification Document A03; Met Office: Exeter, UK, 2018. [Google Scholar]
- Devenish, B.J. Using simple plume models to refine the source mass flux of volcanic eruptions according to atmospheric conditions. J. Volcanol. Geotherm. Res. 2013, 256, 118–127. [Google Scholar] [CrossRef]
- Webster, H.N.; Devenish, B.J.; Mastin, L.G.; Thomson, D.J.; Van Eaton, A.R. Operational modelling of umbrella cloud growth in a Lagrangian volcanic ash transport and dispersion model. Atmosphere. 2020, 11, 200. [Google Scholar] [CrossRef]
- Webster, H.N.; Thomson, D.J.; Johnson, B.T.; Heard, I.P.C.; Turnbull, K.; Marenco, F.; Kristiansen, N.I.; Dorsey, J.; Minikin, A.; Weinzierl, B.; et al. Operational prediction of ash concentrations in the distal volcanic cloud from the 2010 Eyjafjallajökull eruption. J. Geophys. Res. Atmos. 2012, 117. [Google Scholar] [CrossRef]
- Leadbetter, S.J.; Hort, M.C.; Jones, A.R.; Webster, H.N.; Draxler, R.R. Sensitivity of the modelled deposition of Caesium-137 from the Fukushima Dai-ichi nuclear power plant to the wet deposition parameterisation in NAME. J. Environ. Radioact. 2015, 139, 200–211. [Google Scholar] [CrossRef] [PubMed]
- Houghton, B.F.; Carey, R.J. Physical constraints for effective magma-water interaction along volcanic conduits during silicic explosive eruptions: Comment. Geology 2019, 47, e461. [Google Scholar] [CrossRef]
- Tsunematsu, K.; Bonadonna, C. Grain-size features of two large eruptions from Cotopaxi volcano (Ecuador) and implications for the calculation of the total grain-size distribution. Bull. Volcanol. 2015, 77. [Google Scholar] [CrossRef]
- Fierstein, J.; Nathenson, M. Another look at the calculation of fallout tephra volumes. Bull. Volcanol. 1992, 54, 156–167. [Google Scholar] [CrossRef]
- Pardini, F.; Spanu, A.; De’ Michieli Vitturi, M.; Salvetti, M.V.; Neri, A. Grain size distribution uncertainty quantification in volcanic ash dispersal and deposition from weak plumes. J. Geophys. Res. Solid Earth 2016, 121, 538–557. [Google Scholar] [CrossRef]
- Poret, M.; Costa, A.; Andronico, D.; Scollo, S.; Gouhier, M.; Cristaldi, A. Modeling eruption source parameters by integrating field, ground-based, and satellite-based measurements: The case of the 23 February 2013 Etna paroxysm. J. Geophys. Res. Solid Earth 2018, 123, 5427–5450. [Google Scholar] [CrossRef]
- Dioguardi, F.; Mele, D.; Dellino, P. A new one-equation model of fluid drag for irregularly shaped particles valid over a wide range of Reynolds number. J. Geophys. Res. Solid Earth 2018, 123, 144–156. [Google Scholar]
- Gouhier, M.; Eychenne, J.; Azzaoui, N.; Guillin, A.; Deslandes, M.; Poret, M.; Costa, A.; Husson, P. Low efficiency of large volcanic eruptions in transporting very fine ash into the atmosphere. Sci. Rep. 2019, 9, 1449. [Google Scholar] [CrossRef]
- Scott, W.E.; McGimsey, R.G. Character, mass, distribution, and origin of tephra-fall deposits of the 1989–1990 eruption of Redoubt volcano, south-central Alaska. J. Volcanol. Geotherm. Res. 1994, 62, 251–272. [Google Scholar]
- Engwell, S.; Eychenne, J. Contribution of fine ash to the atmosphere from plumes associated with pyroclastic density currents. In Volcanic Ash: Hazard Observation; Mackie, S., Cashman, K.V., Ricketts, H., Rust, A.C., Watson, M., Eds.; Elsevier: Amsterdam, The Netehrlands, 2016; pp. 67–85. [Google Scholar]
© 2020 by the authors. Licensee MDPI, Basel, Switzerland. This article is an open access article distributed under the terms and conditions of the Creative Commons Attribution (CC BY) license (http://creativecommons.org/licenses/by/4.0/).