Article

Pan Evaporation Estimation in Uttarakhand and Uttar Pradesh States, India: Validity of an Integrative Data Intelligence Model

1
Department of Soil and Water Conservation Engineering, College of Technology, G. B. Pant University of Agriculture and Technology, Pantnagar-263145, Uttarakhand, India
2
Faculty of Science, Agronomy Department, Hydraulics Division University, 20 Août 1955, Route EL HADAIK, 26 Skikda, BP, Algeria
3
Department of Civil Engineering, School of Technology, Ilia State University, Tbilisi 0162, Georgia
4
Institute of Research and Development, Duy Tan University, Da Nang 550000, Vietnam
5
Faculty of Civil Engineering, Duy Tan University, Da Nang 550000, Vietnam
6
Department of Civil Engineering, Science and Research Branch, Islamic Azad University, Tehran, Iran
7
Computer Science Department, College of Computer Science and Information Technology, University of Anbar, Ramadi 31001, Iraq
8
Civil, Environmental and Natural Resources Engineering, Lulea University of Technology, 97187 Lulea, Sweden
9
Sustainable Developments in Civil Engineering Research Group, Faculty of Civil Engineering, Ton Duc Thang University, Ho Chi Minh City, Vietnam
*
Author to whom correspondence should be addressed.
Atmosphere 2020, 11(6), 553; https://doi.org/10.3390/atmos11060553
Submission received: 15 April 2020 / Revised: 21 May 2020 / Accepted: 25 May 2020 / Published: 27 May 2020

Abstract

:
Appropriate input selection for the estimation matrix is essential when modeling non-linear progression. In this study, the feasibility of the Gamma test (GT) was investigated to extract the optimal input combination as the primary modeling step for estimating monthly pan evaporation (EPm). A new artificial intelligent (AI) model called the co-active neuro-fuzzy inference system (CANFIS) was developed for monthly EPm estimation at Pantnagar station (located in Uttarakhand State) and Nagina station (located in Uttar Pradesh State), India. The proposed AI model was trained and tested using different percentages of data points in scenarios one to four. The estimates yielded by the CANFIS model were validated against several well-established predictive AI (multilayer perceptron neural network (MLPNN) and multiple linear regression (MLR)) and empirical (Penman model (PM)) models. Multiple statistical metrics (normalized root mean square error (NRMSE), Nash–Sutcliffe efficiency (NSE), Pearson correlation coefficient (PCC), Willmott index (WI), and relative error (RE)) and graphical interpretation (time variation plot, scatter plot, relative error plot, and Taylor diagram) were performed for the modeling evaluation. The results of appraisal showed that the CANFIS-1 model with six input variables provided better NRMSE (0.1364, 0.0904, 0.0947, and 0.0898), NSE (0.9439, 0.9736, 0.9703, and 0.9799), PCC (0.9790, 0.9872, 0.9877, and 0.9922), and WI (0.9860, 0.9934, 0.9927, and 0.9949) values for Pantnagar station, and NRMSE (0.1543, 0.1719, 0.2067, and 0.1356), NSE (0.9150, 0.8962, 0.8382, and 0.9453), PCC (0.9643, 0.9649, 0.9473, and 0.9762), and WI (0.9794, 0.9761, 0.9632, and 0.9853) values for Nagina stations in all applied modeling scenarios for estimating the monthly EPm. This study also confirmed the supremacy of the proposed integrated GT-CANFIS model under four different scenarios in estimating monthly EPm. The results of the current application demonstrated a reliable modeling methodology for water resource management and sustainability.

1. Introduction

The evaporation process is a crucial parameter in the global hydrological cycle, and is defined as the transformation of water from the liquid phase to water vapor [1]. Evaporation loss has increased significantly during the last few decades, particularly in the semi-arid and arid regions across the globe [2,3]. Therefore, the accurate estimation of evaporation rates is vital for several facets, such as water budgeting, irrigation water management, hydrology, agronomy, and water resource management [4,5,6]. Generally, open water surface evaporation is measured by employing two methods: (i) direct measurement by pan evaporimeters, and (ii) indirect measurement using empirical and semi-empirical equations based on climatic variables [7]. However, the direct measurement of evaporation using pan evaporimeters is prone to several sources of error due to multiple factors, such as animal activity in and around the pan, debris in water, the construction material of the pan, the size of the pan, strong wind circulation, exposure to the pan, and the measurement of water depth in the pan [4,8,9]. Furthermore, the estimation of monthly pan evaporation (EPm) using direct measurement can be a tedious, expensive, and time-consuming task [10]. Therefore, the introduction of robust and reliable intelligent models is a hot topic in the field of hydrology [11].
In nature, the EPm is highly non-linear and non-stationary and associated with several climatic factors (i.e., air temperature, dew point temperature, relative humidity, wind speed, sunshine hours, and solar radiation). Recently, several non-linear hybrid or simple artificial intelligent (AI) models have been employed for modeling various hydrological components [12,13,14,15,16,17,18,19]. Over the past decades, applications of AI models have demonstrated their feasibility as efficient tools for estimating daily and monthly pan evaporation using easily measured climatic variables [20,21,22,23,24,25,26,27]. Another essential development in the computer aid base has been the integration of standalone AI models and nature-inspired optimization algorithms for obtaining more reliable hybrid intelligent models [28,29,30,31].
Qasem et al. [20] applied support vector machine (SVM), multilayer perceptron neural network (MLPNN), wavelet-support vector regression (W-SVR), and wavelet-multilayer perceptron neural network (W-MLPNN) models for estimating the monthly EPm at Tabriz (Iran) and Antalya (Turkey) stations. The results revealed that the MLPNN model outperformed the other models at both stations. Kisi and Heddam [32] investigated the comparative potential of multivariate adaptive regression spline (MARS), M5 Tree, modified Hargreaves–Samani (MHS), Stephens–Stewart (SS), and multiple linear regression (MLR) models for modeling the monthly EPm using only Tmax and Tmin data of three hydrometeorological stations in Turkey. The results disclosed that the MARS model achieved a superior prediction accuracy in comparison to the other models. Sebbar et al. [21] employed extreme learning machine (ELM) with online sequential (ELM_OS) and optimal pruned (ELM_OP) techniques to predict the monthly EPm at Ain Dalia and Zit Emba stations located in Algeria. The obtained results indicated the high prediction accuracy of the ELM_OS model in comparison to the ELM_OP model. Majhi et al. [22] evaluated the ability of deep long short-term memory cell (Deep-LSTM) and MLPNN models for modeling the daily pan evaporation in India. The compared results evidenced the capacity of the Deep-LSTM model performance in comparison to that of the MLPNN model. Lu et al. [23] estimated the daily evaporation over multiple regions in China using M5 Tree, random forest (RF), and gradient boosting decision tree (GBDT) models. They found that the GBDT model outperformed the other models.
Shiri [33] used the neuro-fuzzy system (NF) and neural network (NN) models to simulate the daily pan evaporation at four meteorological stations situated in the USA and found that the proposed NF and NN models have a good ability in simulating the daily pan evaporation. Feng et al. [29] estimated the monthly EPm in different climates of China using extreme learning machine (ELM), artificial neural network embedded with particle swarm optimization (PSO-ANN), genetic algorithm (GA-ANN), and Stephens–Stewart (SS) models. The results of the modeling comparison demonstrated that the ELM, PSO-ANN, and GA-ANN models provided better estimates than the SS model. Furthermore, several advanced models have been developed for modeling multiple scales of the pan evaporation process across the globe [28,34,35,36,37,38,39,40,41,42]. In accordance with the literature, the exploration of new versions of AI models is still an ongoing research area. Therefore, the current research investigated the potential of a newly explored AI model (i.e., the co-active neuro-fuzzy inference system (CANFIS)), as a widespread approximator for any non-linear occupation. The foremost excellence of the CANFIS model is evidenced by pattern-dependent coefficients (weights) among the consequent and premise layers [43]. Although there have been several studies focused on establishing a robust and reliable predictive model, few have focused on improving the models’ accuracy. The current research can contribute to prediction performance improvement based on the incorporation of the best selection of input variables. The implementation of the CANFIS model was advanced by integrating a non-linear input selection approach called the Gamma test (GT), in order to identify the input attributes correlating to the targeted predicted variable.
To date, few studies have investigated the appropriate input variables for constructing an integrative AI predictive model for evaporation estimation. Therefore, to solve this problem, a non-linear modeling and analysis tool, i.e., GT proposed by Stefánsson et al. [44], was used to identify the appropriate input variables. Recently, a number of applications on GT’s capacity have been produced in diverse hydrological fields [35,45,46,47,48,49].
As per the authors’ information, preceding studies have not stated the utility of an integrated GT approach with the CANFIS model for estimating the monthly pan evaporation process in two different climates. The potential of the proposed model was validated against MLPNN, MLR, and Penman model (PM) models in four different scenarios based on several statistical indicators and graphical inspection. The predictive models developed were examined for historical climatological data collected from Pantnagar and Nagina stations, located in India.

2. Case Study and Data Description

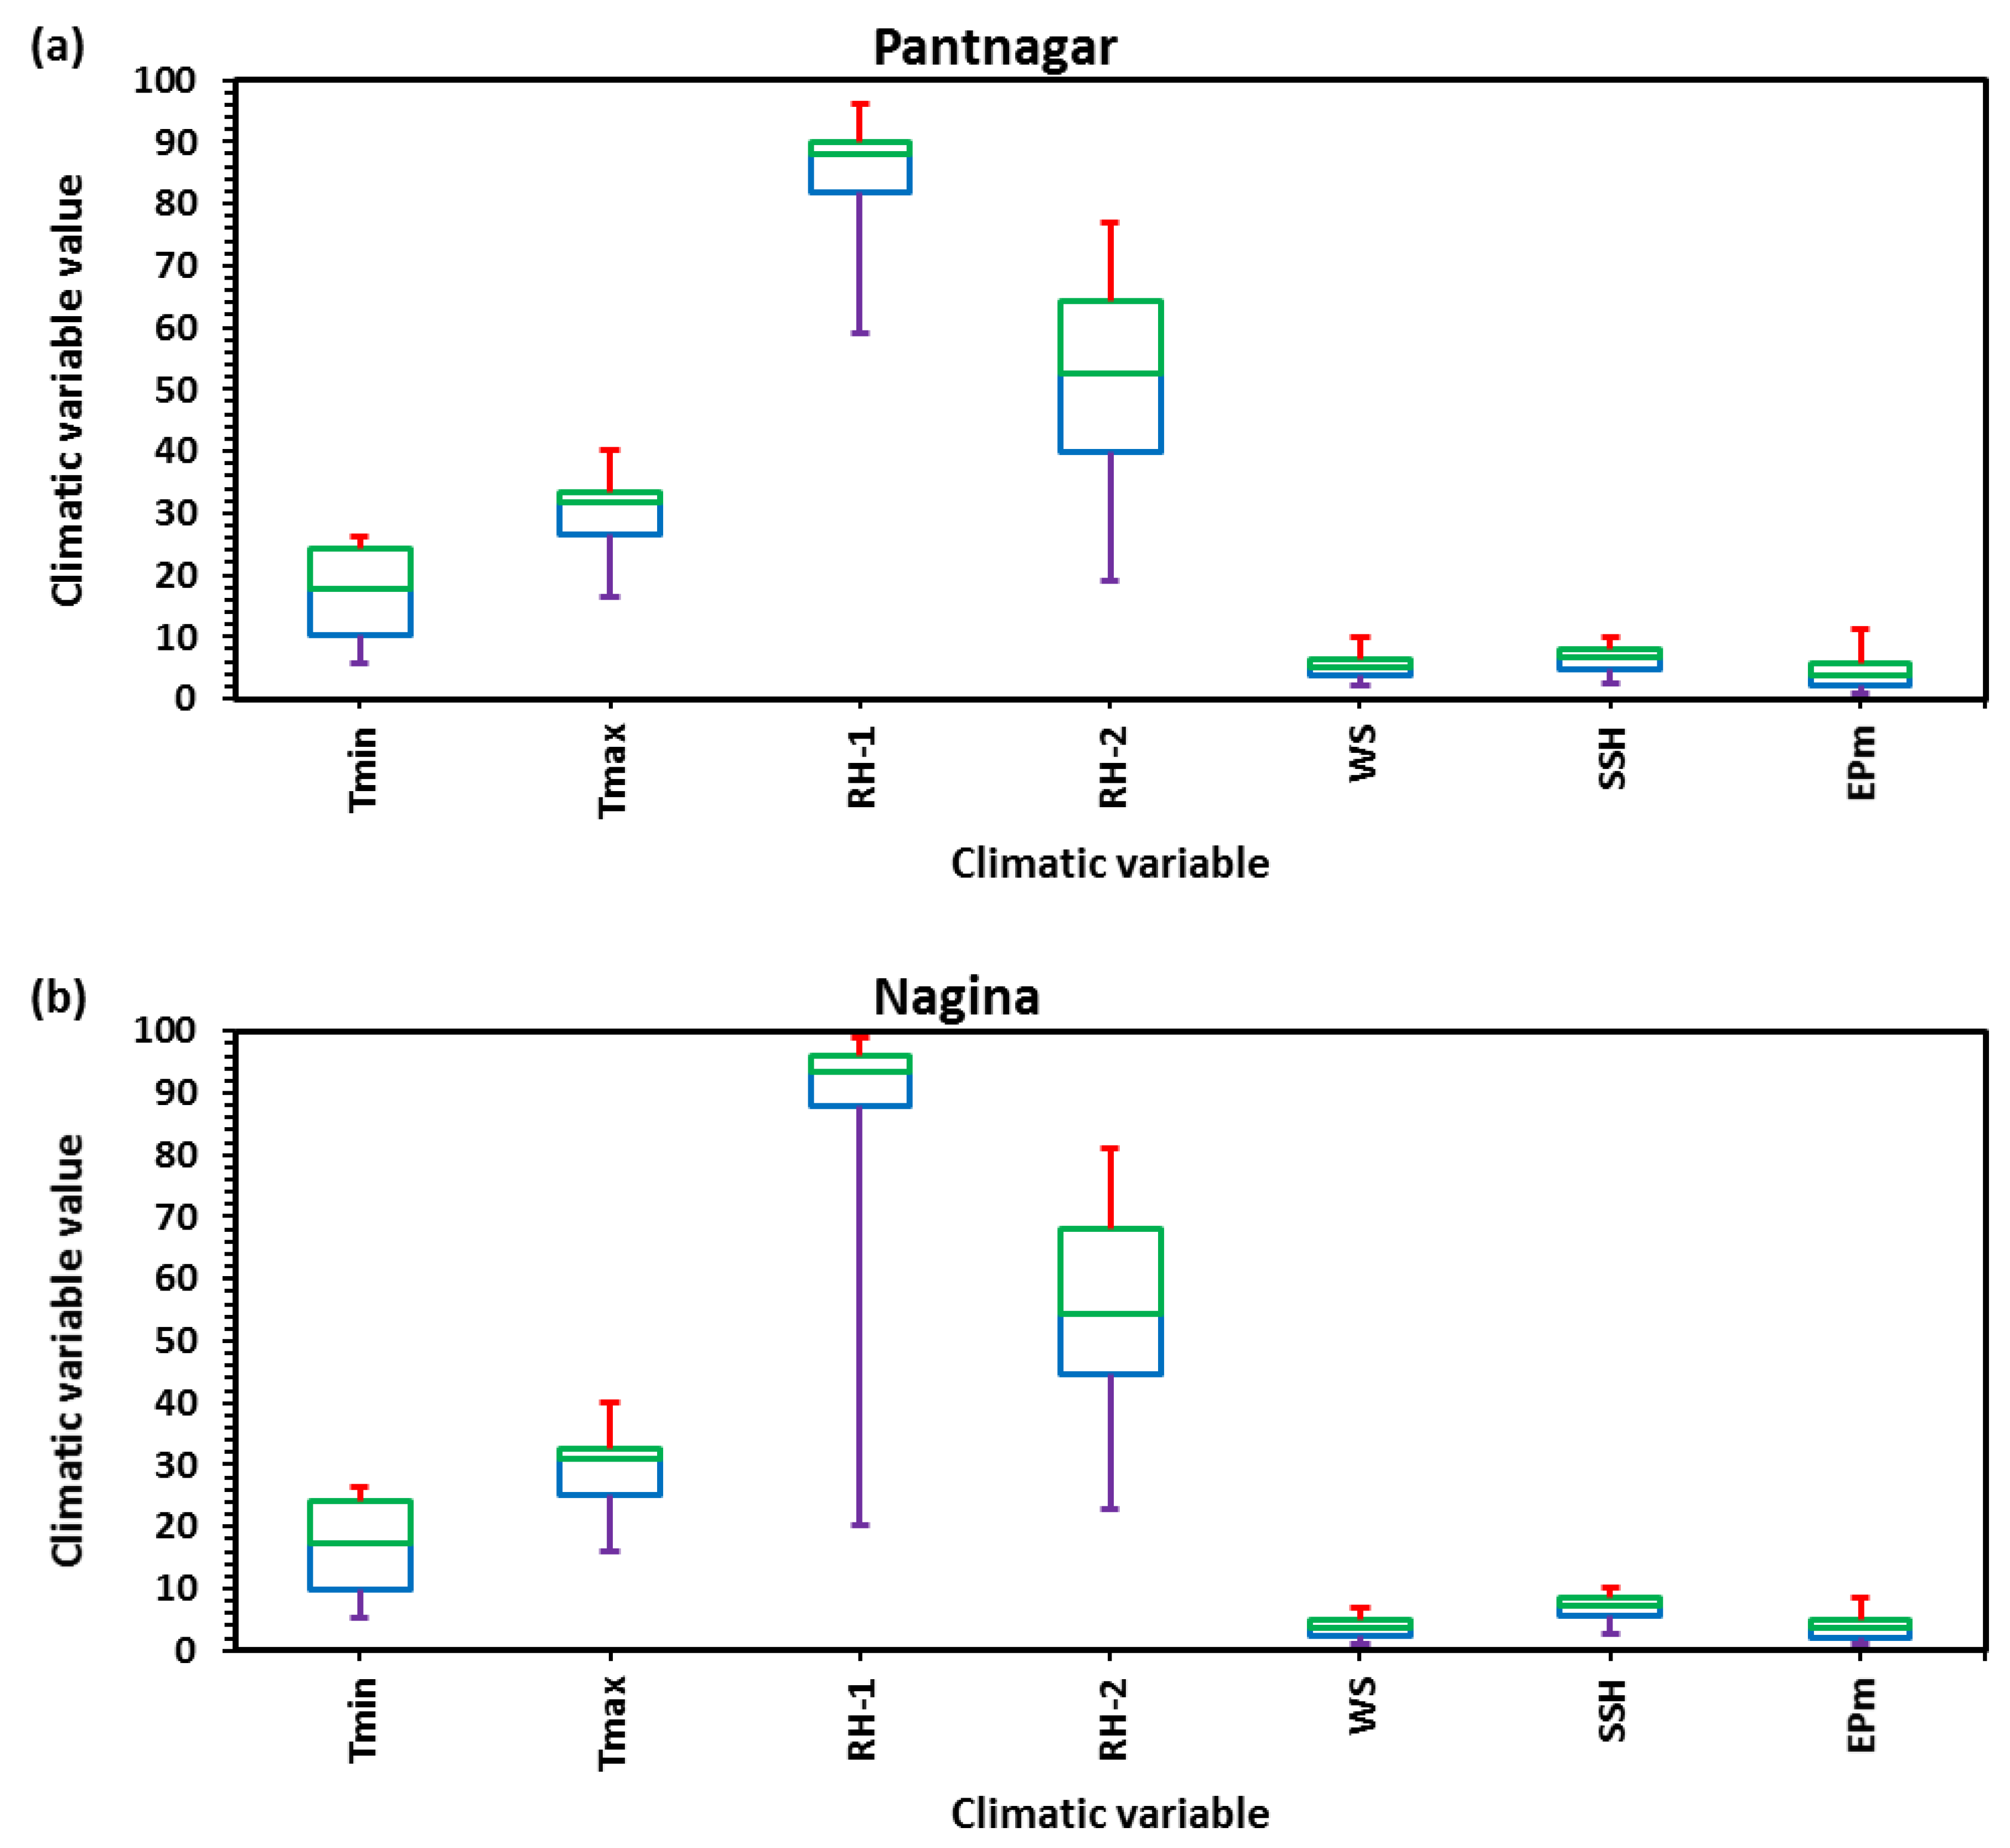
Two different meteorological stations (i.e., Pantnagar and Nagina) located in Uttarakhand and Uttar Pradesh states, respectively, were used to build the modeling procedure. Figure 1 demonstrates the coordinates of the study stations (Pantnagar: 79°38′0″ E longitude and 29°0′0″ N latitude with 243.8 m above mean sea level (MSL), and Nagina: 78°25′58.8″ E longitude and 29°26′34.8″ N latitude with 282 m above MSL). The climatic information including the maximum and minimum air temperatures (Tmax and Tmin), wind speed (WS), relative humidity at 7:00 a.m. (RH-1) and 2:00 p.m. (RH-2), bright sunshine hours (SSH), and monthly pan evaporation (EPm) were obtained from observatories located at the Pantnagar Crop Research Centre (PCRC), Uttarakhand, and Rice Research Station Nagina, Bijnor district in Uttar Pradesh State, India. Figure 2a,b illustrates the climatic parameters measured from January 2009 to December 2016 (eight year period) at both stations using a box and whisker plot, which presents statistics on the minimum value, first quartile, median, third quartile, and maximum value for climatic parameters (reading from lower to upper values). Additionally, Table 1 reports the brief statistical properties of climatic variables intended for both stations. The statistical characteristics reveal the platykurtic (−) and leptokurtic (+) nature of the climatic variables at both stations. Table 2 shows the correlations between the monthly EPm and other climatic variables for both stations. It can be observed from Table 2 that all of the six variables (Tmin, Tmax, RH-1, RH-2, WS, and SSH) have significant correlations with the EPm at a 5% significance level.

3. Methodology

3.1. Gamma Test (GT)

When modeling non-linear hydrological/environmental processes, selecting the optimal input parameters is tedious and time-consuming. To solve this problem, GT (a non-linear tool) has been used widely in several fields [35,45,47,49,50,51,52,53,54]. Conceptually, GT estimates the minimum standard error for each investigated input/output variable through Equation (1) [55]:
y = A δ + Γ
where y is the output vector, A is the gradient, and gamma (Γ) is the intercept on the vertical axis ( δ = 0). If the values of Γ, A, standard error (SE), and Vratio approach the minimum, it indicates the goodness of input variables [47,56]. The Vratio is computed using the following expression:
V r a t i o = Γ σ 2 ( y )
where, σ 2 ( y ) is the variance of the output y and Γ is the gamma function. In this research, the CANFIS, MLPNN, and MLR techniques were employed for designating the optimal group of input variables (decided through the lowest value of A, SE, Vratio, and Γ), to estimate the monthly EPm at Pantnagar and Nagina stations.

3.2. Co-Active Neuro-Fuzzy Inference System (CANFIS) Model

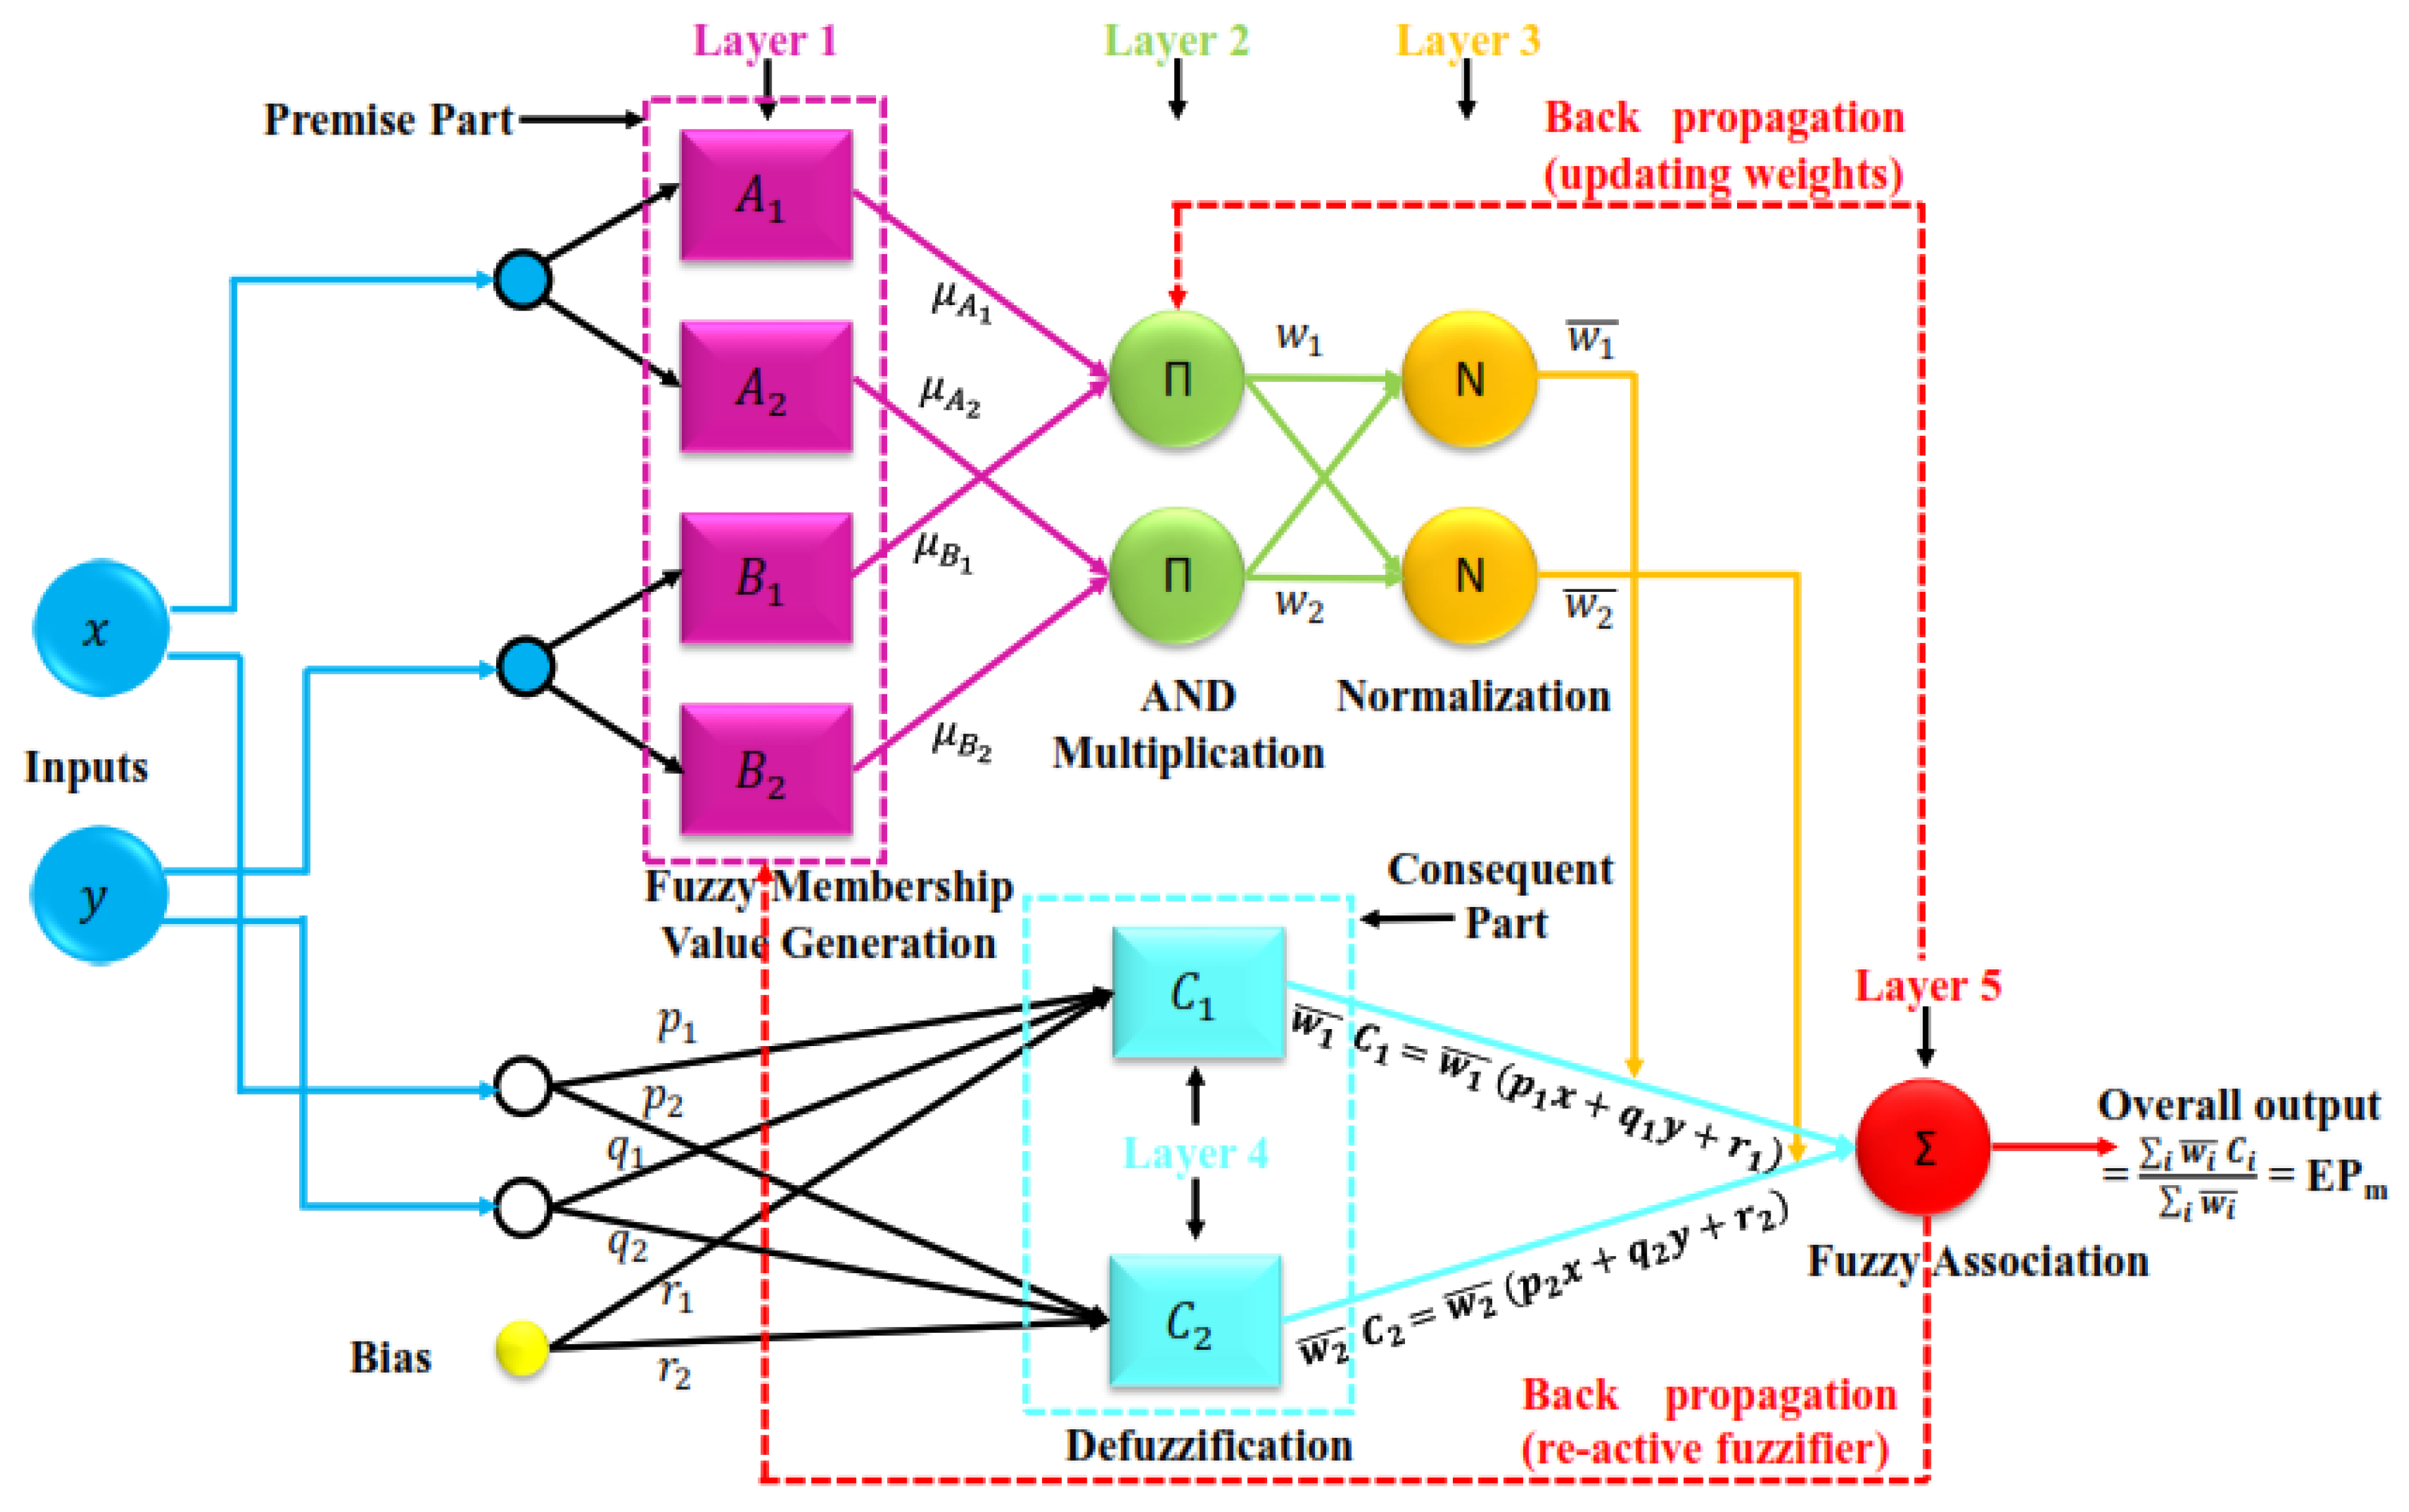
The CANFIS model is a hybrid AI model that was introduced by Jang et al. [57]. The hierarchy network of the CANFIS structure is composed of five layers: (i) fuzzification layer (categorization of inputs by applying certain membership functions), (ii) fuzzy rule layer (multiplication concept is applied), (iii) normalization layer (normalize the output of the previous layer using the activation function), (iv) defuzzification layer (de-fuzzified the output of the previous layer by applying the learning algorithm), and (v) summation layer (obtain final results as a crisp output). Figure 3 demonstrates the working architecture of the CANFIS model. More details on the working function of each layer are provided in [8,43].
In this research, through supervised learning, the network of the CANFIS model was designed with a trial and error procedure using two Gaussian and Bell membership functions, the hyperbolic tangent activation function (with a range from −1 to 1), the Sugeno fuzzy inference system, and the delta-bar-delta (DBD) learning algorithm. The CANFIS model was trained and terminated after 1000 iterations over the 0.001 threshold level in NeuroSolutions 5.0 software produced by the NeuroDimension, Inc., Gainesville, FL, USA.

3.3. Multilayer Perceptron Neural Network (MLPNN) Model

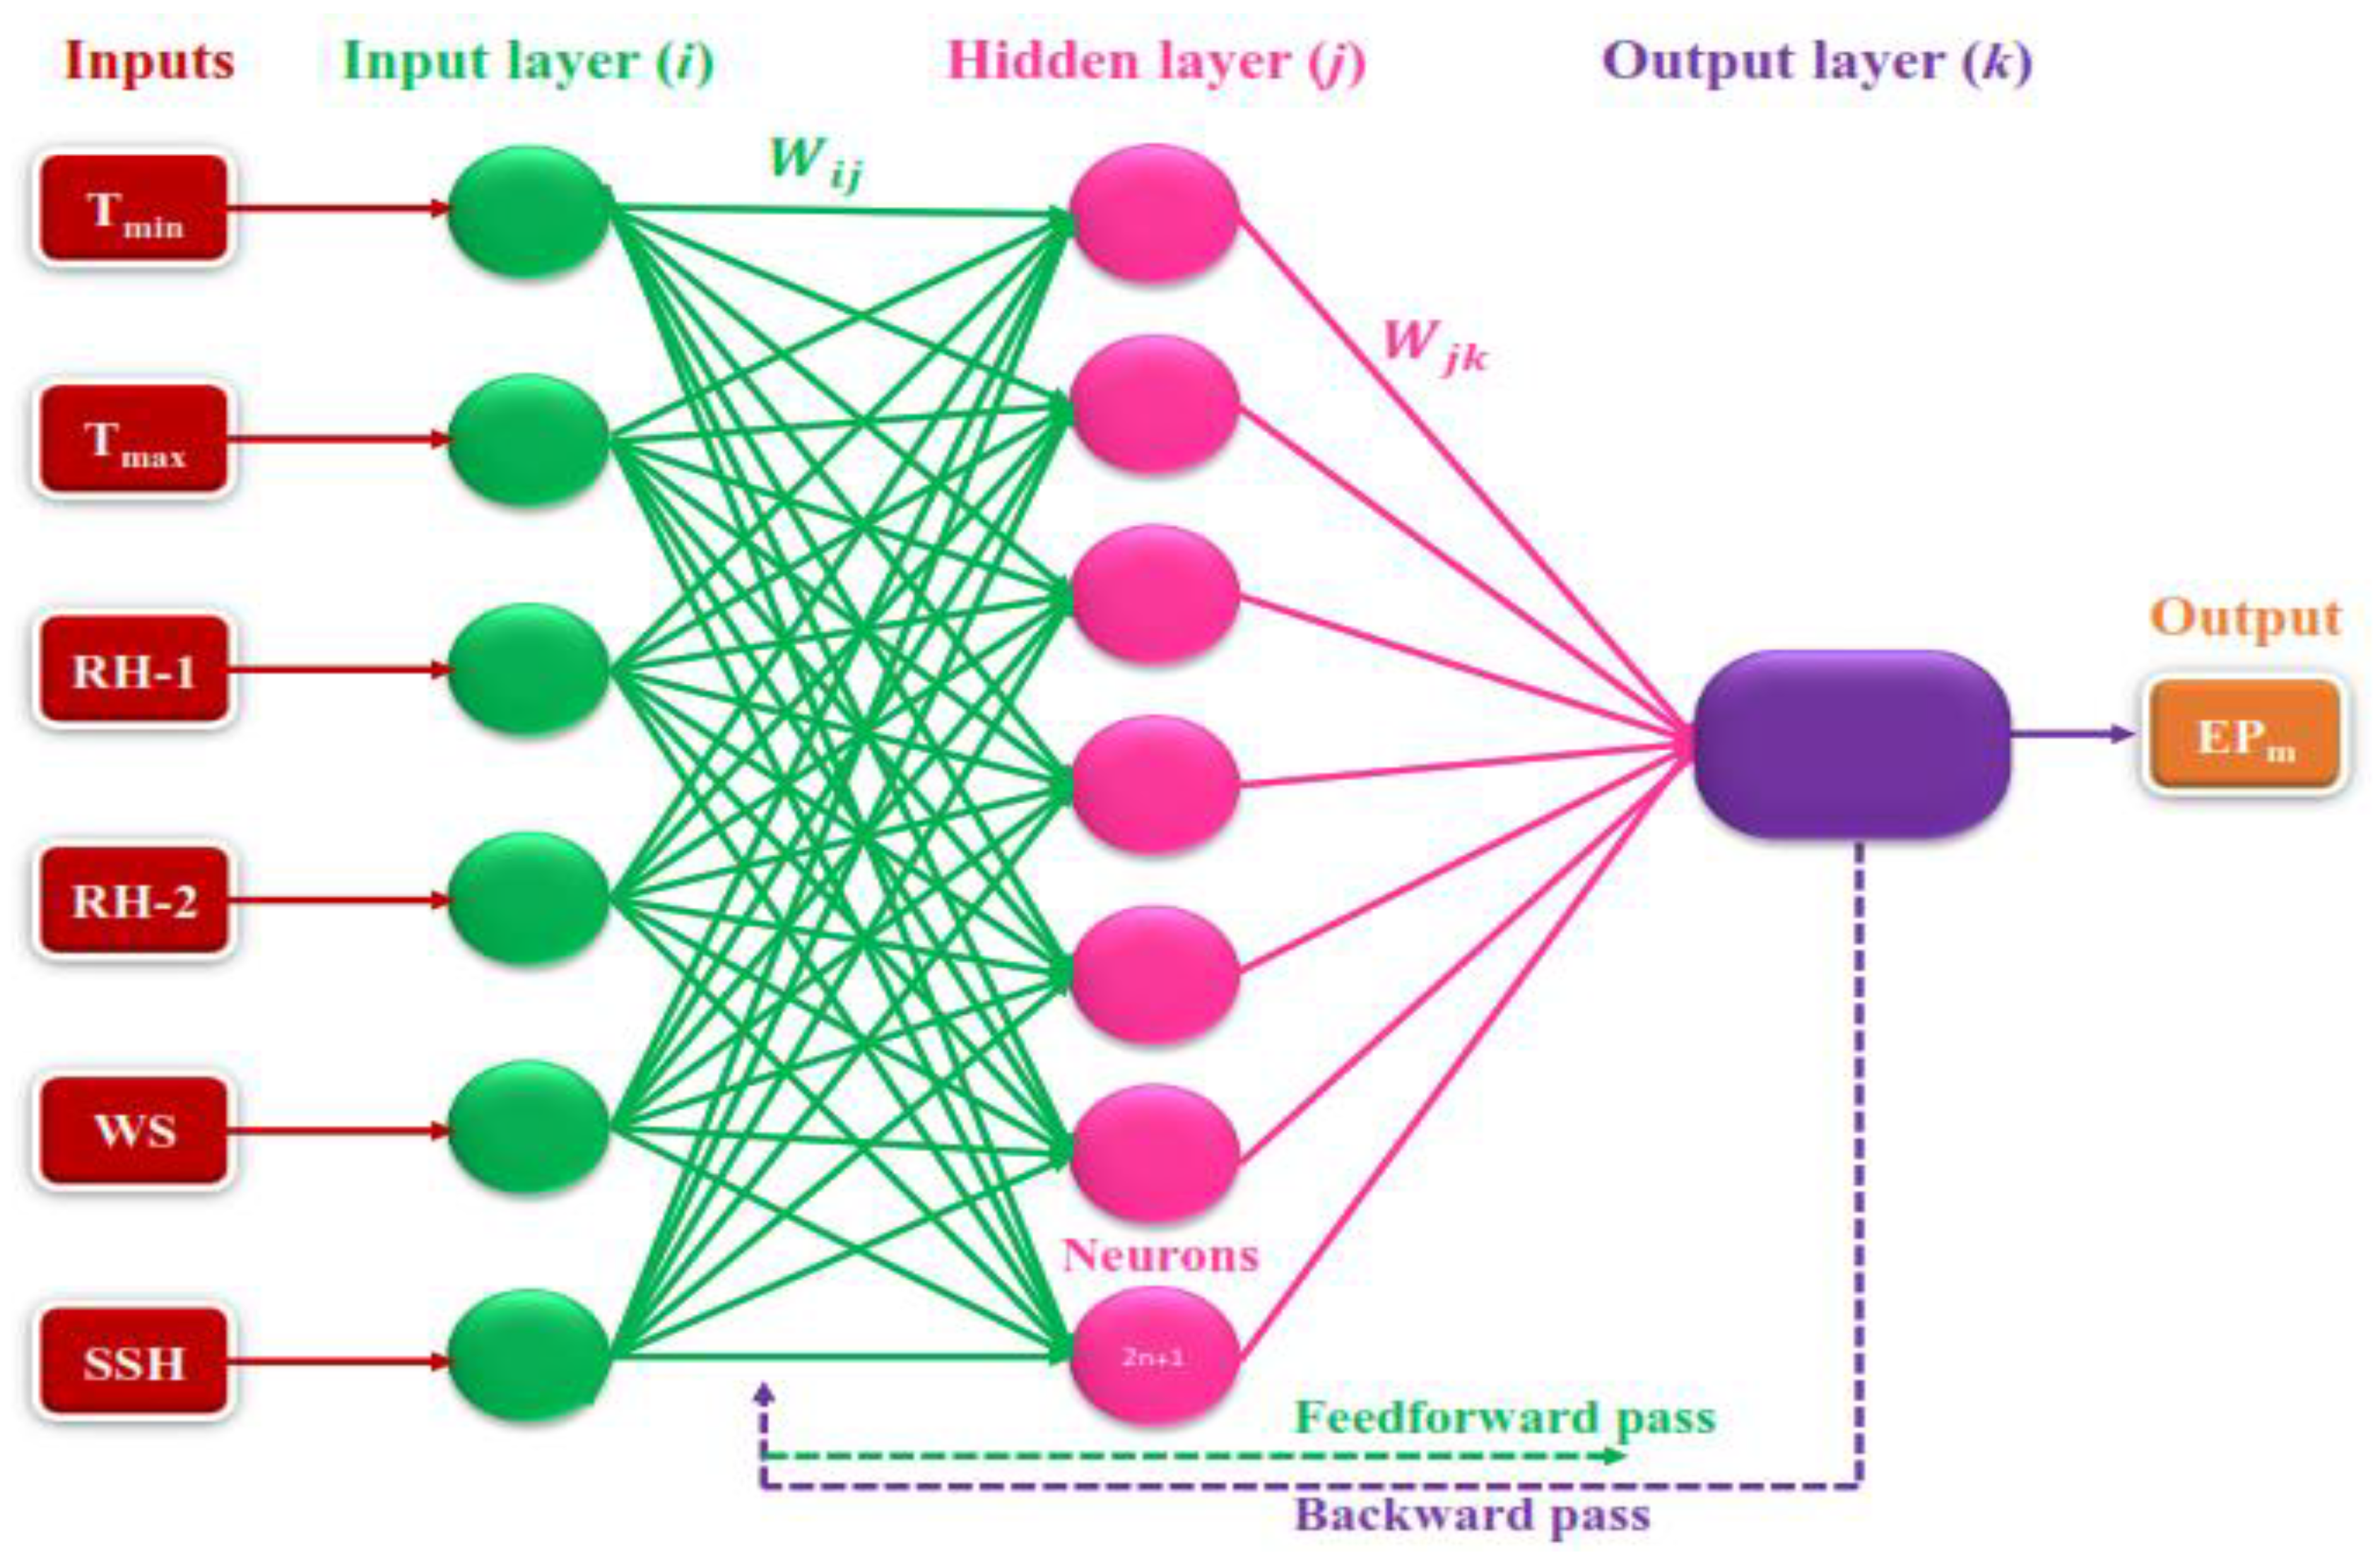
The main concept of the MLPNN model was introduced by Haykin [58]. MLPNN consists of parallel processing elements called neurons. Figure 4 illustrates the structure of the feed-forward MLPNN model, which consists of three layers—an input layer (i), hidden layer (j), and output layer (k)—with interconnected weights between the layers (Wij and Wjk). The appropriate weights are adjusted to minimize the error between the observed and predicted output through back propagation encountered from right to left, as depicted in Figure 4.
The structure of the MLNN model was designed through the knowledge process by a trial and error procedure in this study. The network was made up of three (input, hidden, and output) layers with a single output (i.e., EPm). Data normalization was conducted with the hyperbolic-tangent (tanh) activation function (ranges from −1 to 1). As recommended by previous studies, the maximum number of neurons contained in the hidden layer was projected through the 2n + 1 idea, where n is the number of input variables [59]. Training of the MLPNN model was terminated over a 0.001 threshold value after 1000 epochs in NeuroSolutions 5.0 software. The framework of the MLPNN model designed in this study was built to incorporate all of the six input climate variables collected.

3.4. Multiple Linear Regression (MLR) Model

For a general comparison and validation, following several established research studies in the literature, the MLR model was employed. Conceptually, MLR is a statistical approach that uses the collinearity among the targeted variables and the independent variables [60]. Mathematically, the regression equation of MLR is written as
Y = β 0 + β 1 X 1 + β 2 X 2 + ,   , + β k X n ,
where, Y is the target variable; X1, X2, …… Xn are the independent variables; and β 0 ,   β 1 ,   β 2 ……… β k are the regression coefficients.

3.5. Penman Model (PM)

Penman [61] developed an empirical model for computing the rate of evaporation using climatic parameters, expressed as
E P = Δ R n + γ E a Δ + γ
where EP is the rate of evaporation (mm/month), R n represents the net radiation (MJ/m2/month), Δ is the slope of the saturation vapor pressure–air temperature curve (kPa/°C), γ indicates the psychrometric constant (kPa/°C), and E a is the aerodynamic function (mm/month) and computed using Equation (5):
E a = f ( u ) × ( e s e a ) ,
where, e s is the saturation vapor pressure (kPa), e a is the actual vapor pressure, and f(u) represents an empirical or theoretically-derived aerodynamic wind function, which can be calculated using Equation (6):
f ( u ) = 0.263 ( a w b w u s ) ,
where, u s is the wind speed (m/s) at a 2 m elevation, and a w and b w are empirical coefficients. Penman [62] suggested 0.5 and 0.537 values for a w and b w for open water bodies.
In this study, the R n , Δ , γ , e s and e a parameters were calculated by adopting the procedure provided by Allen et al. [63] in the Food and Agriculture Organization of manual 56 (FAO-56).

3.6. Modeling Scenarios

In this research, the monthly pan evaporation at Pantnagar and Nagina stations was estimated using the CANFIS, MLPNN, and MLR techniques for four different scenarios. The total available climatic datasets from January 2009–December 2016 (period of eight years) of both stations were split into four scenarios, with different percentages of training (calibration) and testing (validation) datasets. The details of the training and testing data percentages in the four scenarios are as follows:
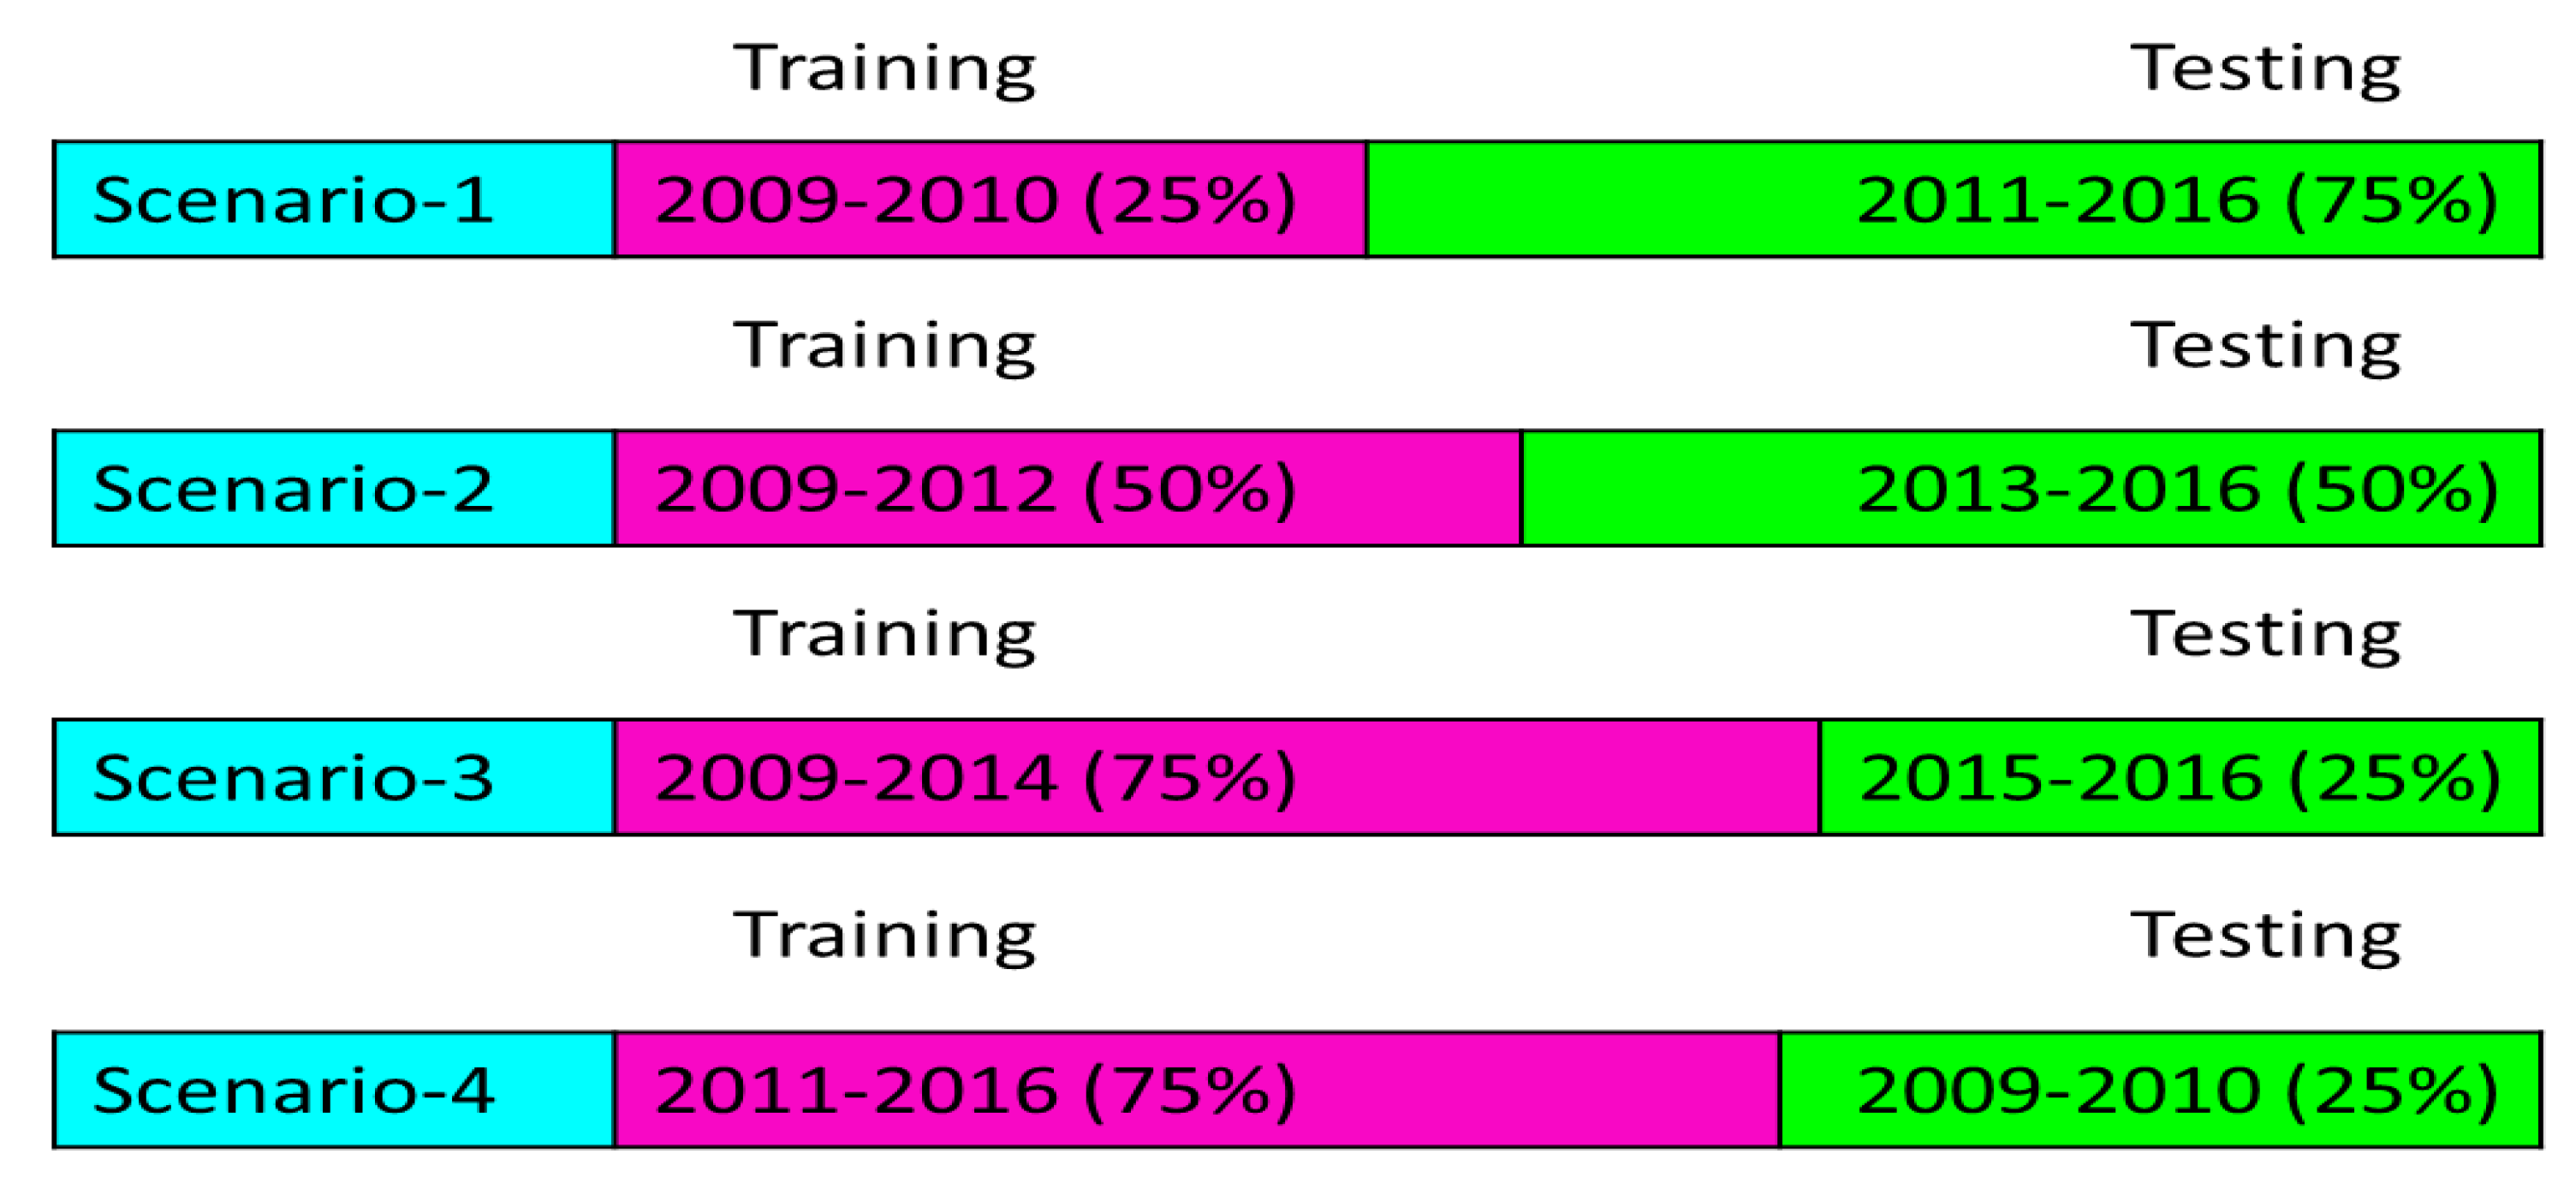
  • Scenario-1 contains 25% data for training (January 2009 to December 2010) and 75% data for testing (January 2011 to December 2016).
  • Scenario-2 contains 50% data for training (January 2009 to December 2012) and 50% data for testing (January 2013 to December 2016).
  • Scenario-3 contains 75% data for training (January 2009 to December 2014) and 25% data for testing (January 2015 to December 2016).
  • Scenario-4 contains 75% data for training (January 2011 to December 2016) and 25% data for testing (January 2009 to December 2010).
The first three modeling scenarios, data was divided into training and testing phases continuously. Whereas, the fourth modeling scenario testing phase data was selected somewhere in the middle of the data span in order to test the applicability of the applied predictive models for the reverse prediction mechanism. Figure 5 illustrates the percentage of training and testing datasets in the four different scenarios used in this study for monthly EPm estimation at the two study locations.

3.7. Performance Appraisal Indicators

The outcomes of the applied models, i.e., CANFIS, MLPNN, MLR, and PM models, were assessed for four different scenarios using the normalized root mean square error (NRMSE), Nash–Sutcliffe efficiency (NSE), Pearson correlation coefficient (PCC), Willmott index (WI), and relative error (RE), and graphical interpretation employing a time variation plot, scatter plot, and Taylor diagram [64]. The performance indicators are described as follows:
  • Normalized root mean square error [65,66,67]:
    N R M S E = 1 N   i = 1 N ( X o b s , i     Y e s t , i ) 2 X o b s   ¯
  • Nash–Sutcliffe efficiency [68,69]:
    N S E = 1 [ i = 1 N ( X o b s , i     Y e s t , i ) 2 i = 1 N ( X o b s , i     X o b s ¯ ) 2 ] ;
  • Pearson correlation coefficient [54,56,70]:
    P C C = i = 1 N ( X o b s , i     X o b s ¯ )     ( Y e s t , i     Y e s t ¯ )   i = 1 N ( X o b s , i     X o b s ¯ ) 2     i = 1 N ( Y e s t , i     Y e s t ¯ ) 2
  • Willmott index [71,72]:
    W I = 1 [ i = 1 N ( Y e s t , i     X o b s , i ) 2 i = 1 N ( | Y e s t , i     X o b s ¯ | + | X o b s , i     X o b s ¯ | ) 2 ] ;
  • Relative error [66,73]:
    R E = ( X o b s , i     Y e s t , i ) ( X o b s , i )   ×   100 ,
    where, Y e s t and X o b s are the estimated and observed monthly EPm values for the ith dataset, respectively; X o b s ¯ and Y e s t ¯ are the mean observed and estimated monthly EPm values for ith dataset, respectively; and N is the number of observations.

4. Application Results and Analysis

4.1. Optimal Input Variable Selection Using GT

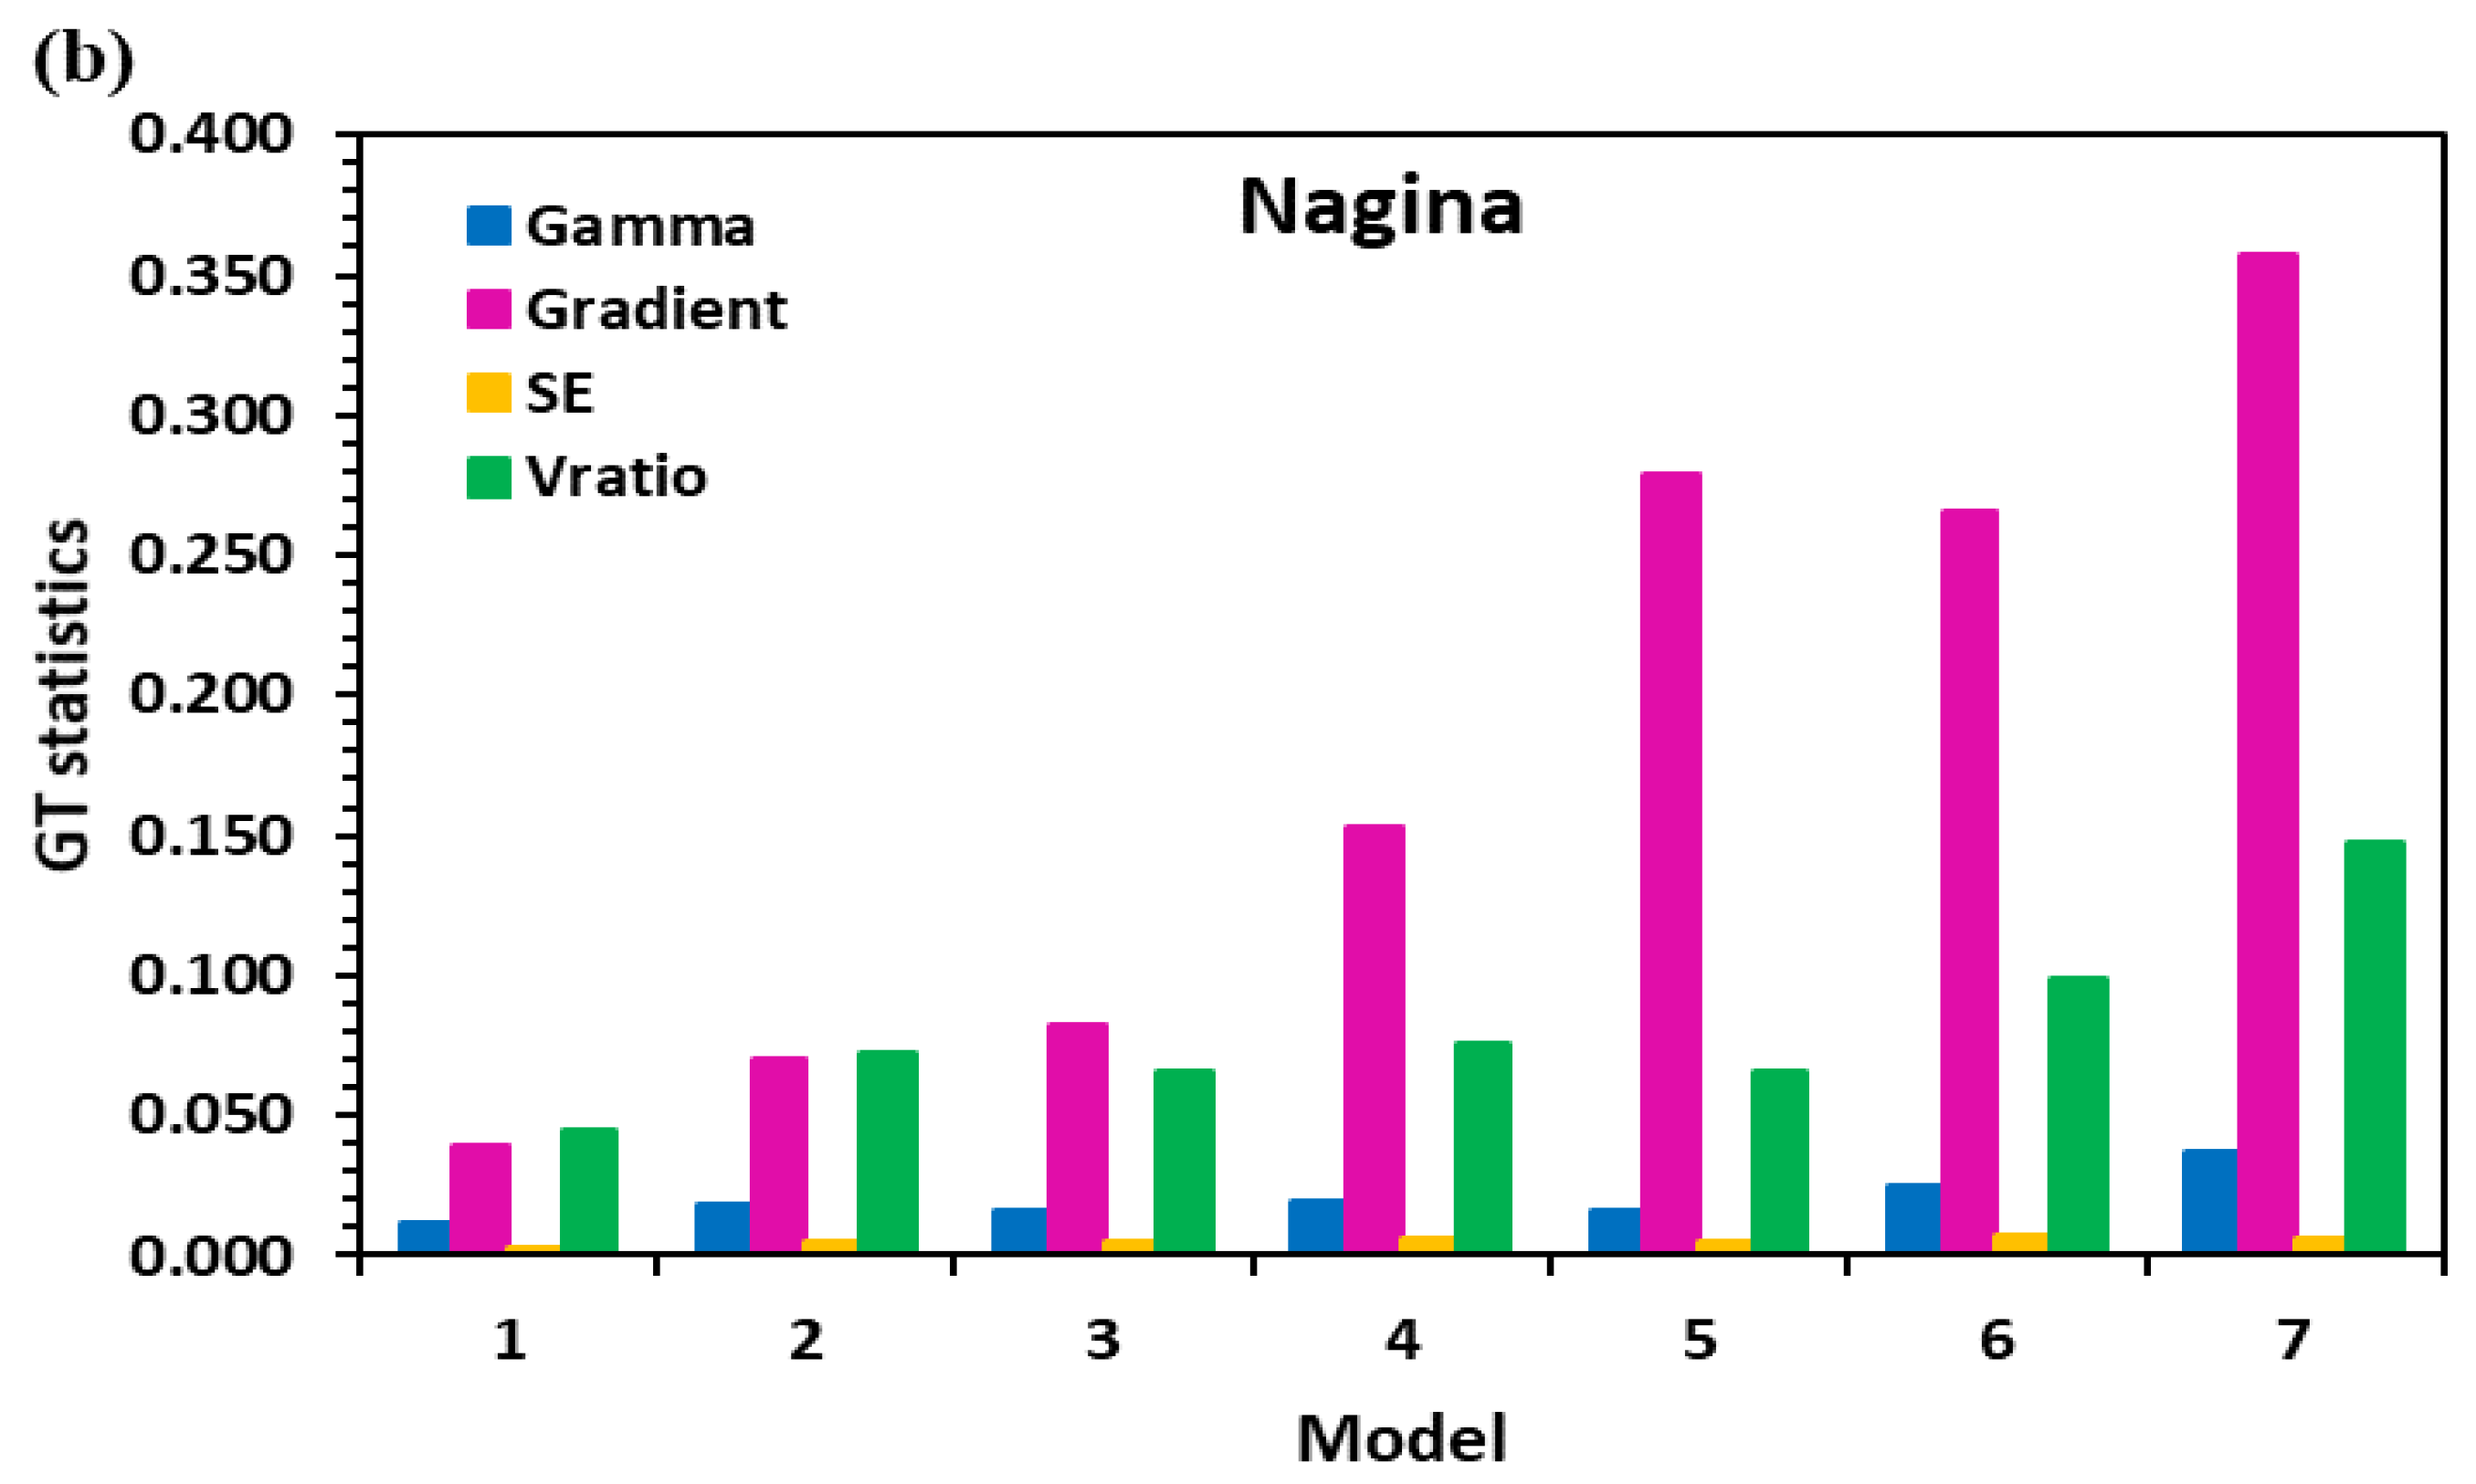
The capacity of AI models relies on several modeling adjustments. The selection of appropriate input parameters is one of the essential prior steps for the learning process of AI implementation. Hence, the current research investigated the potential of various input combinations that anticipate several climatological parameters which have a positive influence on the EPm at the Pantnagar and Nagina meteorological stations (Table 3). To complete this, the feasibility of the GT approach was adopted to identify the related input combinations that are crucial to building predictive models. The statistical results of GT are reported in Table 4 for both stations. Based on the GT results in Table 4, and with a fixed mask example (111111), the minimum values of Γ = 0.0017, A = 0.0665, SE = 0.0013, and Vratio = 0.0070 were obtained for Pantnagar station (Figure 6a), while the minimum values of Γ = 0.0112, A = 0.0395, SE = 0.0024, and Vratio = 0.0448 were obtained for Nagina station (Figure 6b). The mask demonstrated the incorporation of the six input variables for estimating the EPm. Hence, the following input variables were utilized for EPm estimation (i.e., Tmax, Tmin, RH-1, RH-2, WS, and SSH) at Pantnagar and Nagina stations, respectively. It is worth mentioning that including the WS variable as an input parameter provides a better score compared to the SSH (compare the Gamma scores of Tmax, RH-2, WS and Tmax, RH-2, SSH; or scores of Tmax, WS and Tmax, SSH in Table 4), according to the Gamma test, at both stations. This is in direct agreement with the correlations between WS or SSH and EPm given in Table 2.

4.2. Estimation of EPm under Different Scenarios at Pantnagar Station

The combination of input variables (Tmax, Tmin, RH-1, RH-2, WS, and SSH) was used for training and testing the applied methods (CANFIS, MLPNN, and MLR) under four different scenarios based on the performance evaluation indicators (NRMSE, NSE, PCC, and WI). The values of NRMSE, NSE, PCC, and WI in the four different scenarios in the testing phase are summarized in Table 5, which indicate that in scenario-1, the NRMSE (mm/month) = 0.1364, 0.1404, and 0.1402; NSE = 0.9439, 0.9406, and 0.9408; PCC = 0.9790, 0.9751, and 0.9758; and WI = 0.9860, 0.9857, and 0.9851 for the CANFIS-1, MLPNN-1 (with the structure of 6 inputs-9 processing elements-1 output), and MLR-1 models, respectively. In scenario-2 (Table 5), the NRMSE (mm/month) = 0.0904, 0.0920, and 0.1110; NSE = 0.9736, 0.9726, and 0.9602; PCC = 0.9872, 0.9857, and 0.9818; and WI = 0.9934, 0.9932, and 0.9903 for the CANFIS-1, MLPNN-1 (6-11-1), and MLR-1 models, respectively. Under scenario-3 (Table 5), the NRMSE (mm/month) = 0.0947, 0.0993, and 0.1085; NSE = 0.9703, 0.9674, and 0.9611; PCC = 0.9877, 0.9874, and 0.9831; and WI = 0.9927, 0.9918, and 0.9905 for the CANFIS-1, MLPNN-1 (6-10-1) and MLR-1 models, respectively. In the case of scenario-4 (Table 5), the NRMSE (mm/month) = 0.0898, 0.1021, and 0.1056; NSE = 0.9799, 0.9740, and 0.9721; PCC = 0.9922, 0.9877, and 0.9885; and WI = 0.9949, 0.9934, and 0.9927 for the CANFIS-1, MLPNN-1 (6-9-1), and MLR-1 models, respectively. In order to validate the results of the CANFIS, MLPNN, and MLR models, a comparison with the PM was made for all scenarios. As Table 5 clearly shows, the CANFIS-1 models out-performed the other models in all four scenarios, followed by the MLPNN-1 models. Therefore, the CANFIS-1 models followed the best statistical criteria (i.e., maximum rate of WI, PCC, and NSE, and minimum rate of NRMSE) for the testing period and were selected as the best among the three models. Likewise, the performance of PM was found to be the worst in all scenarios for monthly EPm estimation at the Pantnagar station.
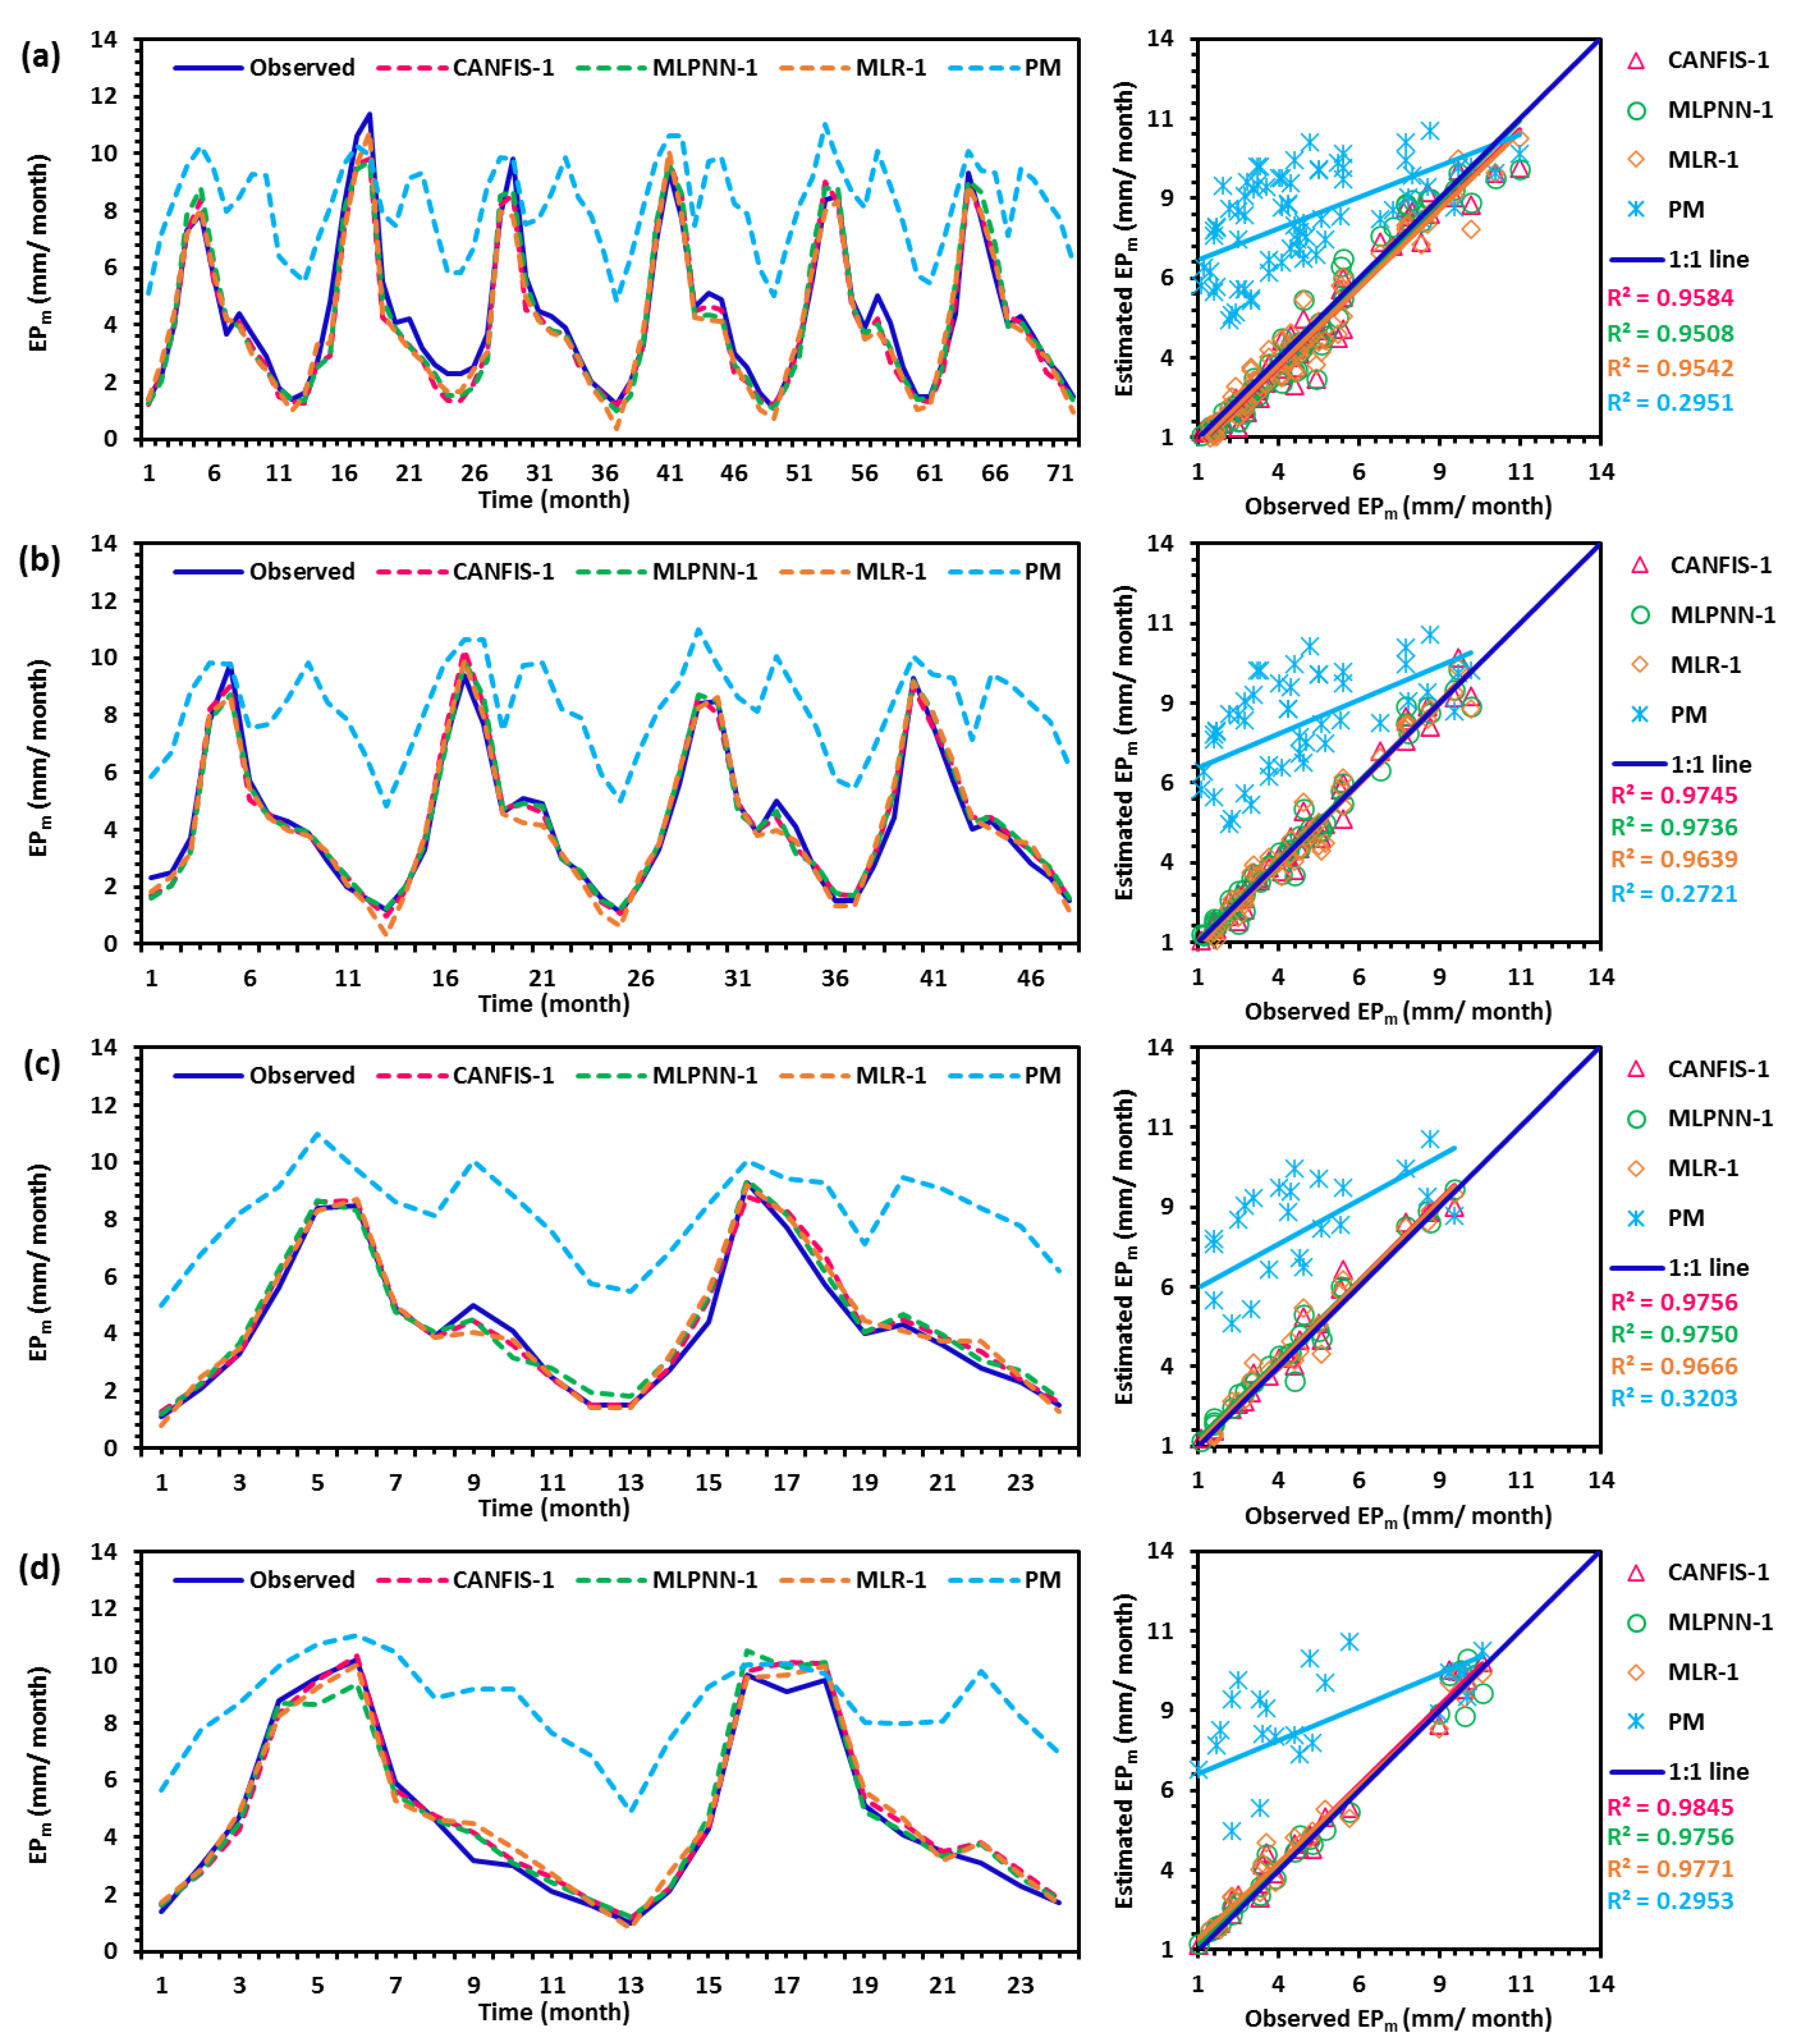
Figure 7a–d depicts the time variation and scatter plots of the observed and estimated monthly EPm values obtained by CANFIS-1, MLPNN-1, MLR-1, and PM models under scenarios one to four during the testing period at Pantnagar. In the scatter plots, the regression line (RL) provides the coefficient of determination (R2) for all four scenarios. In scenario-1, the R2 = 0.9584, 0.9508, 0.9542, and 0.2951; scenario-2, the R2 = 0.9745, 0.9736, 0.9639, and 2721; scenario-3, the R2 = 0.9756, 0.9750, 0.9666, and 3203; and scenario-4, the R2 = 0.9845, 0.9756, 0.9771, and 0.2953, for the CANFIS-1, MLPNN-1, MLR-1, and PM models during the testing phase, respectively. Besides, scenarios one to four demonstrated that the regression line is above the 1:1 line, and this means that the PM model under these scenarios highly overestimated the magnitude of the monthly EPm values at Pantnagar station.
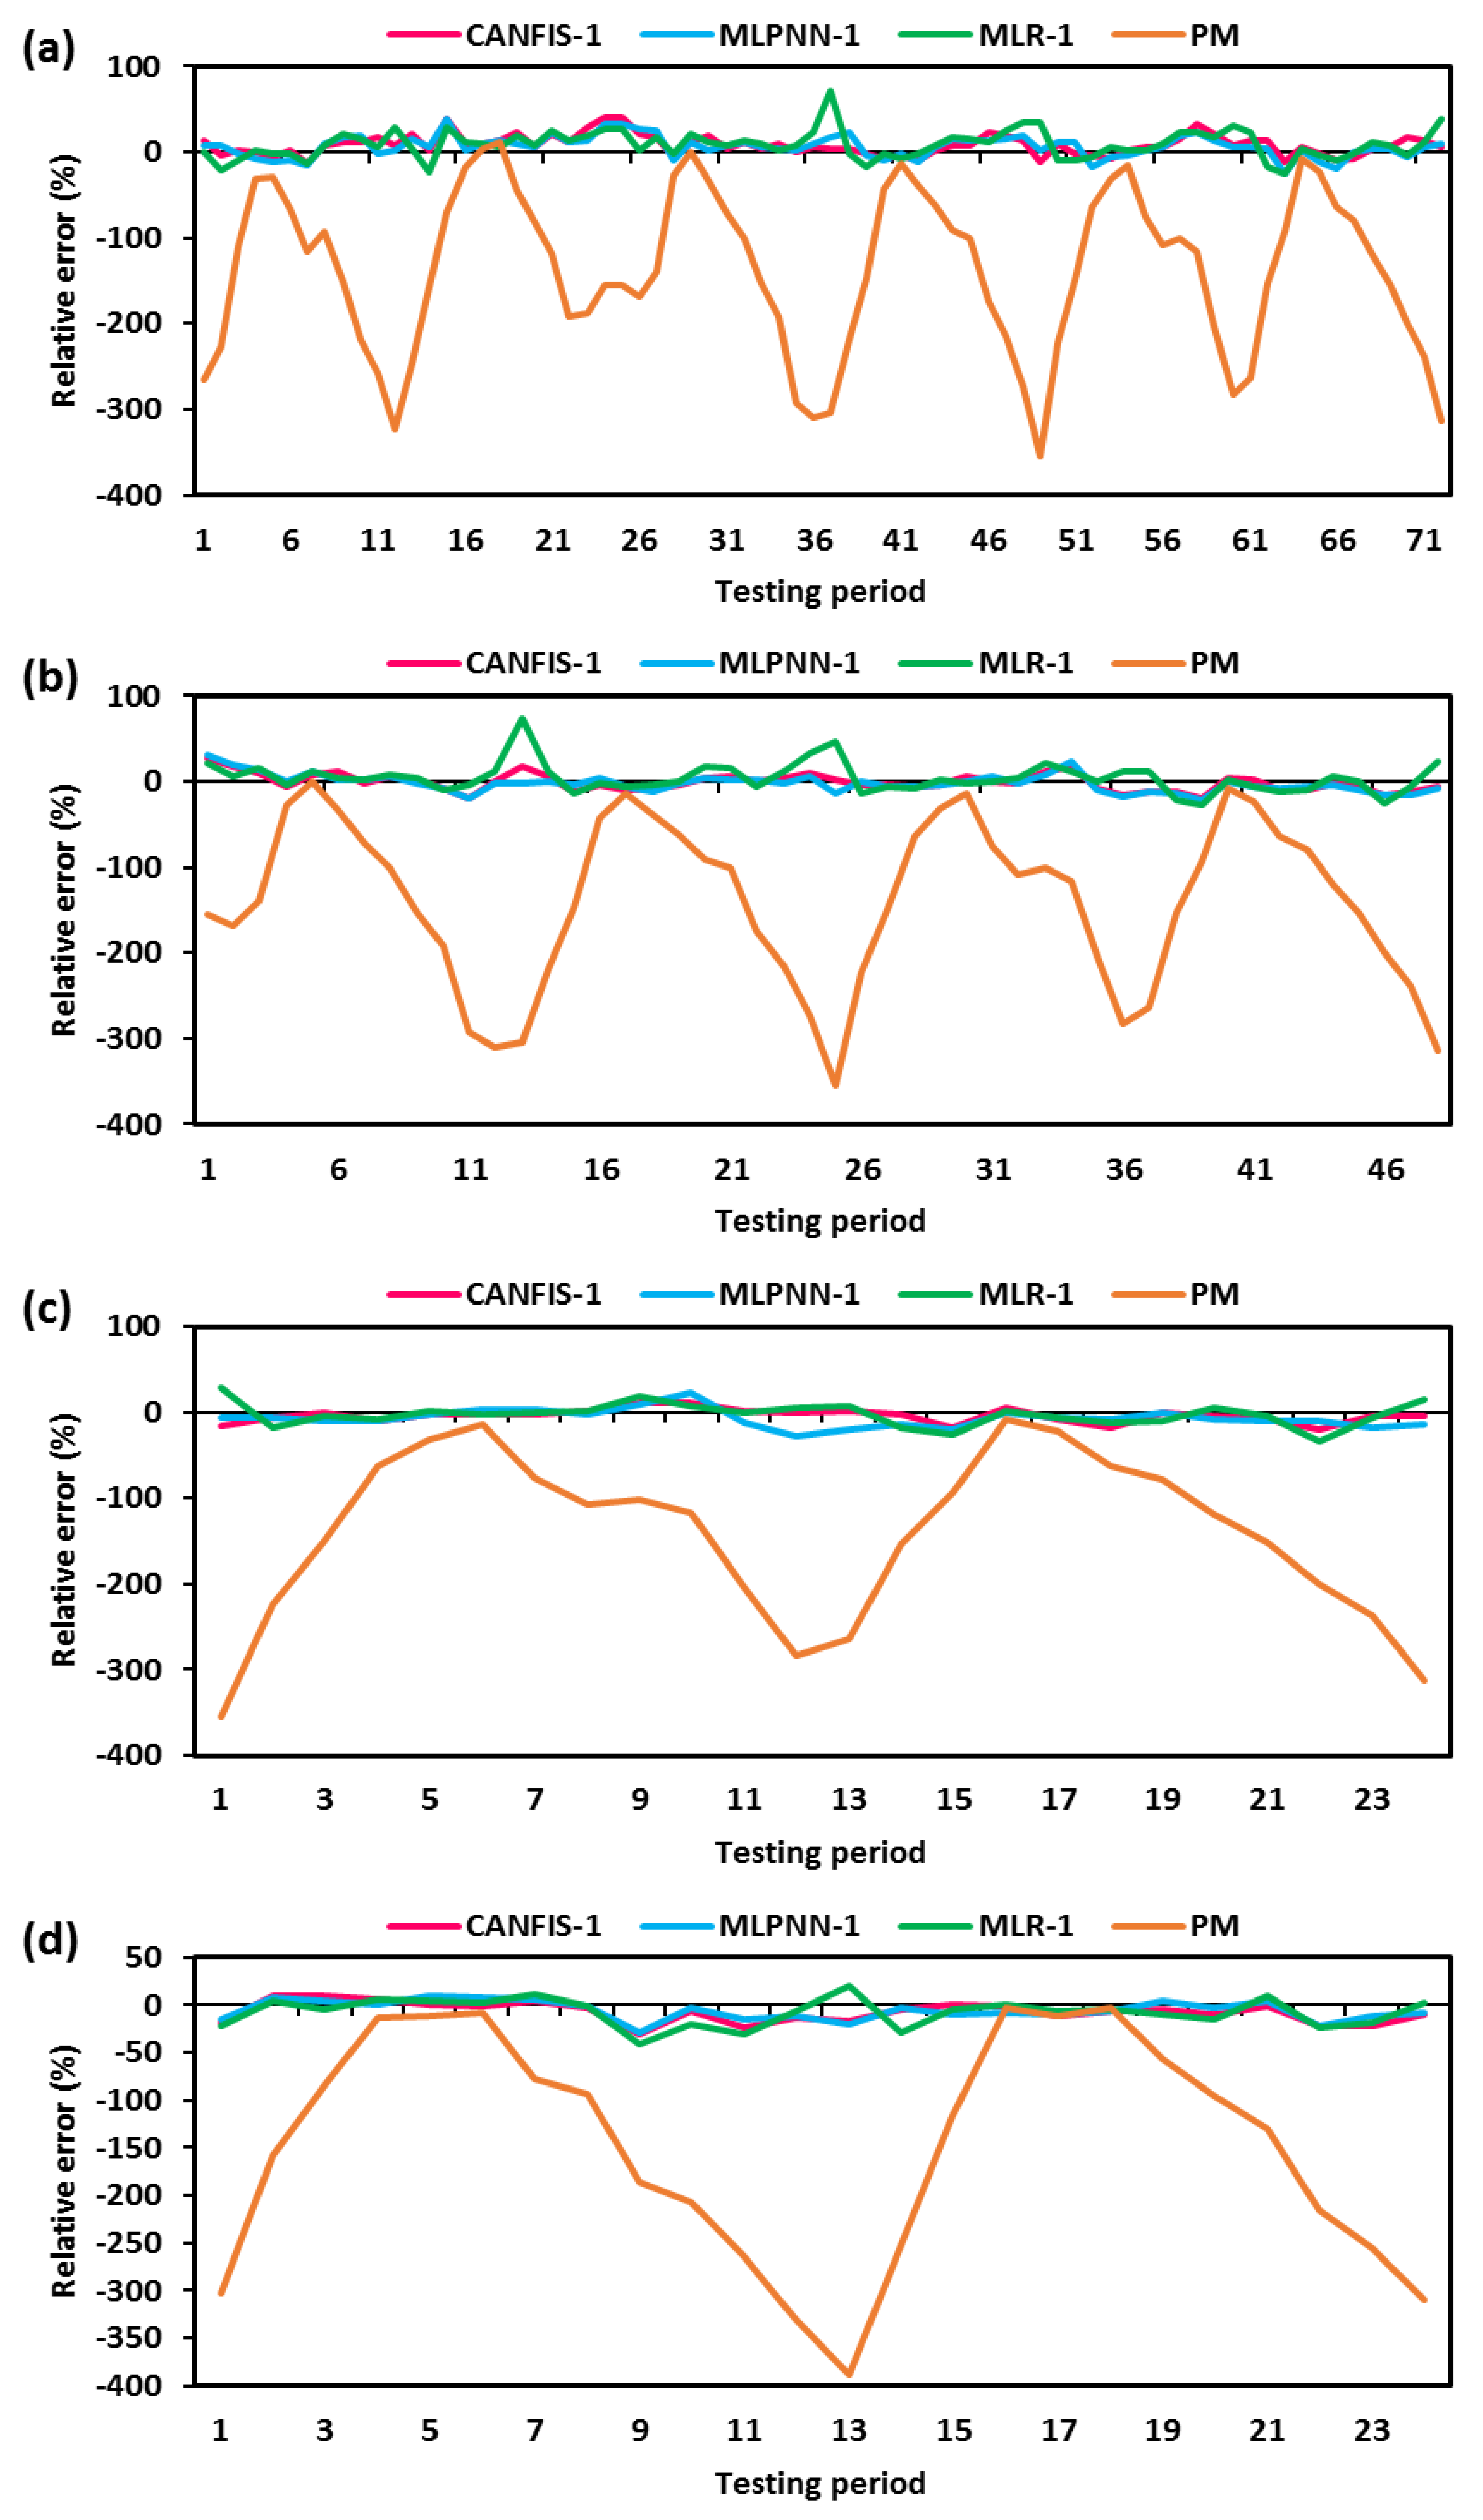
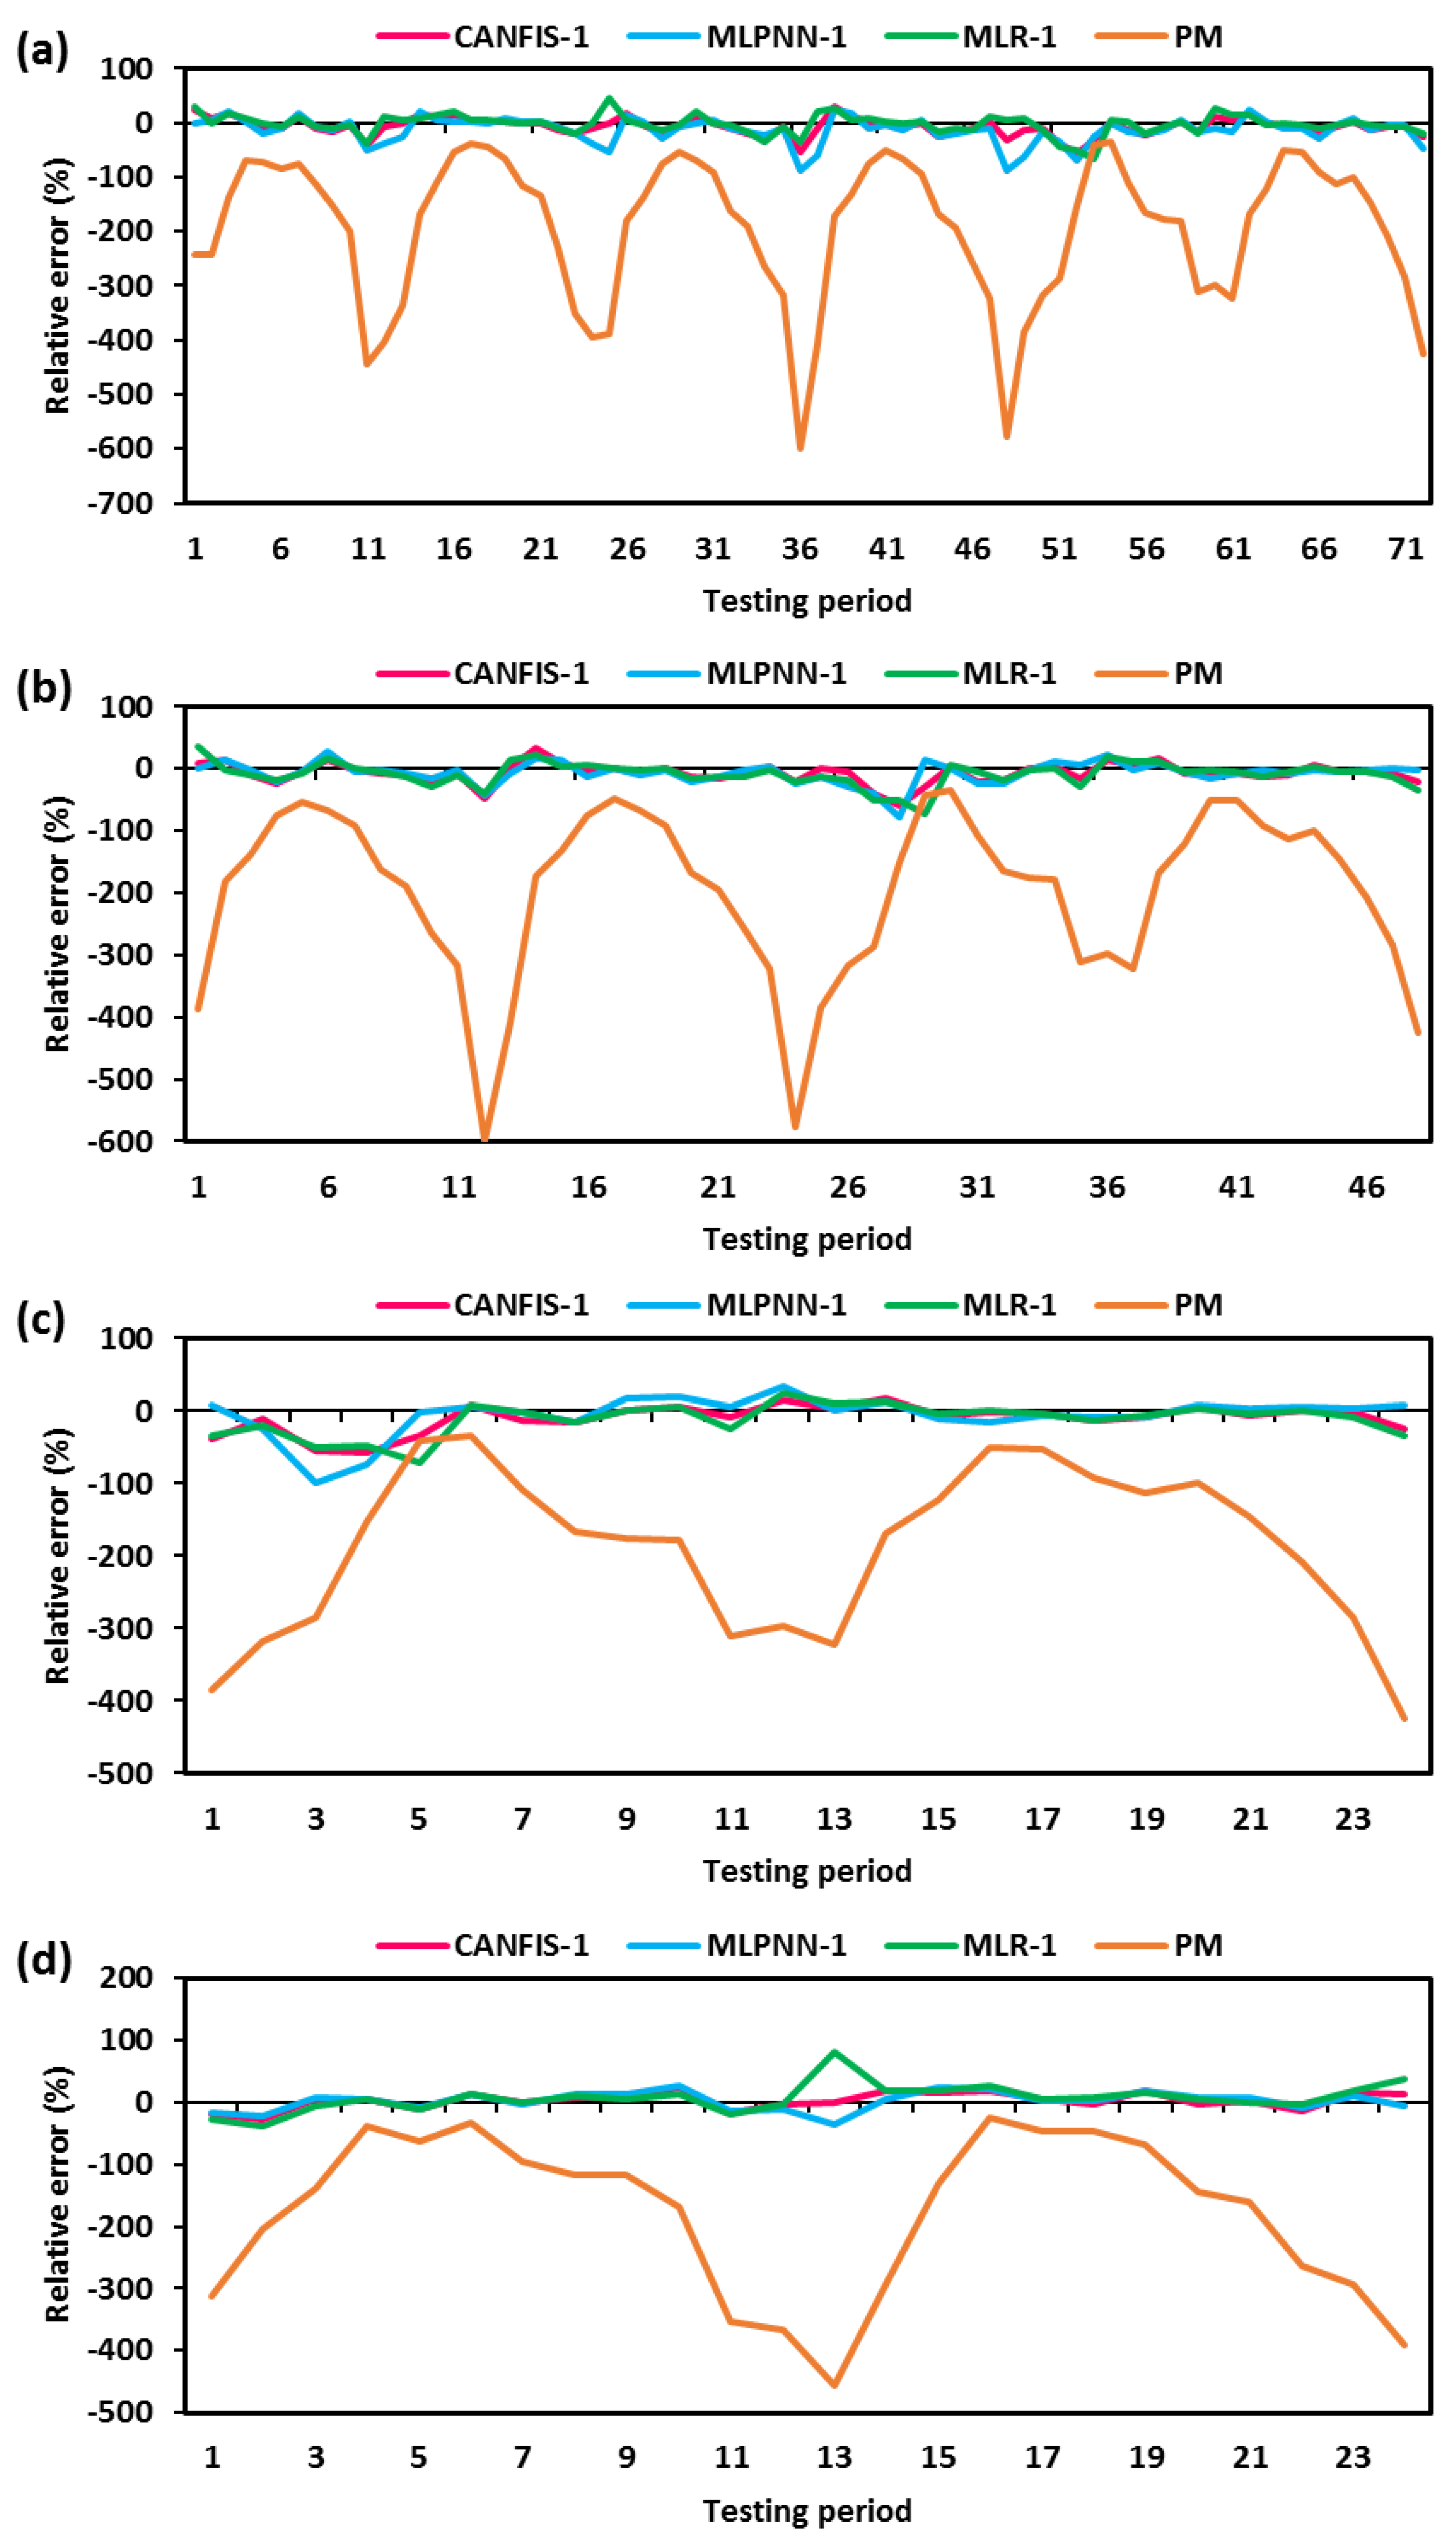
The percentages of relative errors (obtained using Equation (11)) between the estimated and observed EPm values of the CANFIS-1, MLPNN-1, MLR-1, and PM models in the four different scenarios over the testing period are illustrated in Figure 8a–d. As reported in Figure 8a–d, the RE percentage was limited to between +40 and −20 for the first scenario. The highest RE% was experienced using the Penman model (PM). However, the minimum relative error percentage was obtained for the CANFIS model, and it was limited to ±10, with some observations reaching ±20. Greater spreading of the RE for all prescribed models seemed to occur at the peak value of monthly EPm. It can also be observed from Figure 8, together with Figure 7, that the models’ accuracy varies over diverse scenarios and this suggests the use of various scenarios in evaluating the potential of AI models, as also discussed by Kisi and Heddam [32].
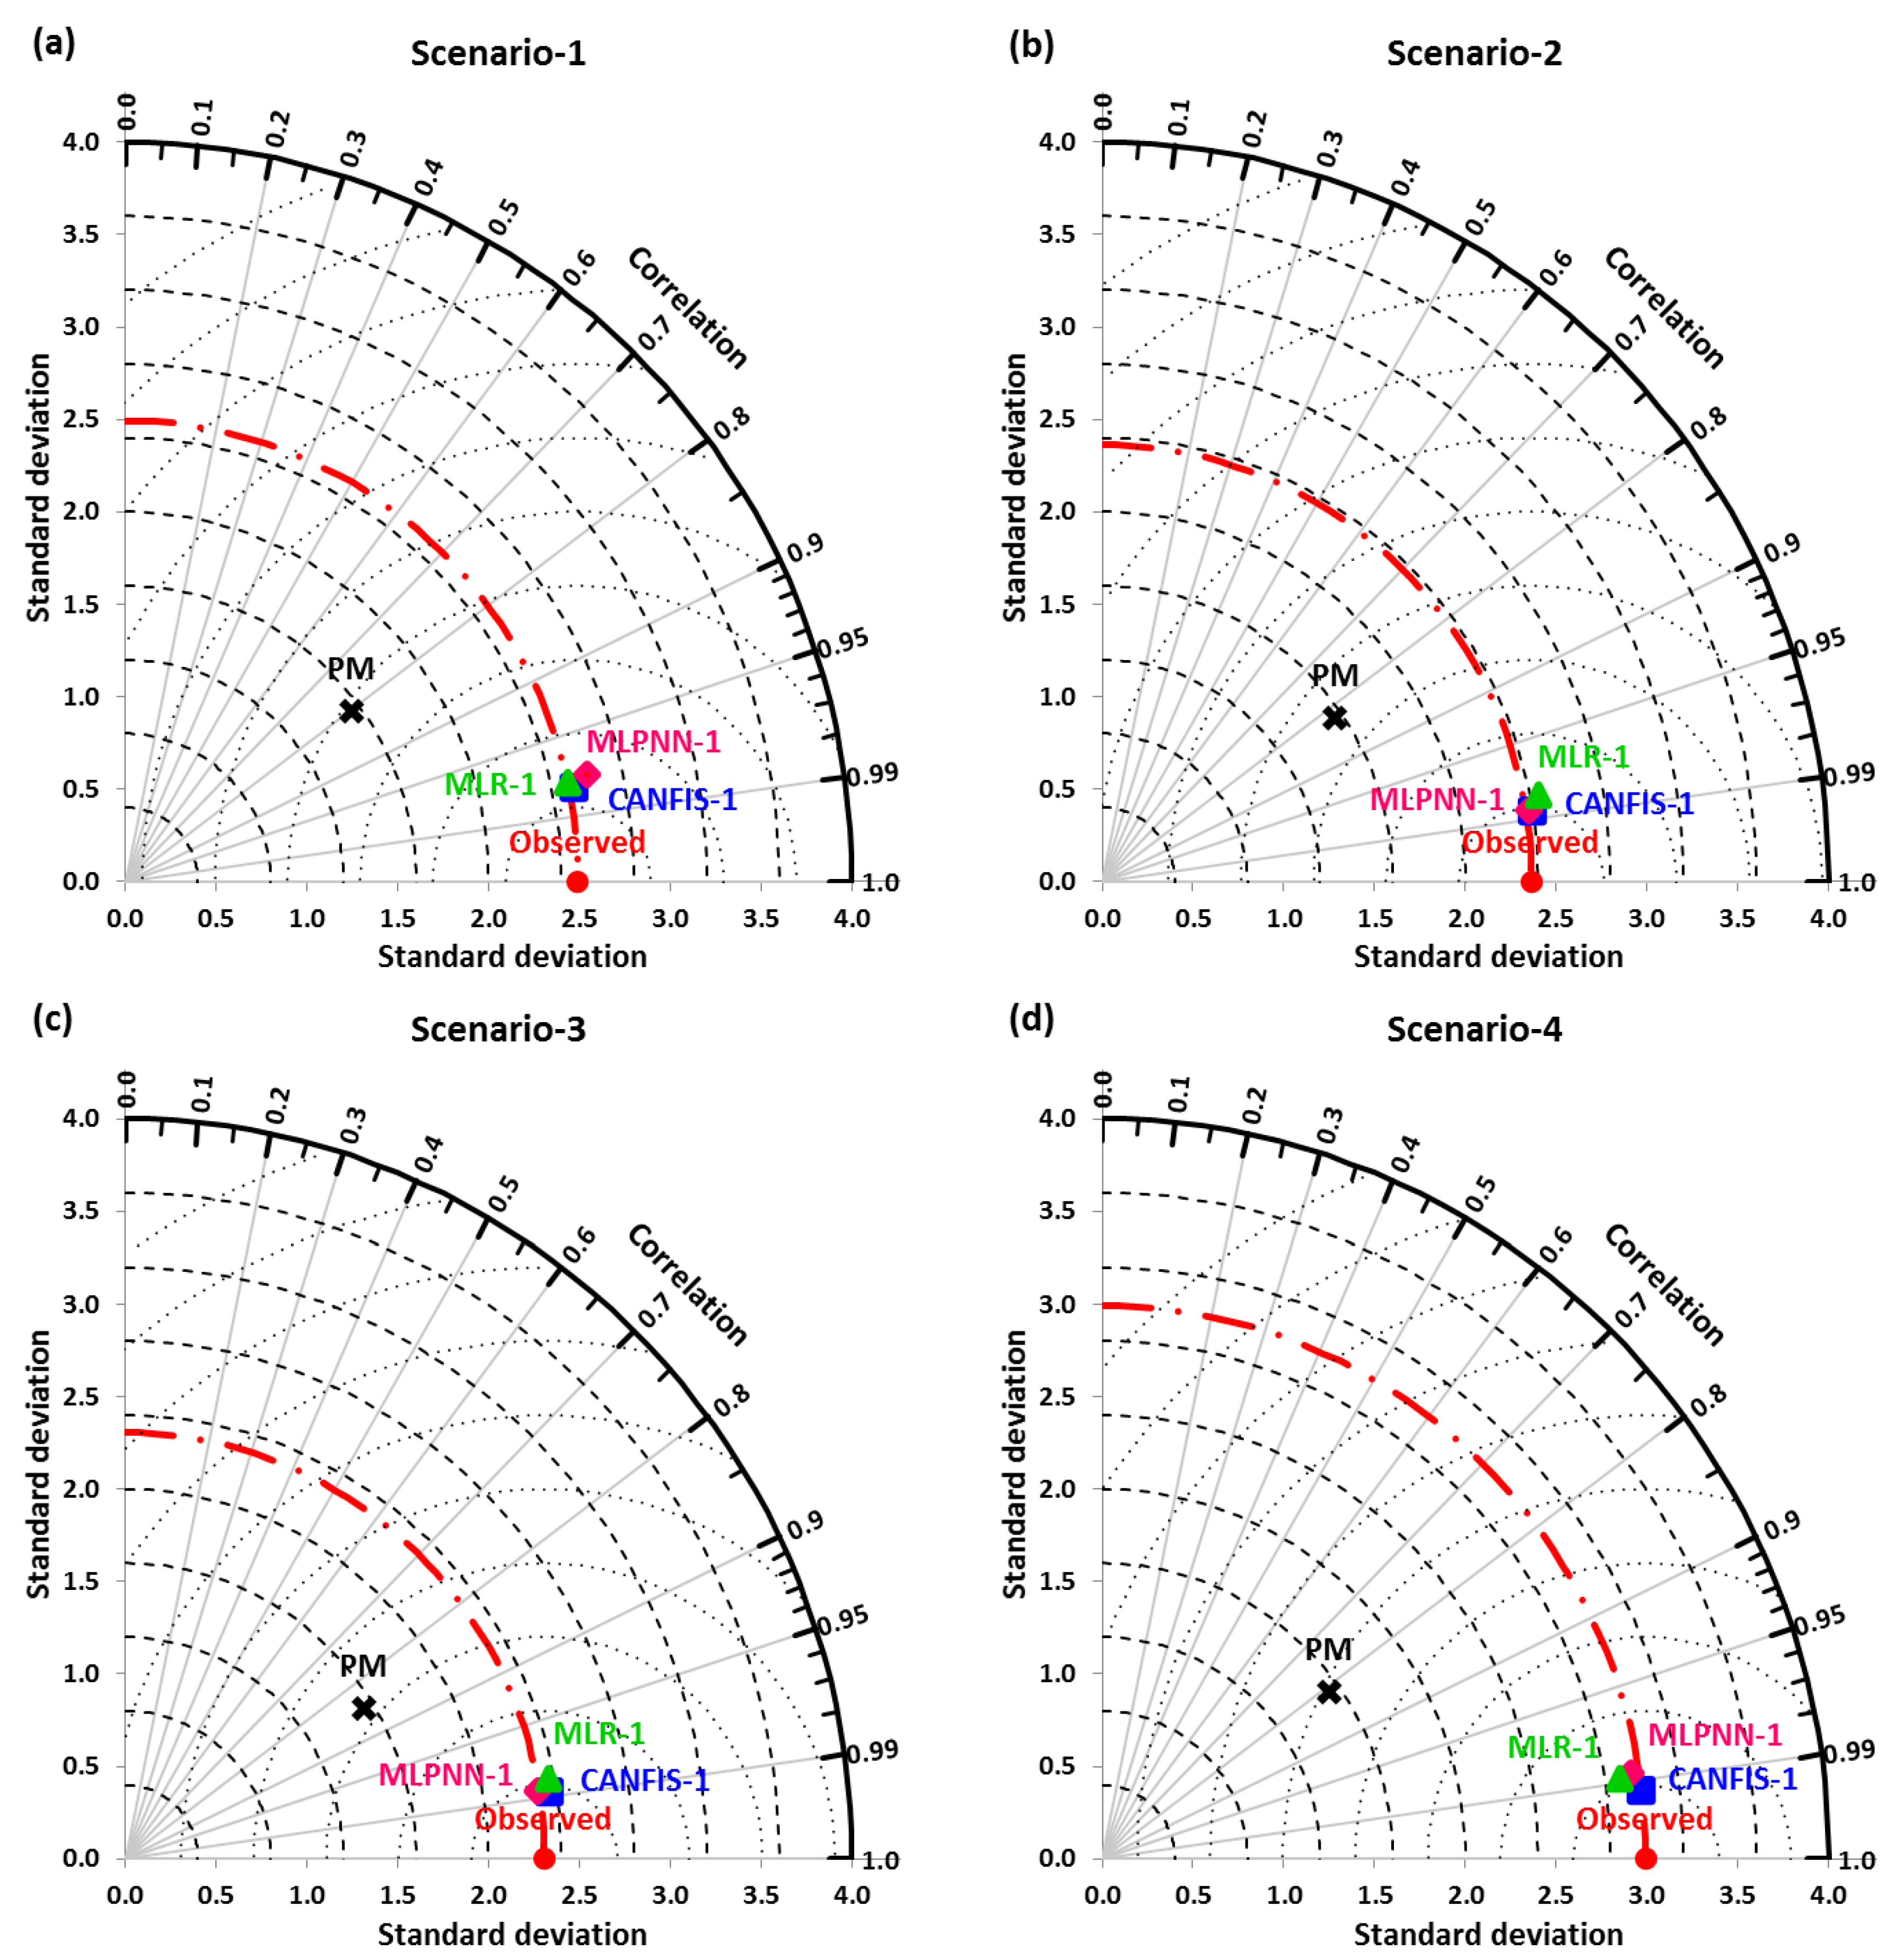
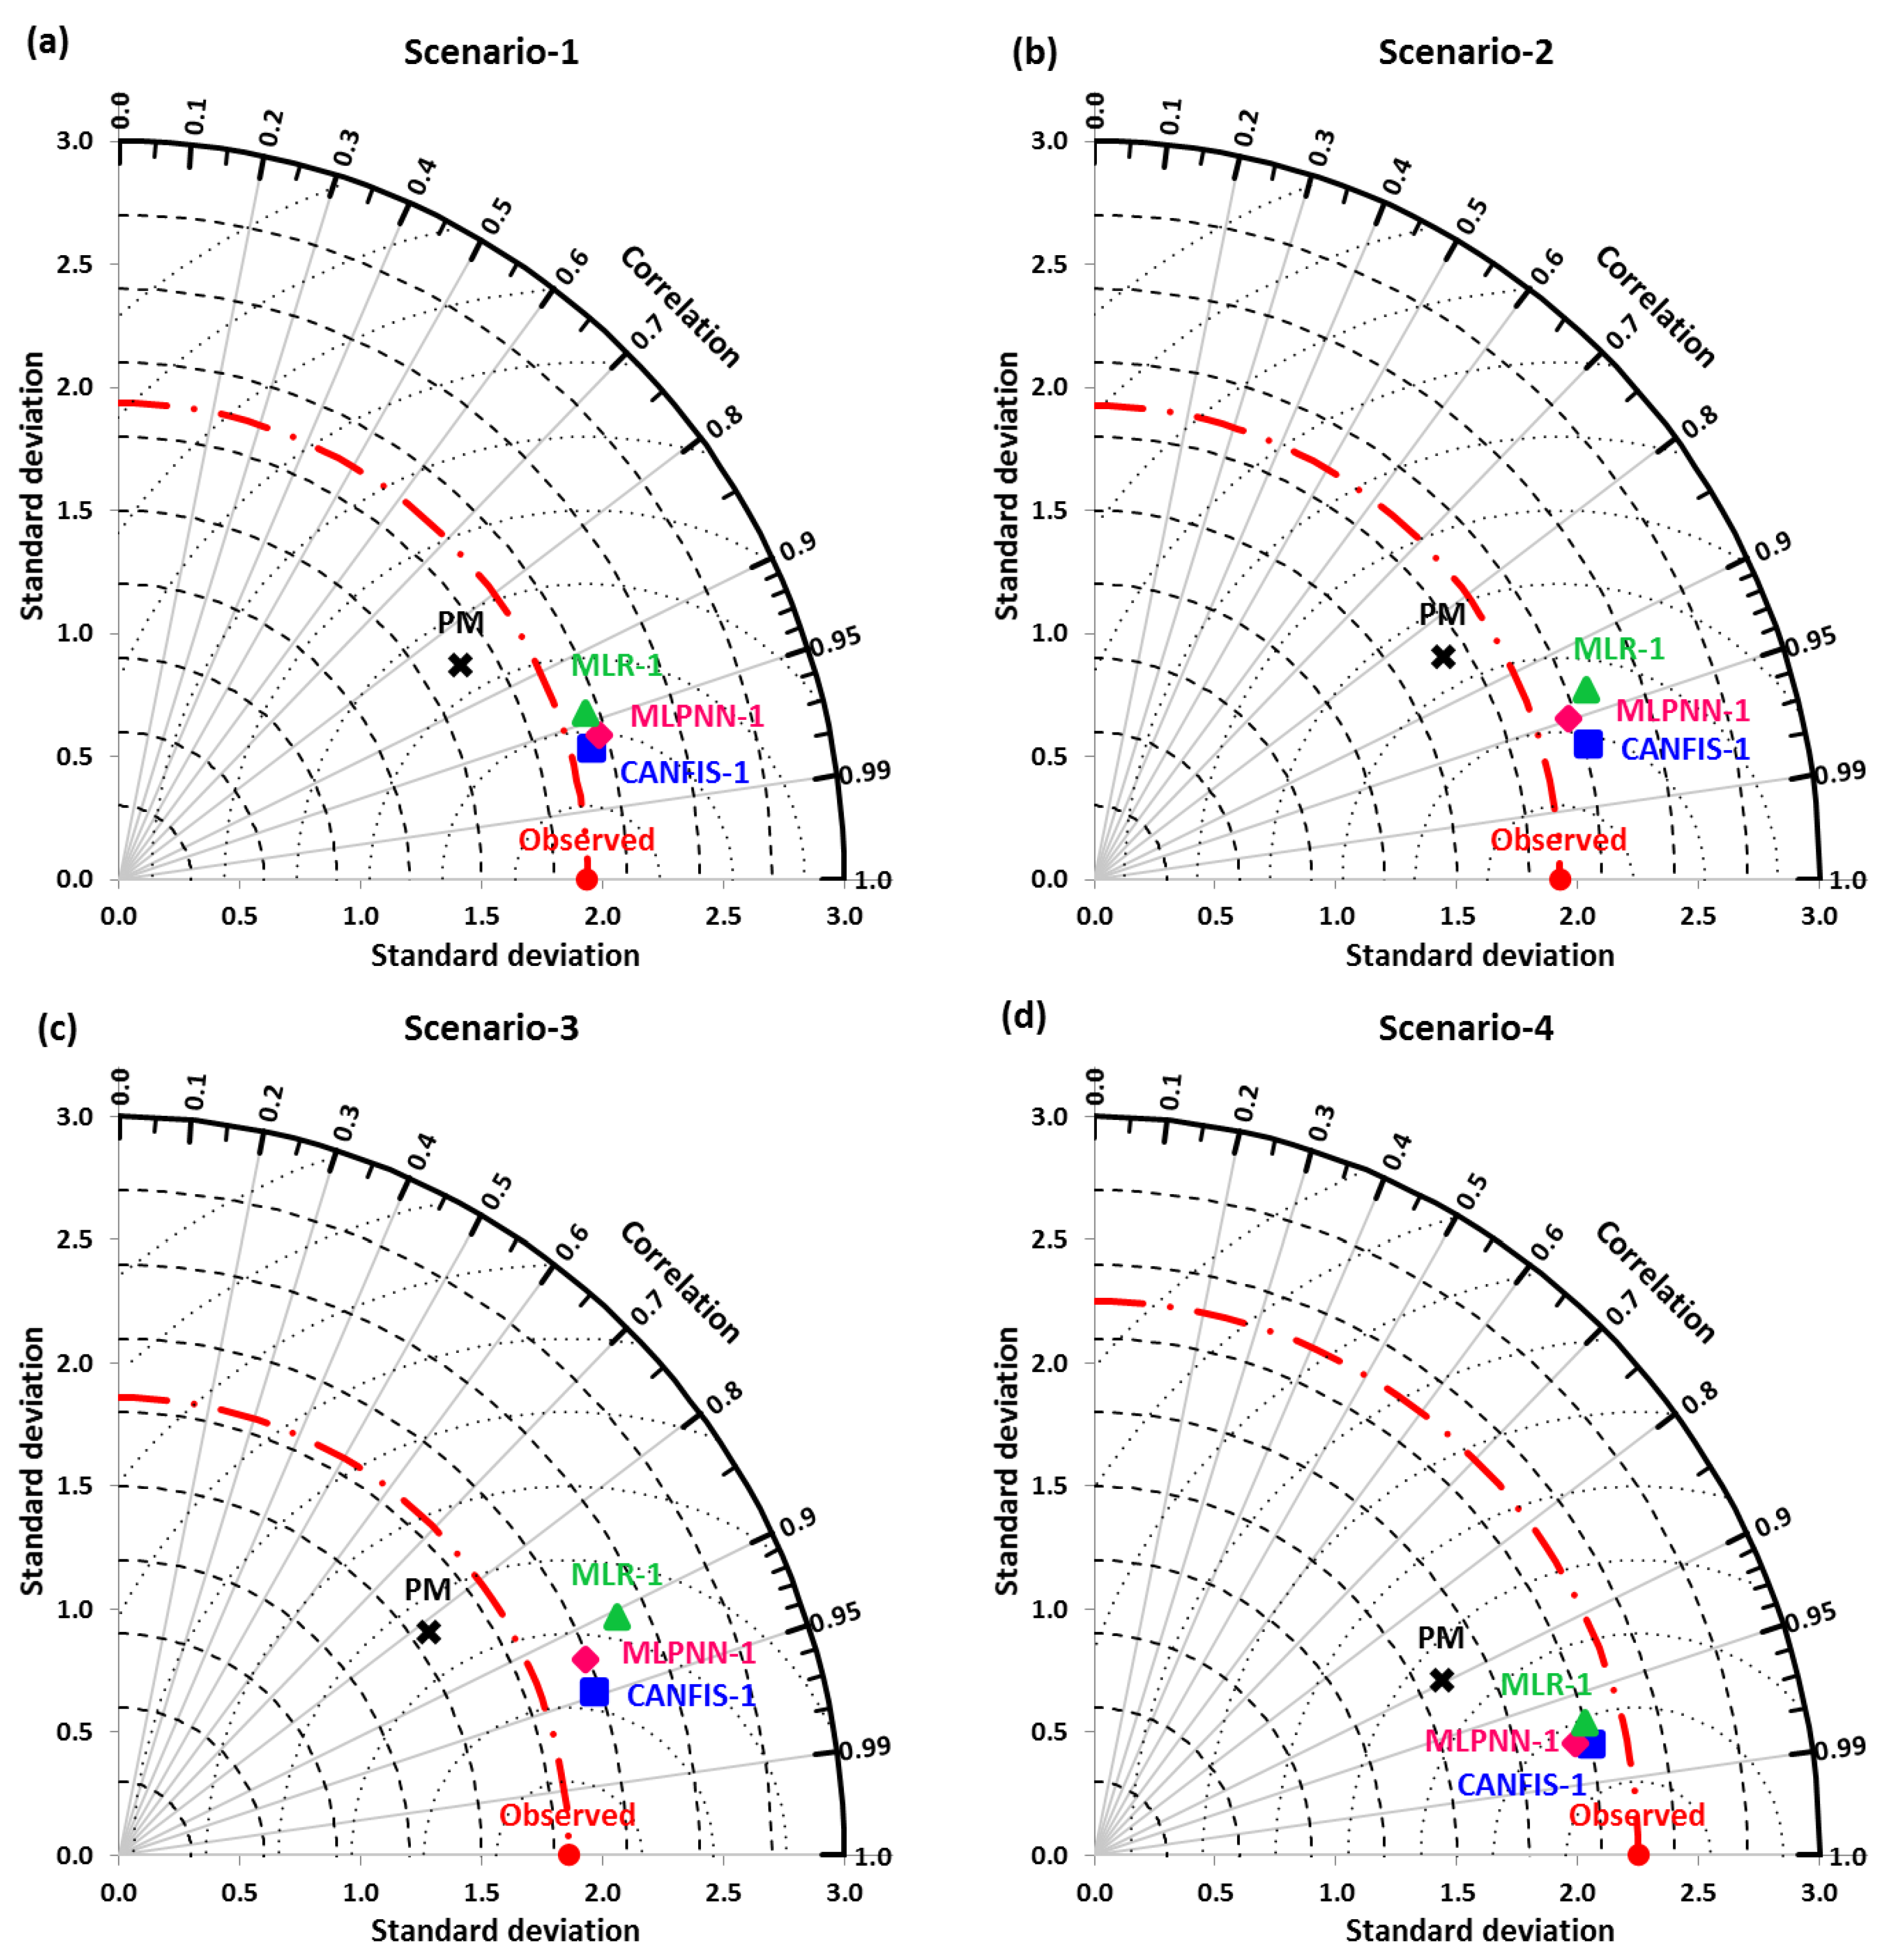
Figure 9a–d demonstrates the spatial distribution of observed and estimated monthly EPm values yielded by the CANFIS-1, MLPNN-1, MLR-1, and PM models under scenarios one to four during the testing period at Pantnagar station through a Taylor diagram (TD), which is a polar plot for acquiring a visual judgment of model performance based on the coefficient of correlation, standard deviation, and root mean square error (RMSE). Figure 9a–d shows that the estimates provided by the CANFIS-1 model in all four scenarios are very close to the observed values of monthly EPm. Henceforth, the CANFIS-1 model with Tmax, Tmin, RH-1, RH-2, WS, and SSH climatic parameters can be cast for monthly EPm estimation at Pantnagar station.

4.3. Estimation of EPm under Different Scenarios at Nagina Station

Table 6 presents the values of performance evaluation indicators (NRMSE, NSE, PCC, and WI) for the selected input combination (i.e., Tmax, Tmin, RH-1, RH-2, WS, and SSH) during the testing period under four different scenarios. Nagina station in scenario-1 (Table 6) achieved NRMSE values ranging from 0.1543 to 0.1866 and NSE/PCC (WI) values ranging from 0.9150 to 0.8758/0.9643 to 0.9437 (0.9794 to 0.9698) for the CANFIS-1, MLPNN-1 (6-10-1), and MLR-1 models, respectively. In scenario-2 (Table 6), the NRMSE values ranged from 0.1719 to 0.2299 and NSE/PCC (WI) values ranged from 0.8962 to 0.8144/0.9649 to 0.9346 (0.9761 to 0.9579) for the CANFIS-1, MLPNN-1 (6-10-1), and MLR-1 models, respectively. In the case of scenario-3 (Table 6), the NRMSE values ranged from 0.2067 to 0.2939 and NSE/PCC (WI) values ranged from 0.8382 to 0.6729/0.9473 to 0.9049 (0.9632 to 0.9313), while in scenario-4, the NRMSE values ranged from 0.1356 to 0.1621 and NSE/PCC (WI) values ranged from 0.9453 to 0.9219/0.9762 to 0.9666 (0.853 to 0.9789), for the CANFIS-1, MLPNN-1 (6-10-1), and MLR-1 models, respectively. A comparison of the CANFIS, MLPNN, and MLR models against the PM for all scenarios exposed the better performance of the CANFIS model, followed by the MLPNN and MLR models. As Table 6 clearly indicates, the CANFIS-1 models out-performed the other models in all four scenarios, followed by the MLPNN-1 models. Therefore, CANFIS-1 followed the best statistical criteria (i.e., minimum values = NRMSE, and maximum values = NSE, PCC, and WI) during the testing period and was selected as the best of the three models. Hence, the models’ estimation accuracies show variations over the four scenarios and increasing the training data length generally improves the models’ exactness in estimation of the monthly EPm, as also discussed by Kisi and Heddam [32].
Figure 10a–d illustrates the time variation and scatter plots of observed and estimated monthly EPm values obtained by the CANFIS-1, MLPNN-1, MLR-1, and Penman models under scenarios one to four during the testing period at Nagina station. In scenario-1, the R2 is 0.9299, 0.9201, 0.8905, and 0.2879; scenario-2, the R2 is 0.9311, 0.8999, 0.8735, and 0.2863; scenario-3, the R2 is 0.8973, 0.8550, 0.8188, and 0.2944; and scenario-4, the R2 is 0.9529, 0.9498, 0.9343, and 0.3911 for the CANFIS-1, MLPNN-1, MLR-1, and PM models during the testing phase, respectively. In addition, the scenarios one, two, and three demonstrated that the regression line (RL) is above the 1:1 line for all of the methods and this means that the CANFIS-1, MLPNN-1, and MLR-1 models under these scenarios slightly over-predict, while in scenario-4, they under-predict, the monthly EPm values at Nagina station. Moreover, scenarios one to four verified that the Penman model highly over-estimates the EPm values. Therefore, the use of various data splitting scenarios is recommended when testing data-driven methods in the estimation of EPm.
The percentage of RE between the estimated and observed monthly EPm values for all applied predictive models for Nagina station is displayed in Figure 11a–d for the four different scenarios over the testing period. Figure 11a–d shows that the RE percentage was between +25 and −50 for the first scenario. The maximum RE% was experienced for the Penman model. Apparently, the best performance based on this metric was attained for the CANFIS model and for the fourth scenario. The relative error percentage was limited to ±15 for about 80% of the testing phase of modeling. Conversely, the rest of the data observations ranged by ±20%. Therefore, extreme spreading of the RE for the peak value of the monthly EPm was detected for all prescribed models.
Figure 12a–d displays the spatial distribution among observed and estimated monthly EPm values yielded through the CANFIS-1, MLPNN-1, MLR-1, and Penman models under scenarios one to four during the testing period. Figure 12a–d shows that the CANFIS-1 model in all four scenarios is closer to the observed values of monthly EPm compared to the other applied models. Therefore, the CANFIS-1 model with Tmax, Tmin, RH-1, RH-2, WS, and SSH climatic variables at Nagina station can be employed for monthly EPm estimation.

4.4. Comparison and Discussion

In this research, the monthly EPm was estimated at Pantnagar and Nagina stations under four different scenarios by employing the CANFIS, MLPNN, and MLR models in conjunction with GT, which revealed the appropriate input variable combination for this task. The results produced by the CANFIS model were validated against the MLPNN and MLR models using several statistical metrics and visual interpretations. The CANFIS model optimized with the Takagi–Sugeno–Kang (TSK) fuzzy inference system, hyperbolic-tangent (tanh) activation function, delta bar delta algorithm, and Gaussian membership functions demonstrated a substantial predictability performance of the modeled evaporation process. This was observed for all of the investigated modeling scenarios.
Machine learning models behave based on the supplied dataset. Hence, in this research the applicability of the applied predictive models in the reverse back mode was tested. The models were trained using a recent historical data set trend and were tested to predict the evaporation at an earlier span period. In this way, more informative visualization can be attained on the applicability of the predictive for predicting the evaporation in the reverse time period. This is because, from a logical aspect: arranging the data and consequently training and then testing, could be by chance to obtain good results. Hence, machine learning models should be investigated by training the models using any dataset, and the testing phase can be randomly selected at any span period desired to be examined. The research findings evidenced the capacity of the proposed AI predictive model for the reverse back mode scenario.
To corroborate the findings of the research, a comparison was analyzed with respect to the NRMSE of the MLPNN-1, MLR-1, and Penman models in terms of the prediction accuracy, which reduced from 85.8% to 2.8%, 90.8% to 1.7%, 90.5% to 4.6%, and 90.2% to 12.0% in scenarios one to four, respectively, with the CANFIS-1 model at Pantnagar station. Similarly, the prediction accuracy concerning the NRMSE of MLPNN-1, MLR-1, and Penman models reduced from 88.5% to 14.9%, 87.7% to 9.5%, 85.1% to 9.4%, and 85.5% to 8.2% with the CANFIS-1 model in scenarios one to four, respectively, at Nagina station. Therefore, the applied modeling approach can be employed to build a straightforward reliable AI system, which is crucial for the sustainable planning and management of water resources.
In accordance with the attained estimation accuracy, the data span used was eight years of weather information, which consisted of the minimum and maximum air temperature, morning and afternoon relative humidity, wind speed, and sunshine hours. Overall, the investigated eight-year monthly-scale climatic information was sufficient for constructing the predictive models. It can also be noted that the co-active neuro-fuzzy inference system introduced performed remarkably for mimicking the actual trend of the evaporation process. This was due to the major capability of simulating the uncertainty problem where the CANFIS model is characterized. The monthly EPm process is usually highly associated with major uncertainties of climatic variability. Therefore, proposing the CANFIS model was an excellent idea for addressing this complex climate process. For this region, it was evidenced that the incorporation of all related available hydrological information was highly crucial for modeling the monthly EPm. This was due to the high stochasticity of the monthly EPm, which is very much influenced by different climate attributes. Decadal research on pan evaporation estimation has shown the wide applications of AI models. Through validation against literature studies [28,74,75,76,77,78,79], the present implementation of the CANFIS model confirmed its predictability capacity using statistical metrics.
The current research could be further extended with other modeling scenarios by incorporating the most significant correlated climate variables. For instance, the integration of metaheuristic optimization algorithms [80] can advance the prediction process to abstract the essential correlated attributes. Conceptually, this is a factual implementation with the possibility of eliminating unnecessary climate variables and obtaining an acceptable prediction accuracy with less input variability. This is highly beneficial for catchments located in developing countries where a lack of climatological data availability exists.

5. Conclusions

The evaporation process in nature is characterized by highly non-linear and stochastic phenomena. In the current research, the first phase was established to extract the input variables relating to the monthly EPm using the Gamma test. The second phase of modeling was employed to estimate the value of monthly EPm using different AI models, including CANFIS and MLPNN at Pantnagar station (located in Uttarakhand State) and Nagina station (located in Uttar Pradesh State), India. Owing to the fact that different span data can influence the efficiency of the applied AI models, several scenarios were investigated, applying different training and testing data set spans. For validation purposes, the predictability potential of CANFIS and MLPNN were evaluated against the classical multiple linear regression and traditional Penman model. The modeling procedure was inspected using multiple statistical metrics (i.e., normalized root mean square error, Nash–Sutcliffe efficiency, Pearson correlation coefficient, Willmott index, and relative error). In addition, graphical inspections were performed, including a time variation plot, scatter plot, relative error percentage graph, and Taylor diagram. The findings of the research evidenced the capacity of the CANFIS-1 model for estimating monthly-scale pan evaporation incorporating all of the weather information, including the minimum and maximum air temperature, morning and afternoon relative humidity, wind speed, and sunshine hours. The superiority of the CANFIS-1 model was observed for all examined scenarios and at both Pantnagar and Nagina stations. Additionally, the performance of the traditional Penman model was found to be the worst in all scenarios for estimating the monthly EPm at both stations. Overall, the result of the current research demonstrated the feasibility of the CANFIS model as a newly developed data-intelligent approach for simulating pan evaporation in the Indian region, where it can be applied for several water resource engineering applications.
In future studies, the different percentages of training and testing datasets should be considered for monthly pan evaporation estimation using advanced hybrid metaheuristic models (i.e., the grey wolf optimizer, particle swarm optimizer, multi verse optimizer, whale optimization algorithm, and ant lion optimizer), and compared with empirical and semi-empirical climate-based models (Stephens–Stewart, Griffiths, Christiansen, Priestley–Taylor, and Jensen–Burman–Allen) in different climates. This research focuses on the specific area of Pantnagar and Nagina stations, so the results of the current research cannot be used to generalize about the ability of applied AI models for different climatic regions. Therefore, it is also suggested that, in future studies, the generalization of applied AI models should be examined by considering multiple stations in different environmental conditions.

Author Contributions

Conceptualization, S.H., A.S. and Z.M.Y.; data curation, A.M. and S.H.; formal analysis, A.M., P.R., S.H., A.S., S.Q.S., N.A.-A. and Z.M.Y.; investigation, P.R., A.S. and Z.M.Y.; methodology, A.M.; project administration, Z.M.Y.; software, A.M.; supervision, O.K., N.A.-A. and Z.M.Y.; validation, S.H., O.K., S.Q.S., N.A.-A. and Z.M.Y.; visualization, A.M., S.H., O.K., A.S., S.Q.S., N.A.-A. and Z.M.Y.; writing—original draft, A.M., P.R., S.H., O.K., A.S., S.Q.S., N.A.-A. and Z.M.Y.; writing—review and editing, O.K., A.S., S.Q.S. and N.A.-A. All authors have read and agreed to the published version of the manuscript.

Funding

This research received no external funding.

Conflicts of Interest

The authors declare no conflicts of interest.

References

  1. Mbangiwa, N.C.; Savage, M.J.; Mabhaudhi, T. Modelling and measurement of water productivity and total evaporation in a dryland soybean crop. Agric. For. Meteorol. 2019, 266–267, 65–72. [Google Scholar] [CrossRef]
  2. Sayl, K.N.; Muhammad, N.S.; Yaseen, Z.M.; El-shafie, A. Estimation the Physical Variables of Rainwater Harvesting System Using Integrated GIS-Based Remote Sensing Approach. Water Resour. Manag. 2016, 30, 3299–3313. [Google Scholar] [CrossRef]
  3. Sanikhani, H.; Kisi, O.; Maroufpoor, E.; Yaseen, Z.M. Temperature-based modeling of reference evapotranspiration using several artificial intelligence models: Application of different modeling scenarios. Theor. Appl. Climatol. 2019, 135, 449–462. [Google Scholar] [CrossRef]
  4. Zhao, G.; Gao, H. Estimating reservoir evaporation losses for the United States: Fusing remote sensing and modeling approaches. Remote Sens. Environ. 2019, 226, 109–124. [Google Scholar] [CrossRef] [Green Version]
  5. Deo, R.C.; Samui, P. Forecasting Evaporative Loss by Least-Square Support-Vector Regression and Evaluation with Genetic Programming, Gaussian Process, and Minimax Probability Machine Regression: Case Study of Brisbane City. J. Hydrol. Eng. 2017, 22, 05017003. [Google Scholar] [CrossRef]
  6. Salman, S.A.; Shahid, S.; Ismail, T.; Ahmed, K.; Wang, X.-J. Selection of climate models for projection of spatiotemporal changes in temperature of Iraq with uncertainties. Atmos. Res. 2018, 213, 509–522. [Google Scholar] [CrossRef]
  7. Wang, K.; Liu, X.; Tian, W.; Li, Y.; Liang, K.; Liu, C.; Li, Y.; Yang, X. Pan coefficient sensitivity to environment variables across China. J. Hydrol. 2019, 572, 582–591. [Google Scholar] [CrossRef]
  8. Tabari, H.; Talaee, P.H.; Abghari, H. Utility of coactive neuro-fuzzy inference system for pan evaporation modeling in comparison with multilayer perceptron. Meteorol. Atmos. Phys. 2012, 116, 147–154. [Google Scholar] [CrossRef]
  9. Friedrich, K.; Grossman, R.L.; Huntington, J.; Blanken, P.D.; Lenters, J.; Holman, K.D.; Gochis, D.; Livneh, B.; Prairie, J.; Skeie, E.; et al. Reservoir Evaporation in the Western United States: Current Science, Challenges, and Future Needs. Bull. Am. Meteorol. Soc. 2017, 99, 167–187. [Google Scholar] [CrossRef]
  10. Ali Ghorbani, M.; Kazempour, R.; Chau, K.-W.; Shamshirband, S.; Taherei Ghazvinei, P. Forecasting pan evaporation with an integrated artificial neural network quantum-behaved particle swarm optimization model: A case study in Talesh, Northern Iran. Eng. Appl. Comput. Fluid Mech. 2018, 12, 724–737. [Google Scholar] [CrossRef]
  11. Jing, W.; Yaseen, Z.M.; Shahid, S.; Saggi, M.K.; Tao, H.; Kisi, O.; Salih, S.Q.; Al-Ansari, N.; Chau, K.-W. Implementation of evolutionary computing models for reference evapotranspiration modeling: Short review, assessment and possible future research directions. Eng. Appl. Comput. Fluid Mech. 2019, 13, 811–823. [Google Scholar] [CrossRef] [Green Version]
  12. Yaseen, Z.M.; El-shafie, A.; Jaafar, O.; Afan, H.A.; Sayl, K.N. Artificial intelligence based models for stream-flow forecasting: 2000–2015. J. Hydrol. 2015, 530, 829–844. [Google Scholar] [CrossRef]
  13. Danandeh Mehr, A.; Nourani, V.; Kahya, E.; Hrnjica, B.; Sattar, A.M.A.; Yaseen, Z.M. Genetic programming in water resources engineering: A state-of-the-art review. J. Hydrol. 2018, 566, 643–667. [Google Scholar] [CrossRef]
  14. Nourani, V.; Hosseini Baghanam, A.; Adamowski, J.; Kisi, O. Applications of hybrid wavelet–Artificial Intelligence models in hydrology: A review. J. Hydrol. 2014, 514, 358–377. [Google Scholar] [CrossRef]
  15. Fahimi, F.; Yaseen, Z.M.; El-shafie, A. Application of soft computing based hybrid models in hydrological variables modeling: A comprehensive review. Theor. Appl. Climatol. 2016, 128, 875–903. [Google Scholar] [CrossRef]
  16. Yaseen, Z.M.; Sulaiman, S.O.; Deo, R.C.; Chau, K.-W. An enhanced extreme learning machine model for river flow forecasting: State-of-the-art, practical applications in water resource engineering area and future research direction. J. Hydrol. 2018, 569, 387–408. [Google Scholar] [CrossRef]
  17. Fotovatikhah, F.; Herrera, M.; Shamshirband, S.; Ardabili, S.F.; Piran, J. Mechanics Survey of computational intelligence as basis to big flood management: Challenges, research directions and future work. Eng. Appl. Comput. Fluid Mech. 2018, 2060, 411–437. [Google Scholar]
  18. Salih, S.Q.; Sharafati, A.; Ebtehaj, I.; Sanikhani, H.; Siddique, R.; Deo, R.C.; Bonakdari, H.; Shahid, S.; Yaseen, Z.M. Integrative stochastic model standardization with genetic algorithm for rainfall pattern forecasting in tropical and semi-arid environments. Hydrol. Sci. J. 2020, 65, 1145–1157. [Google Scholar] [CrossRef]
  19. Hai, T.; Sharafati, A.; Mohammed, A.; Salih, S.Q.; Deo, R.C.; Al-Ansari, N.; Yaseen, Z.M. Global Solar Radiation Estimation and Climatic Variability Analysis Using Extreme Learning Machine Based Predictive Model. IEEE Access 2020, 8, 12026–12042. [Google Scholar] [CrossRef]
  20. Qasem, S.N.; Samadianfard, S.; Kheshtgar, S.; Jarhan, S.; Kisi, O.; Shamshirband, S.; Chau, K.-W. Modeling monthly pan evaporation using wavelet support vector regression and wavelet artificial neural networks in arid and humid climates. Eng. Appl. Comput. Fluid Mech. 2019, 13, 177–187. [Google Scholar] [CrossRef] [Green Version]
  21. Sebbar, A.; Heddam, S.; Djemili, L. Predicting Daily Pan Evaporation (Epan) from Dam Reservoirs in the Mediterranean Regions of Algeria: OPELM vs OSELM. Environ. Process. 2019, 6, 309–319. [Google Scholar] [CrossRef]
  22. Majhi, B.; Naidu, D.; Mishra, A.P.; Satapathy, S.C. Improved prediction of daily pan evaporation using Deep-LSTM model. Neural Comput. Appl. 2019, 31, 1–15. [Google Scholar] [CrossRef]
  23. Lu, X.; Ju, Y.; Wu, L.; Fan, J.; Zhang, F.; Li, Z. Daily pan evaporation modeling from local and cross-station data using three tree-based machine learning models. J. Hydrol. 2018, 566, 668–684. [Google Scholar] [CrossRef]
  24. Eray, O.; Mert, C.; Kisi, O. Comparison of multi-gene genetic programming and dynamic evolving neural-fuzzy inference system in modeling pan evaporation. Hydrol. Res. 2017, 49, 1221–1233. [Google Scholar] [CrossRef]
  25. Adnan, R.M.; Malik, A.; Kumar, A.; Parmar, K.S.; Kisi, O. Pan evaporation modeling by three different neuro-fuzzy intelligent systems using climatic inputs. Arab. J. Geosci. 2019, 12, 606. [Google Scholar] [CrossRef]
  26. Moazenzadeh, R.; Mohammadi, B.; Shamshirband, S.; Chau, K. Coupling a firefly algorithm with support vector regression to predict evaporation in northern Iran. Eng. Appl. Comput. Fluid Mech. 2018, 12, 584–597. [Google Scholar] [CrossRef] [Green Version]
  27. Salih, S.Q.; Sharafati, A.; Khosravi, K.; Faris, H.; Kisi, O.; Tao, H.; Ali, M.; Yaseen, Z.M. River suspended sediment load prediction based on river discharge information: Application of newly developed data mining models. Hydrol. Sci. J. 2019, 65, 624–637. [Google Scholar] [CrossRef]
  28. Ghorbani, M.A.; Deo, R.C.; Yaseen, Z.M.; HKashani, M.; Mohammadi, B. Pan evaporation prediction using a hybrid multilayer perceptron-firefly algorithm (MLP-FFA) model: Case study in North Iran. Theor. Appl. Climatol. 2018, 133, 1119–1131. [Google Scholar] [CrossRef]
  29. Feng, Y.; Jia, Y.; Zhang, Q.; Gong, D.; Cui, N. National-scale assessment of pan evaporation models across different climatic zones of China. J. Hydrol. 2018, 564, 314–328. [Google Scholar] [CrossRef]
  30. Sharafati, A.; Tafarojnoruz, A.; Shourian, M.; Yaseen, Z.M. Simulation of the depth scouring downstream sluice gate: The validation of newly developed data-intelligent models. J. Hydro Environ. Res. 2020, 29, 20–30. [Google Scholar] [CrossRef]
  31. Mohammed, M.; Sharafati, A.; Al-Ansari, N.; Yaseen, Z.M. Shallow Foundation Settlement Quantification: Application of Hybridized Adaptive Neuro-Fuzzy Inference System Model. Adv. Civ. Eng. 2020, 2020, 1–14. [Google Scholar] [CrossRef] [Green Version]
  32. Kisi, O.; Heddam, S. Evaporation modelling by heuristic regression approaches using only temperature data. Hydrol. Sci. J. 2019, 64, 653–672. [Google Scholar] [CrossRef]
  33. Shiri, J. Evaluation of a neuro-fuzzy technique in estimating pan evaporation values in low-altitude locations. Meteorol. Appl. 2019, 26, 204–212. [Google Scholar] [CrossRef] [Green Version]
  34. Deo, R.C.; Ghorbani, M.A.; Samadianfard, S.; Maraseni, T.; Bilgili, M.; Biazar, M. Multi-layer perceptron hybrid model integrated with the firefly optimizer algorithm for windspeed prediction of target site using a limited set of neighboring reference station data. Renew. Energy 2018, 116, 309–323. [Google Scholar] [CrossRef]
  35. Malik, A.; Kumar, A.; Kisi, O. Monthly pan-evaporation estimation in Indian central Himalayas using different heuristic approaches and climate based models. Comput. Electron. Agric. 2017, 143, 302–313. [Google Scholar] [CrossRef]
  36. Rezaie-Balf, M.; Kisi, O.; Chua, L.H.C. Application of ensemble empirical mode decomposition based on machine learning methodologies in forecasting monthly pan evaporation. Hydrol. Res. 2019, 50, 498–516. [Google Scholar] [CrossRef]
  37. Malik, A.; Kumar, A.; Kisi, O. Daily Pan Evaporation Estimation Using Heuristic Methods with Gamma Test. J. Irrig. Drain. Eng. 2018, 144, 04018023. [Google Scholar] [CrossRef]
  38. Salih, S.Q.; Allawi, M.F.; Yousif, A.A.; Armanuos, A.M.; Saggi, M.K.; Ali, M.; Shahid, S.; Al-Ansari, N.; Yaseen, Z.M.; Chau, K.-W. Viability of the advanced adaptive neuro-fuzzy inference system model on reservoir evaporation process simulation: Case study of Nasser Lake in Egypt. Eng. Appl. Comput. Fluid Mech. 2019, 13, 878–891. [Google Scholar] [CrossRef] [Green Version]
  39. Wang, L.; Kisi, O.; Zounemat-Kermani, M.; Gan, Y. Comparison of six different soft computing methods in modeling evaporation in different climates. Hydrol. Earth Syst. Sci. Discuss. 2016, 20, 1–51. [Google Scholar] [CrossRef]
  40. Wang, L.; Niu, Z.; Kisi, O.; Li, C.; Yu, D. Pan evaporation modeling using four different heuristic approaches. Comput. Electron. Agric. 2017, 140, 203–213. [Google Scholar] [CrossRef]
  41. Wang, L.; Kisi, O.; Zounemat-Kermani, M.; Li, H. Pan evaporation modeling using six different heuristic computing methods in different climates of China. J. Hydrol. 2017, 544, 407–427. [Google Scholar] [CrossRef]
  42. Wang, L.; Kisi, O.; Hu, B.; Bilal, M.; Zounemat-Kermani, M.; Li, H. Evaporation modelling using different machine learning techniques. Int. J. Climatol. 2017, 37, 1076–1092. [Google Scholar] [CrossRef]
  43. Aytek, A. Co-active neurofuzzy inference system for evapotranspiration modeling. Soft Comput. 2009, 13, 691–700. [Google Scholar] [CrossRef]
  44. Stefánsson, A.; Končar, N.; Jones, A.J. A note on the gamma test. Neural Comput. Appl. 1997, 5, 131–133. [Google Scholar] [CrossRef]
  45. Moghaddamnia, A.; Ghafari Gousheh, M.; Piri, J.; Amin, S.; Han, D. Evaporation estimation using artificial neural networks and adaptive neuro-fuzzy inference system techniques. Adv. Water Resour. 2009, 32, 88–97. [Google Scholar] [CrossRef]
  46. Malik, A.; Kumar, A. Comparison of soft-computing and statistical techniques in simulating daily river flow: A case study in India. J. Soil Water Conserv. 2018, 17, 192–199. [Google Scholar] [CrossRef]
  47. Ashrafzadeh, A.; Malik, A.; Jothiprakash, V.; Ghorbani, M.A.; Biazar, S.M. Estimation of daily pan evaporation using neural networks and meta-heuristic approaches. ISH J. Hydraul. Eng. 2018, 24, 1–9. [Google Scholar] [CrossRef]
  48. Kakaei Lafdani, E.; Moghaddam Nia, A.; Ahmadi, A. Daily suspended sediment load prediction using artificial neural networks and support vector machines. J. Hydrol. 2013, 478, 50–62. [Google Scholar] [CrossRef]
  49. Malik, A.; Kumar, A.; Kisi, O.; Shiri, J. Evaluating the performance of four different heuristic approaches with Gamma test for daily suspended sediment concentration modeling. Environ. Sci. Pollut. Res. 2019, 26, 22670–22687. [Google Scholar] [CrossRef]
  50. Remesan, R.; Shamim, M.A.; Han, D.; Mathew, J. Runoff prediction using an integrated hybrid modelling scheme. J. Hydrol. 2009, 372, 48–60. [Google Scholar] [CrossRef]
  51. Goyal, M.K. Modeling of Sediment Yield Prediction Using M5 Model Tree Algorithm and Wavelet Regression. Water Resour. Manag. 2014, 28, 1991–2003. [Google Scholar] [CrossRef]
  52. Rashidi, S.; Vafakhah, M.; Lafdani, E.K.; Javadi, M.R. Evaluating the support vector machine for suspended sediment load forecasting based on gamma test. Arab. J. Geosci. 2016, 9, 583. [Google Scholar] [CrossRef]
  53. Malik, A.; Kumar, A.; Piri, J. Daily suspended sediment concentration simulation using hydrological data of Pranhita River Basin, India. Comput. Electron. Agric. 2017, 138, 20–28. [Google Scholar] [CrossRef]
  54. Malik, A.; Kumar, A. Pan Evaporation Simulation Based on Daily Meteorological Data Using Soft Computing Techniques and Multiple Linear Regression. Water Resour. Manag. 2015, 29, 1859–1872. [Google Scholar] [CrossRef]
  55. Piri, J.; Amin, S.; Moghaddamnia, A.; Keshavarz, A.; Han, D.; Remesan, R. Daily pan evaporation modeling in a hot and dry climate. J. Hydrol. Eng. 2009, 14, 803–811. [Google Scholar] [CrossRef]
  56. Singh, A.; Malik, A.; Kumar, A.; Kisi, O. Rainfall-runoff modeling in hilly watershed using heuristic approaches with gamma test. Arab. J. Geosci. 2018, 11, 261. [Google Scholar] [CrossRef]
  57. Jang, J.-S.R.; Sun, C.-T.; Mizutani, E. Neuro-Fuzzy and Soft Computing A Computational Approach to Learning and Machine Intelligence; Prentice-Hall: Upper Saddle River, NJ, USA, 1997. [Google Scholar]
  58. Haykin, S. Neural Networks—A Comprehensive Foundation, 2nd ed.; Prentice-Hall: Upper Saddle River, NJ, USA, 1999; pp. 26–32. [Google Scholar]
  59. Yaseen, Z.M.; El-Shafie, A.; Afan, H.A.; Hameed, M.; Mohtar, W.H.M.W.; Hussain, A. RBFNN versus FFNN for daily river flow forecasting at Johor River, Malaysia. Neural Comput. Appl. 2015, 27, 1533–1542. [Google Scholar] [CrossRef]
  60. Ghorbani, M.A.; Asadi, H.; Makarynskyy, O.; Makarynska, D.; Yaseen, Z.M. Augmented chaos-multiple linear regression approach for prediction of wave parameters. Eng. Sci. Technol. Int. J. 2017, 20, 1180–1191. [Google Scholar] [CrossRef]
  61. Penman, H.L. Natural evaporation from open water, bare soil and grass. Proc. R. Soc. Lond. A 1948, 193, 120–145. [Google Scholar]
  62. Penman, H.L. Evaporation: An introductory survey. J. Agric. Sci. 1956, 9, 9–29. [Google Scholar]
  63. Allen, R.G.; Pereira, L.S.; Raes, D.; Smith, M. Crop evapotranspiration: Guidelines for computing crop requirements. FAO Irrig. Drain. Pap. 1998, 56, 300. [Google Scholar]
  64. Taylor, K.E. Summarizing multiple aspects of model performance in a single diagram. J. Geophys. Res. Atmos. 2001, 106, 7183–7192. [Google Scholar] [CrossRef]
  65. Shiri, J. Improving the performance of the mass transfer-based reference evapotranspiration estimation approaches through a coupled wavelet-random forest methodology. J. Hydrol. 2018, 561, 737–750. [Google Scholar] [CrossRef]
  66. Tao, H.; Diop, L.; Bodian, A.; Djaman, K.; Ndiaye, P.M.; Yaseen, Z.M. Reference evapotranspiration prediction using hybridized fuzzy model with firefly algorithm: Regional case study in Burkina Faso. Agric. Water Manag. 2018, 208, 140–151. [Google Scholar] [CrossRef]
  67. Malik, A.; Kumar, A.; Ghorbani, M.A.; Kashani, M.H.; Kisi, O.; Kim, S. The viability of co-active fuzzy inference system model for monthly reference evapotranspiration estimation: Case study of Uttarakhand State. Hydrol. Res. 2019, 50, 1623–1644. [Google Scholar] [CrossRef] [Green Version]
  68. Nash, J.E.; Sutcliffe, J.V. River flow forecasting through conceptual models part I—A discussion of principles. J. Hydrol. 1970, 10, 282–290. [Google Scholar] [CrossRef]
  69. Khosravi, K.; Mao, L.; Kisi, O.; Yaseen, Z.M.; Shahid, S. Quantifying Hourly Suspended Sediment Load Using Data Mining Models: Case Study of a Glacierized Andean Catchment in Chile. J. Hydrol. 2018, 65, 624–637. [Google Scholar] [CrossRef]
  70. Malik, A.; Kumar, A.; Singh, R.P. Application of Heuristic Approaches for Prediction of Hydrological Drought Using Multi-scalar Streamflow Drought Index. Water Resour. Manag. 2019, 33, 3985–4006. [Google Scholar] [CrossRef]
  71. Willmott, C.J. On the validation of models. Phys. Geogr. 1981, 2, 184–194. [Google Scholar] [CrossRef]
  72. Malik, A.; Kumar, A. Meteorological drought prediction using heuristic approaches based on effective drought index: A case study in Uttarakhand. Arab. J. Geosci. 2020, 13, 276. [Google Scholar] [CrossRef]
  73. Yaseen, Z.M.; Awadh, S.M.; Sharafati, A.; Shahid, S. Complementary data-intelligence model for river flow simulation. J. Hydrol. 2018, 567, 180–190. [Google Scholar] [CrossRef]
  74. Keskin, M.E.; Terzi, Ö.; Taylan, D. Estimating daily pan evaporation using adaptive neural-based fuzzy inference system. Theor. Appl. Climatol. 2009, 98, 79–87. [Google Scholar] [CrossRef]
  75. Sanikhani, H.; Kisi, O.; Nikpour, M.R.; Dinpashoh, Y. Estimation of Daily Pan Evaporation Using Two Different Adaptive Neuro-Fuzzy Computing Techniques. Water Resour. Manag. 2012, 26, 4347–4365. [Google Scholar] [CrossRef]
  76. Keskin, M.E.; Terzi, Ö. Artificial Neural Network Models of Daily Pan Evaporation. J. Hydrol. Eng. 2006, 11, 65–70. [Google Scholar] [CrossRef]
  77. Shirsath, P.B.; Singh, A.K. A Comparative Study of Daily Pan Evaporation Estimation Using ANN, Regression and Climate Based Models. Water Resour. Manag. 2010, 24, 1571–1581. [Google Scholar] [CrossRef]
  78. Goyal, M.K.; Bharti, B.; Quilty, J.; Adamowski, J.; Pandey, A. Modeling of daily pan evaporation in sub tropical climates using ANN, LS-SVR, Fuzzy Logic, and ANFIS. Expert Syst. Appl. 2014, 41, 5267–5276. [Google Scholar] [CrossRef]
  79. Malik, A.; Kumar, A.; Kim, S.; Kashani, M.H.; Karimi, V.; Sharafati, A.; Ghorbani, M.A.; Al-Ansari, N.; Salih, S.Q.; Yaseen, Z.M. Modeling monthly pan evaporation process over the Indian central Himalayas: Application of multiple learning artificial intelligence model. Eng. Appl. Comput. Fluid Mech. 2020, 14, 323–338. [Google Scholar] [CrossRef] [Green Version]
  80. Mirjalili, S.; Gandomi, A.H.; Mirjalili, S.Z.; Saremi, S.; Faris, H.; Mirjalili, S.M. Salp Swarm Algorithm: A bio-inspired optimizer for engineering design problems. Adv. Eng. Softw. 2017, 114, 163–191. [Google Scholar] [CrossRef]
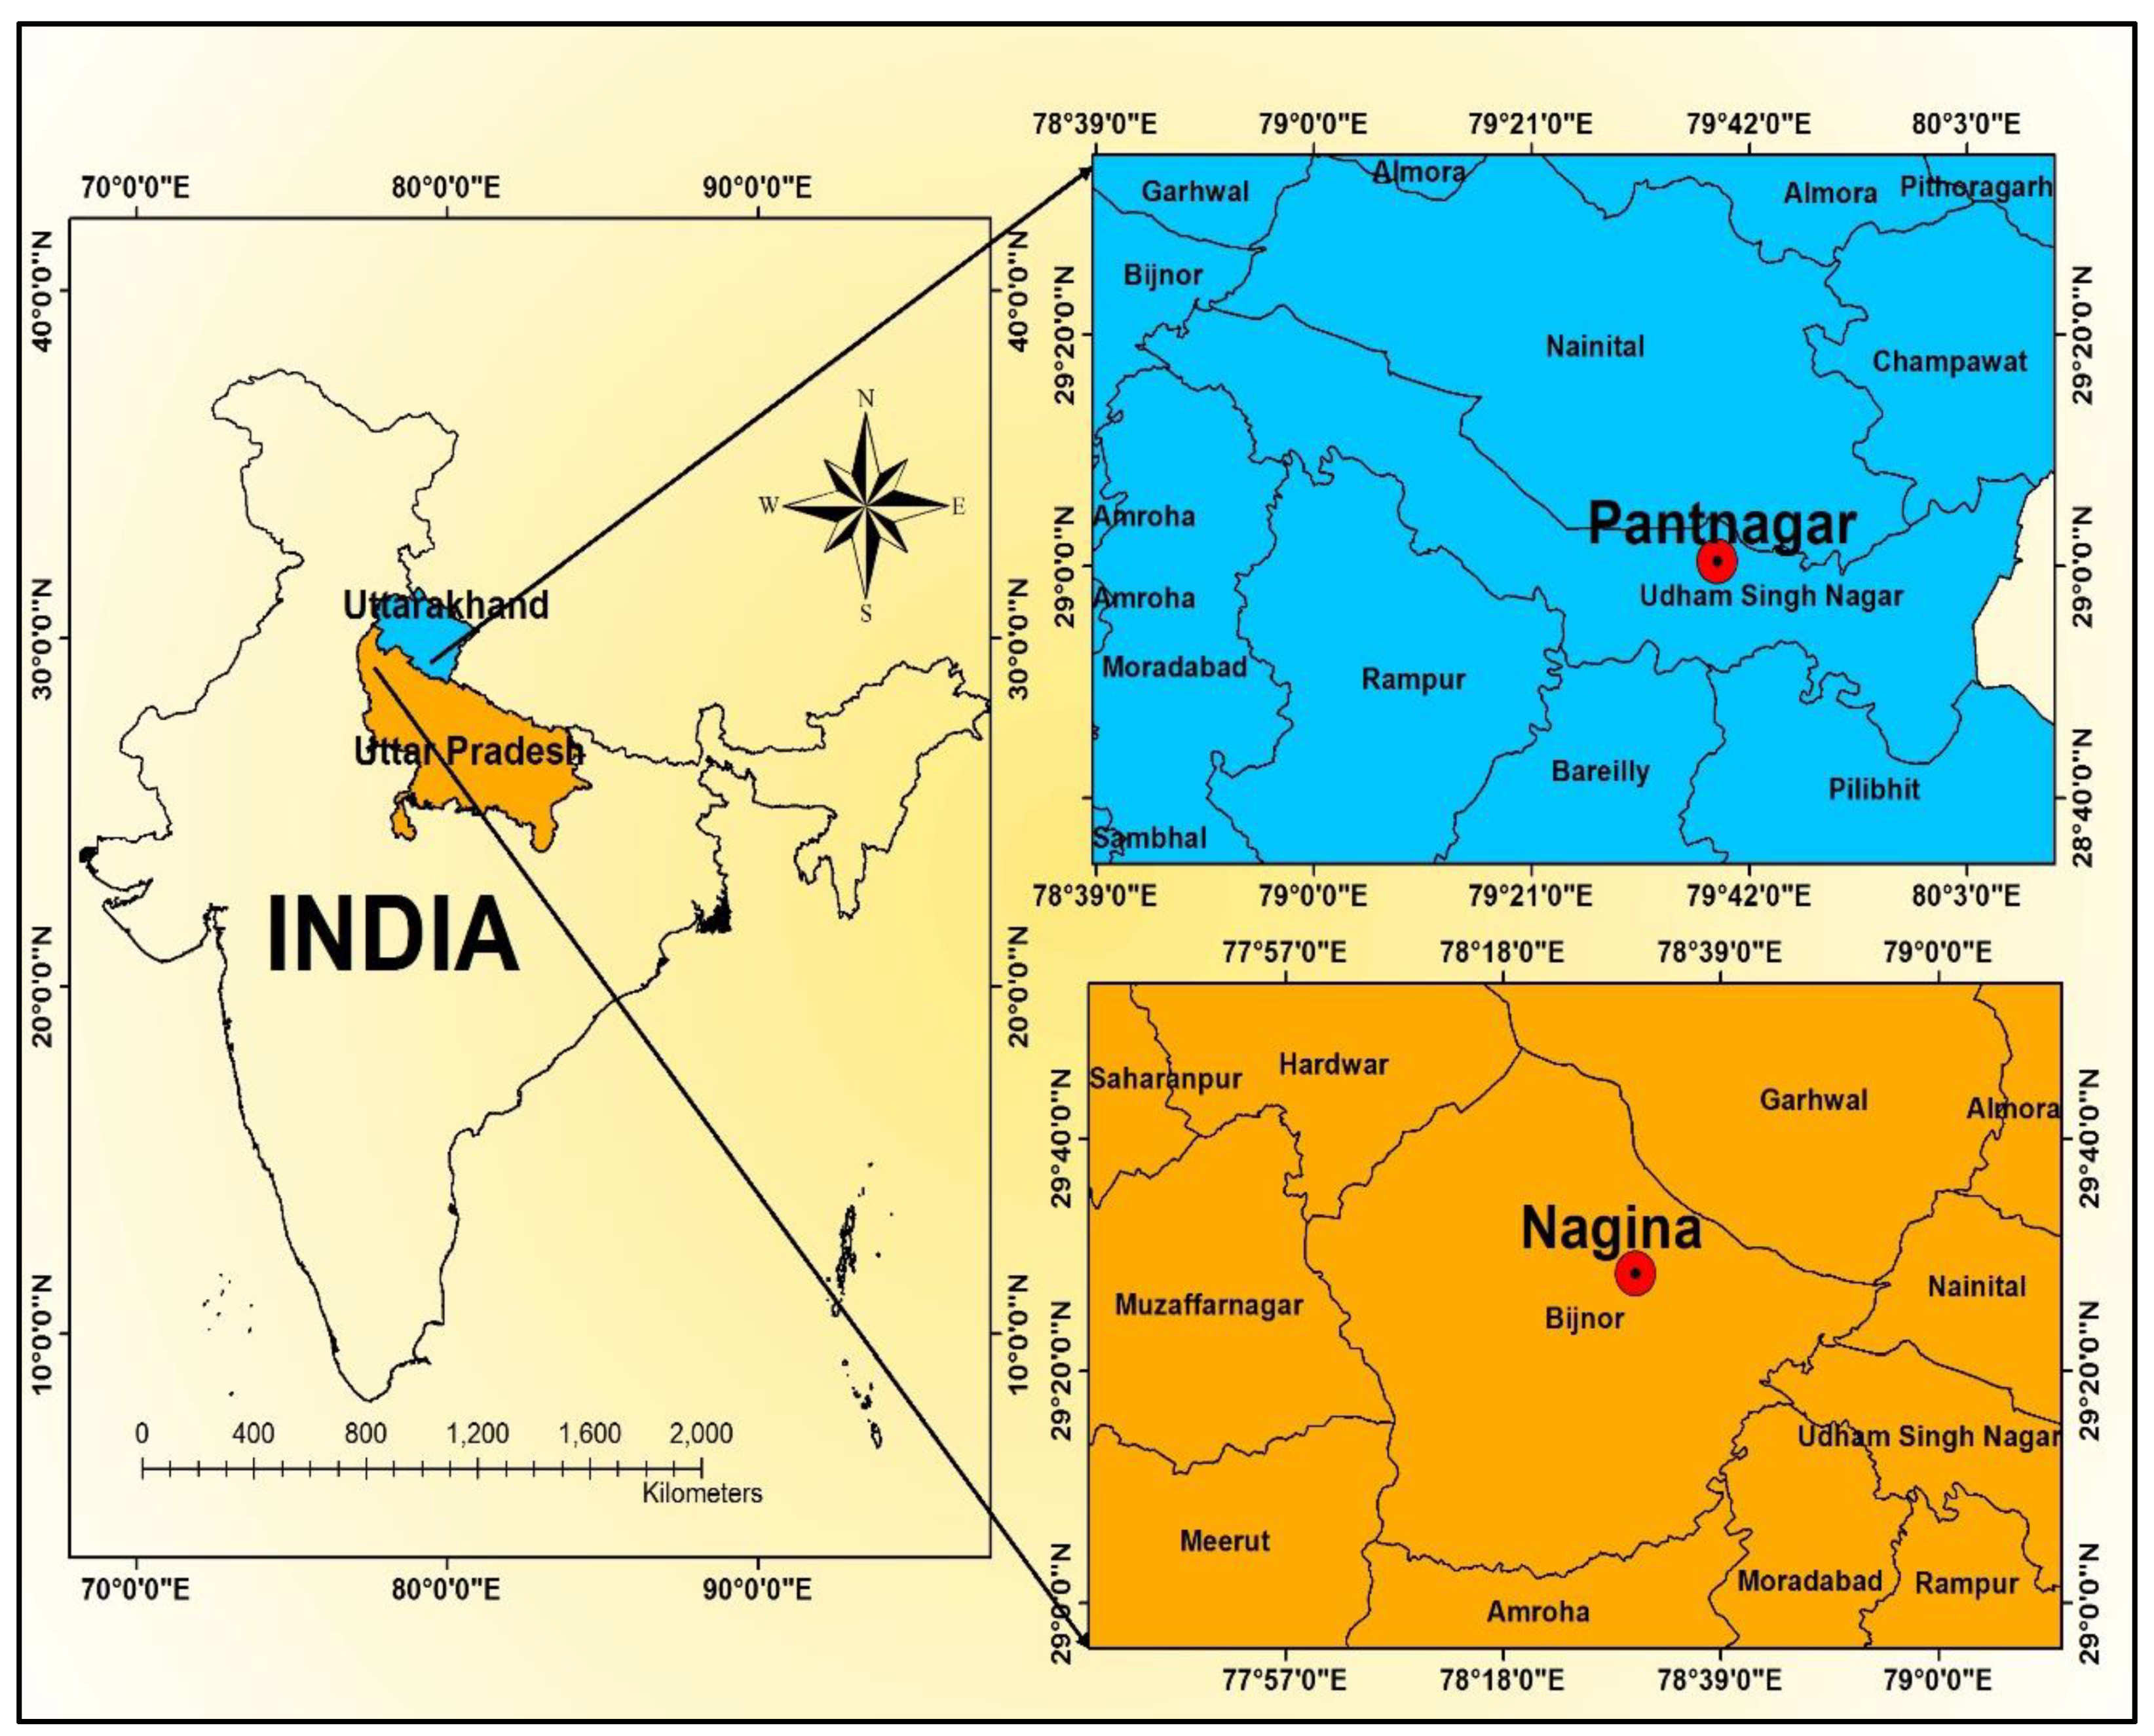
Figure 1. The coordinates of the investigated meteorological stations in Uttarakhand State and Uttar Pradesh State, India.
Atmosphere 11 00553 g001
Figure 2. Box and whisker plot of climatic variables at (a) Pantnagar and (b) Nagina stations.
Atmosphere 11 00553 g002
Figure 3. Hierarchy network of the co-active neuro-fuzzy inference system (CANFIS) model.
Atmosphere 11 00553 g003
Figure 4. Configuration of the three-layer multilayer perceptron neural network (MLPNN) model.
Atmosphere 11 00553 g004
Figure 5. Percentage of training and testing datasets in the four different scenarios.
Atmosphere 11 00553 g005
Figure 6. GT statistics of different models at (a) Pantnagar and (b) Nagina stations.
Atmosphere 11 00553 g006aAtmosphere 11 00553 g006b
Figure 7. Comparison plots of observed and estimated monthly pan-evaporation values yielded by the CANFIS-1, MLPNN-1, MLR-1, and PM models in (a) scenario-1, (b) scenario-2, (c) scenario-3, and (d) scenario-4 during the testing period at Pantnagar station.
Atmosphere 11 00553 g007
Figure 8. Relative error (RE) percentage distribution of the CANFIS-1, MLPNN-1, MLR-1, and PM models for (a) scenario-1, (b) scenario-2, (c) scenario-3, and (d) scenario-4 during the testing period at Pantnagar station.
Atmosphere 11 00553 g008
Figure 9. Taylor diagram (TD) of observed and estimated monthly evaporation obtained by the CANFIS-1, MLPNN-1, MLR-1, and PM models in (a) scenario-1, (b) scenario-2, (c) scenario-3, and (d) scenario-4 during the testing period at Pantnagar station.
Atmosphere 11 00553 g009
Figure 10. Comparison plots of observed and estimated monthly pan-evaporation values yielded by the CANFIS-1, MLPNN-1, and MLR-1 models in (a) scenario-1, (b) scenario-2, (c) scenario-3, and (d) scenario-4 during the testing period at Nagina station.
Atmosphere 11 00553 g010
Figure 11. RE percentage distribution of the CANFIS-1, MLPNN-1, MLR-1, and PM models in (a) scenario-1, (b) scenario-2, (c) scenario-3, and (d) scenario-4 during the testing period at Nagina station.
Atmosphere 11 00553 g011
Figure 12. Taylor plot of observed and estimated monthly evaporation obtained by the CANFIS-1, MLPNN-1, MLR-1, and PM models in (a) scenario-1, (b) scenario-2, (c) scenario-3, and (d) scenario-4 during the testing period at Nagina station.
Atmosphere 11 00553 g012
Table 1. Statistical constraints of climatic variables at the study stations during 2009–2016.
Station/Climatic VariableStatistical Parameters
MinimumMaximumMeanStdSkewnessKurtosis
PantnagarTmin (oC)5.8026.3017.277.07−0.15−1.55
Tmax (oC)16.5040.1029.945.88−0.48−0.54
RH-1 (%)59.0096.0084.309.72−1.230.21
RH-2 (%)19.0077.0051.3815.04−0.16−0.99
WS (km/h)2.109.905.091.900.37−0.43
SSH (h)2.609.906.581.92−0.21−0.90
EPm (mm)1.0011.404.432.650.91−0.16
NaginaTmin (oC)5.4026.5016.847.40−0.14−1.55
Tmax (oC)16.1040.1029.145.94−0.47−0.54
RH-1 (%)20.2099.0088.9012.34−2.449.08
RH-2 (%)23.0081.0055.0314.63−0.04−0.89
WS (km/h)1.007.003.771.520.21−0.92
SSH (h)2.8010.106.981.86−0.28−0.79
EPm (mm)0.908.403.712.030.52−0.76
Note: std represents the standard deviation.
Table 2. Inter-correlation between the climatic variables at the study stations.
Station/Climatic VariableTminTmaxRH-1RH-2WSSSHEPm
PantnagarTmin1.00
Tmax0.84 *1.00
RH-1−0.47 *−0.79 *1.00
RH-20.21 *−0.35 *0.65 *1.00
WS0.57 *0.62 *−0.75 *−0.23 *1.00
SSH0.120.58 *−0.64 *−0.80 *0.28 *1.00
EPm0.63 *0.88 *−0.95 *−0.52 *0.82 *0.59 *1.00
NaginaTmin1.00
Tmax0.85 *1.00
RH-1−0.48 *−0.70 *1.00
RH-20.23 *−0.26 *0.55 *1.00
WS0.50 *0.54 *−0.61 *−0.181.00
SSH0.21 *0.61 *−0.60 *−0.74 *0.38 *1.00
EPm0.73 *0.88 *−0.82 *−0.37 *0.77 *0.64 *1.00
* Statistically significant at a 5% level of significance.
Table 3. Contribution of different climatic variables to the composition of the seven models at the study stations.
Climatic
Variables
CANFIS/MLPNN/MLR
1234567
Tmin
Tmax
RH-1
RH-2
WS
SSH
Note: √ is used to indicate the input variable for different combinations.
Table 4. Gamma test (GT) results on different input combinations at the study stations.
Various Input CombinationsGT Statistic
ΓASEVratioMask
PantnagarTmin, Tmax, RH-1, RH-2, WS, SSH0.00170.06650.00130.0070111111
Tmax, WS, SSH0.01090.09050.00230.0436010011
Tmax, RH-2, WS0.00500.13750.00310.0199010110
Tmax, RH-2, SSH0.01050.15480.00710.0419010101
Tmax, WS0.01190.19340.00310.0476010010
Tmax, SSH0.01180.34410.00420.0474010001
Tmax0.01560.32020.00240.0623010000
NaginaTmin, Tmax, RH-1, RH-2, WS, SSH0.01120.03950.00240.0448111111
Tmax, WS, SSH0.01790.07040.00480.0718010011
Tmax, RH-2, WS0.01630.08210.00470.0652010110
Tmax, RH-2, SSH0.01890.15280.00580.0756010101
Tmax, WS0.01630.27860.00470.0653010010
Tmax, SSH0.02470.26520.00710.0989010001
Tmax0.03700.35760.00550.1479010000
Table 5. Normalized root mean square error (NRMSE), Nash–Sutcliffe efficiency (NSE), Pearson correlation coefficient (PCC), and Willmott index (WI) values of CANFIS, MLPNN, multiple linear regression (MLR), and Penman model (PM) models during the testing period at Pantnagar station under four different scenarios.
ModelStructureTesting Period
NRMSE
(mm/month)
NSEPCCWI
Scenario-1CANFIS-1Bell-30.13640.94390.97900.9860
MLPNN-16-9-10.14040.94060.97510.9857
MLR-1-0.14020.94080.97680.9851
PM-0.9585−1.76720.80470.5590
Scenario-2CANFIS-1Gauss-20.09040.97360.98720.9934
MLPNN-16-11-10.09200.97260.98670.9932
MLR-1-0.11100.96020.98180.9903
PM-0.9871−2.14740.82240.5486
Scenario-3CANFIS-1Gauss-30.09470.97030.98770.9927
MLPNN-16-10-10.09930.96740.98740.9918
MLR-1-0.10850.96110.98310.9905
PM-0.9994−2.30510.85110.5416
Scenario-4CANFIS-1Gauss-20.08980.97990.99220.9949
MLPNN-16-9-10.10210.97400.98770.9934
MLR-1-0.10560.97210.98850.9927
PM-0.9168−1.10160.81030.5957
Table 6. NRMSE, NSE, PCC, and WI values of the CANFIS, MLPNN, and MLR models during the testing period at Nagina station under four different scenarios.
ModelStructureTesting Period
NRMSE
(mm/month)
NSEPCCWI
Scenario-1CANFIS-1Gauss-30.15430.91500.96430.9794
MLPNN-16-10-10.18130.88270.95920.9723
MLR-1-0.18660.87580.94370.9698
PM 1.3464−5.46770.85070.4585
Scenario-2CANFIS-1Gauss-20.17190.89620.96490.9761
MLPNN-16-10-10.18990.87340.94860.9699
MLR-1-0.22990.81440.93460.9579
PM 1.3989−5.87280.84700.4493
Scenario-3CANFIS-1Gauss-20.20670.83820.94730.9632
MLPNN-16-10-10.22810.80310.92470.9552
MLR-1-0.29390.67290.90490.9313
PM 1.3907−6.32130.81580.4291
Scenario-4CANFIS-1Gauss-20.13560.94530.97620.9853
MLPNN-16-10-10.14770.93510.97460.9820
MLR-1-0.16210.92190.96660.9789
PM 1.1789−3.12940.89610.5362