Abstract
The springtime dust events in Northeast Asia pose many economic, social, and health-related risks. Statistical models in the forecasting of seasonal dust events do not fully account for environmental variations in dust sources due to climate change. The Korea Meteorological Administration (KMA) recently developed the GloSea5-ADAM, a numerically based seasonal dust forecasting model, by incorporating the Asian Dust and Aerosol Model (ADAM)’s emission algorithm into Global Seasonal Forecasting Model version 5 (GloSea5). The performance of GloSea5 and GloSea5-ADAM in forecasting seasonal Asian dust events in source (China) and leeward (South Korea) regions was compared. The GloSea5-ADAM solved the limitations of GloSea5, which were mainly attributable to GloSea5′s low bare-soil fraction, and successfully simulated 2017 springtime dust emissions over Northeast Asia. The results show that GloSea5-ADAM’s 2017 and 2018 forecasts were consistent with surface PM10 mass concentrations observed in China and South Korea, while there was a large gap in 2019. This study shows that the geographical distribution and physical properties of soil in dust source regions are important. The GloSea5-ADAM model is only a temporary solution and is limited in its applicability to Northeast Asia; therefore, a globally applicable dust emission algorithm that considers a wide variety of soil properties must be developed.
1. Introduction
Strong winds in dry areas, such as deserts, can cause dust events [1]. Dust events in Northeast Asia frequently occur during spring [2,3,4], and as the dry areas of Eastern Mongolia and Manchuria expand, the frequency of Asian dust events in South Korea and Japan, which are located leeward of these dry areas, has increased [5]. Such dust events negatively affect the economy, society, and public health in Northeast Asia [1]. Therefore, the region’s populace closely monitors the frequency and intensity of Asian dust events. Many of the governmental institutions in the region, such as the China Meteorological Administration (CMA), the Japan Meteorological Agency (JMA), and the Korea Meteorological Administration (KMA), are developing and operating various Asian dust forecasting models, and are cooperating to increase the predictability of Asian dust events through their participation in the Asian node of the Sand and Dust Storm Warning Advisory and Assessment system (SDS-WAS) of the World Meteorological Organization (WMO) [1]. Numeric model-based Asian dust forecasting has been limited to short-term forecasts of approximately three days, and statistical methods based on regression modeling have generally been adopted for seasonal forecasting [6,7,8]. However, such statistical methods fail to reflect the environmental impact of climate change in dust source regions.
To overcome the limitations of seasonal Asian dust forecasting based on regression models, KMA has recently developed the GloSea5-ADAM, which incorporates the dust emission algorithm from the Asian Dust and Aerosol Model (ADAM), KMA’s operational Asian dust event prediction model, into the Global Seasonal Forecasting Model (version 5) (GloSea5), KMA’s numeric model for seasonal forecasting. KMA has begun employing GloSea5-ADAM for the seasonal forecasting of dust events within the limited scope of Northeast Asia. KMA’s numerically based seasonal Asian dust forecasting model is the first of its kind among the member nations of the WMO SDS-WAS Asian node. This study introduces GloSea5-ADAM and assesses its springtime seasonal dust event forecasts in source regions (China) and leeward areas (South Korea) from 2017–2019.
2. Experimental
2.1. GloSea5
KMA uses GloSea5, which is employed for seasonal forecasting. GloSea5 is a global coupled model that combines the Global Atmosphere model version 6.0 (GA6), Joint UK Land Environment Simulator (JULES), Nucleus for European Modelling of the Ocean (NEMO), and Los Alamos Sea Ice Model (CICE), and is the 5th version of the UK Meteorological Office’s ensemble prediction system for monthly to seasonal forecasting, based on the latest version of the Hadley Centre Global Environment Model version 3 (HadGEM3) [9,10,11,12]. The GloSea5 atmospheric model has a horizontal resolution of 0.83° × 0.56° and consists of 85 vertical layers, while JULES has 4 vertical layers. The ocean model has a horizontal resolution of 0.25° × 0.25° and 75 vertical layers [9].
GloSea5 calculates the dust mass concentration for two representative particle diameters (2 and 8 μm). The horizontal dust flux that determines the dust mass concentration is calculated via Equation (1) [13]:
where i refers to the bin number, is the air density at the surface, is the bare soil fraction in the grid-box and is inversely proportional to the leaf area index (LAI), is the threshold friction velocity of the corresponding bin number, is the bare soil friction velocity, excluding orographic effects, is the mass fraction of soil particles of the corresponding bin number, is a constant of proportionality, is a tunable parameter, and g is acceleration due to gravity. According to Equation (1), the horizontal dust flux increases in proportion to the bare soil fraction () in the GloSea5 model. Figure 1 shows the global distribution of the bare soil fraction ().
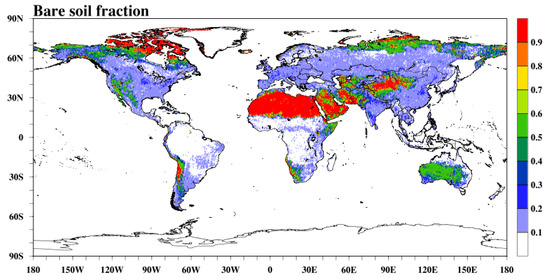
Figure 1.
The global distribution of the bare soil fraction () in the Global Seasonal Forecasting Model version 5 (GloSea5).
2.2. ADAM
The ADAM model was developed by incorporating the Asian dust emission algorithm, a chemical transport model developed by the United States Environmental Protection Agency (EPA), into the Community Multiscale Air Quality (CMAQ) model (version 4.7.1) [14,15]. The KMA has operated the ADAM model to forecast Asian dust events since 2007. The ADAM model has been continuously improved through various research projects [16,17]. Most recently, the KMA has improved version 3 of the ADAM model (ADAM3) by incorporating anthropogenic emissions and a daily dust emissions reduction factor [18] and assimilating PM data from surface stations and satellite-observed AOD data. ADAM3 is currently one of the inter-comparison models for Asian dust prediction, within the Asian node of the WMO SDS-WAS [1].
ADAM calculates dust mass concentrations for 11 representative particle diameters (0.50, 0.82, 1.35, 2.23, 3.67, 6.06, 10.0, 16.50, 27.25, 45.00, and 74.00 μm), and the horizontal dust flux is calculated via Equation (2) [19]:
where is the dust flux from the surface, is the friction velocity, is the threshold friction velocity, is the fractional coverage of the i-type of vegetation in the dust source grid, and is the reduction factor of the i-type of vegetation.
The dust emissions calculated by ADAM can reflect the changes in surface properties caused by the growth of grasses and crops in the source regions over time. The reduction of emissions via changes in surface properties is one of the most important factors in controlling the intensity of dust emissions across a source region [16,18]. Asian dust emissions are proportional to the fourth power of the friction velocity and are reduced by increased vegetation coverage. The major difference between those two equations for calculating the horizontal dust flux in the Glosea5 and ADAM is the distributions and magnitudes of B (bare soil fraction) and f (fractional coverage), which are related to the dust source regions, in Equation (1) and Equation (2), respectively.
2.3. Data
To validate the model simulations and springtime seasonal Asian dust forecasts, we used observed surface PM10 mass concentration data from 27 KMA sites, 250 sites from the Korea Ministry of Environment (MOE) in South Korea, and 1498 Chinese Ministry of Environmental Protection (MEP) sites in China. The springtime dust days used for KMA’s seasonal forecasting in South Korea were based on the dust events observed at the 13 KMA sites. Days when Asian dust events were observed at all 13 sites were given a value of 1, days when dust events were observed at n number of sites were given the values of n/13, and days when events were observed at none of the sites were given a value of 0. These values were totaled over the course of each spring (March 1–May 31). The climatology for GloSea5-ADAM’s forecast was based on a 20-year (1991–2010) hindcast.
3. Results and Discussion
3.1. Dust Simulations Using GloSea5, ADAM, and GloSea5-ADAM
3.1.1. GloSea5 Simulations
Figure 2a shows the global distribution of mean PM10 mass concentrations simulated in spring 2017 using GloSea5; high PM10 concentrations above 500 µg m−3 were simulated for the Sahara Desert and Arabian Desert, along with concentrations above 100 µg m−3 in arid regions of the Middle East, such as Iran, Pakistan, Afghanistan, as well as the Taklamakan Desert, and West Inner Mongolia. The global mean PM10 mass-concentration distribution shown in Figure 2a displays a pattern very similar to that of ’s global distribution in Figure 1. This suggests that the bare soil fraction, which indicates the degree of surface aridity in GloSea5, is a significant contributor to dust emission levels in GloSea5. Figure 2b zooms in on the GlosSea5 simulation for Northeast Asia. The gray area in Figure 2b shows the distribution of ; and the Northeast Asian areas with high PM10 concentrations above 100 µg m−3 all had values greater than 0.4. Unlike the surface PM10 mass concentrations observed in China and South Korea (Figure 3), GloSea5 rarely simulated PM10 concentrations greater than 100 µg m−3 at longitudes east of 110° E, due to the low bare soil fraction in Northeast Asia assumed by GloSea5. The light purple area in Figure 3 has values of 0.2–0.4, and the dark purple region has values of 0.4–0.6. The gray area is the Asian dust source region in ADAM (Figure 4), which was defined based on dust event occurrence statistics from three-hour SYNOP reports from 1998 to 2006, and is largely confined to northern China, Mongolia, northern India, and central Asia [20]. The Asian dust source region in ADAM is consistent with the arid and semi-arid regions of Northeast Asia, as shown in Google Maps [21]. Surface soils over the Asian dust source region in ADAM are categorized as Gobi, sand, loess, mixed, and Tibetan. The surface soil types of Asian dust source regions with values of 0.2 or higher in GloSea5 are mostly Gobi, sand, and Tibetan soils.
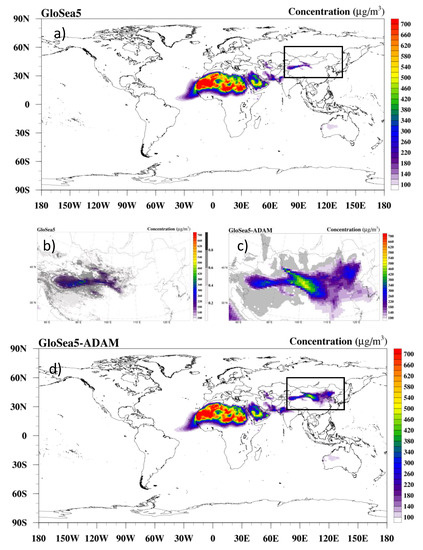
Figure 2.
(a) The global distribution of mean PM10 mass concentrations simulated (from 1 March to 31 May 2017) by GloSea5 and (b) a close-up view of Northeast Asia. (c) close-up of Northeast Asia. Unit: µg m−3 and (d) Global distribution simulated by the GloSea5-Asian Dust and Aerosol Model (ADAM). The gray area in (b) is bare soil fraction over 0.2 and in (c) indicates the Asian dust source regions in ADAM.
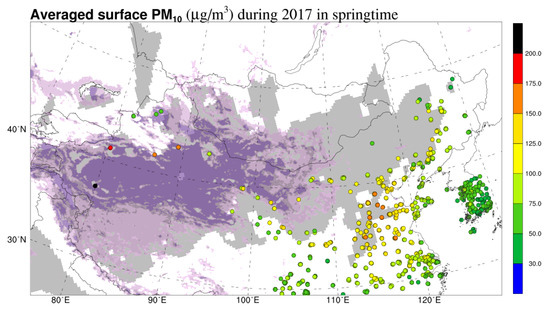
Figure 3.
Surface PM10 mass concentration observation data from 27 Korea Meteorological Administration (KMA) sites, 250 Korea Ministry of Environment (MOE) sites in South Korea, and 1498 Chinese Ministry of Environmental Protection (MEP) sites in China (units: µg m−3). The bare soil fraction (B) is 0.2–0.4 for areas in light purple and 0.4–0.6 for areas in dark purple. The gray area indicates ADAM’s Asian dust source regions.
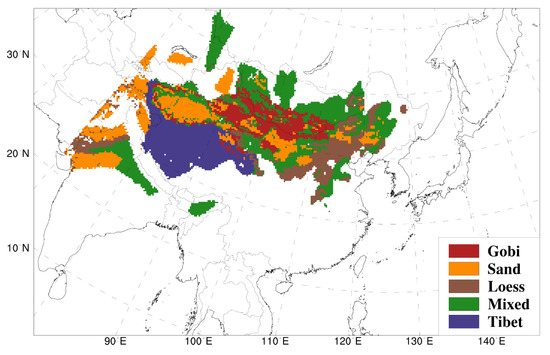
Figure 4.
Surface soil types in Asian dust source regions in the ADAM model (after Figure 1 of Park et al. [20]).
A total of 99% of 149 events of Asian dust that affected South Korea between years 2002 and 2018 were originated from the Gobi Desert, Inner Mongolia, and Northeastern China. As shown in Figure 2b, GloSea5 failed to simulate Asian dust events stemming from those regions, except for those from western Inner Mongolia, and, thus, is not suitable for the seasonal forecasting of Asian dust events in South Korea.
3.1.2. ADAM Simulations
Figure 5 shows the distribution of the mean dust PM10 mass concentrations in Northeast Asia simulated during spring 2017 using ADAM. This excludes ADAM’s simulation of non-dust (anthropogenic) PM10 mass concentrations. Though in some parts of the Gobi Desert and East Inner Mongolia relatively smaller PM10 mass concentrations were simulated, ADAM successfully simulated PM10 mass concentrations above 100 µg m−3 in most Asian dust source regions. ADAM also simulated high PM10 mass concentrations above 100 µg m−3 at longitudes east of 110° E, which the GloSea5 failed to simulate (GloSea5 simulations are shown in Figure 2a,b; ADAM simulations in Figure 5). This is attributed to the fact that ADAM defined this region as a source area for Asian dust. The PM10 mass concentrations above 100 µg m−3 outside the Asian dust source region, shown in Figure 3, appear to be a mixture of anthropogenic pollutants and Asian dust.
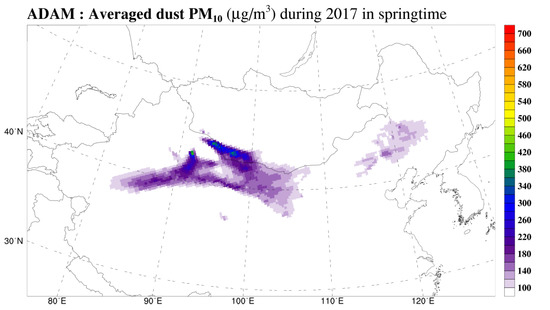
Figure 5.
The distribution of mean dust PM10 mass concentrations simulated by ADAM (from 1 March to 31 May 2017). Units: µg m−3.
3.1.3. GloSea5-ADAM Simulations
As GloSea5 failed to simulate Asian dust events in Northeast Asia (Figure 2a,b), ADAM’s dust emission algorithm and dust source regions were incorporated into GloSea5, within the limited scope of Northeast Asia. The combined model was named GloSea5-ADAM. The meteorological variables for horizontal dust flux calculations in GloSea5-ADAM were drawn from GloSea5, and five soil types of dust source regions and the dust emission reduction factor from ADAM were applied specifically for Northeast Asia. ADAM’s 11 particle sizes were converted into the two particle sizes (2 and 8 μm) of GloSea5.
Figure 2d shows the global distribution of mean PM10 mass concentrations simulated for spring 2017, using GloSea5-ADAM. High PM10 concentrations above 500 µg m−3 in the Sahara Desert and Arabian Desert and above 100 µg m−3 in dry Middle Eastern regions, such as Iran, Pakistan, and Afghanistan, which were simulated using GloSea5 (Figure 2a), are again shown in Figure 2d. Further, PM10 concentrations above 100 µg m−3 were successfully simulated at longitudes east of 110° E, which GloSea5 failed to simulate (Figure 2a), also shown in Figure 2d. Regarding simulations for Northeast Asia regions, the mean PM10 mass concentrations in West Inner Mongolia were slightly higher compared to those simulated by ADAM (Figure 5), but in the other regions, the mean PM10 mass concentrations were similar (Figure 2c). Though it is hard to compare GloSea5-ADAM simulations directly with the PM10 mass concentrations observed in West Inner Mongolia and the Taklamakan Desert, where PM10 levels were simulated to be above 300 µg m−3, as these regions do not have a sufficient observation network, the distribution of mean PM10 mass concentrations in the other regions shown in Figure 2c seemed to be in line with the observed values shown in Figure 3.
The simulation results were compared for the models using the scatter plots in Figure 6. Figure 6a–c show scatter plots of surface PM10 mass concentrations observed in China and South Korea (Figure 3) versus PM10 mass concentrations simulated for spring 2017 using GloSea5, GloSea5-ADAM, and ADAM, respectively. The correlation coefficients between PM10 concentrations observed and concentrations simulated for spring 2017 using GloSea5, GloSea5-ADAM, and ADAM are similar like 0.51, 0.49, and 0.59, respectively, but GloSea5 rarely simulated for high concentration of PM10 in northeastern Asia region compared to ADAM and GloSea5-ADAM. The mean bias and root mean square error (RMSE) are −195.75 µg m−3 and 121.76 µg m−3 for GloSea5, which are greater than those for GloSea5-ADAM (52.29 µg m−3 and 77.34 µg m−3) and ADAM (−37.78 µg m−3 and 49.65 µg m−3) both.
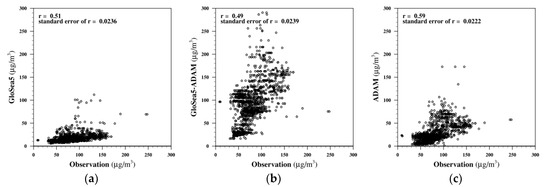
Figure 6.
The scatter plots of (a) GloSea5 versus Observation, (b) GloSea5-ADAM versus Observation, and (c) ADAM versus Observation (from 1 March to 31 May 2017).
Therefore, the results suggest that GloSea5-ADAM can successfully simulate springtime dust events in Northeast Asia rather than GloSea5 and that GloSea5-ADAM can be used for numerically based seasonal Asian dust forecasting.
3.2. Springtime Seasonal Asian Dust Forecasting Using GloSea5-ADAM
Figure 7 shows GloSea5-ADAM’s springtime seasonal Asian dust forecasts for the past three years (2017–2019). In this study, we specifically analyzed the model’s forecasts for Northeast Asia. Mean PM10 mass concentrations hindcasted from 1991 to 2010 were used as climatological data for forecasting (Figure 7a). Table 1 presents a 3 × 3 contingency analysis to verify the springtime seasonal Asian dust hindcast for South Korea, based on KMA’s three categories (below normal, normal, and above normal) for seasonal forecasting. The hit rate of and the Heidke skill score (HSS) of GloSea5-ADAM’s 1991–2010 hindcast were 0.5 and 0.25, respectively. The HSS was calculated as follows [22]:
where , , and are the joint distribution of the hindcast and observations, the marginal distribution of the hindcast, and the marginal distribution of the observations, respectively.
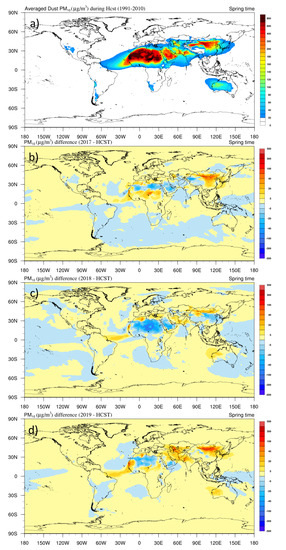
Figure 7.
Springtime seasonal Asian dust forecasts using GloSea5-ADAM (2017–2019). (a) Springtime mean PM10 mass concentrations in 20-year (1991–2010) hindcast and (b) springtime PM10 mass concentration anomalies from 2017 to 2019 (b–d). Units: µg m−3.

Table 1.
Contingency table for verification of springtime seasonal Asian dust hindcast (1991–2010) over South Korea.
In GloSea5-ADAM’s 2017 hindcast, there were positive anomalies in the Gobi Desert and Northeast China and negative anomalies in Northwest China (Figure 7b). A slight positive anomaly was also found in the Korean Peninsula. For 2018 (Figure 7c), there was a slight positive anomaly in the Gobi Desert, and negative anomalies in Northeast China and the Korean Peninsula. For 2019 (Figure 7d), there were strong positive anomalies in Gobi Desert and Northeast China, and a positive anomaly in the Korean Peninsula. Figure 8a shows the average surface PM10 mass concentrations observed in China and South Korea during the past three years (2017–2019), and Figure 8b–d show modeled and measured springtime PM10 mass concentration anomalies in the respective years. The measured anomalies (dots in figure) were calculated by subtracting the three-year average springtime mean PM10 concentrations from the springtime mean PM10 mass concentrations of each year. Northwest China was not analyzed due to a lack of observational data. In 2017 (Figure 8b), the negative measured anomaly in the Gobi Desert was inconsistent with the positive hindcast anomaly, but measured anomalies in the other regions were consistent with those of the hindcast. The strong positive measured anomaly in the Gobi Desert and negative measured anomalies in Northeast China and South Korea in 2018 (Figure 8c) were in line with the hindcast. However, the negative measured anomalies found in the 2019 observations (Figure 8d) were generally different from the those of the hindcast, which showed strong positive anomalies in the Gobi Desert and Northeast China and a positive anomaly in the Korean Peninsula. Similar results were observed for KMA’s three category-based (below average, normal, above average) forecasts for springtime Asian dust days in South Korea: 2017 (normal in hindcast, normal in observation), 2018 (below, below), and 2019 (above, below).
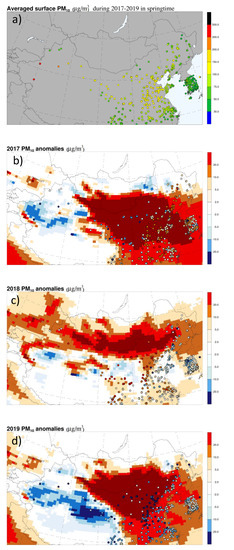
Figure 8.
(a) Springtime seasonal mean PM10 mass concentrations observations in South Korea and China averaged during the period from 2017 to 2019, and modeled (colored contour) and measured (dots) springtime PM10 mass concentration anomalies in each year from 2017 to 2019 (b–d).
4. Conclusions
Several national weather services and research centers worldwide are operating numerical models for dust forecasting [1]. In such dust forecasting models, friction velocity is the most significant influencing factor, but the geographic distribution and soil properties of dust source regions are also important. As the dust emission algorithm in GloSea5, which is used currently at KMA for seasonal forecasting, was developed based on the Sahara Desert [23], it does not incorporate dust emissions from loess and mixed surface-soil types in Northeast Asia, such as those found in key Asian dust source regions, including East Inner Mongolia and Northeast China.
This study examined springtime seasonal Asian dust forecasting using GloSea5-ADAM, which was developed by incorporating the Asian dust emission algorithm and Asian dust source region of ADAM into GloSea5, within the limited scope of Northeast Asia. The hit rate of and the HSS of the springtime Asian dust hindcast over South Korea for the period of 1991–2010 were 0.5 and 0.25, respectively. GloSea5-ADAM’s 2017 and 2018 simulation results were nearly consistent with the intra-annual variations of surface PM10 mass concentrations observed in China and South Korea, but the 2019 forecast was substantially different from the observations.
GloSea5-ADAM is only a temporary solution to existing shortcomings in forecasting models and is only applicable for Northeast Asia. Therefore, it is necessary to develop a global dust model that employs a globally applicable dust emission algorithm, and considers the wide variety of global surface soil properties. To combat SDS, the United Nations Convention to Combat Desertification (UNCCD), in collaboration with the United Nations Environment Programme (UNEP) and the WMO, have recently been developing a global SDS-source base-map. It is designed as a set of geo-referenced numerical maps at the 1-km resolution, and focuses on soil surface status, including textural and structural soil parameters, moisture, and temperature, as well as vegetation coverage, to better detect active and dormant SDS sources [24]. The predictive abilities of global dust models will improve with the development of a globally applicable dust emission algorithm and the identification of dust-source regions, based on the completed global SDS-source base-map.
Author Contributions
Conceptualization, S.-B.R. and Y.-K.L.; methodology, S.-B.R. and Y.-K.L.; software, Y.-K.L.; validation, S.-B.R. and Y.-K.L. and Y.-S.P.; formal analysis, Y.-S.P.; investigation, Y.-S.P.; resources, Y.-K.L.; data curation, Y.-K.L.; writing—original draft preparation, S.-B.R.; writing—review and editing, S.-B.R. and Y.-K.L.; visualization, Y.-K.L.; supervision, Y.-S.P.; project administration, Y.-S.P.; funding acquisition, Y.-S.P. All authors have read and agreed to the published version of the manuscript.
Funding
This research was funded by the Korea Meteorological Administration Research and Development Program “Development of Asian Dust and Haze Monitoring and Prediction Technology” under Grant (KMA201800521).
Acknowledgments
The China PM10 data product was retrieved from the following website: https://106.37.208.233:20035/.
Conflicts of Interest
The authors declare no conflict of interest.
References
- UNEP; WMO; UNCCD. Global Assessment of Sand and Dust Storms; United Nations Environment Programme: Nairobi, Kenya, 2016. [Google Scholar]
- Chun, Y.; Boo, K.O.; Kim, J.; Park, S.U.; Lee, M. Synopsis, transport, and physical characteristics of Asian dust in Korea. J. Geophys. Res. Atmos. 2001, 106, 18461–18469. [Google Scholar] [CrossRef]
- Kim, J. Transport routes and source regions of Asian dust observed in Korea during the past 40 years (1965–2004). Atmos. Environ. 2008, 42, 4778–4789. [Google Scholar] [CrossRef]
- Shao, Y.; Klose, M.; Wyrwoll, K.H. Recent global dust trend and connections to climate forcing. J. Geophys. Res. Atmos. 2013, 118, 11–107. [Google Scholar] [CrossRef]
- Lee, E.H.; Sohn, B.J. Recent increasing trend in dust frequency over Mongolia and Inner Mongolia regions and its association with climate and surface condition change. Atmos. Environ. 2011, 45, 4611–4616. [Google Scholar] [CrossRef]
- Gao, T.; Zhang, X.; Wulan. A seasonal forecast scheme for spring dust storm predictions in Northern China. Meteorol. Appl. 2010, 17, 433–441. [Google Scholar]
- Sohn, K.T. Statistical guidance on seasonal forecast of Korean dust days over South Korea in the springtime. Adv. Atmos. Sci. 2013, 30, 1343–1352. [Google Scholar] [CrossRef]
- Pu, B.; Ginoux, P.; Kapnick, S.B.; Yang, X. Seasonal prediction potential for springtime dustiness in the United States. Geophys. Res. Lett. 2019, 46, 9163–9173. [Google Scholar] [CrossRef]
- Williams, K.D.; Harris, C.M.; Bodas-Salcedo, A.; Camp, J.; Comer, R.E.; Copsey, D.; Fereday, D.; Graham, T.; Hill, R.; Hinton, T.; et al. The Met Office global coupled model 2.0 (GC2) configuration. Geosci. Model Dev. 2015, 88, 1509–1524. [Google Scholar] [CrossRef]
- Walters, D.; Boutle, I.; Brooks, M.; Melvin, T.; Stratton, R.; Vosper, S.; Wells, H.; Williams, K.; Wood, N.; Allen, T.; et al. The Met Office Unified Model Global Atmosphere 6.0/6.1 and JULES Global Land 6.0/6.1 configurations. Geosci. Model Dev. 2017, 10, 1487–1520. [Google Scholar] [CrossRef]
- Madec, G. NEMO ocean engine. IPSL Technol. Rep. 2008, 27, 401. [Google Scholar]
- Rae, J.G.L.; Hewitt, H.T.; Keen, A.B.; Ridley, J.K.; West, A.E.; Harris, C.M.; Hunke, E.C.; Walters, D.N. Development of the Global Sea Ice 6.0 CICE configuration for the Met Office Global Coupled model. Geosci. Model Dev. 2015, 8, 2221–2230. [Google Scholar] [CrossRef]
- Marticorena, B.; Bergametti, G. Modeling the atmospheric dust cycle: 1. Design of a soil-derived dust emission scheme. J. Geophys. Res. 1995, 100, 16415–16430. [Google Scholar] [CrossRef]
- Byun, D.; Schere, K.L. Review of the governing equations, computational algorithms, and other components of the Models-3 Community Multiscale Air Quality (CMAQ) modeling system. Appl. Mech. Rev. 2006, 59, 51–77. [Google Scholar] [CrossRef]
- In, H.J.; Park, S.U. The soil particle size dependent emission parameterization for an Asian dust (Yellow Sand) observed in Korea in April 2002. Atmos. Environ. 2003, 37, 4625–4636. [Google Scholar] [CrossRef]
- Park, S.U.; Choe, A.; Lee, E.H.; Park, M.S.; Song, X. The Asian dust aerosol model 2 (ADAM2) with the use of normalized difference vegetation index (NDVI) obtained from the Spot4/vegetation data. Theor. Appl. Climatol. 2010, 101, 191–208. [Google Scholar] [CrossRef]
- Lee, S.-S.; Lee, E.H.; Sohn, B.J.; Lee, H.C.; Cho, J.H.; Ryoo, S.-B. Improved dust forecast by assimilating MODIS IR-based nighttime AOT in the ADAM2 model. SOLA 2017, 13, 192–198. [Google Scholar] [CrossRef]
- Lee, S.S.; Lim, Y.-K.; Cho, J.H.; Lee, H.C.; Ryoo, S.-B. Improved dust emission reduction factor in the ADAM2 model using real-time MODIS NDVI. Atmosphere 2019, 10, 702. [Google Scholar] [CrossRef]
- Park, S.-U.; Cho, J.H.; Park, M.-S. A simulation of aerosols in Asia with the use of ADAM2 and CMAQ. Adv. Fluid Mech. Heat Mass Transf. 2012, 258–263. [Google Scholar]
- Park, S.U.; Chae, A.; Park, M.-S. A simulation of Asian dust events observed from 20 to 29 December 2009 in Korea by using ADAM2. Asia Pac. J. Atmos. Sci. 2013, 49, 95–109. [Google Scholar] [CrossRef]
- Available online: http://www.google.com/maps (accessed on 12 March 2020).
- Wilks, D.S. Statistical Methods in Atmospheric Sciences; Academic Press: San Diego, CA, USA, 1995. [Google Scholar]
- Johnson, B.T.; Brooks, M.E.; Walters, D.; Woodward, S.; Christopher, S.; Schepanskic, K. Assessment of the Met Office dust forecast model using observations from the GERBILS campaign. Q. J. R. Meteorol. Soc. 2011, 137, 1131–1148. [Google Scholar] [CrossRef]
- The Science-Policy Interface, the UNCCD Knowledge Hub, and the Analysis, Dissemination and Accessibility of Best Practices. Available online: http://www.unccd.int/sites/default/files/sessions/documents/2019-07/ICCD_COP%2814%29_17-1910488E.pdf (accessed on 13 March 2020).
© 2020 by the authors. Licensee MDPI, Basel, Switzerland. This article is an open access article distributed under the terms and conditions of the Creative Commons Attribution (CC BY) license (http://creativecommons.org/licenses/by/4.0/).