Introduction to Radar Scattering Application in Remote Sensing and Diagnostics: Review


Abstract
1. Introduction
2. Introduction: The Radar System
3. Radar Fundamental Equations and Parameters
4. Radar and Remote Sensing Applications
4.1. Forests Mapping
4.2. Land, Wetland, and High-Earth Regions Mapping
4.3. Monitoring Photosynthetic Process for Plant Growth
4.4. Monitoring Earthquake Damages
4.5. Alternative Radar and Imaging Systems
4.6. Monitoring Weather Forecast
4.7. Monitoring Terrestrial and Planetary Information
4.8. Monitoring of the Sea Status
4.9. Monitoring of Human Body in Bio-Medical Applications
4.10. Scattering Mechanisms and Radar Observatory Techniques
5. Conclusions
Author Contributions
Funding
Conflicts of Interest
References
- James, R.J. A history of radar. IEE Rev. 1989, 35, 343–349. [Google Scholar] [CrossRef]
- Skolnik, F.; Merrill, I. Introduction to Radar: Radar Handbook; McGraw-Hill: New York, NY, USA, 1962. [Google Scholar]
- Bhatta, N.P.; GeethaPriya, M. Radar and Its Applications; International Science Press: Cambridge, UK, 2017; Volume 10, pp. 1–9. [Google Scholar]
- Devine, P. Radar Level Measurement: The Users Guide; Vega Controls: Burgess Hill, UK, 2000. [Google Scholar]
- Josefsson, L.; Persson, P. Conformal Array Antenna Theory and Design; John Wiley and Sons: New York, NY, USA, 2006; Volume 10. [Google Scholar]
- Balanis, C.A. Antenna Theory: Analysis and Design; John Wiley and Sons: New York, NY, USA, 2016. [Google Scholar]
- Stutzman, W.L.; Thiele, G.A. Antenna Theory and Design; John Wiley and Sons: New York, NY, USA, 2012. [Google Scholar]
- Li, Y.; Yang, L.; Gao, M.; Zhao, X.; Zhang, X. A study of a one-turn circular patch antenna array and the influence of the human body on the characteristics of the antenna. Ad Hoc Netw. 2020, 19, 102059. [Google Scholar] [CrossRef]
- Dwivedi, R.P.; Khan, M.Z.; Kommuri, U.K. UWB circular cross slot AMC design for radiation improvement of UWB antenna. AEU-Int. J. Electron. Commun. 2020, 117, 153092. [Google Scholar] [CrossRef]
- Wagh, K.; Shriramwar, S.S. Shriramwar, Performance enhancement of hexagonal-patch dual-band array antenna with omega-shaped DGS for dual Band radar Applications. Curr. Sci. 2020, 25, 249–254. [Google Scholar]
- Sultan, K.; Abdullah, H.; Abdallah, E.; Hennawy, E.L. MOM/GA-Based Virtual Array for radar Systems. Sensors 2020, 20, 713. [Google Scholar] [CrossRef]
- Li, Y.; Wang, Z.; Pang, C.; Wang, X. A Low Cross-Polarization Configuration Method for Phased Array radar Antenna. Electronics 2020, 9, 396. [Google Scholar] [CrossRef]
- Patwari, A.; Gudheti, R.R. Novel MRA-Based Sparse MIMO and SIMO Antenna Arrays for Automotive radar Applications. Prog. Electromagnet. Res. 2020, 86, 103–119. [Google Scholar] [CrossRef][Green Version]
- Baccarelli, P.; Burghignoli, P.; Frezza, F.; Galli, A.; Lampariello, P.; Lovat, G.; Paulotto, S. Effects of leaky-wave propagation in metamaterial grounded slabs excited by a dipole source. IEEE Trans. Microw. Theory Tech. 2005, 17, 32–44. [Google Scholar] [CrossRef]
- Freeman, A.; Durden, S.L. A three-component scattering model for polarimetric SAR data. IEEE Trans. Geosci. Remote Sens. 1998, 36, 963–973. [Google Scholar] [CrossRef]
- Antar, Y.M.M.; Hendry, A.; McCormick, G.C. Circular polarization for remote sensing of precipitation: Polarization diversity work at the National Research Council of Canada. IEEE Antennas Propag. Mag. 1992, 34, 7–16. [Google Scholar] [CrossRef]
- Krehbiel, P.; Chen, T.; McCrary, S.; Rison, W.; Gray, G.; Brook, M. The use of dual channel circular-polarization radar observations for remotely sensing storm electrification. Meteorol. Atmos. Phys. 1996, 59, 65–82. [Google Scholar] [CrossRef]
- Henry, J.B.; Chastanet, P.; Fellah, K.; Desnos, Y.L. Envisat multi-polarized ASAR data for flood mapping. Int. J. Remote Sens. 2006, 27, 1921–1929. [Google Scholar] [CrossRef]
- Baghdadi, N.; Holah, N.; Zribi, M. Soil moisture estimation using multi-incidence and multi-polarization ASAR data. Int. J. Remote Sens. 2006, 27, 1907–1920. [Google Scholar] [CrossRef]
- Inoue, Y.; Kurosu, T.; Maeno, H.; Uratsuka, S.; Kozu, T.; Dabrowska, K.; Qi, J. Season-long daily measurements of multifrequency (Ka, Ku, X, C, and L) and full-polarization backscatter signatures over paddy rice field and their relationship with biological variables. Remote Sens. Environ. 2002, 81, 194–204. [Google Scholar] [CrossRef]
- Haykin, S.; Krasnor, C.; Nohara, T.J.; Currie, B.W.; Hamburger, D.A. A coherent dual-polarized radar for studying the ocean environment. IEEE Trans. Geosci. Remote Sens. 1991, 29, 189–191. [Google Scholar] [CrossRef]
- Chen, J.; Lin, H.; Pei, Z. Application of ENVISAT ASAR data in mapping rice crop growth in Southern China. IEEE Geosci. Remote Sens. Lett. 2007, 4, 431–435. [Google Scholar] [CrossRef]
- Frezza, F.; Mangini, F. Electromagnetic scattering of an inhomogeneous elliptically polarized plane wave by a multilayered sphere. J. Electromagnet. Waves Appl. 2016, 30, 492–504. [Google Scholar] [CrossRef]
- Frezza, F.; Mangini, F. Vectorial spherical-harmonics representation of an inhomogeneous elliptically polarized plane wave. JOSA A 2015, 32, 1379–1383. [Google Scholar] [CrossRef]
- Frezza, F.; Mangini, F.; Muzi, M.; Stoja, E. In silico validation procedure for cell volume fraction estimation through dielectric spectroscopy. J. Biol. Phys. 2015, 41, 223–234. [Google Scholar] [CrossRef][Green Version]
- Batool, S.; Naqvi, Q.A.; Fiaz, M.A. Scattering from a cylindrical obstacle deeply buried beneath a planar non-integer dimensional dielectric slab using Kobayashi potential method. Optik-Int. J. Light Electron Opt. 2018, 1, 95–108. [Google Scholar] [CrossRef]
- Batool, S.; Frezza, F.; Mangini, F.; Xu, Y.L. Scattering from multiple PEC sphere using Translation Addition Theorems for Spherical Vector Wave Function. J. Quant. Spectrosc. Radiat. Transf. 2020, 106905. [Google Scholar] [CrossRef]
- Mahafza, R.; Bassem, R. Radar Systems Analysis and Design Using MATLAB, 2nd ed.; Chapman and Hall-CRC: Boca Rotan, FL, USA, 2005; Volume 10. [Google Scholar]
- Scheer, J.; Holm, W.A. Principles of Modern Radar; Science and Technology Publishing: Shanghai, China, 2010; Volume 1. [Google Scholar]
- Nezlin, D.V.; Kostylev, V.I.; Blyakhman, A.B.; Ryndyk, A.G.; Myakinkov, A.V. Bistatic Radar Principles and Practice; John Wiley and Sons: New York, NY, USA, 2007. [Google Scholar]
- Alabaster, C. Pulse Doppler Radar; The Institution of Engineering and Technology: Stevenage, UK, 2012; Volume 2. [Google Scholar]
- Le Toan, T.; Beaudoin, A.; Riom, J.; Guyon, D. Relating forest biomass to SAR data. IEEE Trans. Geosci. Remote Sens. 1992, 30, 403–411. [Google Scholar] [CrossRef]
- Picard, G.; Martinez, J.M.; Melon, P.; Davidson, M. On the relationships between radar measurements and forest structure and biomass. Retr. Bio-Geo-Phys. Parameters SAR Data Land Appl. 2002, 475, 3–12. [Google Scholar]
- Attema, E.P.; Ulaby, F.T. Vegetation modeled as a water cloud. Radio Sci. 1978, 13, 357–364. [Google Scholar] [CrossRef]
- Goodman, J.W. Some effects of target-induced scintillation on optical radar performance. Proc. IEEE 1965, 53, 1688–1700. [Google Scholar] [CrossRef]
- Munshi, A.; Unnikrishnan, S. Performance Analysis of radar based on DS BPSK modulation technique. Int. J. Electron. Commun. Eng. Technol. (IJECET) 2013, 4, 137–143. [Google Scholar]
- Gurgel, K.W.; Barbin, Y.; Schlick, T. Radio frequency interference suppression techniques in FMCW modulated HF radars. Oceans 2007, 7, 1–4. [Google Scholar]
- Haimovich, A.M.; Bar Ness, Y. An eigenanalysis interference canceler. IEEE Trans. Signal Process. 1991, 39, 76–84. [Google Scholar] [CrossRef]
- Vaghela, S.; Ravirajsinh, A.; Gonsai, A. Filter design for improvement of interference on adjacent frequency. Int. J. Electron. Commun. Eng. Technol. 2017, 8, 10–16. [Google Scholar]
- Marcum, J. A statistical theory of target detection by pulsed radar. IRE Trans. Inf. Theory 1960, 6, 59–267. [Google Scholar] [CrossRef]
- Robey, F.C.; Fuhrmann, D.R. A CFAR adaptive matched filter detector. IEEE Trans. Aerosp. Electron. Syst. 1992, 28, 208–216. [Google Scholar] [CrossRef]
- Bevilacqua, A.; Niknejad, A.M. An ultrawideband CMOS low-noise amplifier for 3.1-10.6-GHz wireless receivers. IEEE J. Solid-State Circuits 2004, 39, 2259–2268. [Google Scholar] [CrossRef]
- Apel, J.R. An improved model of the ocean surface wave vector spectrum and its effects on radar backscatter. J. Geophys. Res. Ocean. 1994, 99, 16269–16291. [Google Scholar] [CrossRef]
- Davidson, M.W.; Toan, T.L.; Mattia, F.; Satalino, G.; Manninen, T.; Borgeaud, M. On the characterization of agricultural soil roughness for radar remote sensing studies. IEEE Trans. Geosci. Remote Sens. 2000, 38, 630–640. [Google Scholar] [CrossRef]
- Long, M.W. Radar Reflectivity of Land And Sea; Artech House: Norwood, MA, USA, 1975; Volume 390, pp. 1–10. [Google Scholar]
- Dubois, P.C.; Van Zyl, J.; Engman, T. Measuring soil moisture with imaging radars. IEEE Trans. Geosci. Remote Sens. 1995, 33, 915–926. [Google Scholar] [CrossRef]
- Popescu, S.C. Estimating biomass of individual pine trees using airborne lidar. Biomass Bioenergy 2007, 31, 646–655. [Google Scholar] [CrossRef]
- Lee, W.J.; Lee, C.W. Forest canopy height estimation using multiplatform remote sensing dataset. J. Sens. 2018, 10, 1–9. [Google Scholar] [CrossRef]
- Klemas, V.V. The role of remote sensing in predicting and determining coastal storm impacts. J. Coast. Res. 2009, 9, 1264–1275. [Google Scholar] [CrossRef]
- Aguilar, M.A.; del Mar, S.M.; Aguilar, F.J. Assessing geometric accuracy of the orthorectification process from GeoEye-1 and WorldView-2 panchromatic images. Int. J. Appl. Earth Obs. Geoinf. 2013, 21, 427–435. [Google Scholar] [CrossRef]
- Tu, M.T.; Hsu, C.L. An adjustable pan-sharpening approach for IKONOS/QuickBird/GeoEye-1/WorldView-2 imagery. IEEE J. Sel. Top. Appl. Earth Obs. Remote Sens. 2012, 5, 125–134. [Google Scholar] [CrossRef]
- Mutanga, O.; Adam, E. High density biomass estimation for wetland vegetation using WorldView-2 imagery and random forest regression algorithm. Int. J. Appl. Earth Obs. Geoinf. 2012, 18, 399–406. [Google Scholar] [CrossRef]
- Mangini, F.; Dinia, L.; Frezza, F. Electromagnetic Scattering by a Cylinder in a Lossy Medium of an Inhomogeneous Elliptically Polarized Plane Wave. J. Telecommun. Inf. Technol. 2019, 4, 36–42. [Google Scholar] [CrossRef]
- Martinez, A.; Brynes, A.P. Modeling Dielectric-Constant Values of Geologic Materials: An Aid to Ground-Penetrating Radar Data Collection and Interpretation; Kansas Geological Survey: Lawrence, KS, USA, 2001; p. 247. [Google Scholar]
- Hasted, J.B. Aqueous Dielectrics; Chapman and Hall: London, UK, 1973. [Google Scholar]
- Weir, W.B. Automatic measurement of complex dielectric constant and permeability at microwave frequencies. Proc. IEEE 1974, 62, 33–36. [Google Scholar] [CrossRef]
- Kovacs, A.; Gow, A.J.; Morey, R.M. The in-situ dielectric constant of polar firn revisited. Cold Reg. Sci. Technol. 1995, 23, 245–256. [Google Scholar] [CrossRef]
- Oh, Y.; Sarabandi, K.; Ulaby, F.T. An inversion algorithm for retrieving soil moisture and surface roughness from polarimetric radar observation. In Proceedings of the Geoscience and Remote Sensing Symposium (IGARSS’94), Pasadena, CA, USA, 8–12 August 1994; Volume 3, pp. 1582–1584. [Google Scholar]
- Weiler, K.W. Comparison of ground penetrating radar and time-domain reflectometry as soil water sensors. Soil Sci. Soc. Am. J. 1998, 62, 1237–1239. [Google Scholar] [CrossRef]
- Van Zyl, J.J. Application of Cloude’s target decomposition theorem to polarimetric imaging radar data and radar polarimetry. Int. Soc. Opt. Photonics 1993, 17, 184–192. [Google Scholar]
- Massonnet, D.; Feigl, K.L. Radar interferometry and its application to changes in the Earth’s surface. Rev. Geophys. 1998, 36, 441–500. [Google Scholar] [CrossRef]
- Davis, J.L.; Annan, A.P. Ground-Pennetrating radar for high-resolution mapping of soil and rock stratigraphy. Geophys. Prospect. 1989, 37, 531–551. [Google Scholar] [CrossRef]
- Mangini, F.; Di Gregorio, P.P.; Muzi, M.; Pajewski, L.; Frezza, F. Wire-Grid modeling of metallic targets for Ground Penetrating radar applications. In Proceedings of the IMEKO International Conference on Metrology for Archaeology and Cultural Heritage, Lecce, Italy, 23–25 October 2017; pp. 105–108. [Google Scholar]
- Ferrara, V.; Troiani, F.; Frezza, F.; Mangini, F.; Pajewski, L.; Simeoni, P.; Tedeschi, N. Design and realization of a cheap Ground Penetrating radar prototype 2.45 GHz. In Proceedings of the 2016 10th European Conference on Antennas and Propagation (EuCAP), Davos, Switzerland, 10–15 April 2016; pp. 1–4. [Google Scholar] [CrossRef]
- Afshar, A.; Abedi, M.; Norouzi, G.-H.; Riahi, M.A. Geophysical investigation of underground water content zones using electrical resistivity tomography and ground penetrating radar: A case study in Hesarak-Karaj. Iran. Eng. Geol. 2015, 196, 183–193. [Google Scholar] [CrossRef]
- Kitov, A.D.; Ivanov, E.N.; Plyusnin, V.M.; Gladkov, A.S.; Lunina, O.V.; Serebryakov, E.V.; Afon’kin, A.M. Georadar Investigations of the Peretolchin Glacier (Southern Siberia). Geogr. Nat. Resour. 2018, 39, 55–62. [Google Scholar] [CrossRef]
- Running, S.W.; Way, J.B.; Yang, Y.; Ali, E.E.; Badawi, A. Radar remote sensing proposed for monitoring freeze-thaw transitions in boreal regions. Trans. Am. Geophys. Union 1999, 80, 213–221. [Google Scholar] [CrossRef]
- Kimball, J.S.; McDonald, K.C.; Running, S.W.; Frolking, S.E. Satellite radar remote sensing of seasonal growing seasons for boreal and subalpine evergreen forests. Remote Sens. Environ. 2004, 90, 243–258. [Google Scholar] [CrossRef]
- McDonald, K.C.; Kimball, J.S.; Njoku, E.; Zimmermann, R.; Zhao, M. Variability in springtime thaw in the terrestrial high latitudes: Monitoring a major control on the biospheric assimilation of atmospheric CO2 with spaceborne microwave remote sensing. Earth Interact. 2004, 8, 1–23. [Google Scholar] [CrossRef]
- Kasischke, E.S.; Melack, J.M. The use of imaging radars for ecological applications a review. Remote Sens. Environ. 1997, 59, 141–156. [Google Scholar] [CrossRef]
- Way, J.; Zimmermann, R.; McDonald, K.; Oren, R. Winter and spring thaw as observed with imaging radar at BOREAS. J. Geophys. Res. Atmos. 1997, 102, 29673–29684. [Google Scholar] [CrossRef]
- Karlsen, S.R.; Tolvanen, A.; Poikolainen, J.; HOgda, K.A.; Johansen, B.; Danks, F.S.; Aspholm, P.; Wielgolaski, F.E.; Makarova, O. MODIS-NDVI-based mapping of the length of the growing season in northern Fennoscandia. Int. J. Appl. Earth Obs. Geoinf. 2008, 10, 253–266. [Google Scholar] [CrossRef]
- Stramondo, S.; Bignami, C.; Chini, M.; Pierdicca, N.; Tertulliani, A. Satellite radar and optical remote sensing for earthquake damage detection: Results from different case studies. Int. J. Remote Sens. 2006, 27, 4433–4447. [Google Scholar] [CrossRef]
- Tralli, M.; David, R.G.; Blom, V.; Zlotnicki, A.; Donnellan, D.L.; Evans, D.L. Satellite remote sensing of earthquake, volcano, flood, landslide and coastal inundation hazards. ISPRS J. Photogramm. Remote Sens. 2005, 59, 185–198. [Google Scholar] [CrossRef]
- Matsuoka, M.; Yamazaki, F. Use of satellite SAR intensity imagery for detecting building areas damaged due to earthquakes. Earthq. Spec. 2004, 20, 975–994. [Google Scholar] [CrossRef]
- Michel, R.; Avouac, J.P. Measuring ground displacements from SAR amplitude images: Application to the Landers earthquake. Geophys. Res. Lett. 1999, 26, 875–878. [Google Scholar] [CrossRef]
- Fialko, Y.; Simons, M. The complete (3-D) surface displacement field in the epicentral area of the 1999 Mw7.1 Hector Mine earthquake, California, from space geodetic observations. Geophys. Res. Lett. 2001, 28, 3063–3066. [Google Scholar]
- Rathje, E.M.; Adams, B.J. The role of remote sensing in earthquake science and engineering opportunities and challenges. Earthq. Spec. 2008, 24, 471–492. [Google Scholar] [CrossRef]
- Colone, F.; Hagan, D.W.O.; Lombardo, P.; Baker, C.J. A multistage processing algorithm for disturbance removal and target detection in passive bistatic radar. IEEE Trans. Aerosp. Electron. Syst. 2009, 45, 698–722. [Google Scholar] [CrossRef]
- Colone, F.; Falcone, P.; Bongioanni, C.; Lombardo, P. WiFi-Based passive bistatic radar: Data processing schemes and experimental results. IEEE Trans. Aerosp. Electron. Syst. 2012, 48, 1061–1079. [Google Scholar] [CrossRef]
- Tan, D.K.P.; Sun, H.; Lu, Y.; Lesturgie, M.; Chan, H.L. Passive radar using global system for mobile communication signal: Theory, implementation and measurements. IEEE Proc.-Radar Sonar Navig. 2005, 3, 116–123. [Google Scholar] [CrossRef]
- Griffiths, H.D.; Garnett, A.J.; Baker, C.J.; Keaveney, S. Bistatic radar using satellite-borne illuminators of opportunity. Int. Conf. Radar 1992, 92, 276–279. [Google Scholar]
- Berger, C.R.; Demissie, B.; Heckenbach, J.; Willett, P.; Zhou, S. Signal processing for passive radar using OFDM waveforms. IEEE J. Sel. Top. Signal Process. 2010, 4, 226–238. [Google Scholar] [CrossRef]
- Saini, R.; Cherniakov, M. DTV signal ambiguity function analysis for radar application. IEEE Proc.-Radar Sonar Navig. 2005, 152, 133–142. [Google Scholar] [CrossRef]
- Sun, W.; Sahr, J.D.; Goodson, T. Digital demodulation of DTV signals for passive radar application. In Proceedings of the IEEE Radar Conference (RadarConf), Philadelphia, PA, USA, 2–6 May 2016; pp. 1–6. [Google Scholar]
- Barott, W.C.; Engle, J. Single-antenna ATSC passive radar observations with remodulation and keystone formatting. In Proceedings of the IEEE Radar Conference, Cincinnati, OH, USA, 19–23 May 2014; pp. 159–163. [Google Scholar]
- Fuling, B.; Guobin, Z.; Jun, L.; Xiaojun, T. Three dimensional data structure and data model. Geo-Spat. Inf. Sci. 2000, 1, 19–23. [Google Scholar] [CrossRef]
- Lefsky, M.A.; Cohen, W.B. Lidar remote sensing for ecosystem studies, Lidar an emerging remote sensing technology that directly measures the three-dimensional distribution of plant canopies, can accurately estimate vegetation structural attributes and should be of particular interest to forest, landscape, and global ecologists. AIBS Bull. 2002, 52, 19–30. [Google Scholar]
- Evans, D.L.; Farr, T.G.; Van Zyl, J.J.; Zebker, H.A. Radar polarimetry: Analysis tools and applications. IEEE Trans. Geosci. Remote Sens. 1988, 26, 774–789. [Google Scholar] [CrossRef]
- Lee, J.S.; Pottier, E. Polarimetric Radar Imaging: From Basics to Applications; CRC Press: Boca Raton, FL, USA, 2009. [Google Scholar]
- Cutrona, L.J.; Leith, E.N.; Porcello, L.J.; Vivian, W.E. On the application of coherent optical processing techniques to synthetic-aperture radar. Proc. IEEE 1966, 54, 1026–1032. [Google Scholar] [CrossRef]
- Berizzi, F.; Corsini, G. Autofocusing of inverse synthetic aperture radar images using contrast optimization. IEEE Trans. Aerosp. Electron. Syst. 1996, 32, 1185–1191. [Google Scholar] [CrossRef]
- Mahfouz, M.; Fathy, A. See-through-wall imaging using ultra wideband short-pulse radar system. Antennas Propag. Soc. Int. Symp. 2005, 3, 334–337. [Google Scholar]
- Bevis, M.; Businger, S.; Herring, T.A.; Rocken, C.; Anthes, R.A.; Ware, R.H. GPS meteorology: Remote sensing of atmospheric water vapor using the Global Positioning System. J. Geophys. Res. Atmos. 1992, 97, 15787–15801. [Google Scholar] [CrossRef]
- Elachi, C. Spaceborne Radar Remote Sensing: Applications and Techniques; IEEE Press: New York, NY, USA, 1988; p. 285. [Google Scholar]
- Campbell, B.A. Radar Remote Sensing of Planetary Surfaces; Cambridge University Press: Cambridge, UK, 2002; p. 10. [Google Scholar]
- Hagfors, T. Backscattering from an undulating surface with applications to radar returns from the Moon. J. Geophys. Res. 1964, 69, 3779–3784. [Google Scholar] [CrossRef]
- Zebker, H.A.; Amelung, F.; Jonsson, S. Remote sensing of volcano surface and internal processes using radar interferometry. Remote Sens. Act. Volcan. 2000, 5, 179–205. [Google Scholar]
- Lorell, J.; Born, G.H.; Christensen, E.J.; Esposito, P.B.; Jordan, J.F.; Laing, P.A.; Sjogren, W.L.; Wong, S.K.; Reasenberg, R.D.; Slater, G.L. Gravity field of Mars from Mariner 9 tracking data. Icarus 1973, 18, 304–316. [Google Scholar] [CrossRef]
- Boerner, W.M.; Mott, H.; Luneburg, E. Polarimetry in remote sensing: Basic and applied concepts. In Proceedings of the IEEE International Geoscience Remote Sensing—A Scientific Vision for Sustainable Development, Singapore, 3–8 August 1997; Volume 3, pp. 1401–1403. [Google Scholar]
- Saba, L.; Di Martino, M.; Delb, M.; Cellino, A.; Zappal, V.; Montebugnoli, S.; Righini, S.; Zoni, L.; Orosei, R.; Tosi, F.; et al. The Sardinian Radio Telescope as radar for the study of near-Earth Objects and Space Debris. Mem. Della Soc. Astron. Italiana Suppl. 2005, 6, 104–109. [Google Scholar]
- Barrick, D. Remote sensing of sea state by radar: Engineering in the Ocean Environment. In Proceedings of the Ocean 72—IEEE International Conference on IEEE, Brighton, UK, 13–15 September 1972. [Google Scholar]
- Srokosz, M.A. On the joint distribution of surface elevation and slopes for a nonlinear random sea with an application to radar altimetry. J. Geophys. Res. Ocean. 1986, 91, 995–1006. [Google Scholar] [CrossRef]
- Earl, G.; Ward, B. Frequency management support for remote sea-state sensing using the Jindalee skywave radar. IEEE J. Ocean. Eng. 1986, 11, 164–173. [Google Scholar] [CrossRef]
- Komjathy, A.; Maslanik, J.; Zavorotny, V.U.; Axelrad, P.; Katzberg, S.J. Sea ice remote sensing using surface reflected GPS signals. In Proceedings of the IGARSS IEEE International Geoscience and Remote Sensing Symposium, Hampton, VA, USA, 24–28 July 2000; Volume 7, pp. 2855–2857. [Google Scholar]
- Mullen, L.; Herczfeld, P.R. Application of radar technology to aerial LIDAR systems for enhancement of shallow underwater target detection. IEEE Trans. Microw. Theory Tech. 1995, 43, 2370–2377. [Google Scholar] [CrossRef]
- Donelan, M.A.; Pierson, W.J. Radar scattering and equilibrium ranges in wind-generated waves with application to scatterometry. J. Geophys. Res. Ocean. 1987, 92, 4971–5029. [Google Scholar] [CrossRef]
- Zavorotny, V.U.; Voronovich, A.G. Scattering of GPS signals from the ocean with wind remote sensing application. IEEE Trans. Geosci. Remote Sens. 2000, 38, 951–964. [Google Scholar] [CrossRef]
- Rius, A.; Cardellach, E.; Martin-Neira, M. Altimetric Analysis of the Sea-Surface GPS-Reflected Signals. IEEE Trans. Geosci. Remote Sens. 2010, 48, 2119–2127. [Google Scholar] [CrossRef]
- Staderini, E.M. UWB radars in medicine. IEEE Aerosp. Electron. Syst. Mag. 2002, 17, 13–18. [Google Scholar] [CrossRef]
- Bilich, C.G. Bio-medical sensing using ultra wideband communications and radar technology: A feasibility study. IEEE Pervasive Health Conf. Workshops 2006, 29, 1–9. [Google Scholar]
- Barrett, K.E.; Barman, S.M.; Boitano, S.; Brooks, H. Ganongs Review of Medical Physiology; McGraw-Hill Medical: New York, NY, USA, 2009; Volume 23, pp. 1–726. [Google Scholar]
- Go, A.S.; Mozaffarian, D.; Roger, V.L.; Benjamin, E.J.; Berry, J.D.; Blaha, M.J.; Dai, S.; Ford, E.S.; Fox, C.S.; Franco, S.; et al. Executive summary: Heart disease and stroke statistics. Am. Heart Assoc. 2014, 129, 399–410. [Google Scholar]
- Aladin, A.I.; Whelton, S.P.; Al-Mallah, M.H.; Blaha, M.J.; Keteyian, S.J.; Juraschek, S.P.; Rubin, J.; Brawner, C.A.; Michos, E.D. Relation of resting heart rate to risk for all-cause mortality by gender after considering exercise capacity (the Henry Ford exercise testing project). Am. J. Cardiol. 2014, 144, 701–706. [Google Scholar] [CrossRef]
- Adib, F.; Mao, H.; Kabelac, Z.; Katabi, D.; Miller, R.C. Smart homes that monitor breathing and heart rate. In Proceedings of the 33rd Annual ACM Conference on Human Factors in Computing Systems, Seoul, Korea, 18 April 2015; Volume 18, pp. 837–846. [Google Scholar]
- Patruno, J.; Fitrzyk, M.; Blasco, J.M.D. Monitoring and Detecting Archaeological Features with Multi-Frequency Polarimetric Analysis. Remote Sens. 2020, 12, 1. [Google Scholar] [CrossRef]
- Banda, F.; Mariotti, M.A.; Tebaldin, S. Ground and Volume Decomposition as a Proxy for AGB from P-Band SAR Data. Remote Sens. 2020, 12, 240. [Google Scholar] [CrossRef]
- Geldsetzer, T.; Khurshid, S.K.; Warner, K.; Botelho, F.; Flett, D. Wind Speed Retrieval from Simulated radarSAT Constellation Mission Compact Polarimetry SAR Data for Marine Application. Remote Sens. 2019, 11, 1682. [Google Scholar] [CrossRef]
- Carvalho, N.C.; Bins, L.S.; Anna, S.J. Analysis of Stochastic Distances and Wishart Mixture Models Applied on PolSAR Images. Remote Sens. 2019, 11, 2994. [Google Scholar] [CrossRef]
- Yuzugullu, O.; Erten, E.; Hajnsek, I. Estimation of rice crop height from X-and C-band PolSAR by metamodel-based optimization. IEEE J. Sel. Top. Appl. Earth Obs. Remote Sens. 2017, 10, 194–204. [Google Scholar] [CrossRef]
- Chiu, T.; Sarabandi, K. Electromagnetic scattering from short branching vegetation. IEEE Trans. Geosci. Remote Sens. 2000, 38, 911–925. [Google Scholar] [CrossRef]
- Ferrazzoli, P.; Guerriero, L.; Solimini, D. Comparison between predicted performances of bistatic and monostatic radar in vegetation monitoring. In Proceedings of the Geoscience and Remote Sensing Symposium (IGARSS’94), Pasadena, CA, USA, 8–12 August 1994; Volume 3, pp. 1850–1852. [Google Scholar]
- Bracaglia, M.; Ferrazzoli, P.; Guerriero, L. A fully polarimetric multiple scattering model for crops. Remote Sens. Environ. 1995, 54, 170–179. [Google Scholar] [CrossRef]
- Brown, S.C.; Quegan, S.; Morrison, K.; Bennett, J.C.; Cookmartin, G. High-resolution measurements of scattering in wheat canopies-Implications for crop parameter retrieval. IEEE Trans. Geosci. Remote Sens. 2003, 41, 1602–1610. [Google Scholar] [CrossRef]
- Onstott, R.G.; Moore, R.K.; Weeks, W.F. Surface-based scatterometer results of Arctic sea ice. IEEE Trans. Geosci. Electron. 1979, 17, 78–85. [Google Scholar] [CrossRef]
- Wiesbeck, W. Radar of the future. In Proceedings of the IEEE European Radar Conference, Nuremberg, Germany, 9–11 October 2013; pp. 137–140. [Google Scholar]
- Mason, E.; Yonel, B.; Yazici, B. Deep learning for radar. In Proceedings of the 2017 IEEE Radar Conference (radarConf), Seattle, WA, USA, 8–12 May 2017; pp. 1703–1708. [Google Scholar]
- Jokanovic, B.; Amin, M.; Ahmad, F. Radar fall motion detection using deep learning. In Proceedings of the 2016 IEEE Radar Conference (radarConf), Philadelphia, PA, USA, 2–6 May 2016; pp. 1–6. [Google Scholar]
- Lameri, S.; Lombardi, F.; Bestagini, P.; Lualdi, M.; Tubaro, S. Landmine detection from GPR data using convolutional neural networks. In Proceedings of the 2017 25th European Signal Processing Conference (EUSIPCO), Kos, Greece, 28 August–2 September 2017; pp. 508–512. [Google Scholar]
- Schwegmann, C.P.; Kleynhans, W.; Salmon, B.P.; Mdakane, L.W.; Meyer, R.G.V. Very deep learning for ship discrimination in Synthetic Aperture radar imagery. In Proceedings of the 2016 IEEE International Geoscience and Remote Sensing Symposium (IGARSS), Beijing, China, 10–15 July 2016; pp. 104–107. [Google Scholar]
- Jackson, D.R.; Oliner, A.A. Leaky-Wave Antennas. In Modern Antenna Handbook Balanis; John Wiley Sons: New York, NY, USA, 2008. [Google Scholar]
- Karmokar, D.K.; Guo, Y.J. Planar leaky-wave antennas for low-cost radar. In Proceedings of the 2017 IEEE-APS Topical Conference on Antennas and Propagation in Wireless Communications (APWC), Verona, WI, USA, 11–15 September 2017; pp. 112–115. [Google Scholar]
- Roy, J.E. New results for the effective propagation constants of nonuniform plane waves at the planar interface of two lossy media. IEEE Trans. Antennas Propag. 2003, 51, 1206–1215. [Google Scholar] [CrossRef]
- Baccarelli, P.; Frezza, F.; Simeoni, P.; Tedeschi, N. An Analytical Study of Electromagnetic Deep Penetration Conditions and Implications in Lossy Media through Inhomogeneous Waves. Materials 2018, 11, 1595. [Google Scholar] [CrossRef]


| Normalized Intensity Pattern Expression: | ||||
|---|---|---|---|---|
| # | Symbol | Description | Numerical Values for Input | Unit |
| 1 | Wavelength | m | ||
| 2 | d | Aperture diameter | m | |
| 3 | r | radius = | m | |
| 4 | k | Propagation constant | ||
| 5 | steering angle | |||
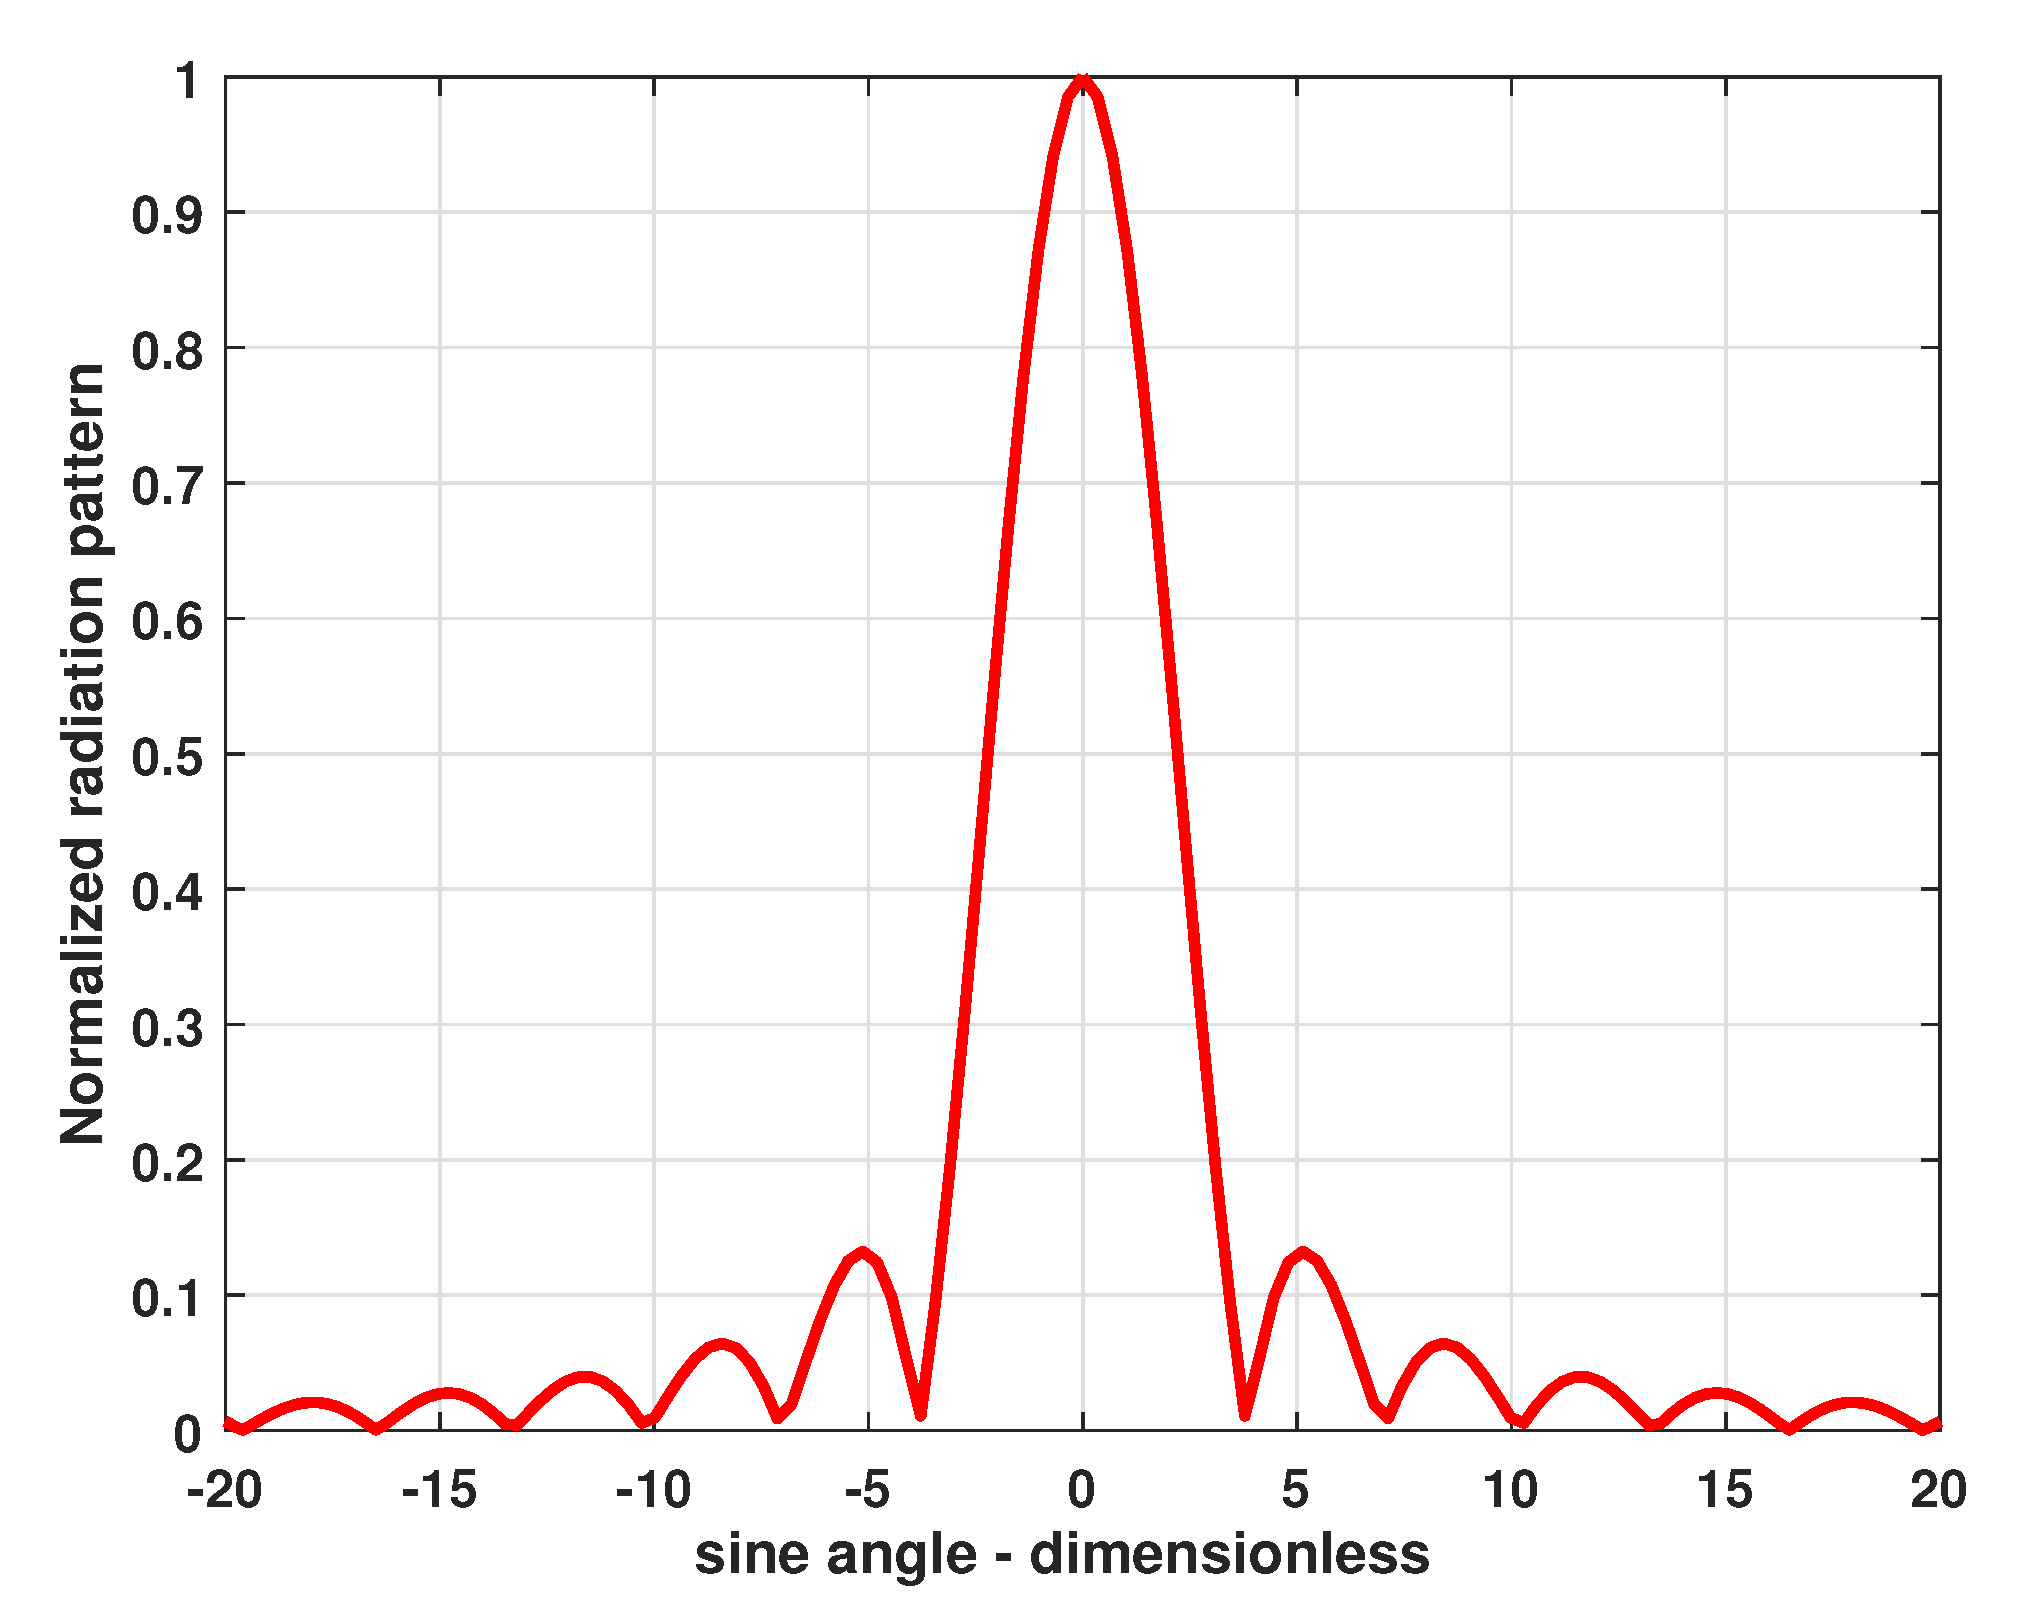
| Normalized Intensity Pattern Expression: | ||||
|---|---|---|---|---|
| # | Symbol | Description | Numerical Values for Input | Unit |
| 1 | N | Number of elements in array | 8 | |
| 2 | d | element spacing (e.g., | 5 | m |
| 3 | steering angle | |||
| Parametric Values of the Radar Equation | ||||
|---|---|---|---|---|
| # | Symbol | Description | Numerical Values for Input | Unit |
| 1 | Peak power | W | ||
| 2 | f | radar center frequency | Hz | |
| 3 | c | Speed of light | ms−1 | |
| 4 | Wavelength = | m | ||
| 5 | k | Boltzmann’s constant | JK | |
| 6 | G | Antenna gain | 90.0 | dB |
| 7 | Target cross section | 0.1 | m2 | |
| 5 | B | Bandwidth | Hz | |
| 6 | F | noise figure | 3.0 | dB |
| 9 | L | radar losses | 6.0 | dB |
| 10 | Antenna temperature | 290.0 | K | |
| 11 | R | Target range | , | km |
| # | Band Designation | Frequency Range |
|---|---|---|
| 1 | HF | 3–30 MHz |
| 1 | VHF | 30–300 MHz |
| 2 | UHF | 300–3000 MHz |
| 3 | L | 1–2 GHz |
| 4 | S | 2–4 GHz |
| 5 | C | 4–8 GHz |
| 6 | X | 8–12 GHz |
| 7 | Ku | 12–18 GHz |
| 8 | K | 18–27 GHz |
| 9 | Ka | 27–40 GHz |
| 10 | V | 40–75 GHz |
| 11 | W | 75–110 GHz |
| 12 | mm | 110–300 GHz |
| # | Main Scattering Area | Frequency Band | Frequency |
|---|---|---|---|
| 1 | Leave Twigs | 8–12 GHz | |
| 2 | Leaves and small branches | 4–8 GHz | |
| 3 | Branches | 1–2 GHz | |
| 4 | Trunk | VHF | 30–300 MHz |
© 2020 by the authors. Licensee MDPI, Basel, Switzerland. This article is an open access article distributed under the terms and conditions of the Creative Commons Attribution (CC BY) license (http://creativecommons.org/licenses/by/4.0/).
Share and Cite
Batool, S.; Frezza, F.; Mangini, F.; Simeoni, P. Introduction to Radar Scattering Application in Remote Sensing and Diagnostics: Review. Atmosphere 2020, 11, 517. https://doi.org/10.3390/atmos11050517
Batool S, Frezza F, Mangini F, Simeoni P. Introduction to Radar Scattering Application in Remote Sensing and Diagnostics: Review. Atmosphere. 2020; 11(5):517. https://doi.org/10.3390/atmos11050517
Chicago/Turabian StyleBatool, Sidra, Fabrizio Frezza, Fabio Mangini, and Patrizio Simeoni. 2020. "Introduction to Radar Scattering Application in Remote Sensing and Diagnostics: Review" Atmosphere 11, no. 5: 517. https://doi.org/10.3390/atmos11050517
APA StyleBatool, S., Frezza, F., Mangini, F., & Simeoni, P. (2020). Introduction to Radar Scattering Application in Remote Sensing and Diagnostics: Review. Atmosphere, 11(5), 517. https://doi.org/10.3390/atmos11050517