Detailed Assessment of the Effects of Meteorological Conditions on PM10 Concentrations in the Northeastern Part of the Czech Republic


Abstract
1. Introduction
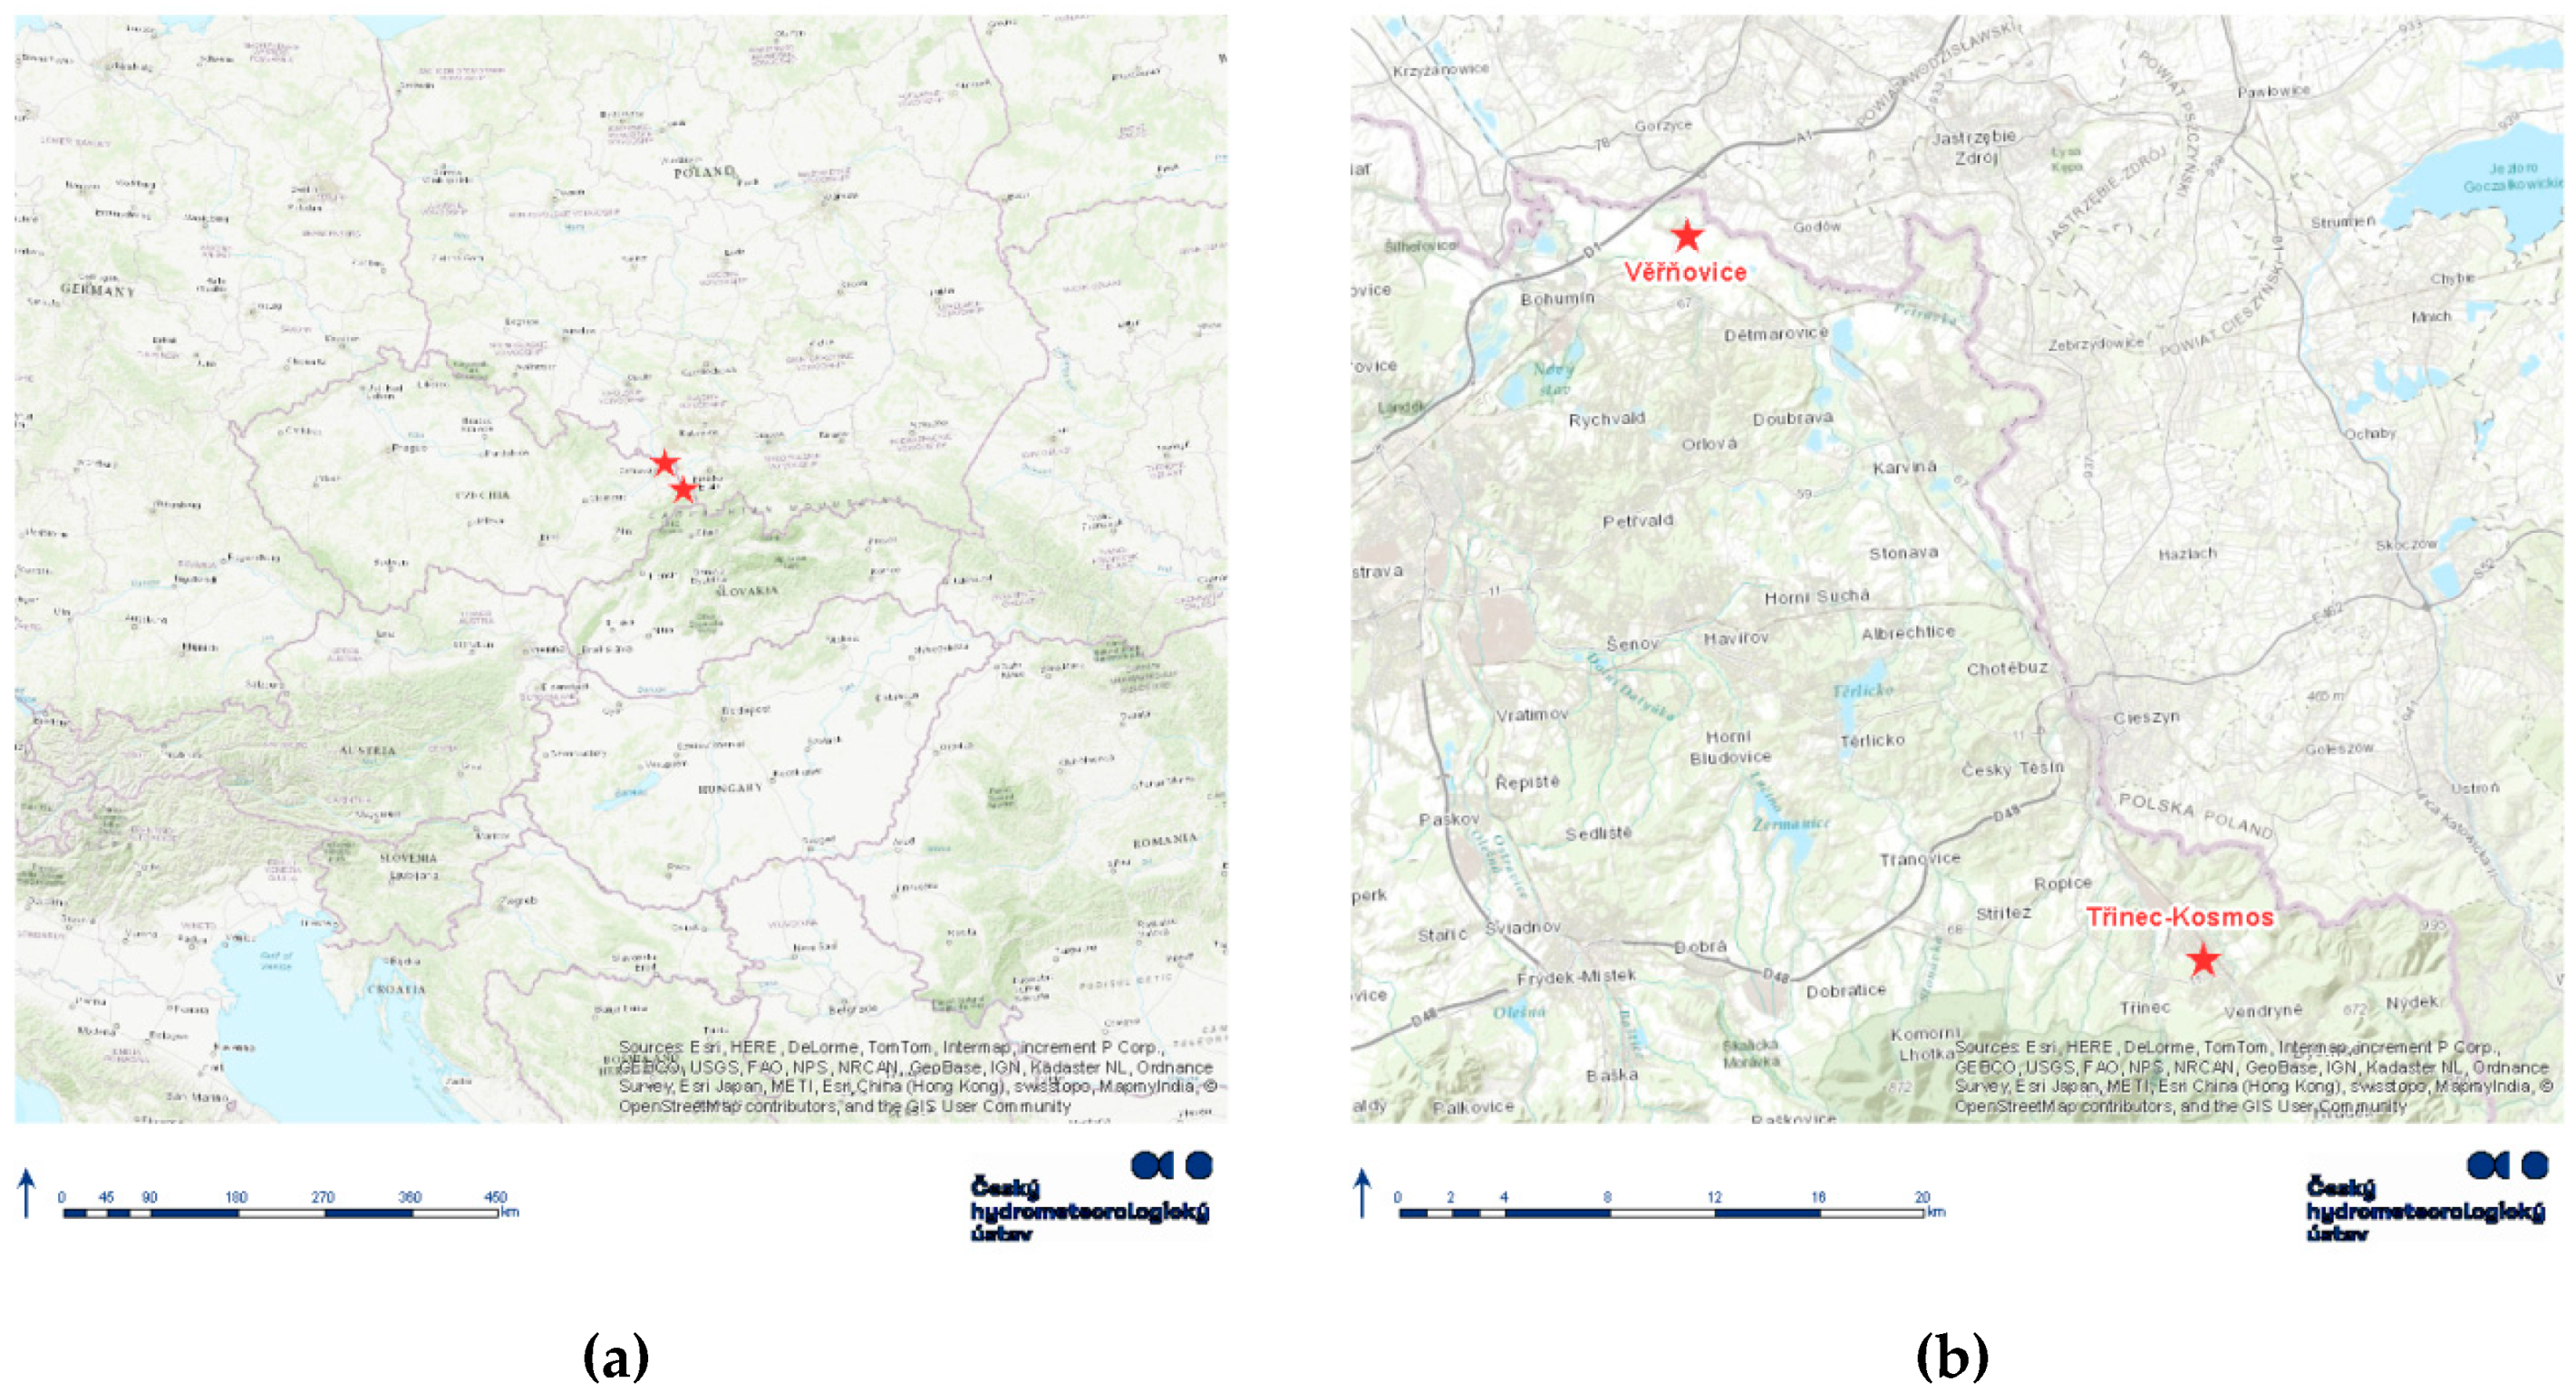
2. Experiments
3. Results
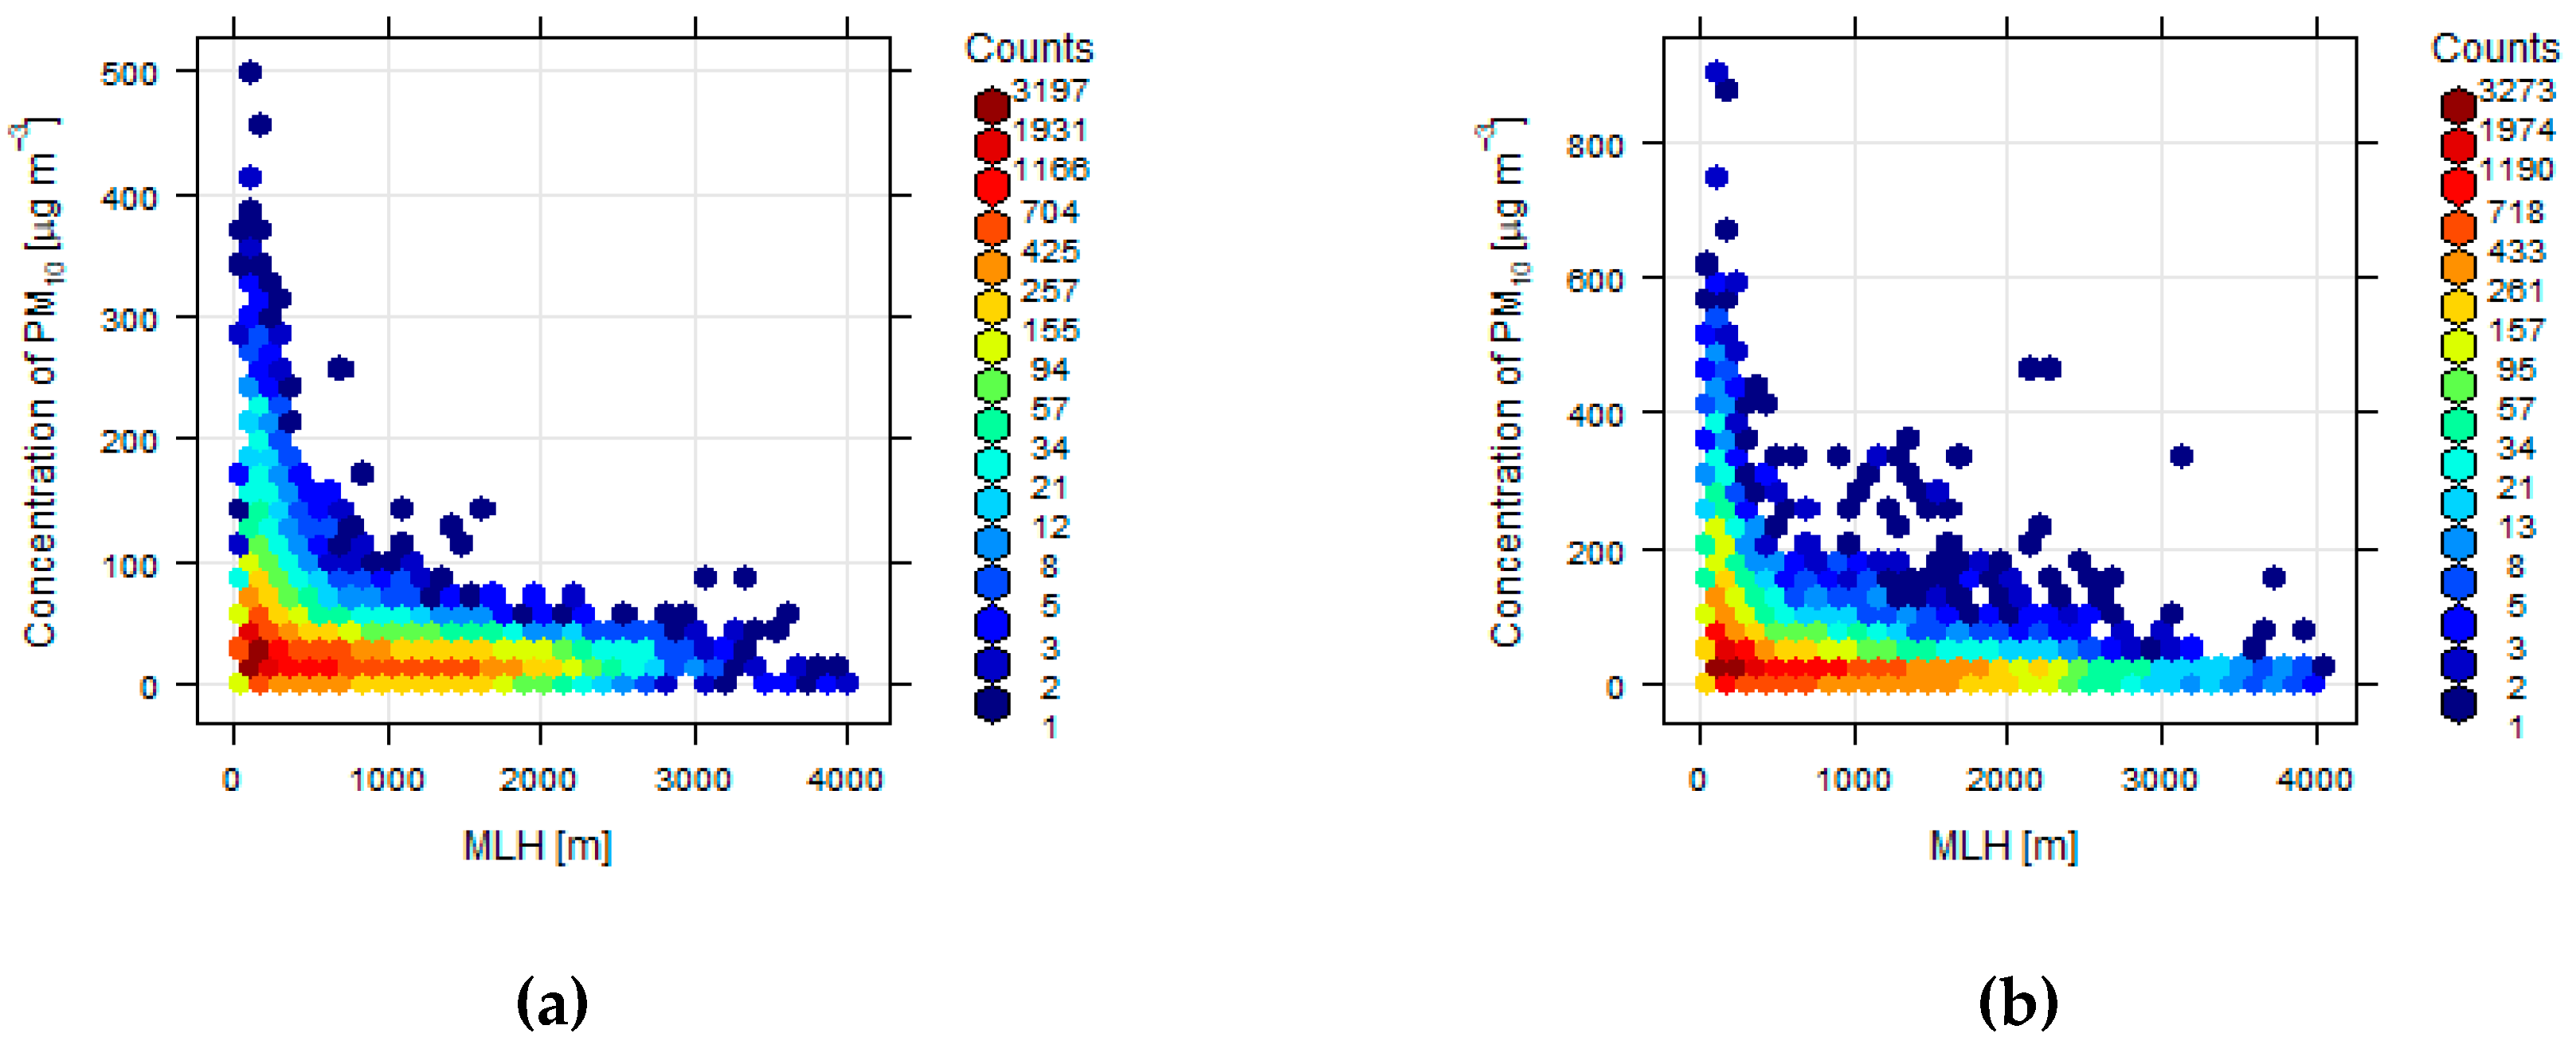
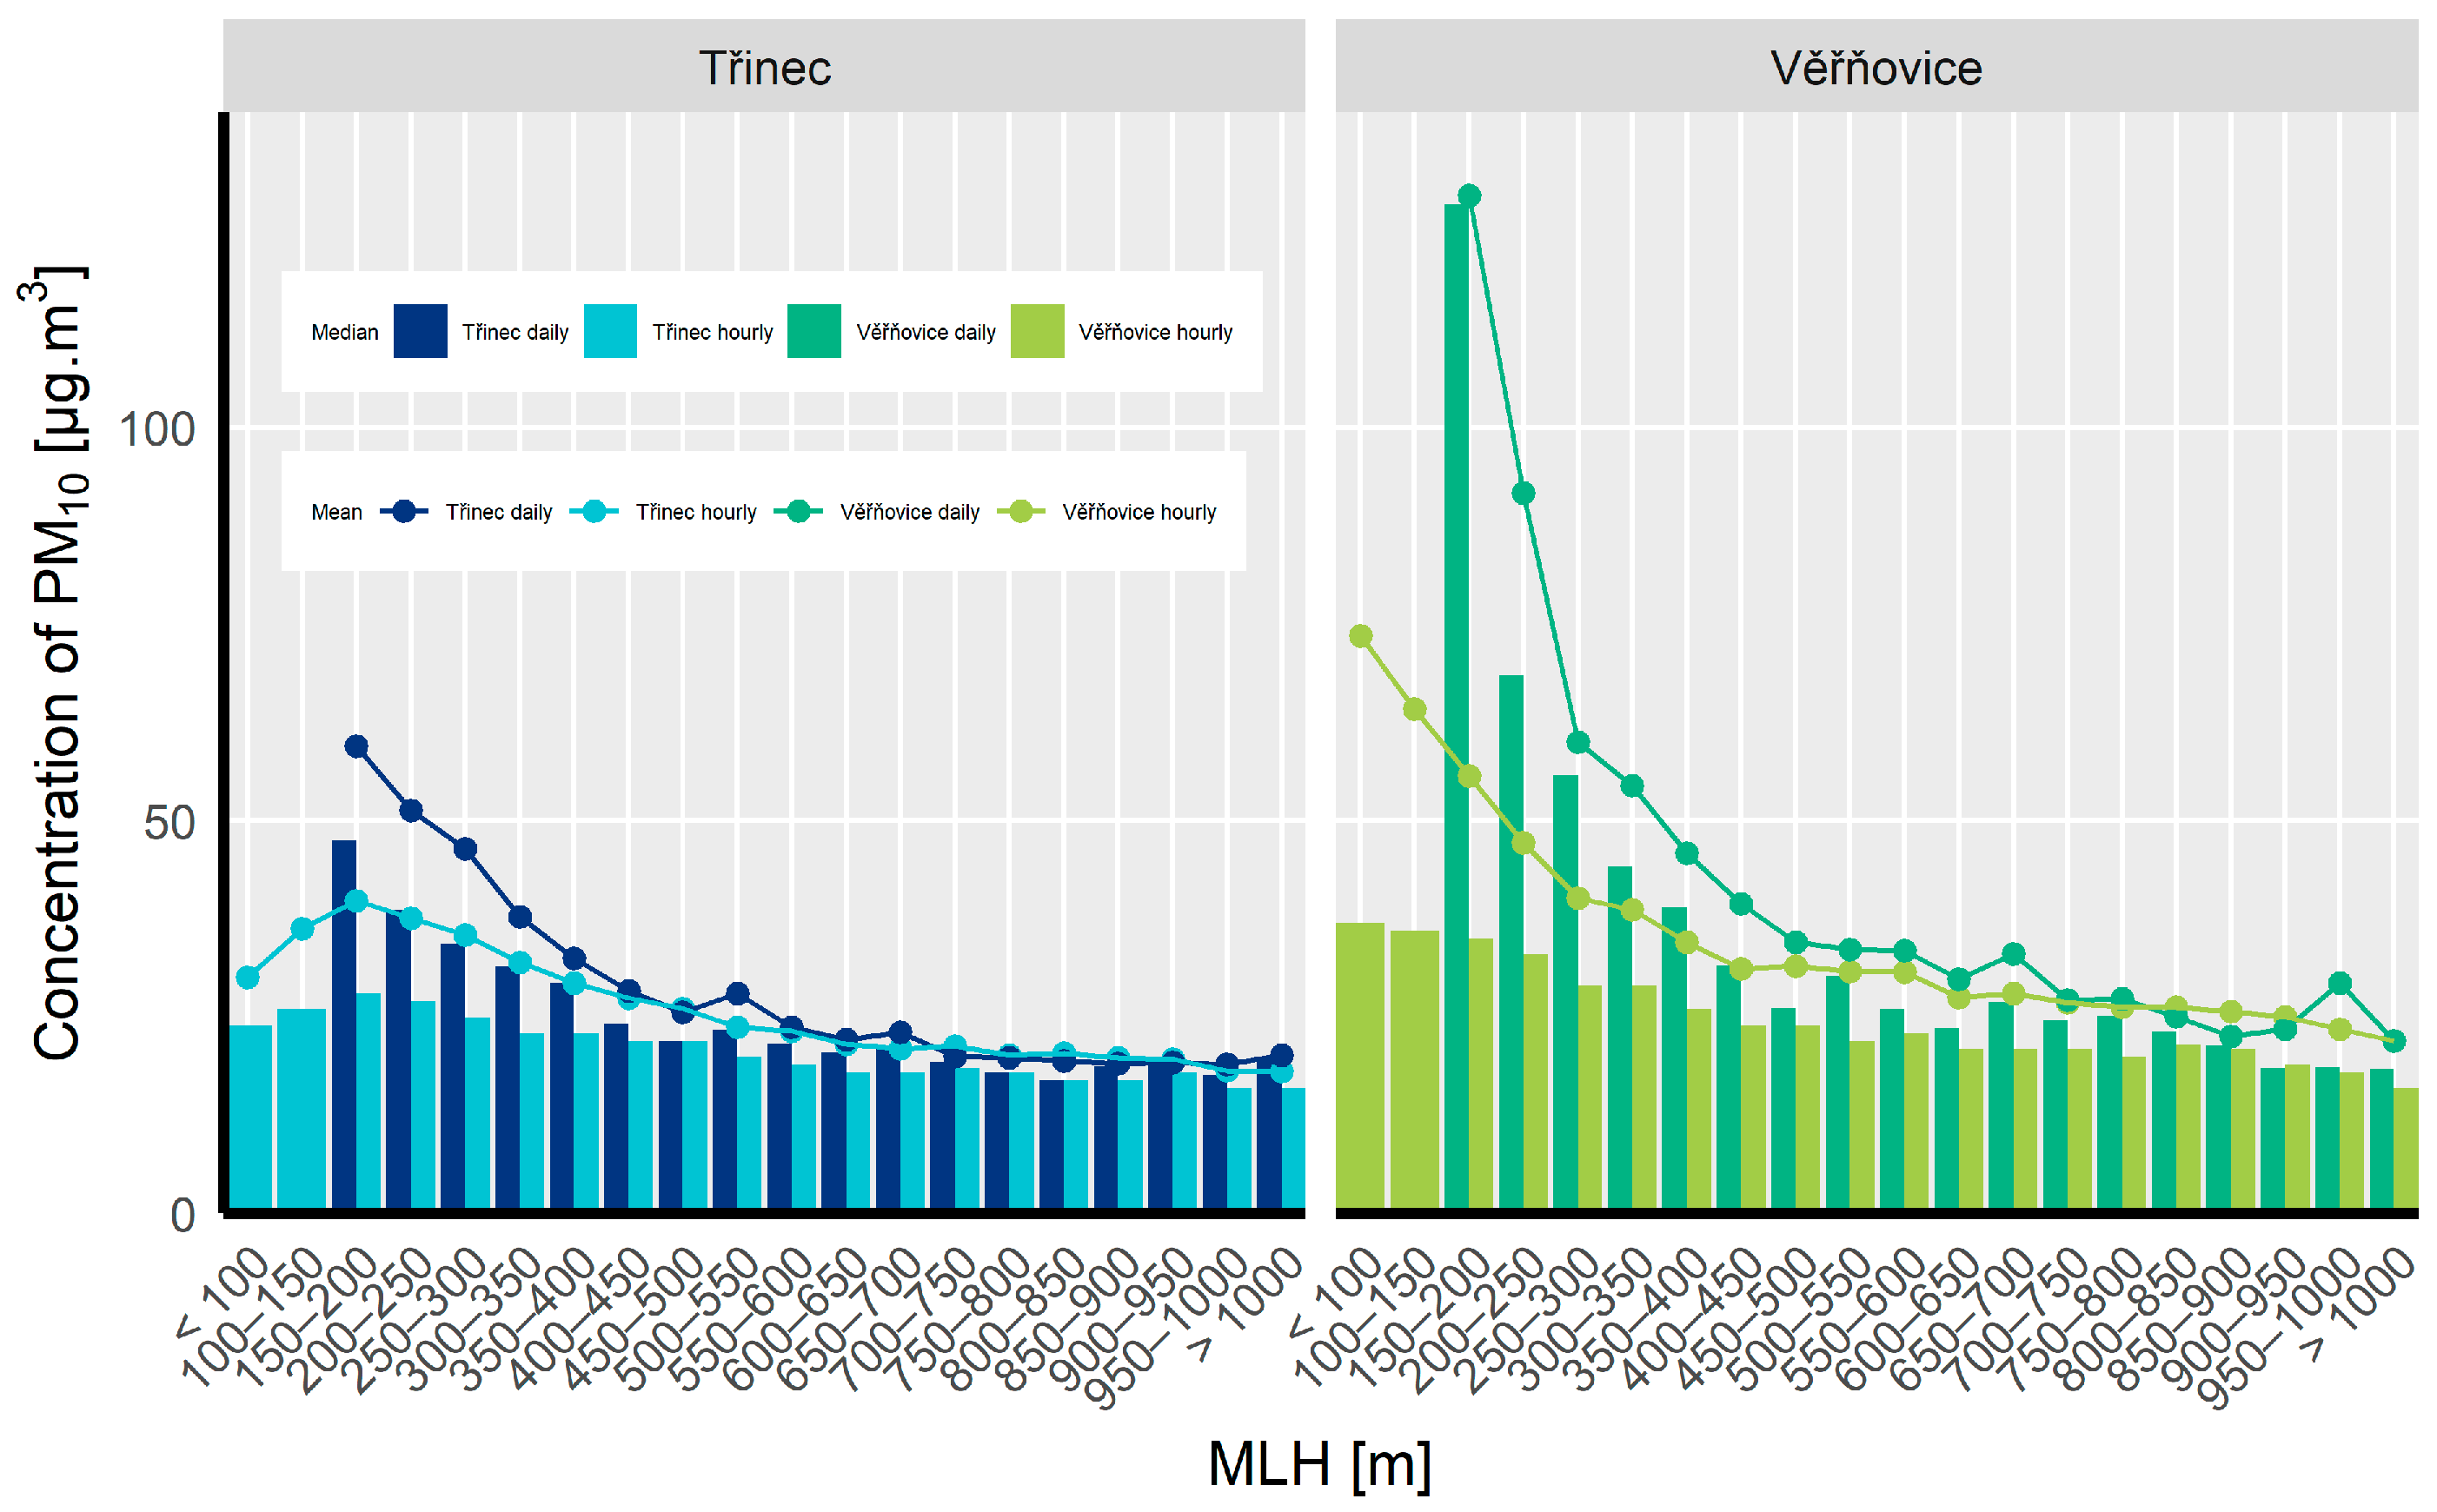
3.1. Dependence of Suspended Particulate Matter Concentrations on the Mixing Layer Height
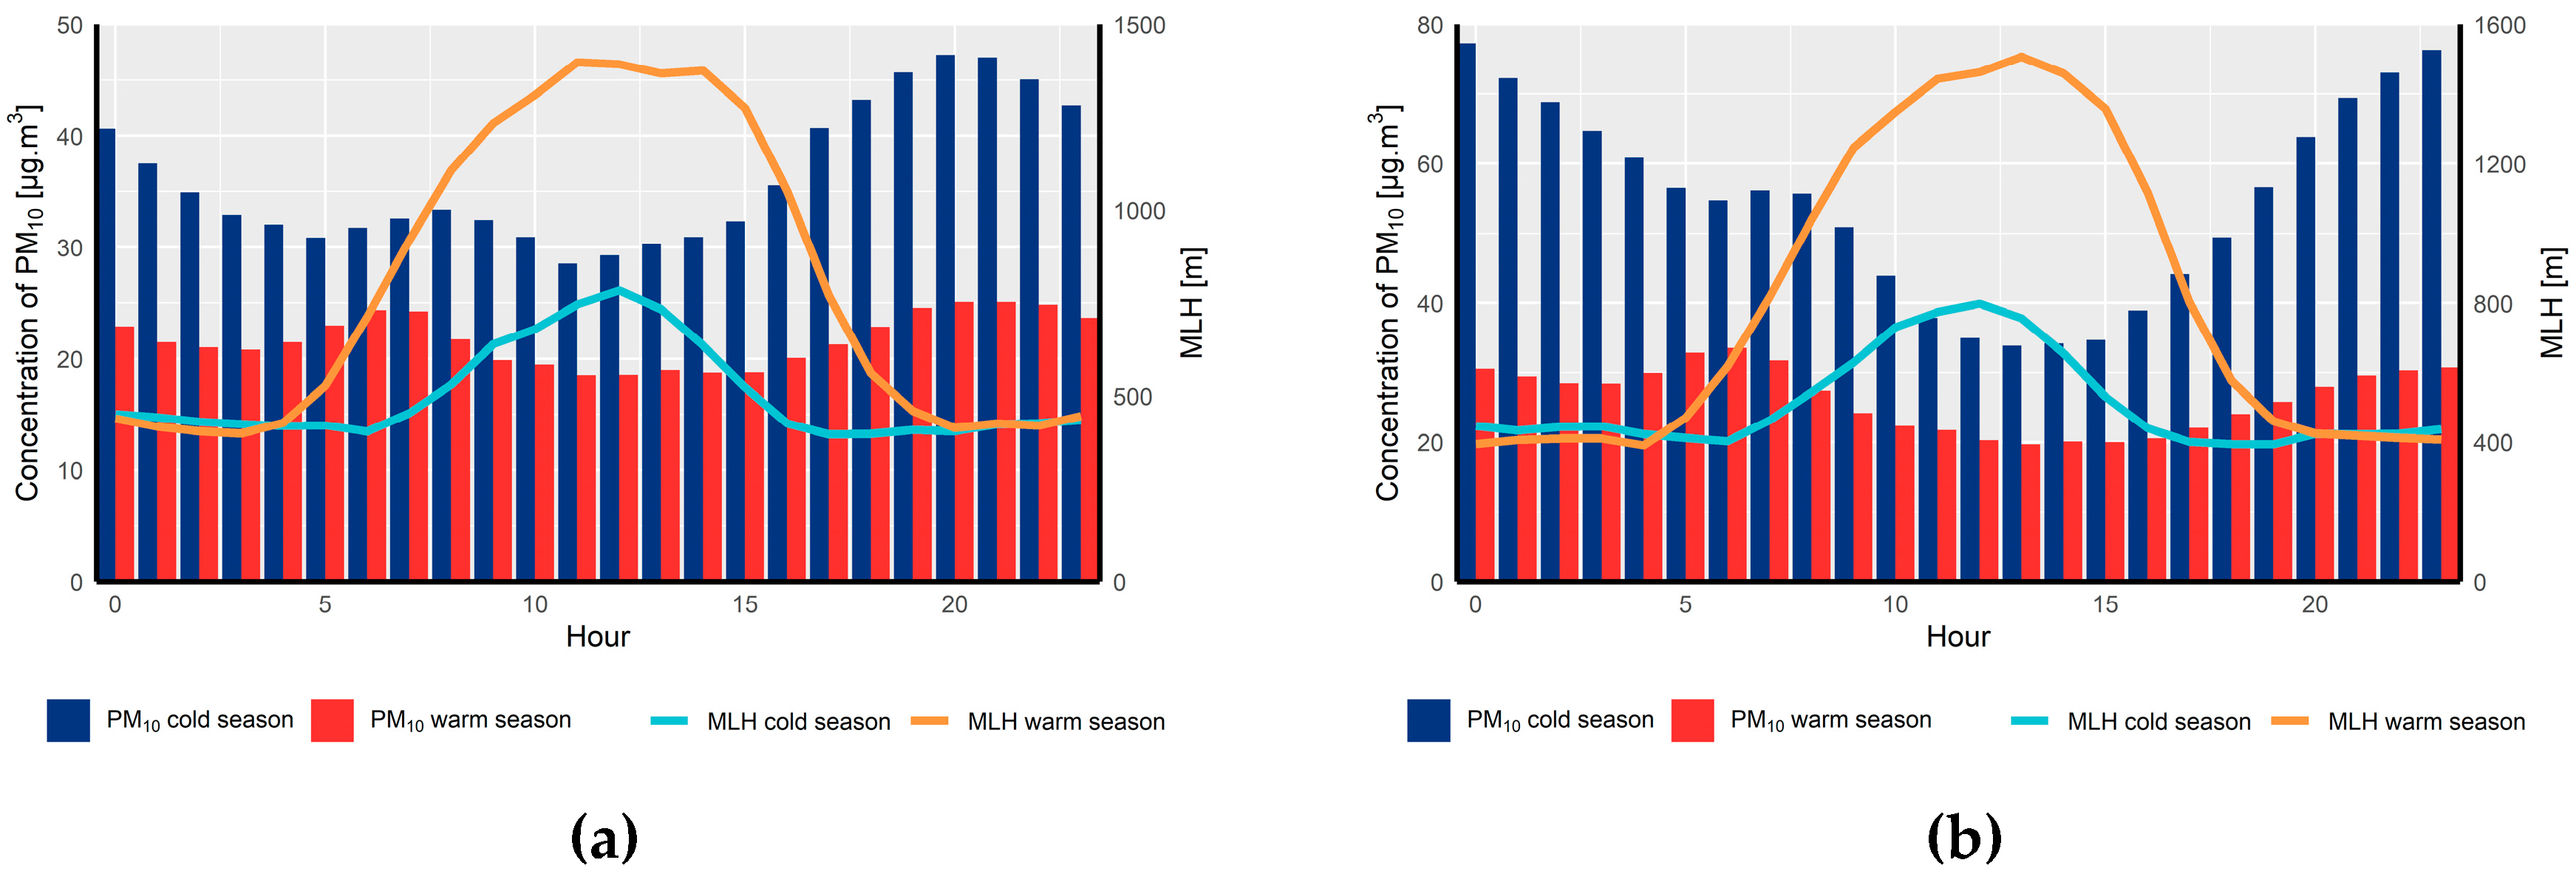
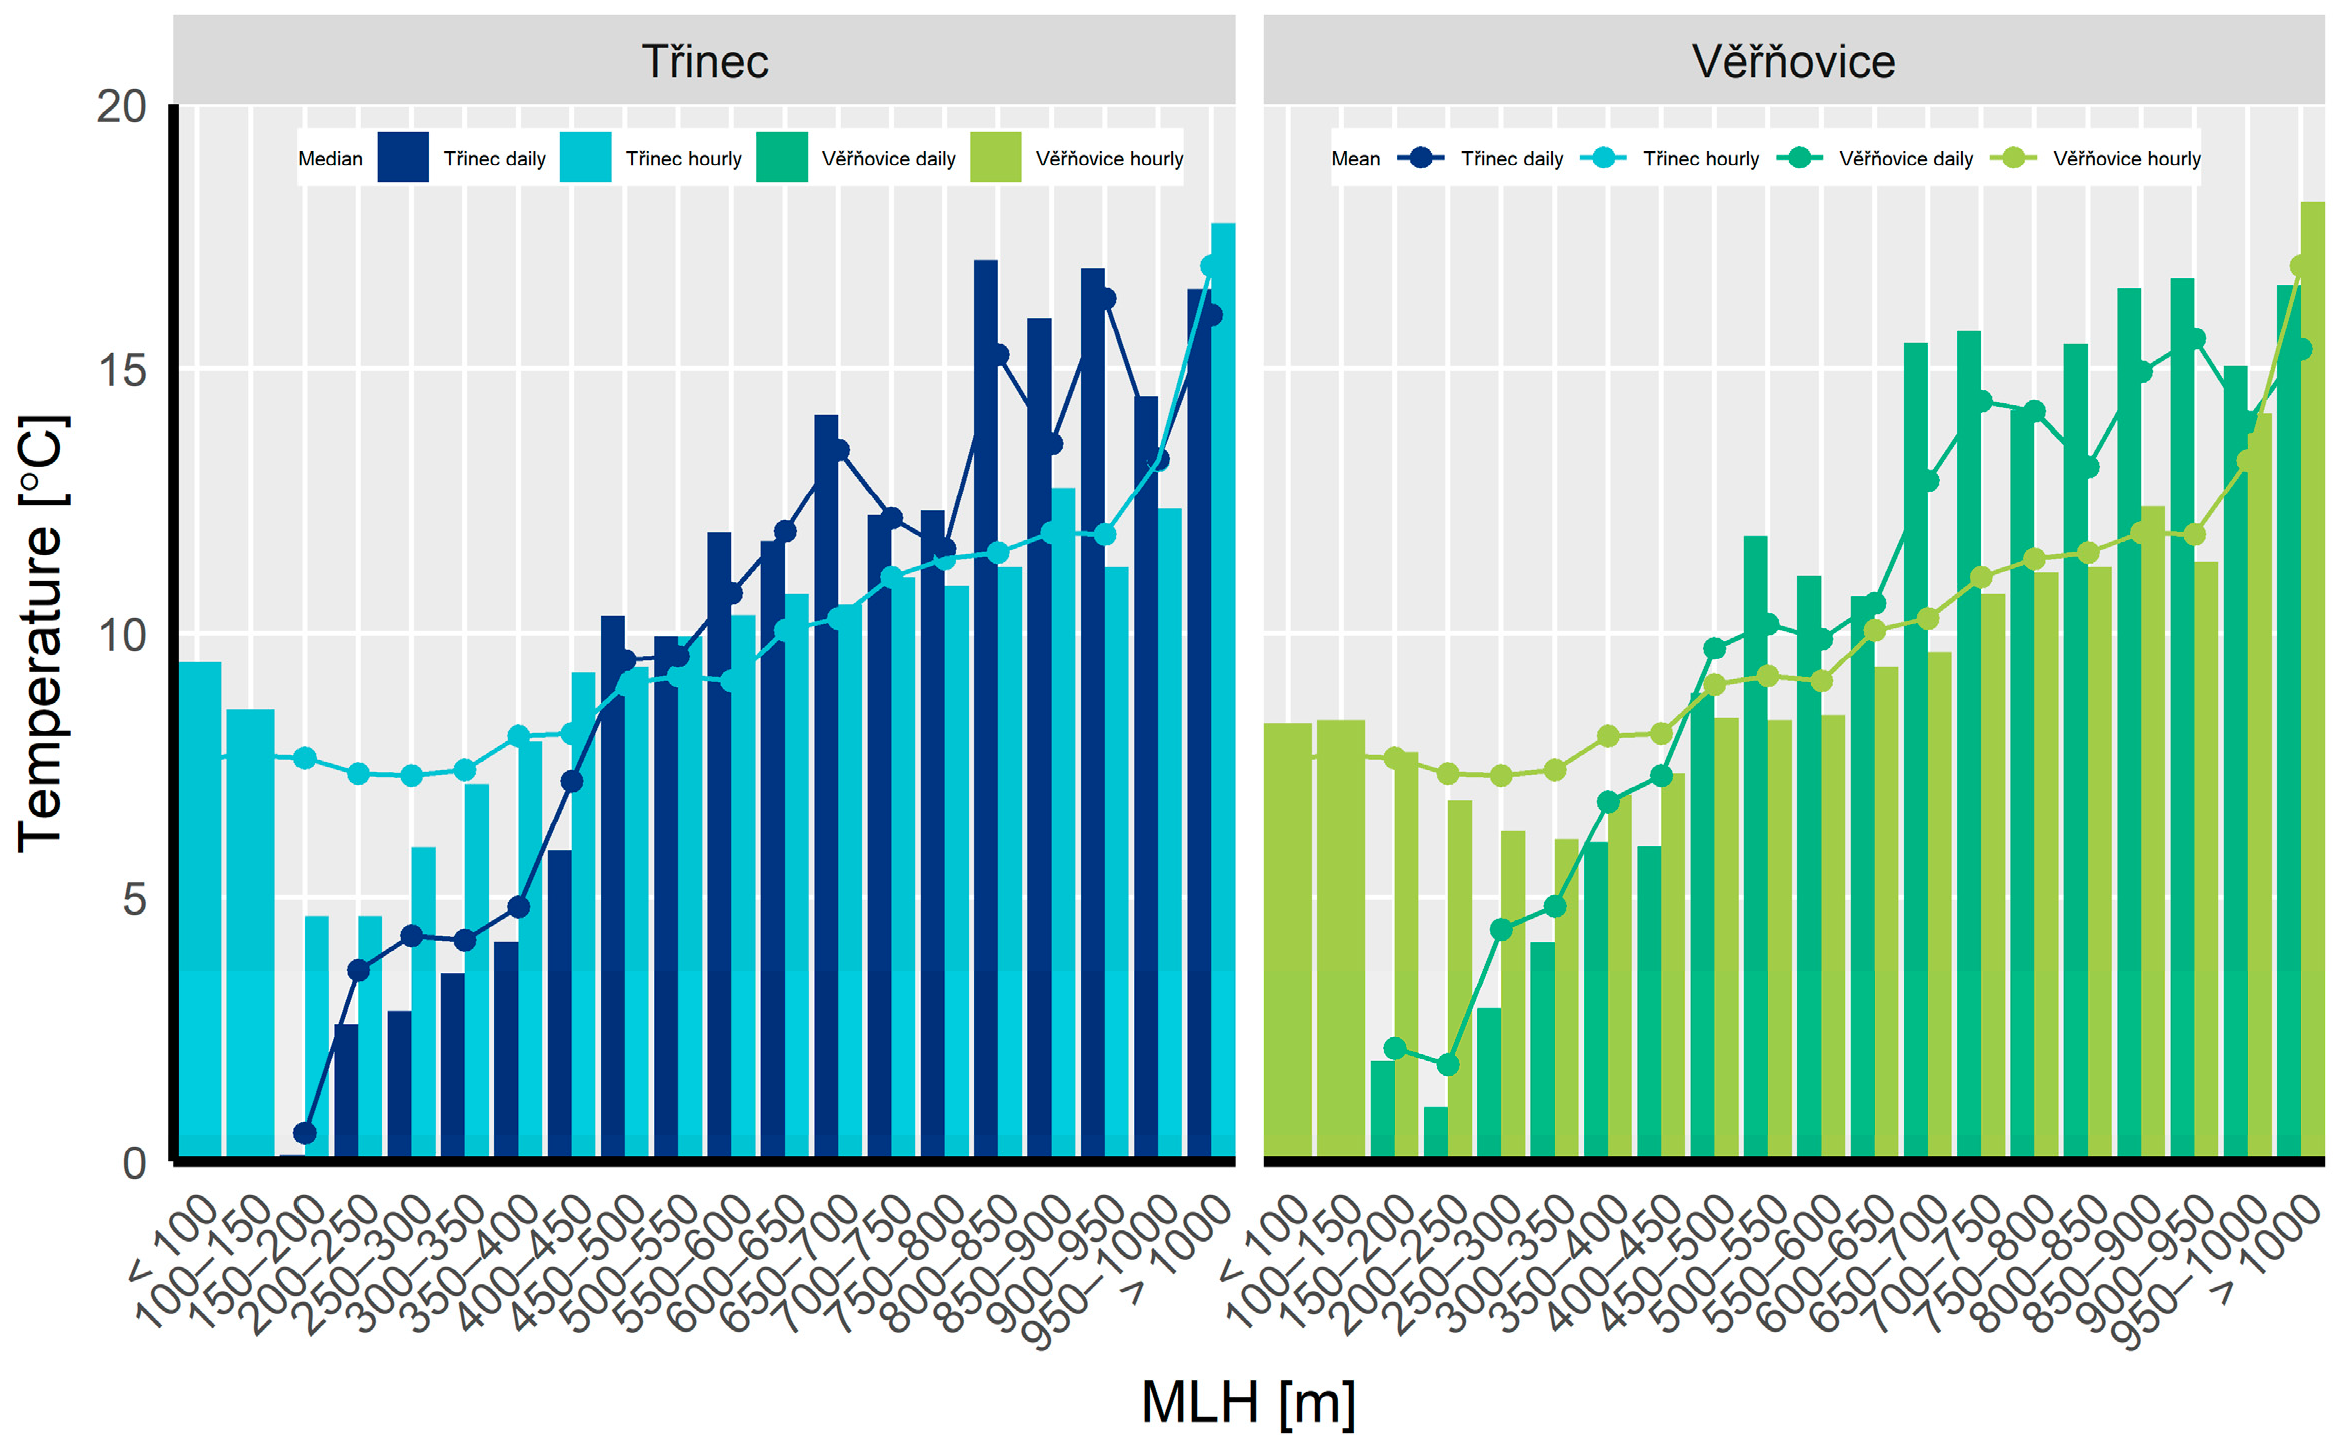
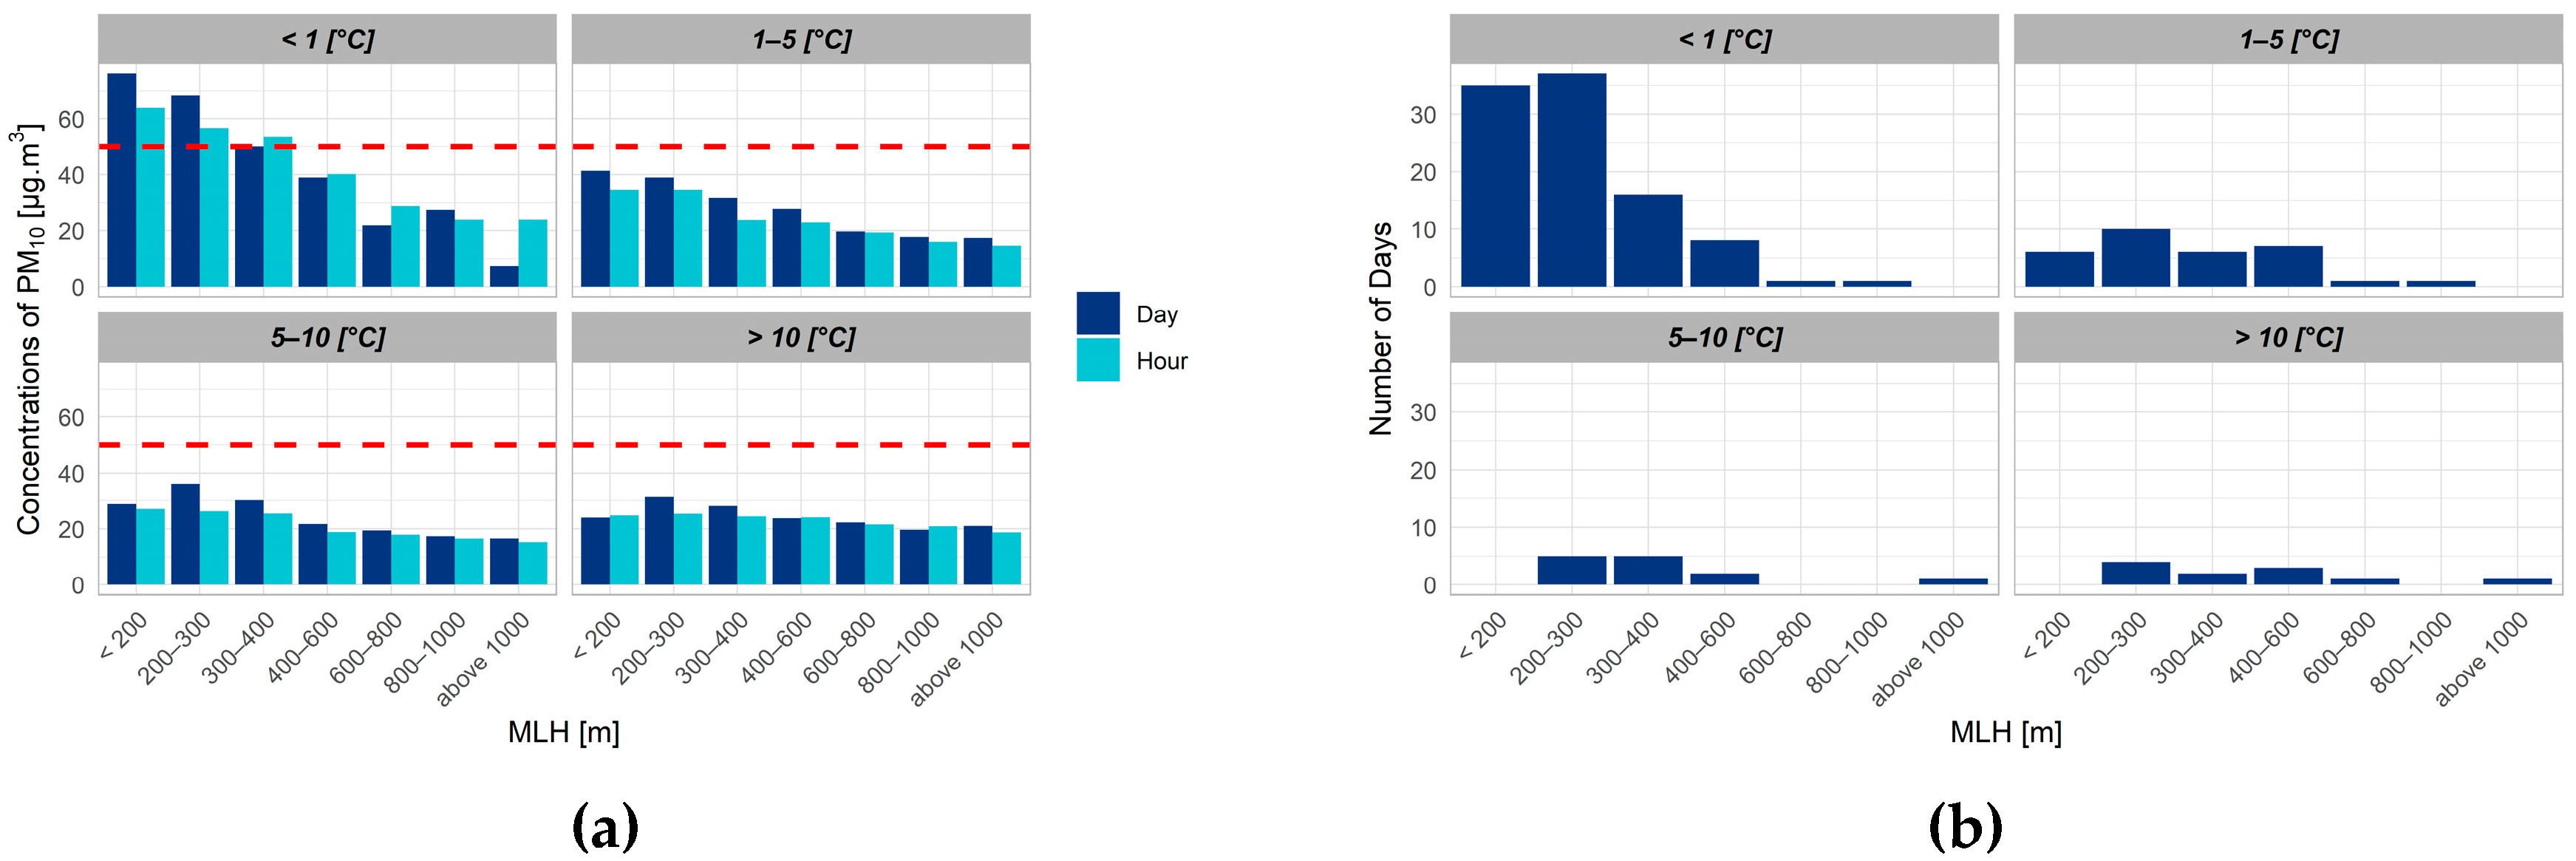
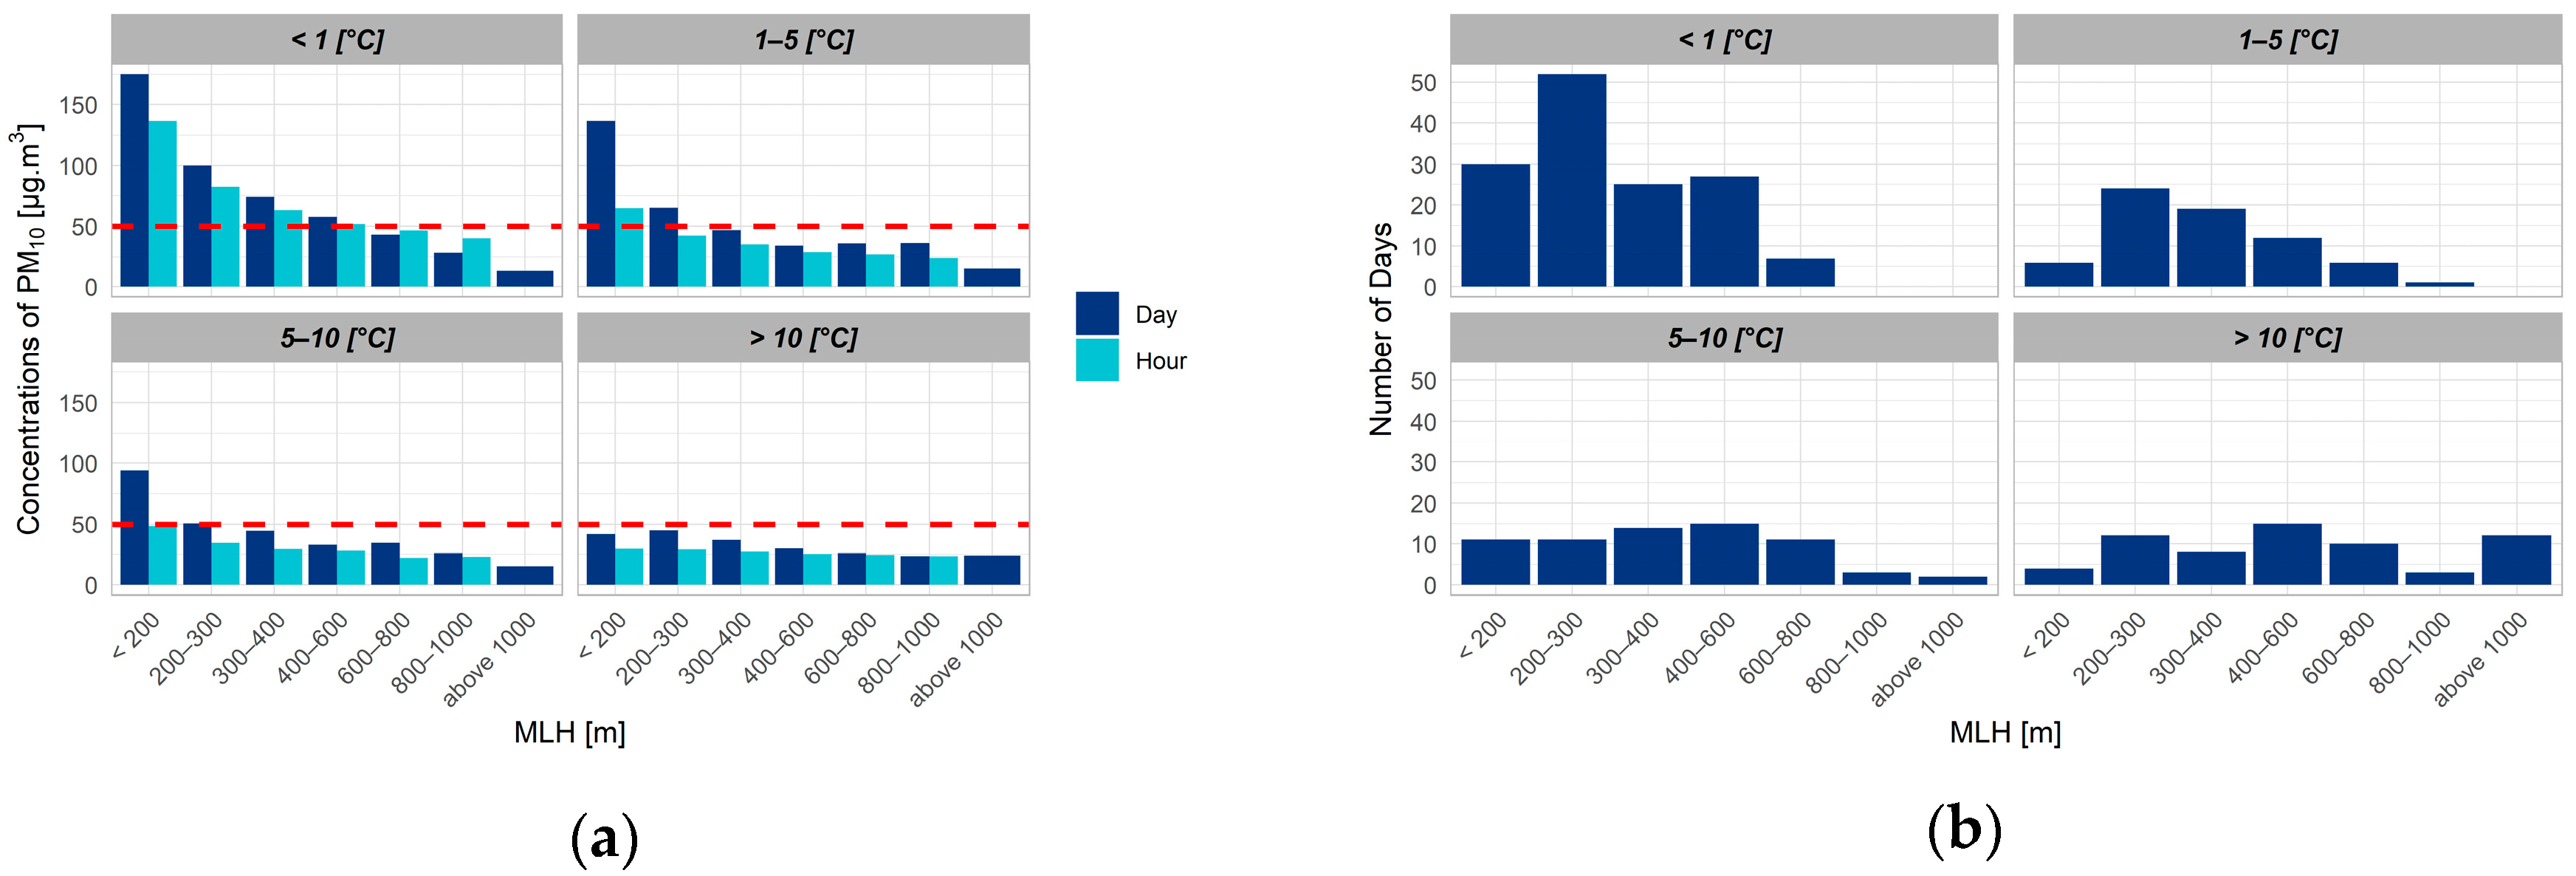
3.2. Dependence of the Suspended Particulate Matter Concentrations on the Mixing Layer Height and the Air Temperature
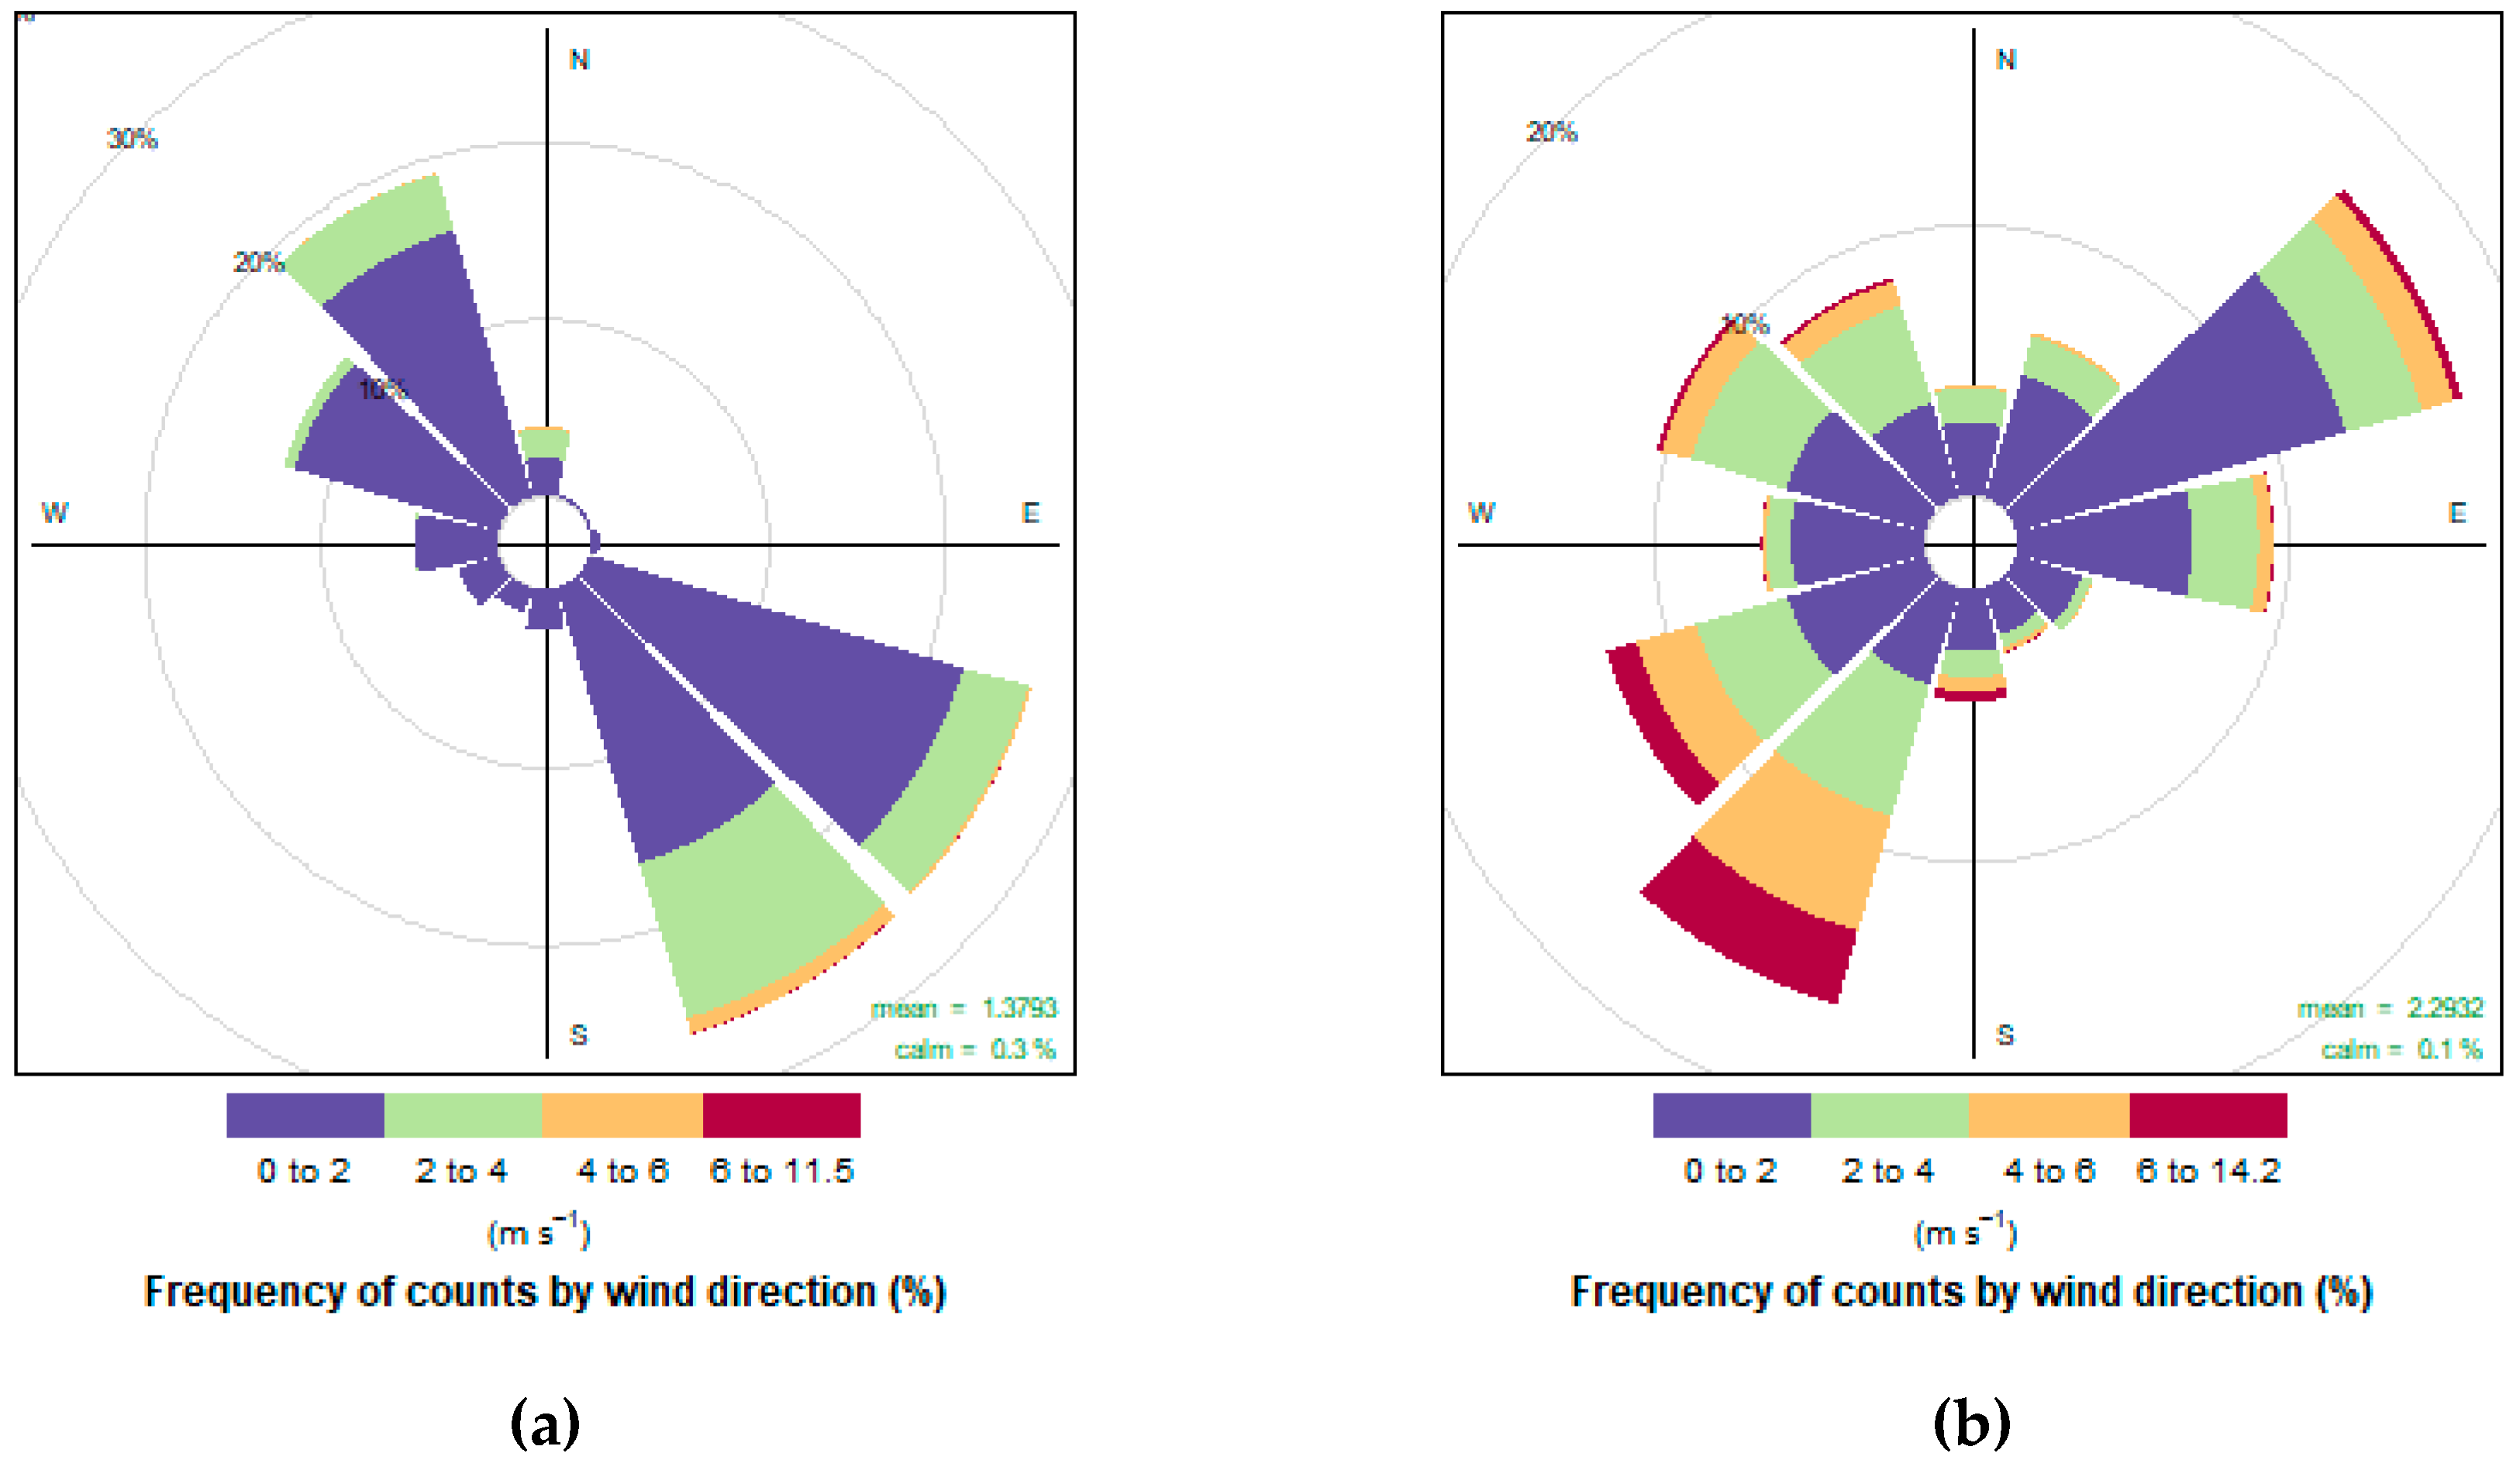
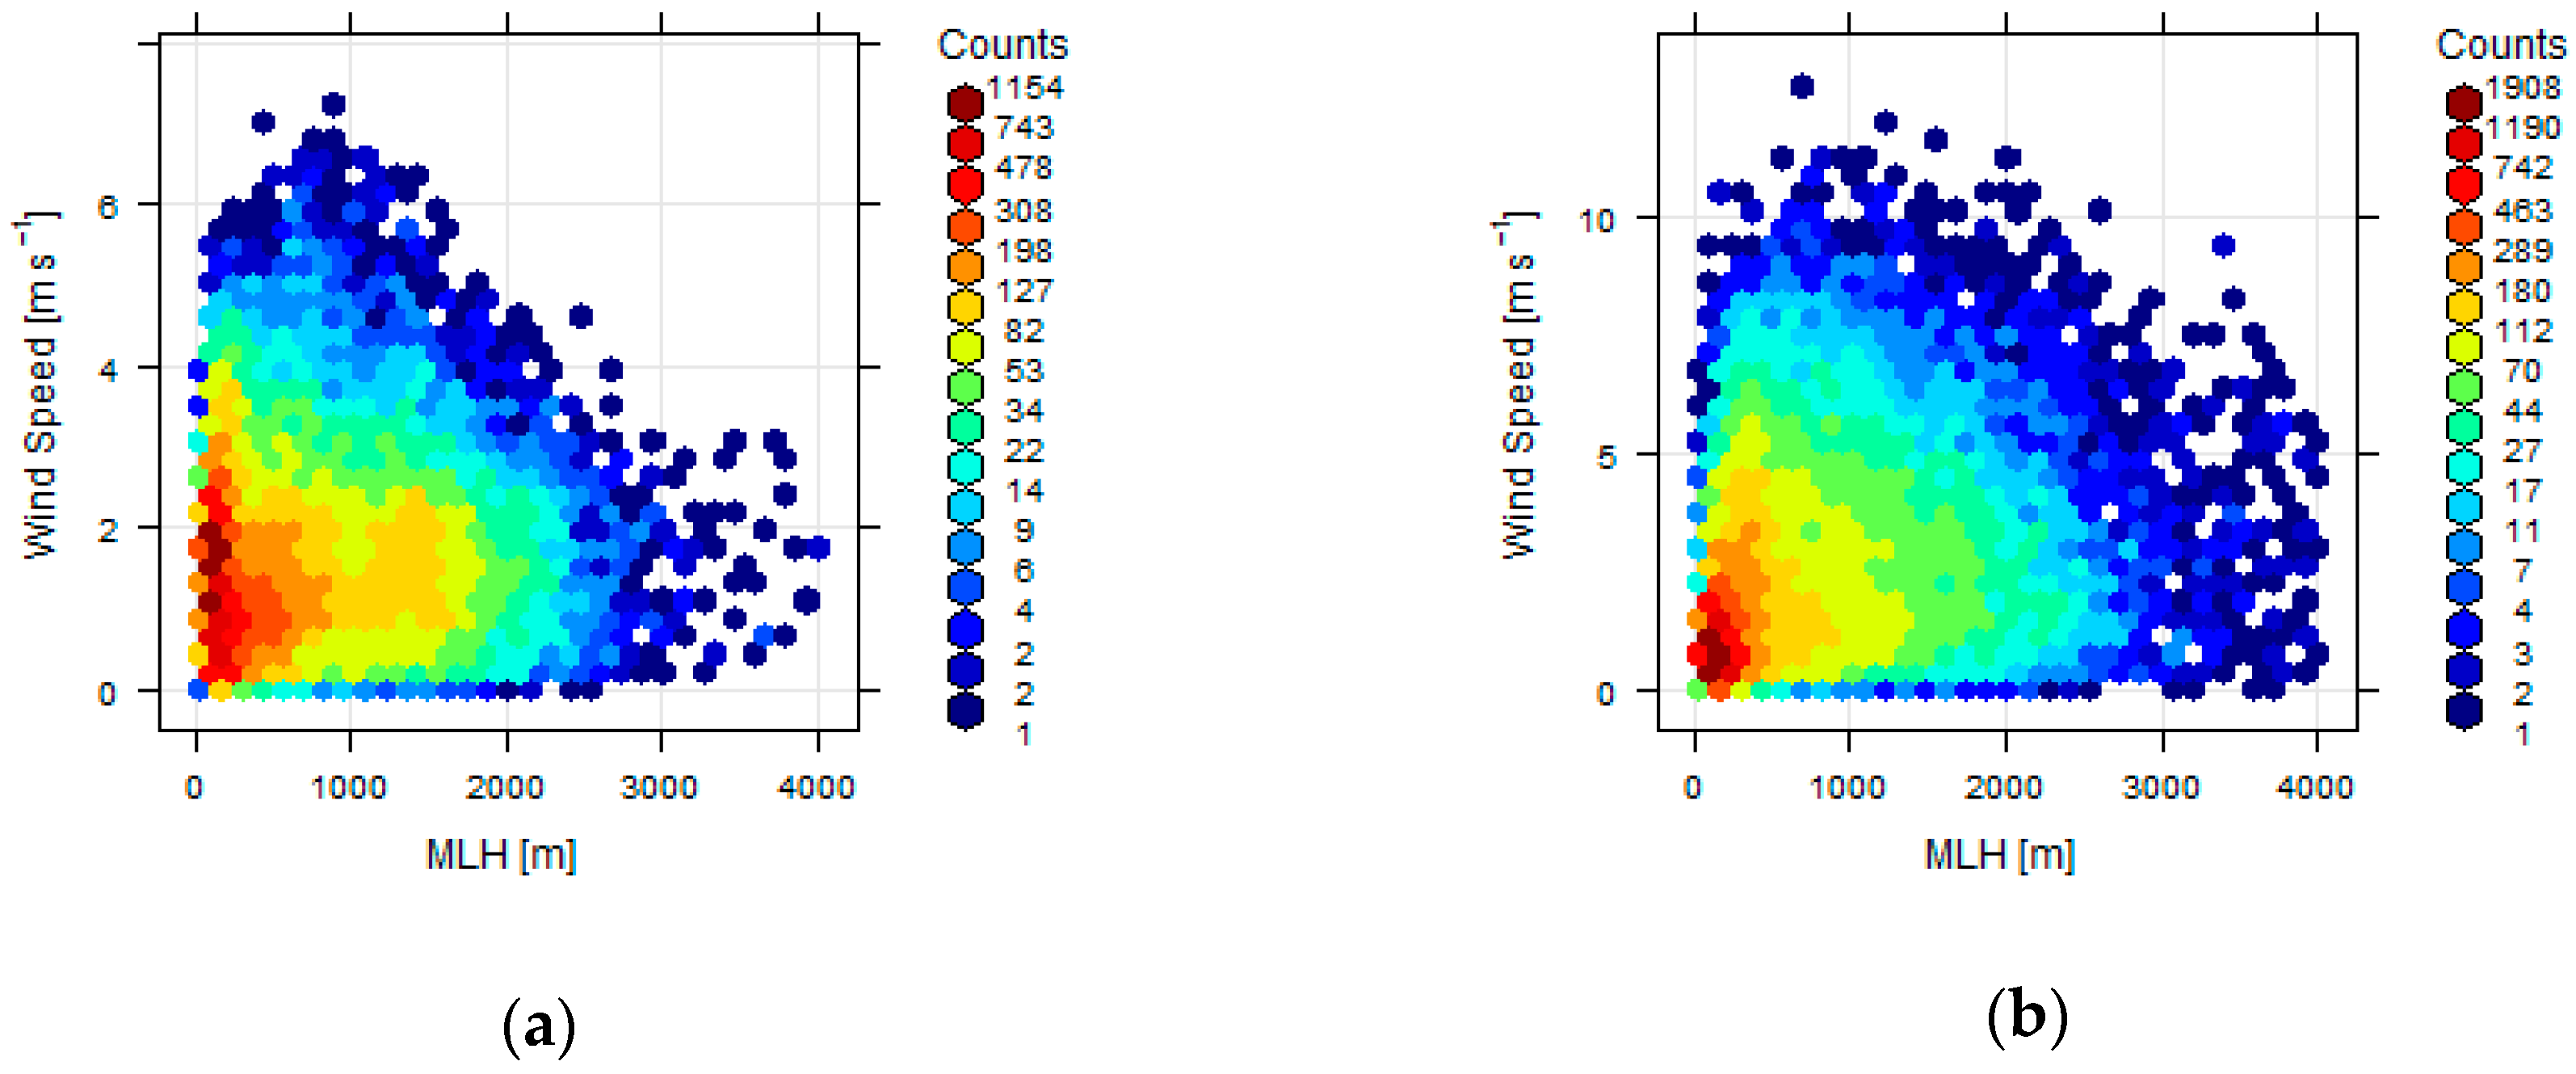
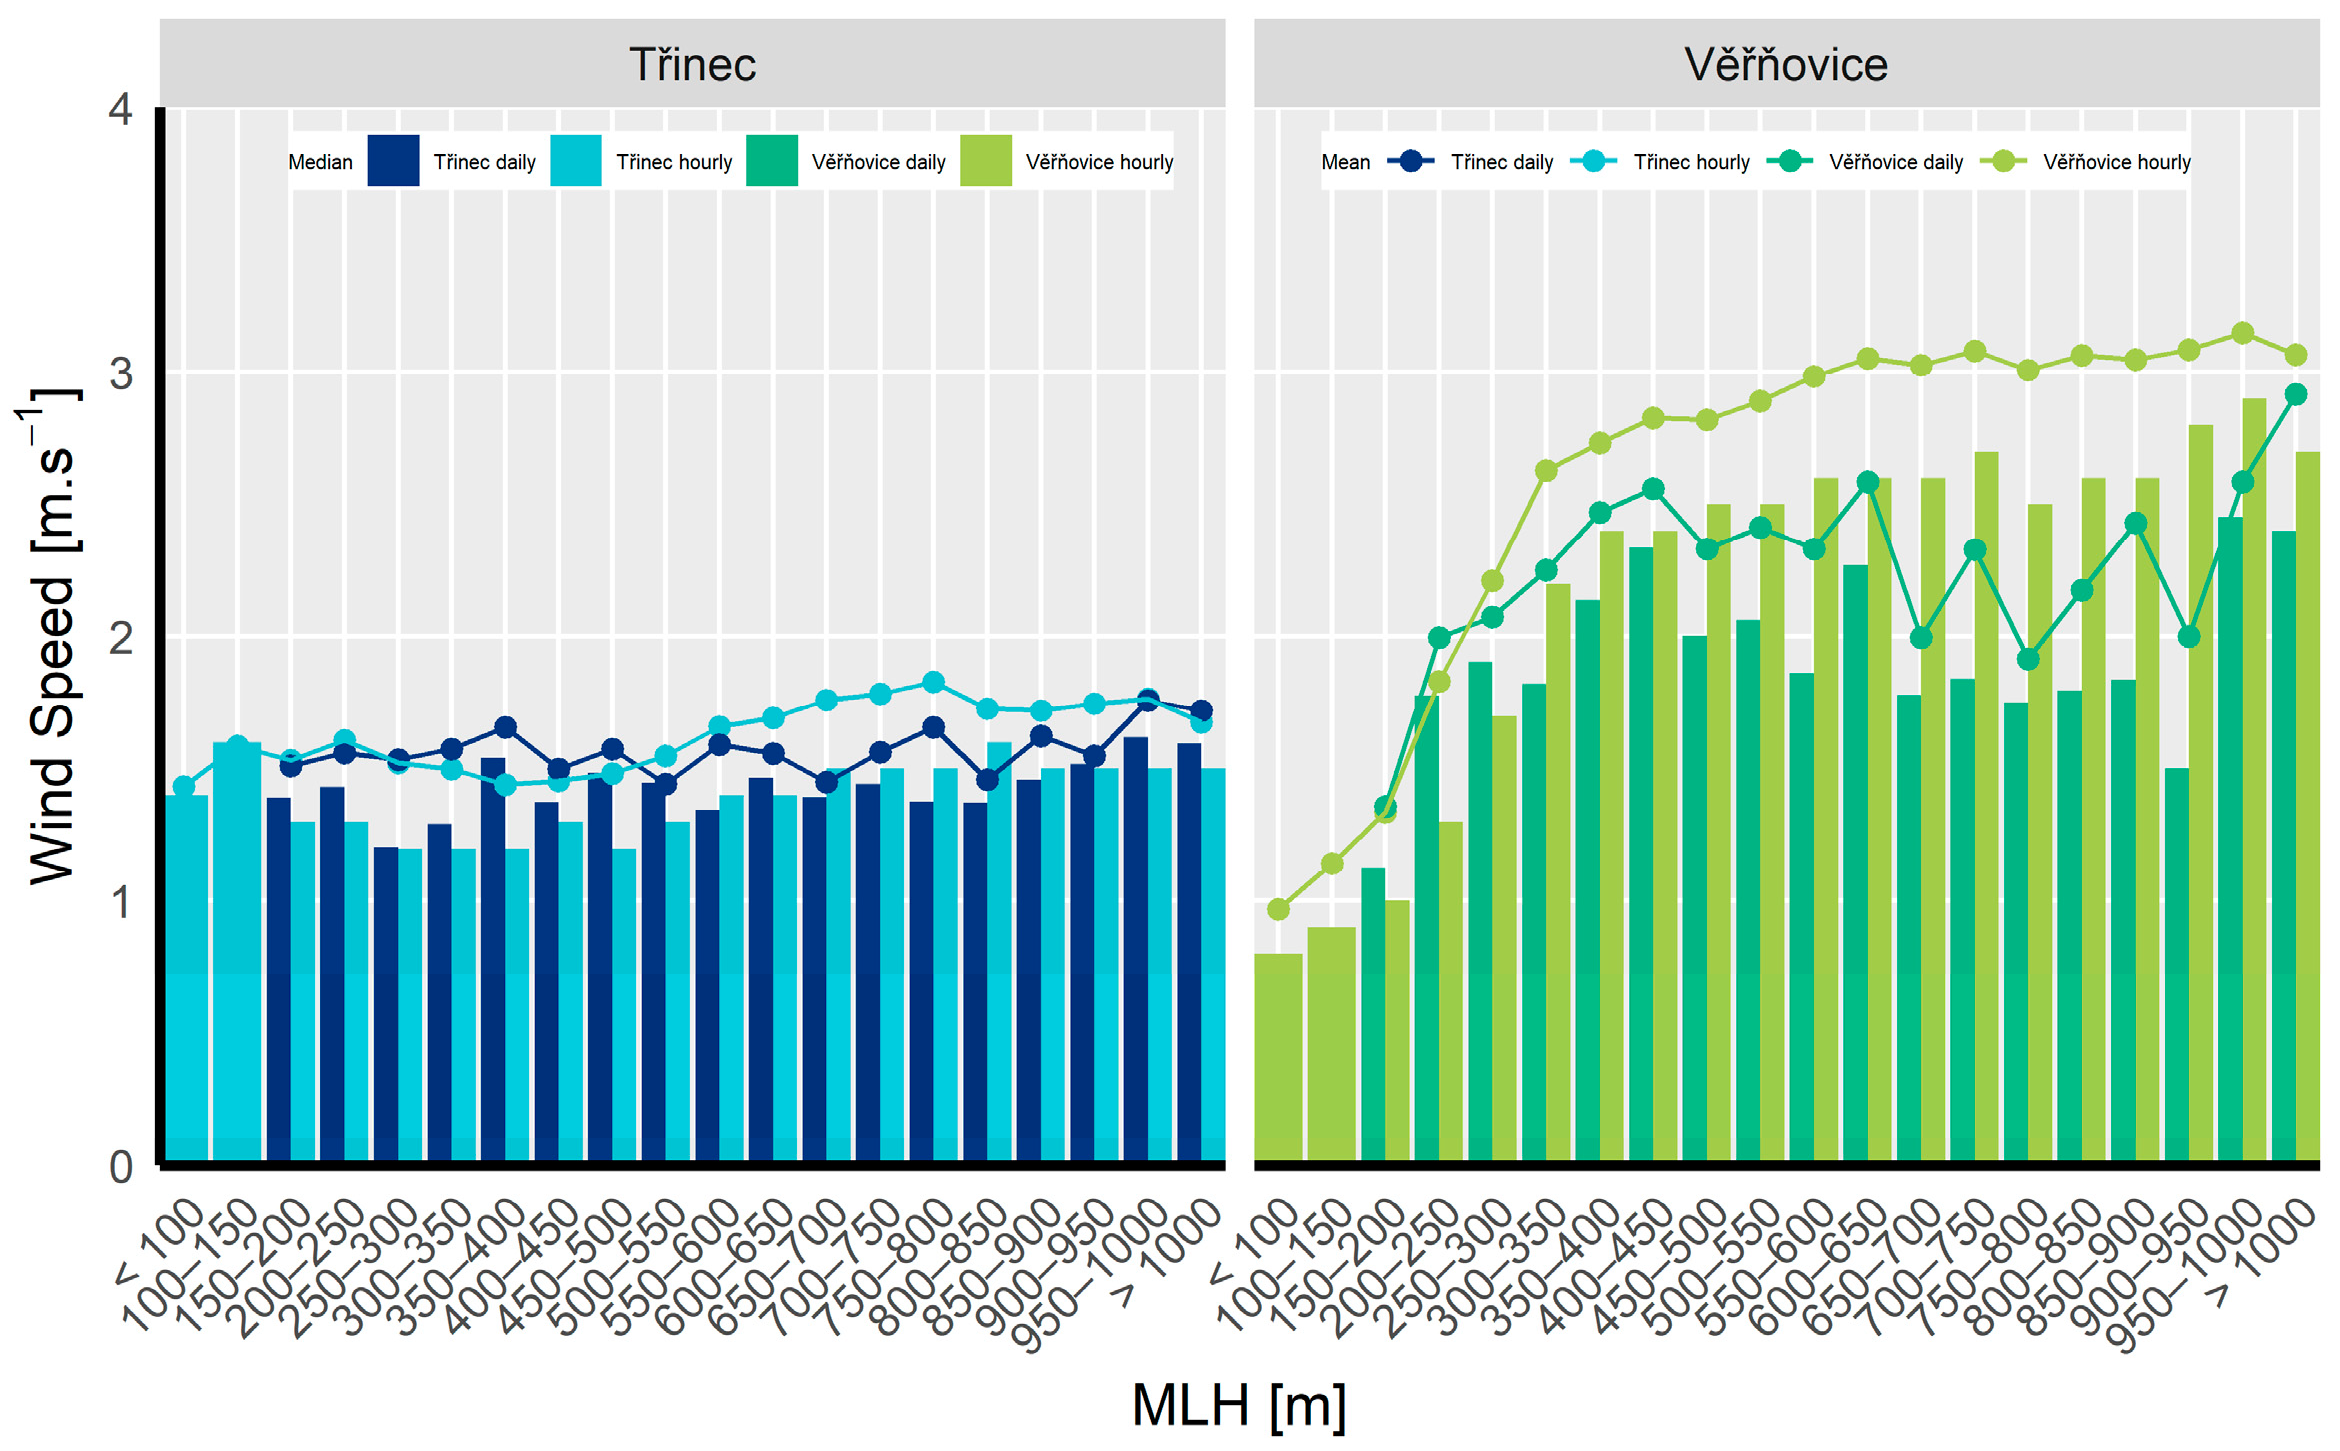
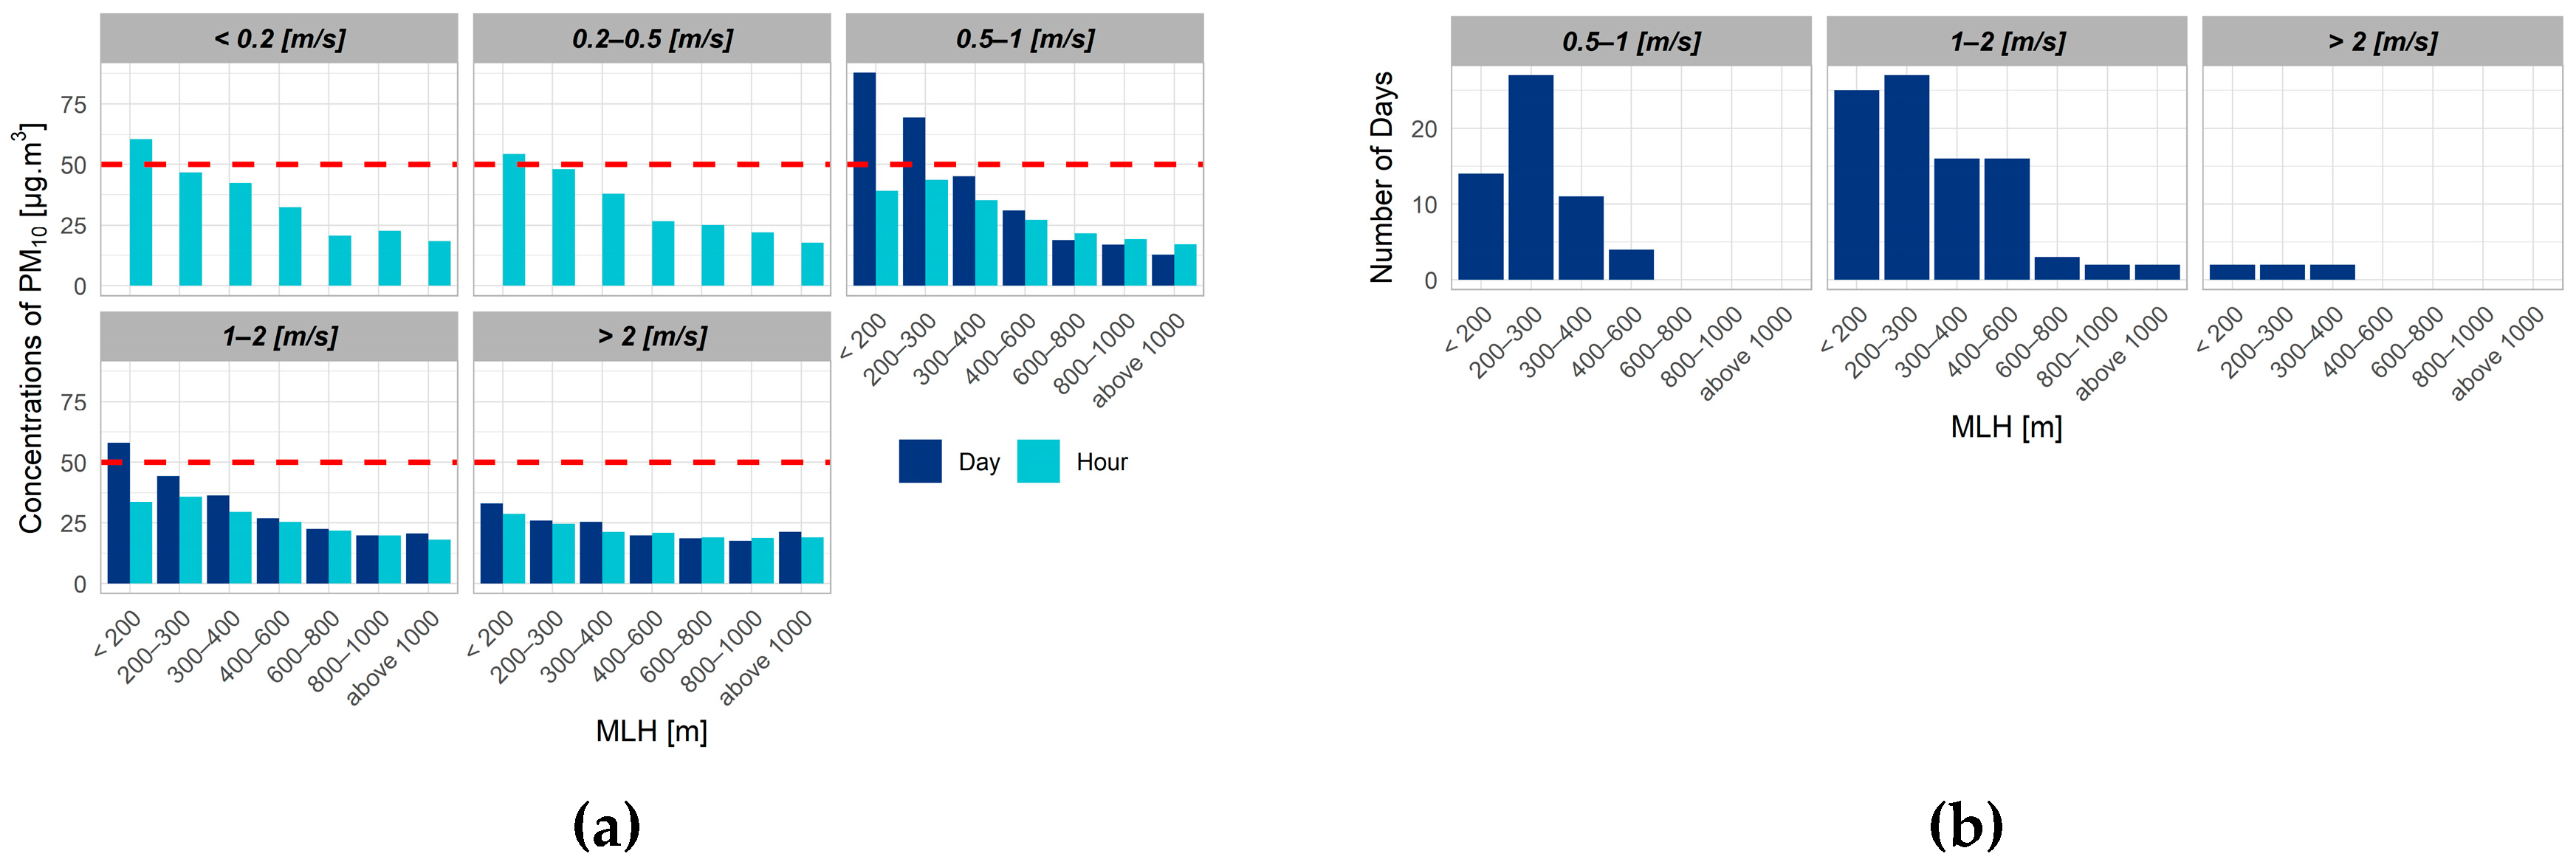
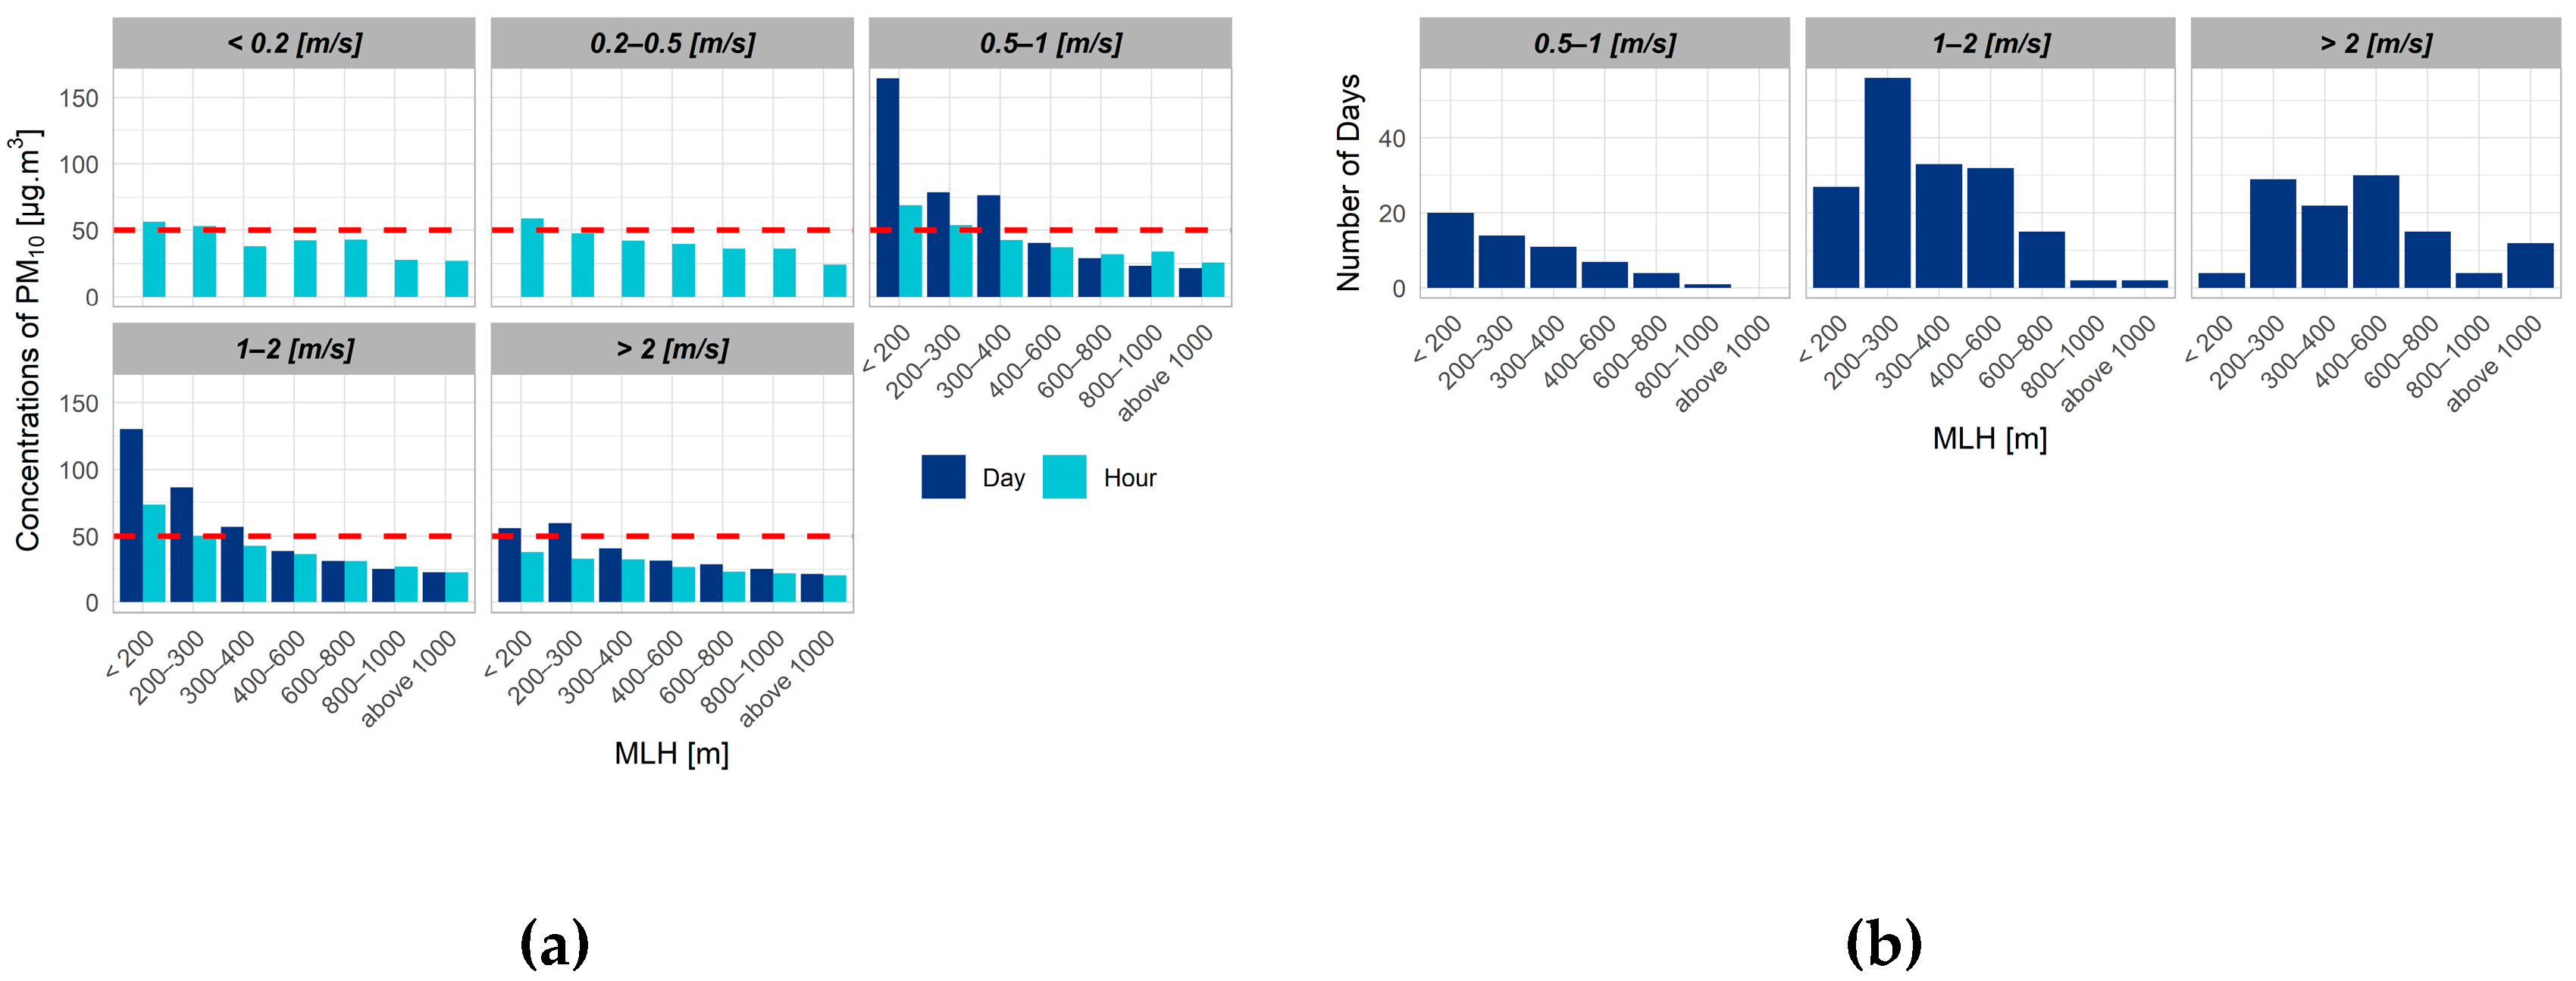
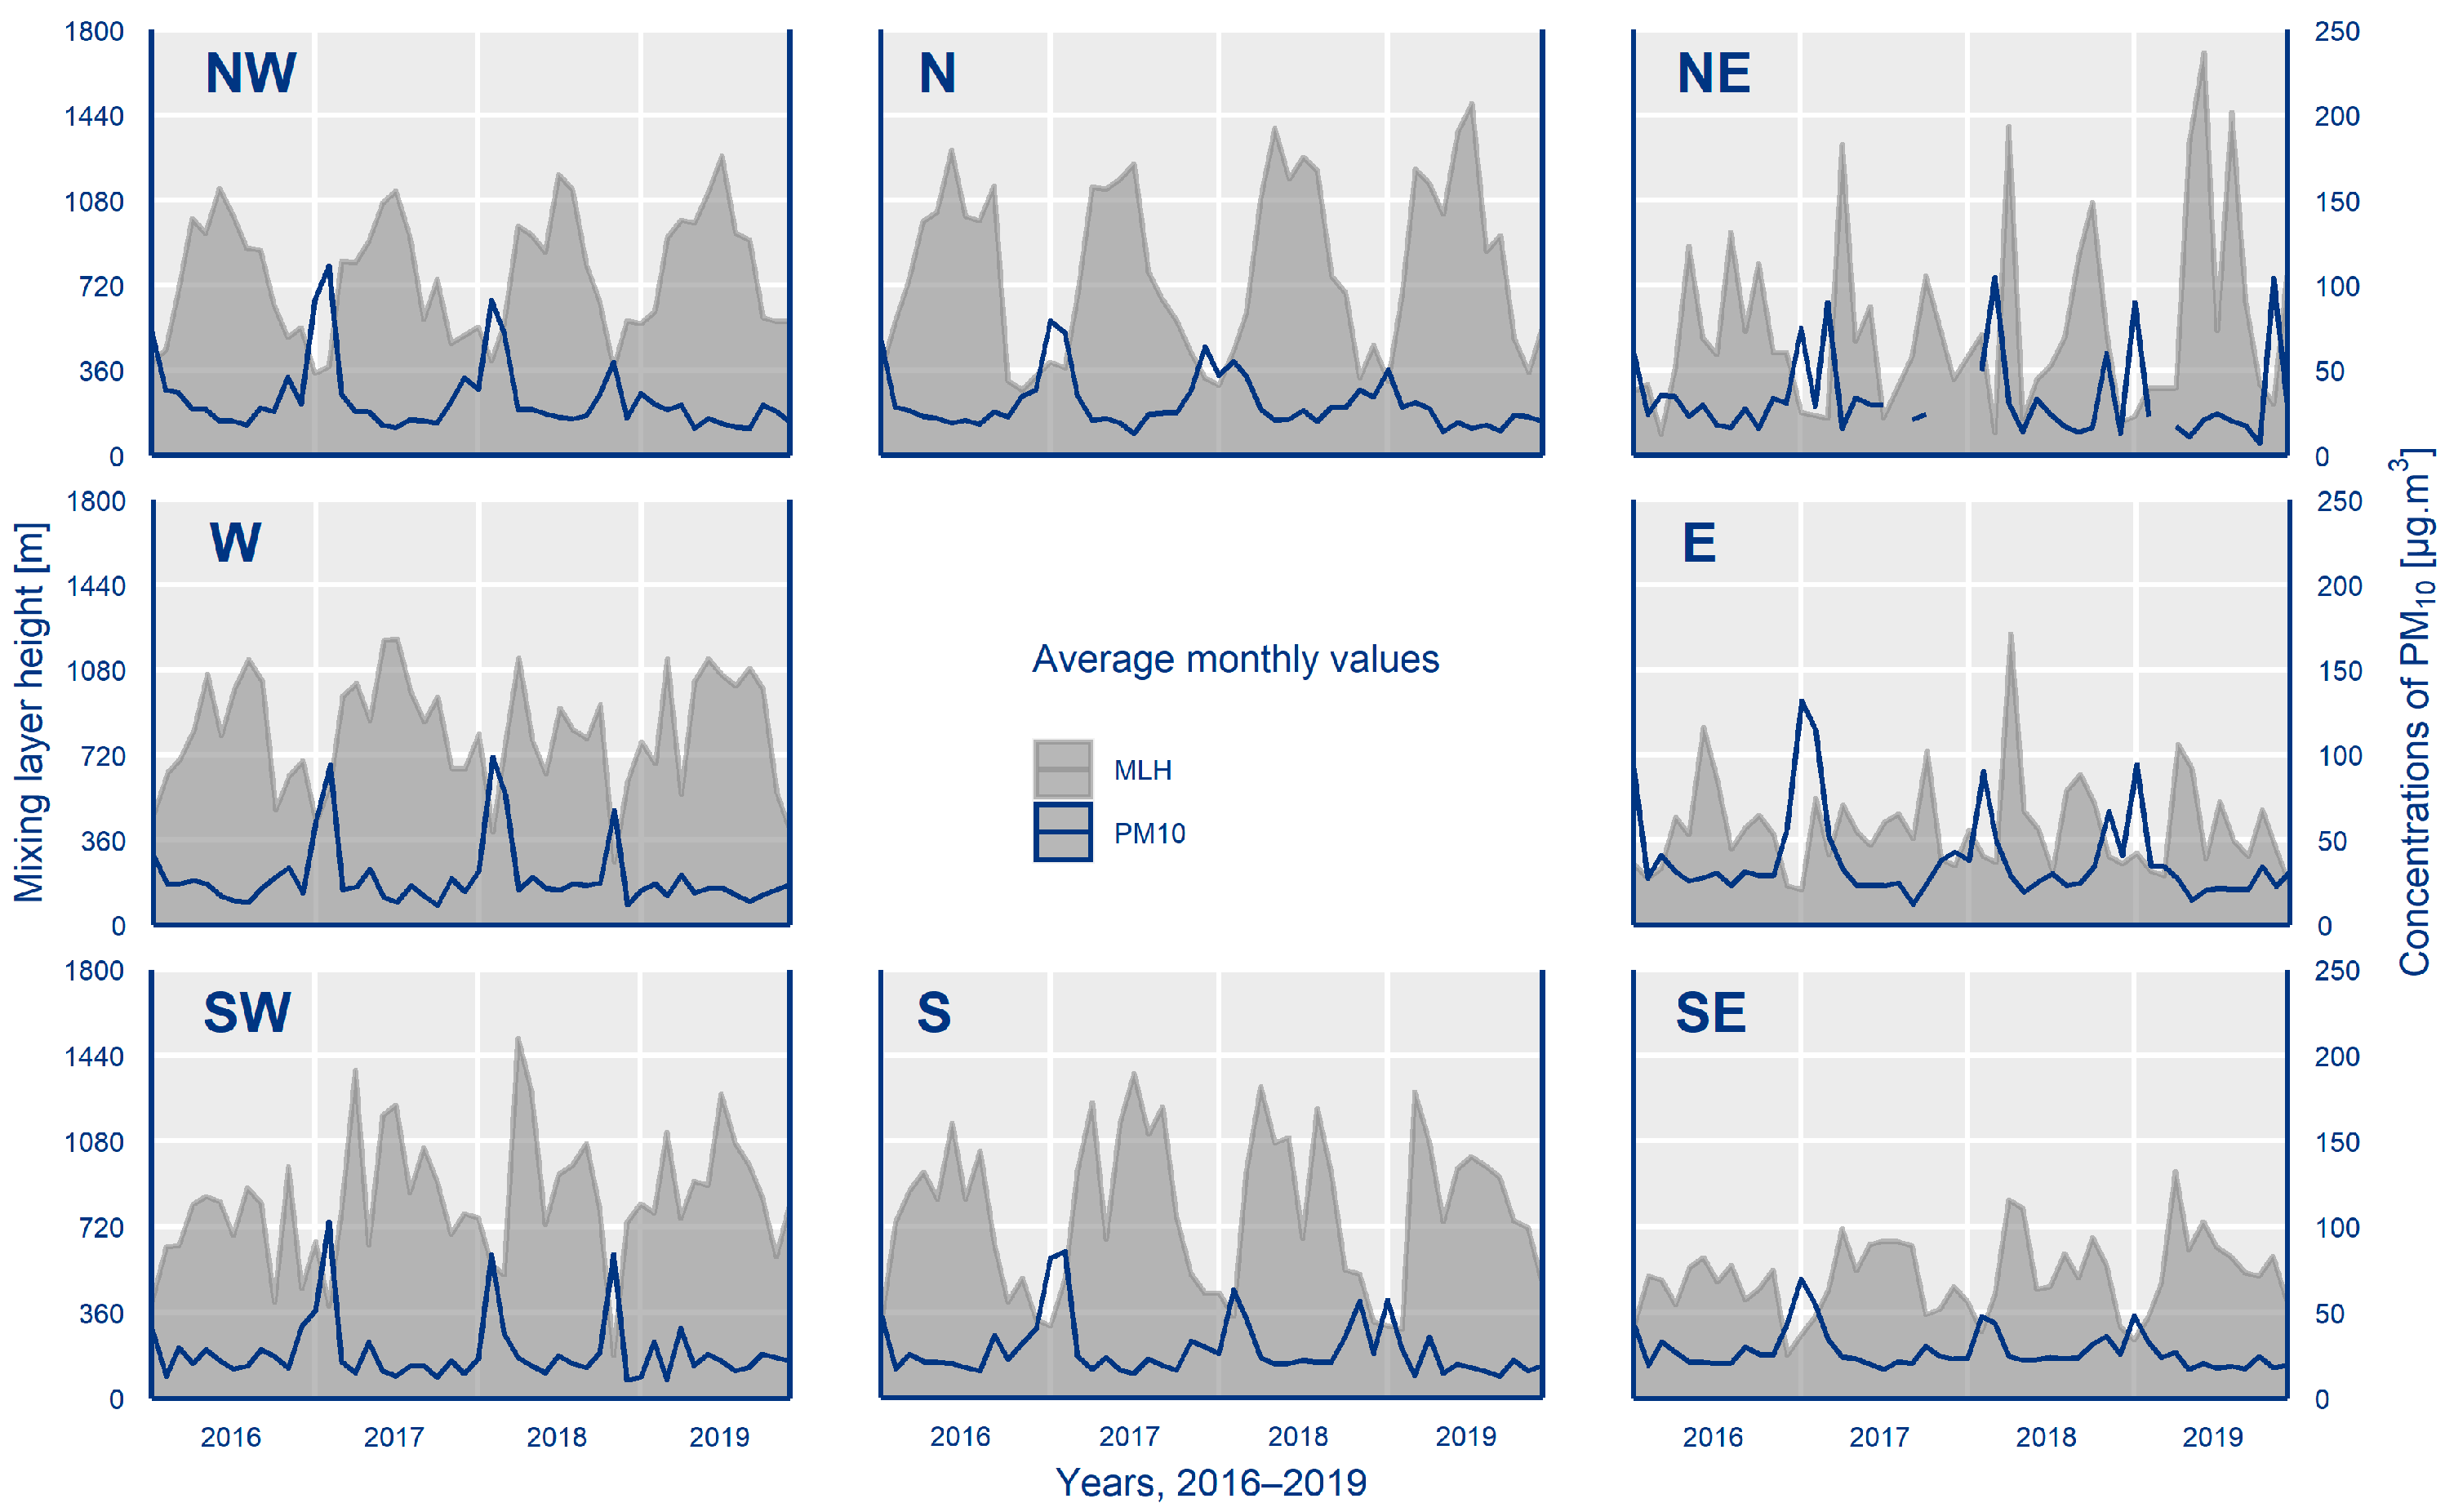
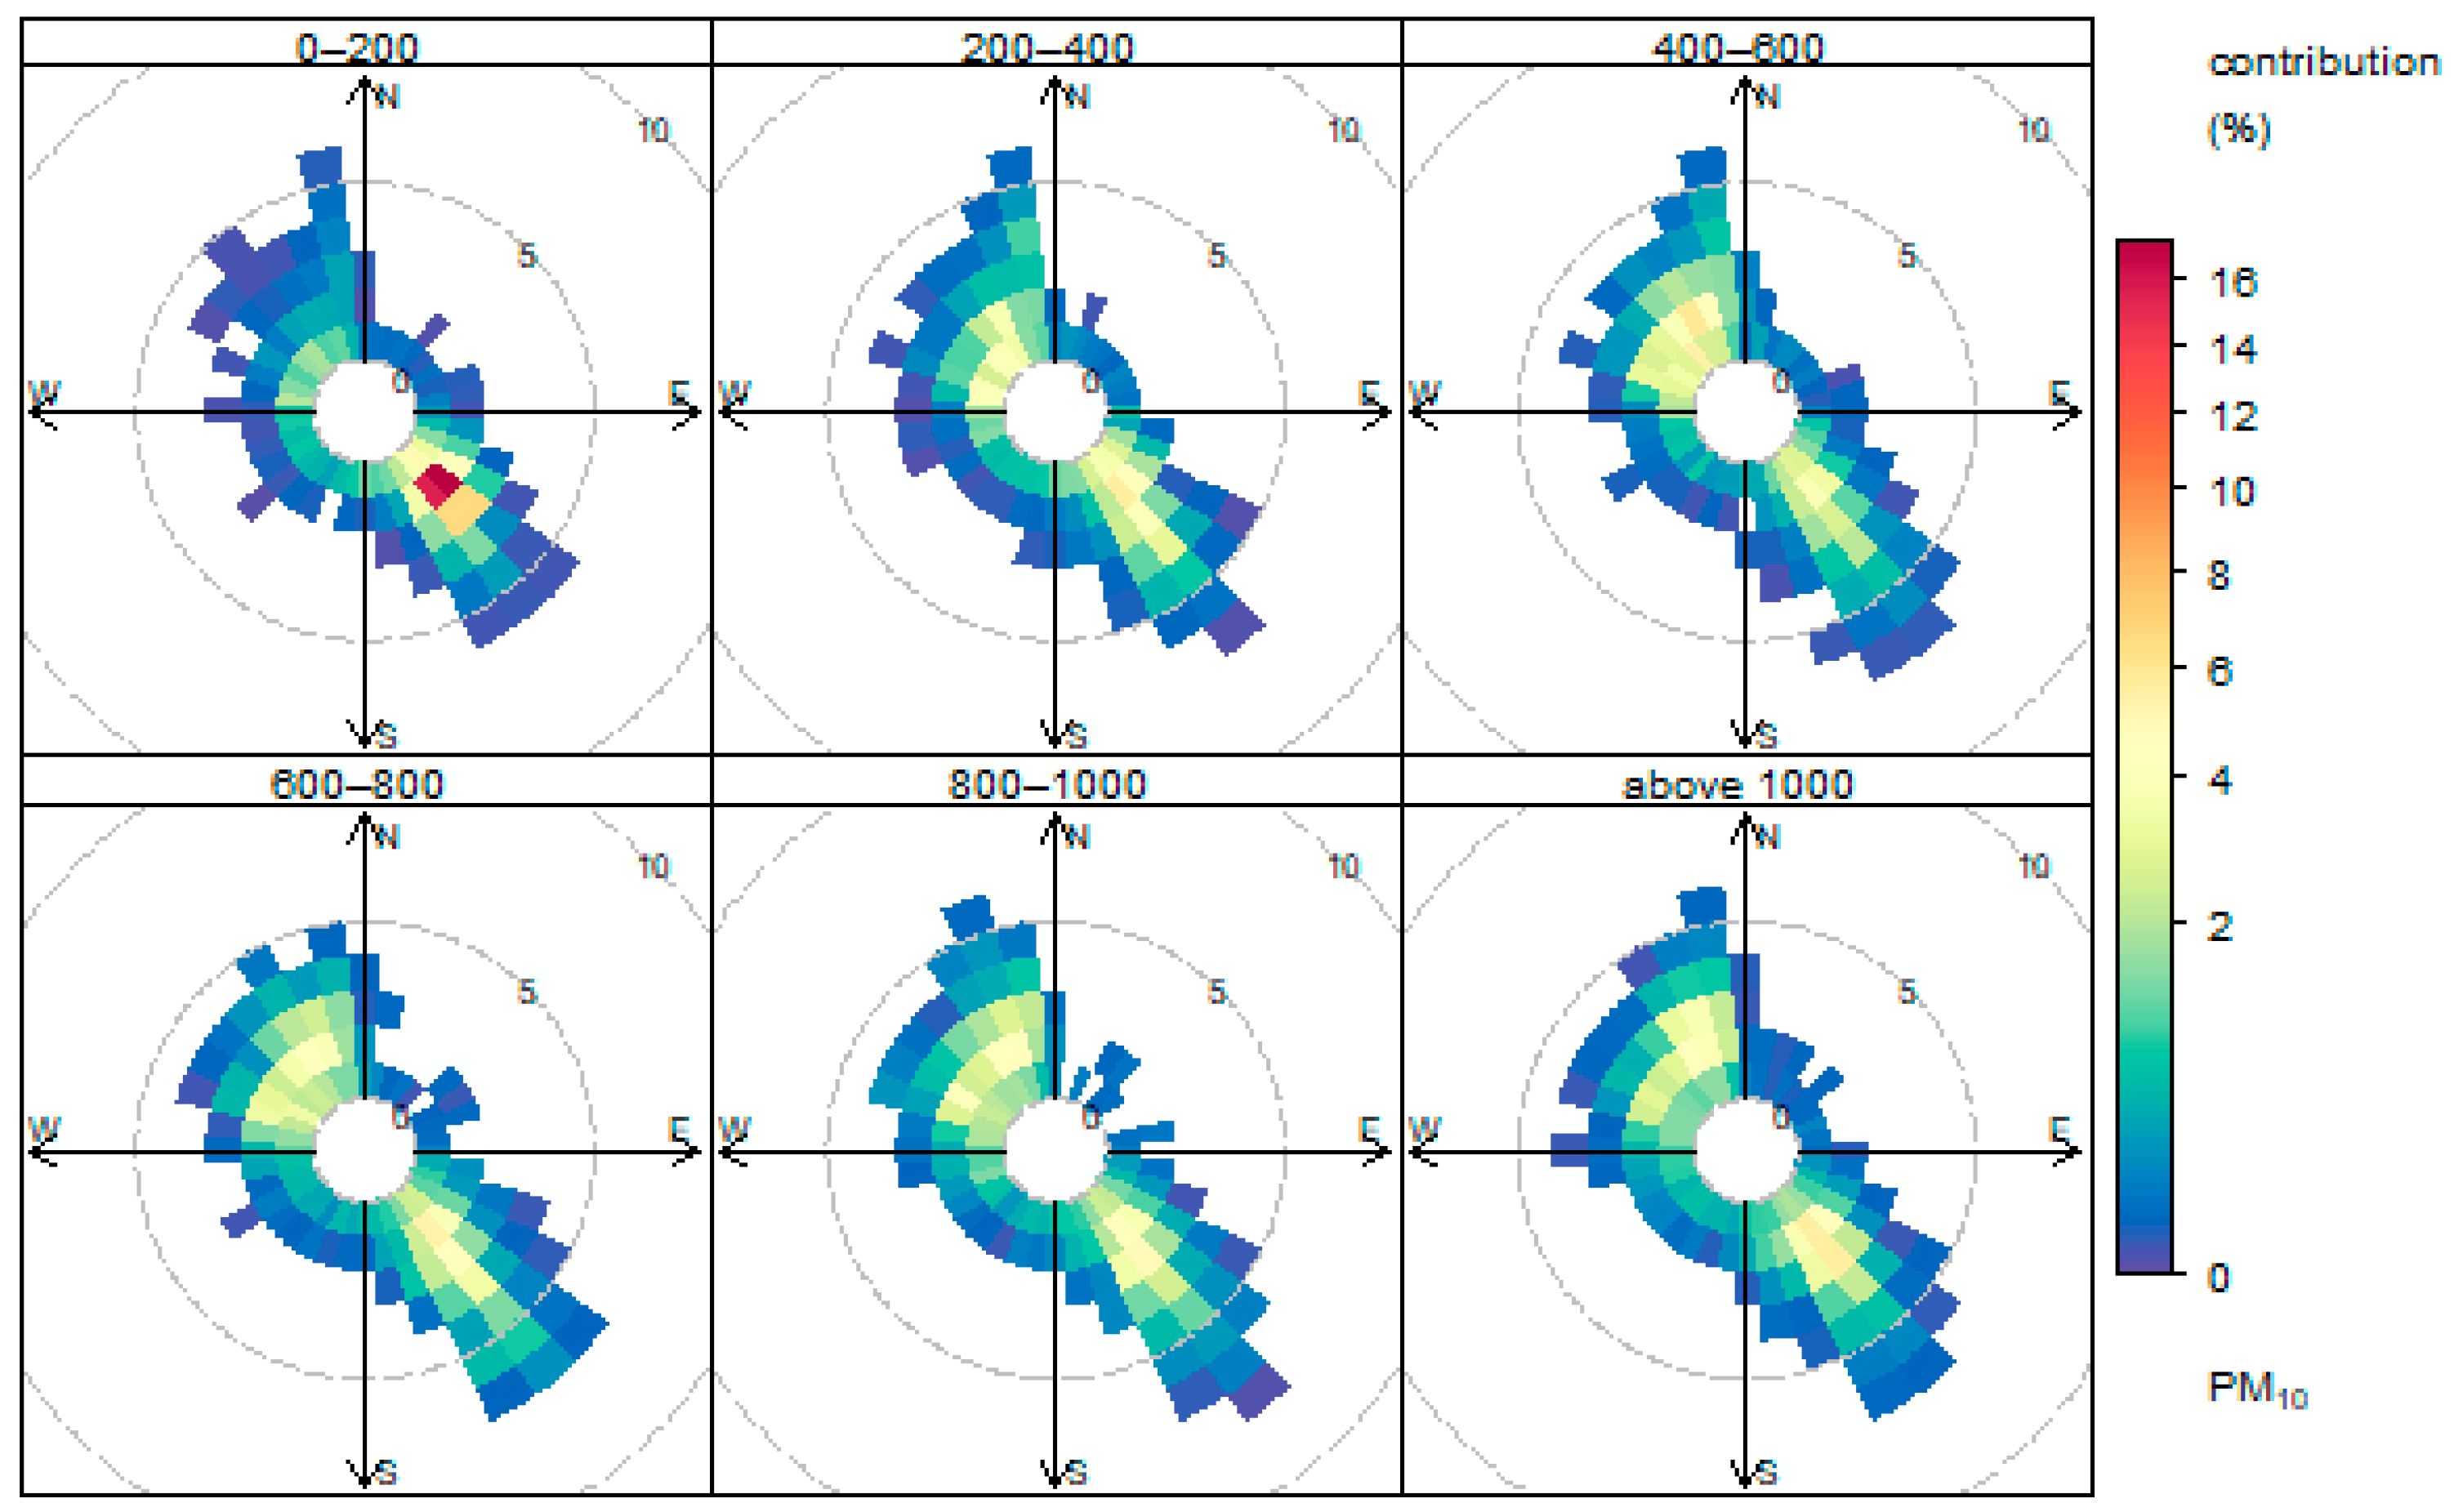
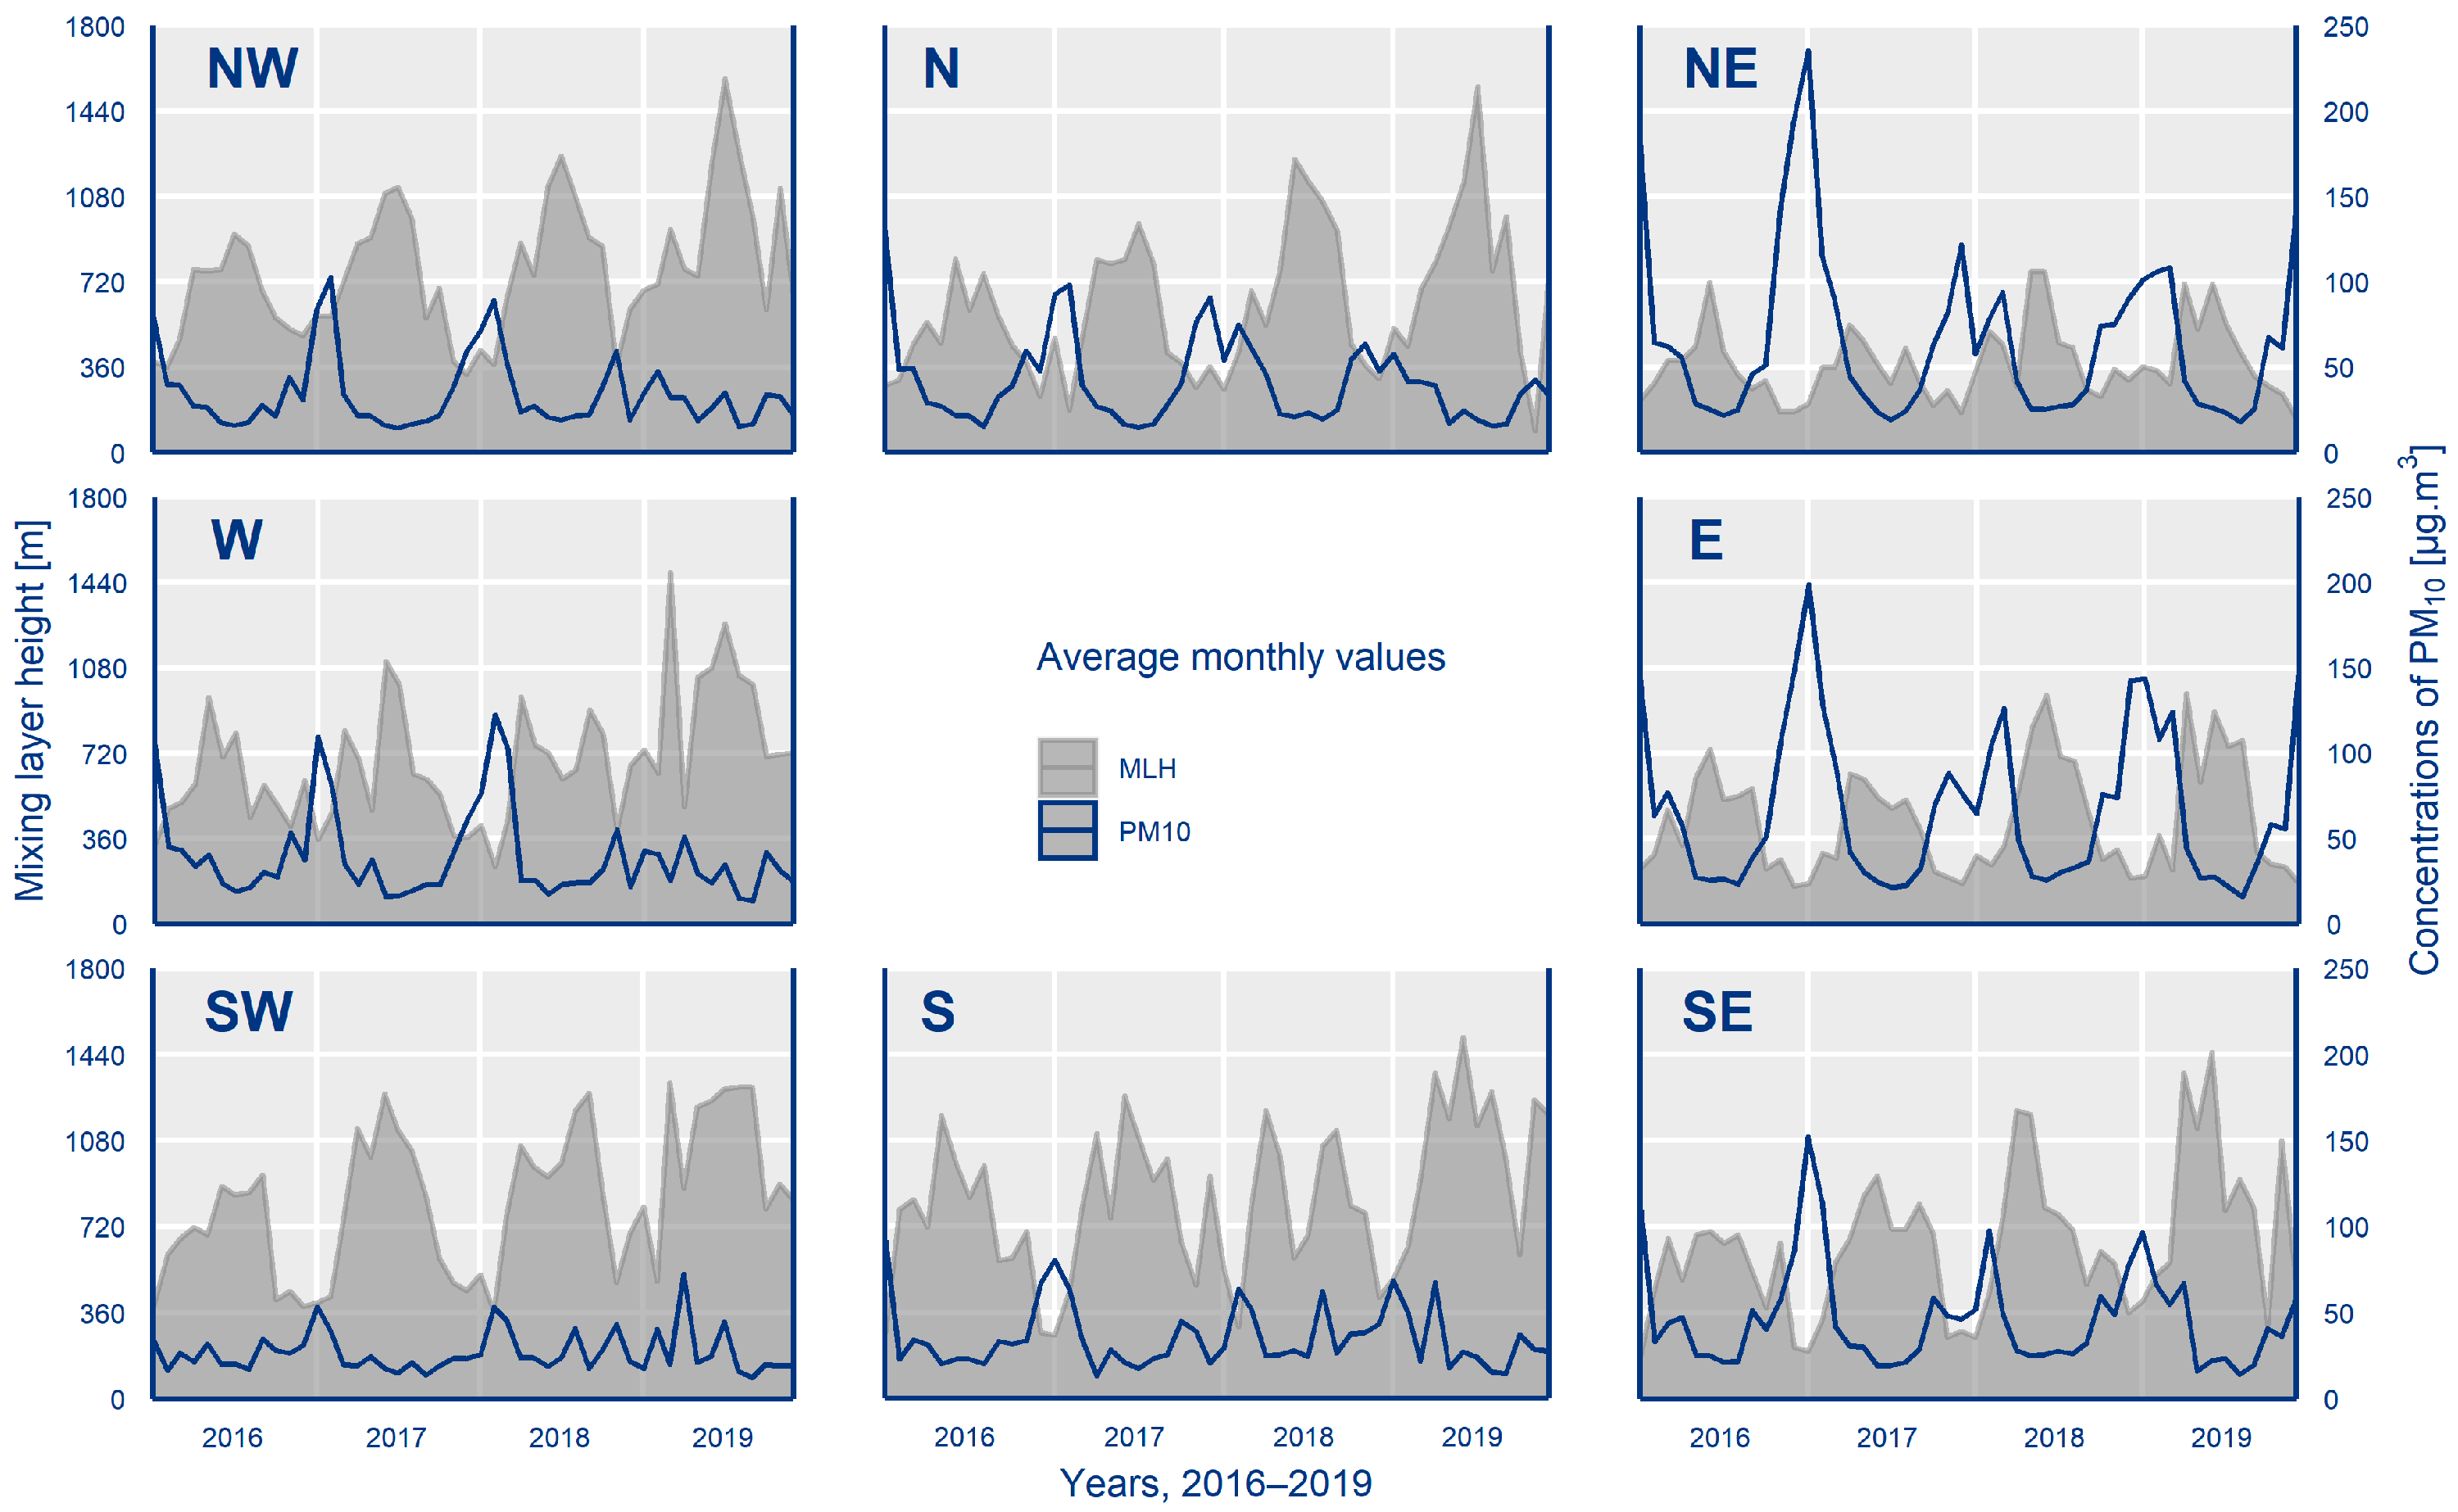
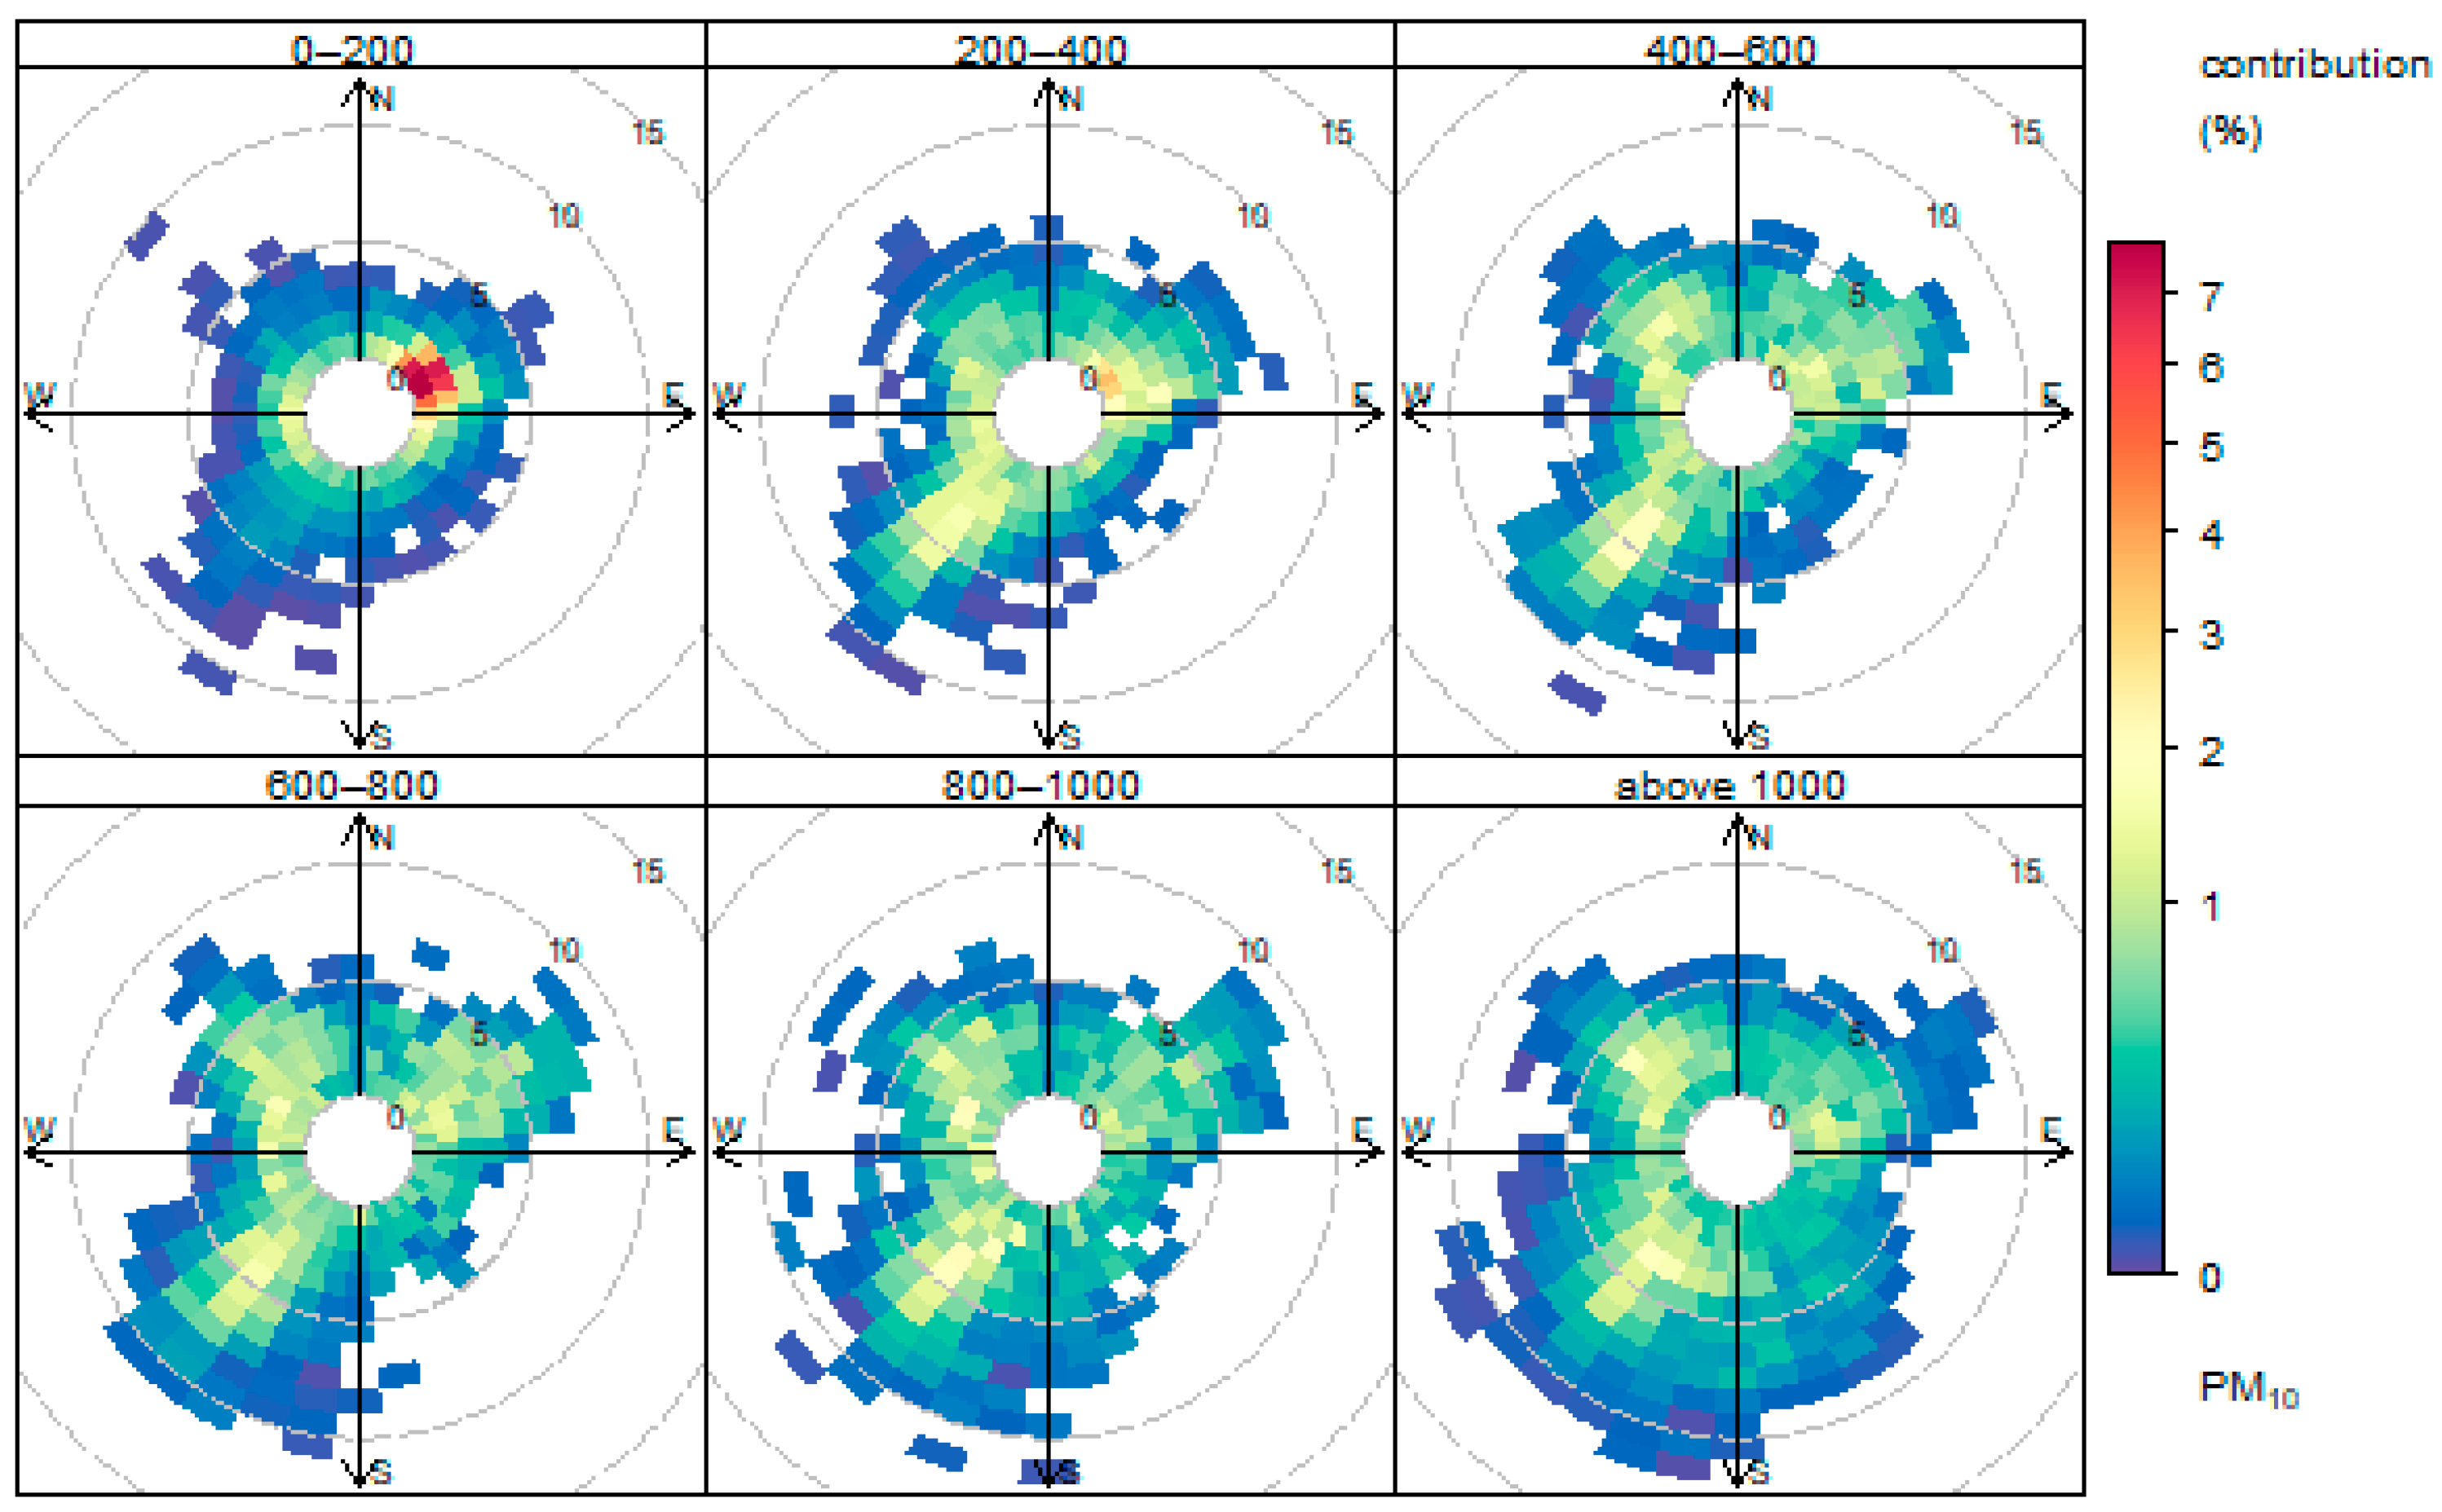
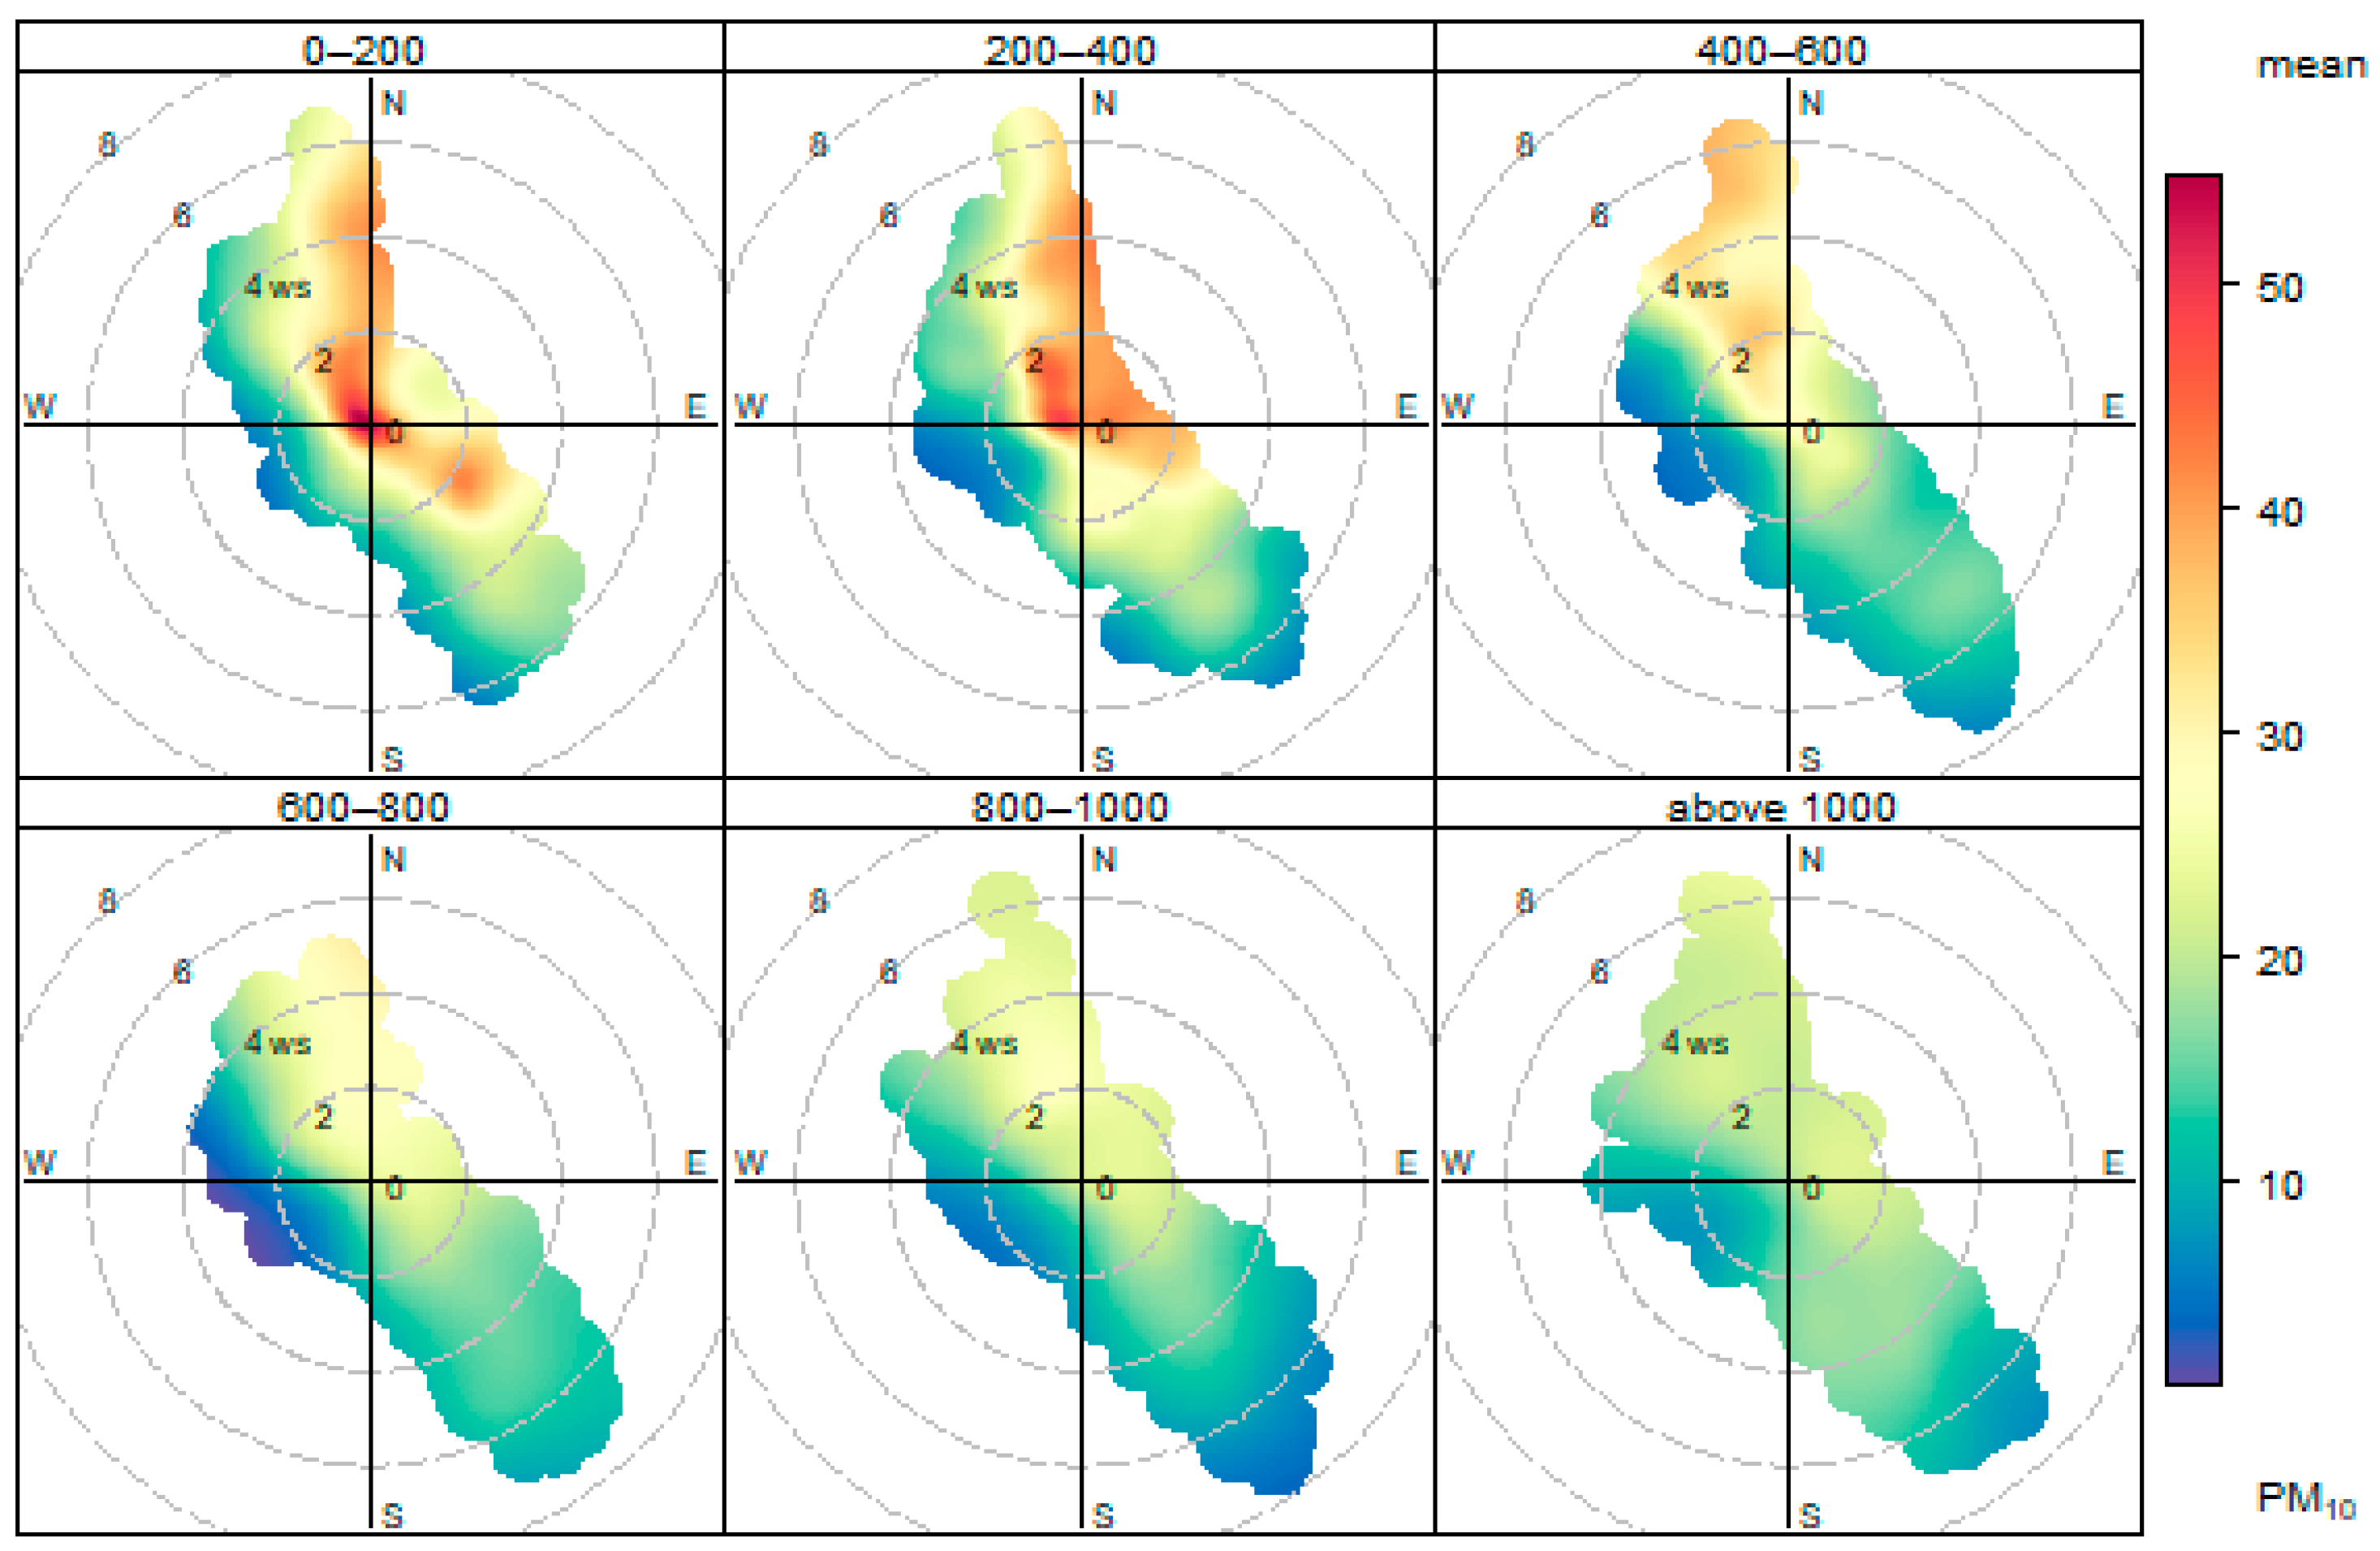
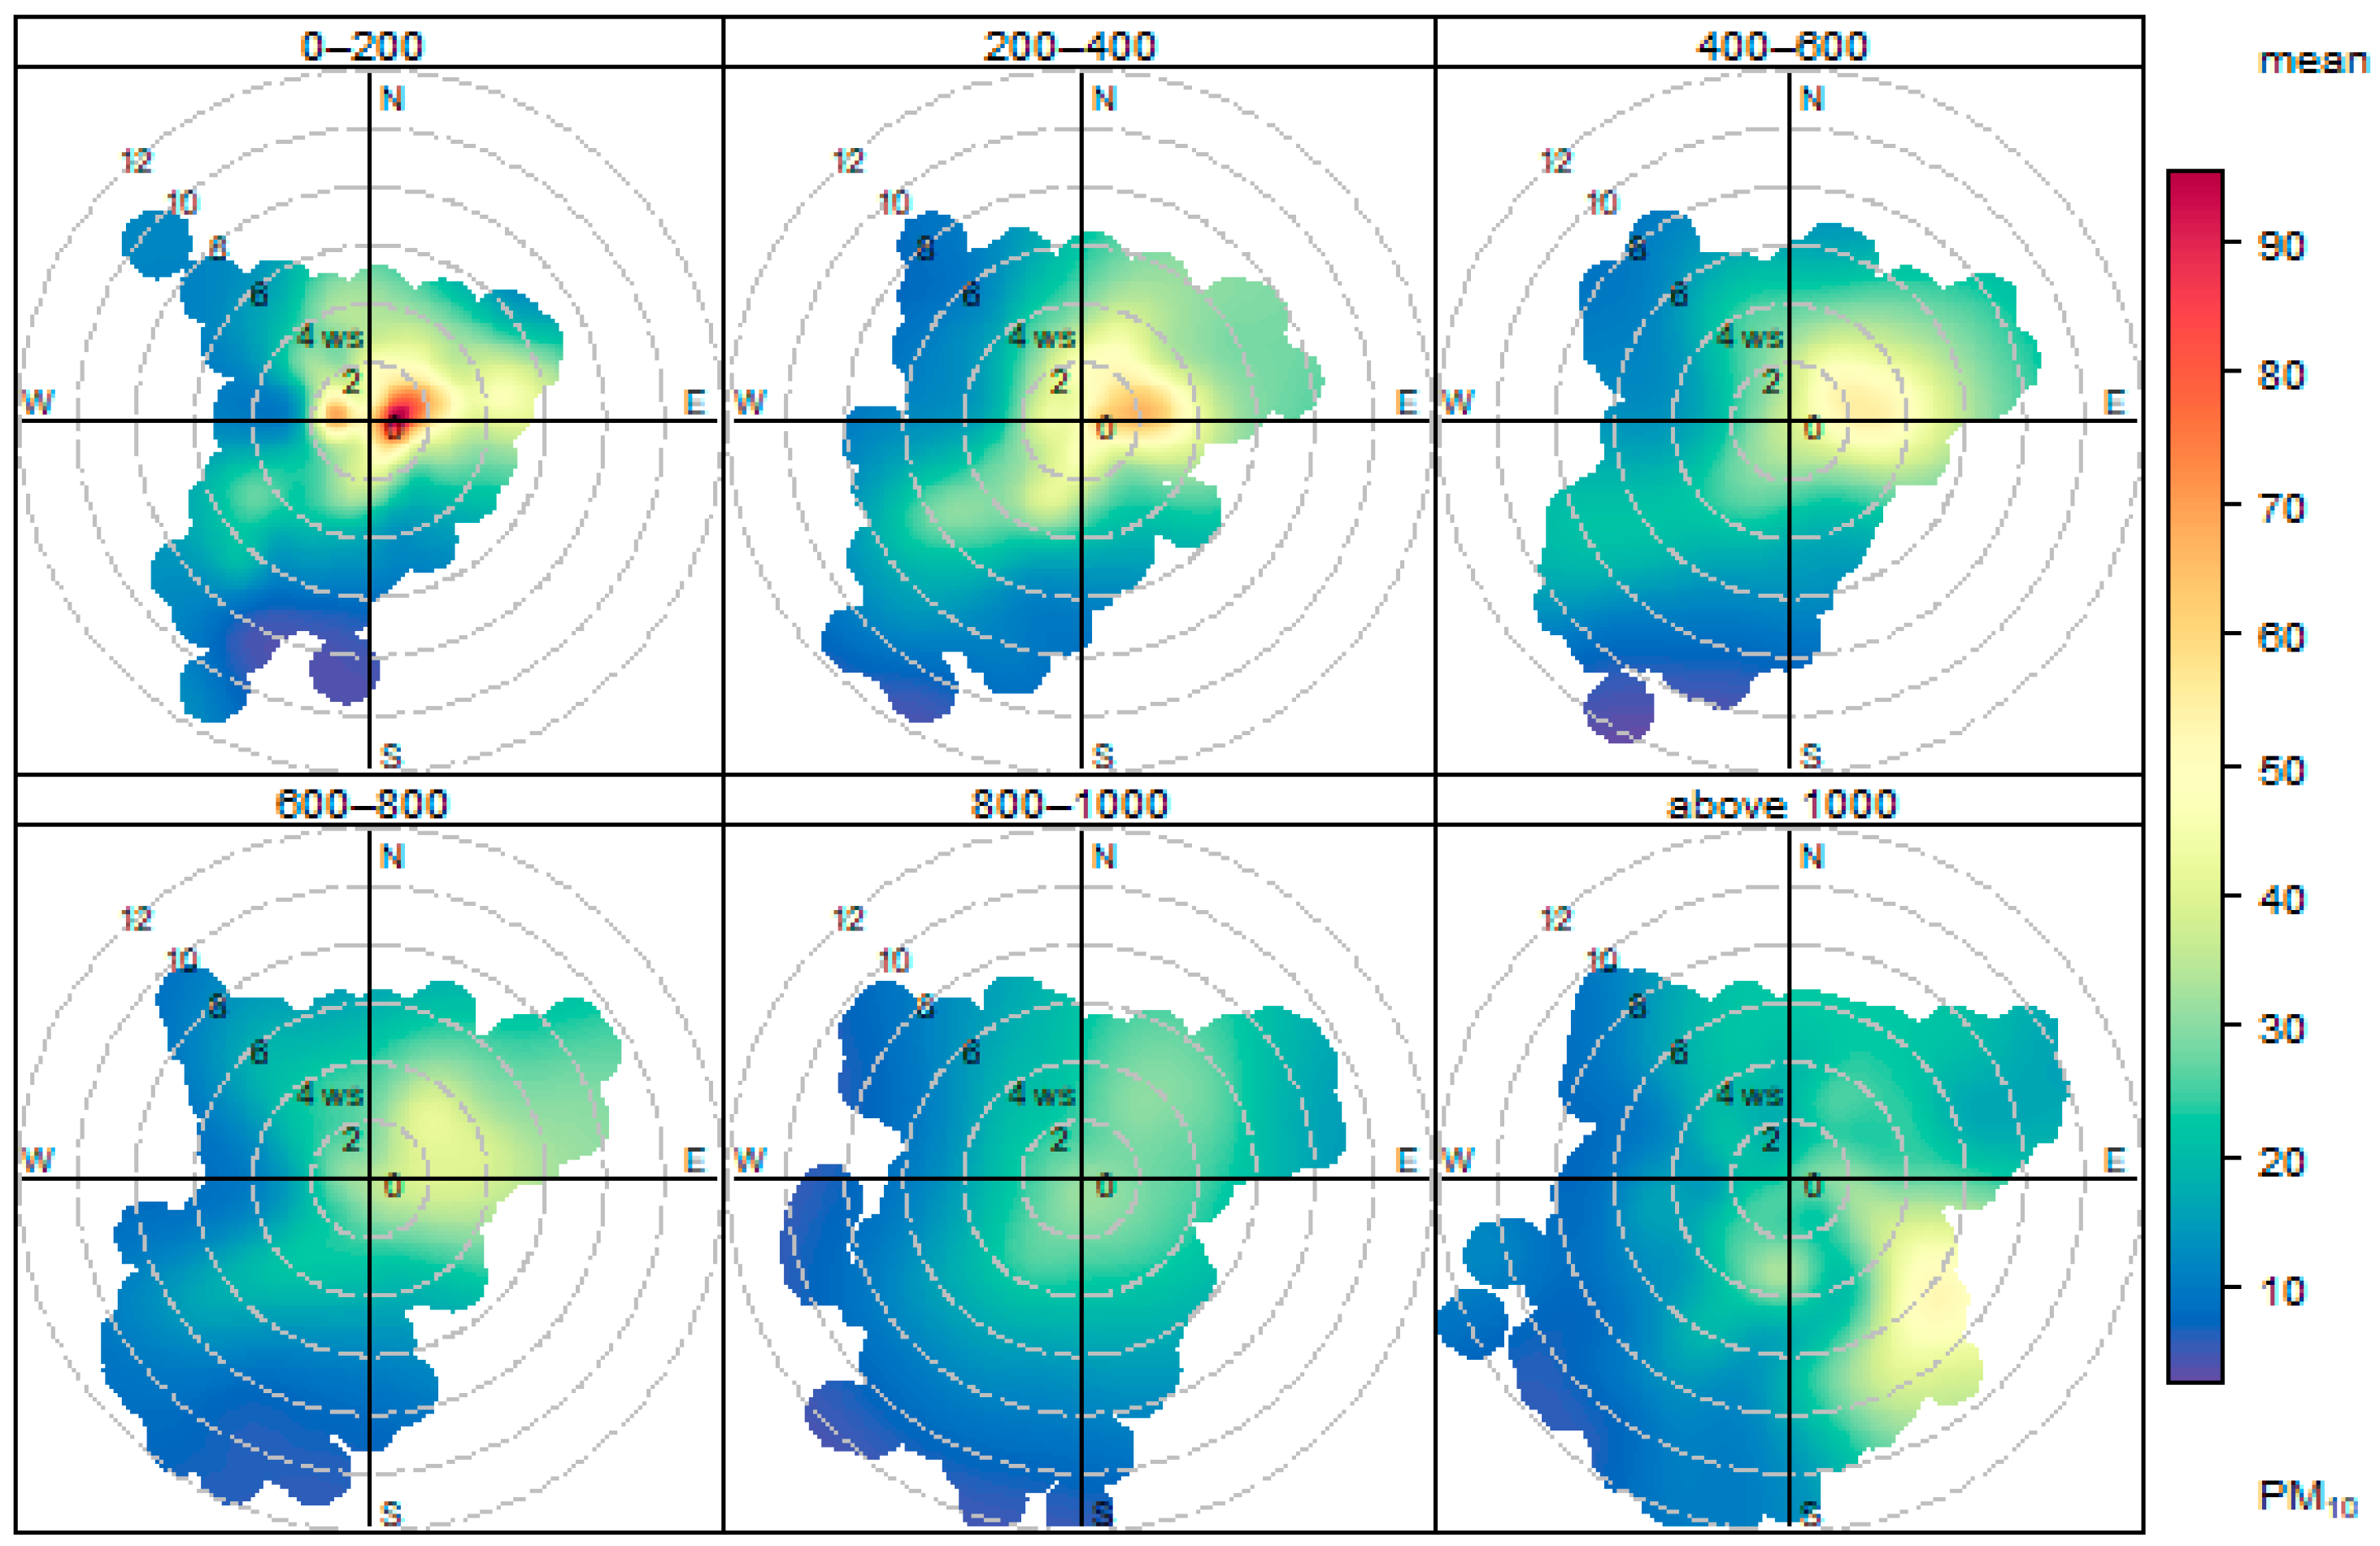
3.3. Dependence of Suspended Particulate Matter Concentrations on the Mixing Layer Height, Wind Speed, and Direction
4. Discussion
5. Conclusions
Author Contributions
Funding
Acknowledgments
Conflicts of Interest
References
- WHO. Health Effects of Particulate Matter, 2nd ed.; Policy Implications for Countries in Eastern Europe, Caucasus and Central Asia; WHO Regional Office for Europe: Copenhagen, Denmark, 2013; ISBN 978-92-890-0001-7. [Google Scholar]
- WHO. Ambient (Outdoor) Air Pollution. Available online: https://www.who.int/en/news-room/fact-sheets/detail/ambient-(outdoor)-air-quality-and-health (accessed on 2 February 2020).
- Kampa, M.; Castanas, E. Human health effects of air pollution. Environ. Pollut. 2008, 151, 362–367. [Google Scholar] [CrossRef] [PubMed]
- Schwartz, J. Air Pollution and Blood Markers of Cardiovascular Risk. Environ. Health Perspect. 2001, 109, 405–409. [Google Scholar] [PubMed]
- Pope, C.A.; Dockery, D.W. Health Effects of Fine Particulate Air Pollution: Lines that Connect. J. Air Waste Manag. Assoc. 2006, 56, 709–742. [Google Scholar] [CrossRef]
- EEA. Air quality in Europe—2019 Report, 1st ed.; Publications Office of the European Union: Copenhagen, Denmark, 2019; ISBN 978-92-9480-088-6. [Google Scholar]
- IQ Air. World Most Polluted Cities 2019 (PM2.5). Available online: https://www.iqair.com/world-most-polluted-cities (accessed on 30 March 2020).
- Prášek, J. Změny Geografického Prostředí v Pohraničních Oblastech Ostravského a Hornoslezského Regionu (Changes in the Geographical Environment in the Border Regions of the Ostrava and Upper Silesian Regions); Ostravská Univerzita: Ostrava, Czech, 1998; Volume 1. (In Czech) [Google Scholar]
- Prokop, R. Historická hranice Moravy a Slezska ve vývoji ostravské aglomerace (Historical boundary of Moravia and Silesia in the development of the Ostrava agglomeration). Geogr. Rozhl. 1996, 6, 4–5. (In Czech) [Google Scholar]
- Šindler, P. Vývojové tendence sídelní struktury česko-polského pohraničí na příkladu severní Moravy a českého Slezska (Trends in the settlement structure of the Czech-Polish borderland on the example of North Moravia and Czech Silesia). Geogr. Rozhl. 1996, 6, 11–13. (In Czech) [Google Scholar]
- EC. Directive 2004/107/EC of the European Parliament and of the Council of 15 December 2004 Relating to Arsenic, Cadmium, Mercury, Nickel and Polycyclic Aromatic Hydrocarbons in Ambient Air; EC: Brussel, Belgium, 2005. [Google Scholar]
- EC. Directive 2008/50/EC of the European Parliament and of the Council of 21 May 2008 on Ambient Air Quality and Cleaner Air for Europe; EC: Brussel, Belgium, 2008. [Google Scholar]
- Zákon č. 201/2012 Sb. ze dne 2. Května 2012 o Ochraně Ovzduší (Act No. 201/2012 Coll. of 2 May 2012 on Air Protection); Tiskárna Ministerstva vnitra: Praha, Czech, 2012; pp. 2785–2848. (In Czech) [Google Scholar]
- Hůnová, I. Ambient Air Quality in the Czech Republic: Past and Present. Atmosphere 2020, 11, 214. [Google Scholar] [CrossRef]
- Znečištění Ovzdší na Území České Republiky v Roce 2018 (Air Pollution in the Territory of the Czech Republic in 2018), 1st ed.; Czech Hydrometeorological Institute: Prague, Czech, 2019; ISBN 978-80-87577-95-0. (In Czech)
- Bednář, J. Meteorologie (Meteorology), 1st ed.; Úvod do Studia Dějů v Zemské Atmosféře (Introduction to the Study of Events in the Earth’s Atmosphere); Portál: Praha, Czech, 2003; ISBN 80-7178-653-5. (In Czech) [Google Scholar]
- Rein, F. Znečištění ovzduší a mezní vrstva atmosféry z hlediska klimatologie (Air pollution and atmospheric boundary layer in terms of climatology). Meteorol. Zprávy 1971, 24, 74–79. (In Czech) [Google Scholar]
- Novák, M. Meteorologie a Ochrana Prostředí, 1st ed.; Úvod do Meteorologie a Klimatologie (Meteorology and Environmental Protection; Introduction to Meteorology and Climatology); Univerzita Jana Evangelisty Purkyně, Fakulta Životního Prostředí: Ústí nad Labem, Czech, 2004; ISBN 80-7044-597-1. (In Czech) [Google Scholar]
- Jaňour, Z. Modelování Mezní Vrstvy Atmosféry (Atmospheric Boundary Layer Modeling), 1st ed.; [Učební Text pro Posluchače Matematicko-Fyzikální Fakulty UK] [Textbook for Students of Faculty of Mathematics and Physics of Charles University]; Karolinum: Praha, Czech, 2001; ISBN 80-246-0330-6. (In Czech) [Google Scholar]
- Keder, J.; Škáchová, H. Hodnocení Rozptylových Podmínek pro Šíření Znečišťujících Látek Pomocí Ventilačního Indexu (Evaluation of Dispersion Conditions for the Diffusion of Pollutants Using the Ventilation Index); Vodní Zdroje Ekomonitor: Chrudim, Czech, 2011; pp. 19–23. (In Czech) [Google Scholar]
- Baláková, L.; Škáchová, H.; Crhová, L. Kvalita Ovzduší a Rozptylové Podmínky na Území ČR (Air Quality and Dispersion Conditions in the Czech Republic); Czech Hydrometeorological Institute: Prague, Czech, 2018. (In Czech) [Google Scholar]
- Czernecki, B.; Półrolniczak, M.; Kolendowicz, L.; Marosz, M.; Kendzierski, S.; Pilguj, N. Influence of the atmospheric conditions on PM10 concentrations in Poznań, Poland. J. Atmos. Chem. 2017, 115–139. [Google Scholar] [CrossRef]
- Stull, R.B. An Introduction to Boundary Layer Meteorology, 1st ed.; Atmospheric and Oceanographic Sciences Library; Springer: Boston, MA, USA, 1988; ISBN 90-277-2769-4. [Google Scholar]
- Blažek, Z.; Černikovský, L.; Krajny, E.; Krejčí, B.; Ośródka, L.; Volná, V.; Wojtylak, M. Vliv Meteorologických Podmínek na Kvalitu Ovzduší v Přeshraniční Oblasti Slezska a Moravy (Influence of Meteorological Conditions on Air Quality in the Cross-Border Region of Silesia and Moravia), 1st ed.; Český Hydrometeorologický Ústav: Praha, Czech, 2013. (In Czech) [Google Scholar]
- Blažek, Z.; Černikovský, L.; Krejčí, B.; Volná, V. Air Silesia—Meteorologicko-imisní vztahy a odhad transhraničního přenosu (Air Silesia—meteorological and air pollution relations and estimation of transboundary transmission). Ochr. Ovzduší 2014, 26, 53–61. (In Czech) [Google Scholar]
- Blažek, Z.; Černikovský, L.; Krejčí, B.; Volná, V. Transboundary Air-Pollution Transport in the Czech-Polish Border Region between the Cities of Ostrava and Katowice. Cent. Eur. J. Public Health 2016, 24, 45–50. [Google Scholar]
- Barmpadimos, I.; Hueglin, C.; Keller, J.; Henne, S.; Prévôt, A.S.H. Influence of meteorology on PM10 trends and variability in Switzerland from 1991 to 2008. Atmos. Chem. Phys. 2011, 11, 1813–1835. [Google Scholar] [CrossRef]
- Reizer, M.; Juda-Rezler, K. Explaining the high PM10 concentrations observed in Polish urban areas. Air Qual. Atmos. Health 2016, 9, 517–531. [Google Scholar] [CrossRef]
- Volná, V.; Blažek, Z.; Krejčí, B. Zimní smogové situace na Ostravsku a Olomoucku v letech 2001–2016 (Winter smog situations in the Ostrava and Olomouc Regions in 2001–2016). Meteorol. Zprávy 2018, 71, 86–92. (In Czech) [Google Scholar]
- Molnár, A.; Bécsi, Z.; Imre, K.; Gácser, V.; Ferenczi, Z. Characterization of Background Aerosol Properties during a Wintertime Smog Episode. Aerosol Air Qual. Res. 2016, 16, 1793–1804. [Google Scholar] [CrossRef]
- CHMI. Pravidla Fungování Smogového Varovného a Regulačního Systému (Rules of Operation of Smog Warning and Regulation System). Available online: http://portal.chmi.cz/files/portal/docs/uoco/smog/SVRS_pravidla-fungovani.pdf (accessed on 18 February 2020). (In Czech).
- Volná, V.; Hladký, D. Koncentrace suspendovaných částic PM10 a výška směšovací vrstvy v Moravskoslezském kraji během chladných sezón 2016/2017 a 2017/2018 (Concentrations of suspended particles PM10 and mixing layer height in the Moravian-Silesian Region during the cold seasons 2016/2017 and 2017/2018). Meteorol. Zprávy 2019, 72, 77–87. (In Czech) [Google Scholar]
- Oleniacz, R.; Bogacki, M.; Szulecka, A.; Rzeszutek, M.; Mazus, M. Assessing the impact of wind speed and mixing-layer height on air quality in Krakow (Poland) in the years 2014–2015. JCEEA 2016, 33, 315–342. [Google Scholar] [CrossRef]
- Geiß, A.; Eiegner, M.; Bonn, B.; Schäfer, K.; Forkel, R.; von Schneidemesser, E.; Münkel, C.; Chan, K.L.; Nothard, R. Mixing layer height as an indicator for urban air quality? Atmos. Meas. Tech. 2017, 10, 2969–2988. [Google Scholar] [CrossRef]
- Schäfer, K.; Emeis, S.; Hoffman, H.; Jahn, C. Influence of mixing layer height upon air pollution in urban and sub-urban areas. Meteorol. Z. 2006, 15, 647–658. [Google Scholar] [CrossRef]
- Wagner, P.; Schäfer, K. Influence of mixing layer height on air pollutant concentrations in an urban street canyon. Urban Clim. 2017, 22, 64–79. [Google Scholar] [CrossRef]
- Holst, J.; Mayer, H.; Holst, T. Effect of meteorological exchange conditions on PM10 concentration. Meteorol. Z. 2008, 17, 273–282. [Google Scholar] [CrossRef]
- Tiwari, S.; Dumka, U.C.; Gautam, A.S.; Kaskaoutis, D.G.; Srivastava, A.K.; Bisht, D.S.; Chakrabarty, R.K.; Sumlin, B.J.; Solmon, F. Assessment of PM2.5 and PM10 over Guwahati in Brahmaputra River Valley. Atmos. Pollut. Res. 2017, 8, 13–28. [Google Scholar] [CrossRef]
- Zhao, H.; Che, H.; Ma, Y.; Wang, Y.; Yang, H.; Liu, Y.; Wang, Y.; Wang, H.; Zhang, X. The Relationship of PM Variation with Visibility and Mixing-Layer Height under Hazy/Foggy Conditions in the Multi-Cities of Northeast China. Int. J. Environ. Res. Public Health 2017, 14, 471. [Google Scholar] [CrossRef] [PubMed]
- Czech Hydrometeorological Institute. Available online: http://portal.chmi.cz/ (accessed on 18 February 2020).
- CHMI. Třinec-Kosmos. Available online: http://portal.chmi.cz/files/portal/docs/uoco/web_generator/locality/pollution_locality/loc_TTRO_CZ.html (accessed on 18 February 2020).
- CHMI. Věřňovice. Available online: http://portal.chmi.cz/files/portal/docs/uoco/web_generator/locality/pollution_locality/loc_TVER_CZ.html (accessed on 18 February 2020).
- MŽP. Sdělení Odboru Ochrany Ovzduší, Kterým se Stanoví Seznam Stanic Zahrnutých Do Státní Sítě Imisního Monitoring (Communication from the Air Protection Department, Which Establishes a List of Stations Included in the National Air Pollution Monitoring Network). Available online: http://portal.chmi.cz/files/portal/docs/uoco/oez/emise/evidence/aktual/Vestnik_2016_1.pdf (accessed on 22 March 2020). (In Czech).
- CHMI. Air Pollution and Atmospheric Deposition in Data, the Czech Republic, 2018. Summary Tabular Survey. Available online: http://portal.chmi.cz/files/portal/docs/uoco/isko/tab_roc/2018_enh/index_CZ.html (accessed on 20 March 2020).
- Vaisala. Available online: https://www.vaisala.com/en (accessed on 11 January 2020).
- Kotthaus, S.; O’Connor, E.; Münkel, C.; Charlton-Perez, C.; Haeffelin, M.; Gabey, A.M.; Grimmond, C.S.B. Recommendations for processing atmospheric attenuated backscatter profiles from Vaisala CL31 ceilometers. Atmos. Meas. Tech. 2016, 9, 3769–3791. [Google Scholar] [CrossRef]
- Carslaw, D.C.; Ropkins, K. Openair—An R package for air quality data analysis. Environ. Model. Softw. 2012, 27–28, 52–61. [Google Scholar] [CrossRef]
- CHMI. Znečištění Ovzduší na Území České Republiky v Roce 2015 (Air Pollution in the Czech Republic in 2015), 1st ed.; Český Hydrometeorologický Ústav: Praha, Czech, 2016; ISBN 978-80-87577-60-8. (In Czech) [Google Scholar]
- ŘSD ČR. Intenzity Dopravy na Dálnicích a Silnicích I. Třídy v ČR v Roce 2010. Available online: https://www.rsd.cz/wps/wcm/connect/b63a9557-7496-478a-8ef3-80629d92f954/pentlogram-2010.jpg?MOD=AJPERES (accessed on 28 March 2020).
- Czudek, T. Reliéf Moravy a Slezska v Kvartéru (Relief of Moravia and Silesia in Quaternary), 1st ed.; Sursum: Tišnov, Czech, 1997; ISBN 80-85799-27-8. (In Czech) [Google Scholar]
- Weissmannová, H. Ostravsko, 1st ed.; Agentura Ochrany Přírody a krajiny ČR: Praha, Czech, 2004; ISBN 80-86064-67-0. (In Czech) [Google Scholar]
- MŽP. Air Quality Improvement Program of Aglomeration Ostrava/Karviná/Frýdek-Místek—CZ08A; MŽP: Praha, Czech, 2016. [Google Scholar]
- Norris, G.; Duvall, R.; Brown, S.; Bai, S. EPA Positive Matrix Factorization (PMF) 5.0 Fundamentals and User Guide; US EPA: Washington, DC, USA, 2014.
- Stein, A.F.; Draxler, R.R.; Rolph, G.D.; Stunder, B.J.B.; Cohen, M.D.; Ngan, F. NOAA’s HYSPLIT Atmospheric Transport and Dispersion Modeling System. Bull. Am. Meteorol. Soc. 2015, 96, 2059–2077. [Google Scholar] [CrossRef]
- Seibert, R.; Nikolova, I.; Volná, V.; Krejčí, B.; Hladký, D. Air Pollution Sources Contribution to PM2.5 Concentration in Northeastern Part of the Czech Republic. Atmosphere 2020. under review. [Google Scholar]
- Komínková, K.; Holoubek, I. Využití Dat z Ceilometru při Intepretaci Vývoje Koncentrací Látek v Ovzduší Během Dne (Use of the Ceilometer Data to Explainig Changes in Pollutants Concetration Gradient in the Air during the Day); Masarykova Univerzita: Brno, Czech, 2017; pp. 198–202. (In Czech) [Google Scholar]


| Year | Třinec-Kosmos | Věřňovice | ||||||
|---|---|---|---|---|---|---|---|---|
| Hour | Day | Hour | Day | |||||
| Arithmetic Mean | Median | Arithmetic Mean | Median | Arithmetic Mean | Median | Arithmetic Mean | Median | |
| 2016 | −0.85 | −0.83 | −0.81 | −0.78 | −0.76 | −0.84 | −0.70 | −0.66 |
| 2017 | −0.81 | −0.83 | −0.84 | −0.81 | −0.80 | −0.90 | −0.72 | −0.69 |
| 2018 | −0.81 | −0.85 | −0.79 | −0.81 | −0.82 | −0.87 | −0.81 | −0.79 |
| 2019 | −0.84 | −0.84 | −0.72 | −0.69 | −0.64 | −0.78 | −0.73 | −0.85 |
| Year | Třinec-Kosmos | Věřňovice | ||
|---|---|---|---|---|
| Arithmetic Mean (m) | Median (m) | Arithmetic Mean (m) | Median (m) | |
| 2016 | 604 | 369 | 555 | 327 |
| 2017 | 659 | 425 | 628 | 372 |
| 2018 | 675 | 450 | 670 | 408 |
| 2019 | 705 | 501 | 821 | 553 |
| Year | Třinec-Kosmos | Věřňovice | ||||||
|---|---|---|---|---|---|---|---|---|
| Hour | Day | Hour | Day | |||||
| Arithmetic Mean | Median | Arithmetic Mean | Median | Arithmetic Mean | Median | Arithmetic Mean | Median | |
| 2016 | 0.95 | 0.88 | 0.89 | 0.81 | 0.94 | 0.87 | 0.89 | 0.90 |
| 2017 | 0.92 | 0.84 | 0.92 | 0.94 | 0.96 | 0.91 | 0.88 | 0.89 |
| 2018 | 0.90 | 0.82 | 0.88 | 0.90 | 0.93 | 0.84 | 0.93 | 0.89 |
| 2019 | 0.96 | 0.92 | 0.85 | 0.82 | 0.91 | 0.79 | 0.86 | 0.75 |
| Year | Třinec-Kosmos | Věřňovice | ||||||
|---|---|---|---|---|---|---|---|---|
| Hour | Day | Hour | Day | |||||
| Arithmetic Mean | Median | Arithmetic Mean | Median | Arithmetic Mean | Median | Arithmetic Mean | Median | |
| 2016 | 0.53 | 0.45 | 0.28 | 0.32 | 0.69 | 0.69 | 0.07 | 0.32 |
| 2017 | 0.56 | 0.41 | 0.46 | 0.55 | 0.79 | 0.79 | 0.53 | 0.49 |
| 2018 | 0.60 | 0.53 | 0.1 | 0.27 | 0.75 | 0.76 | 0.52 | 0.35 |
| 2019 | 0.51 | 0.34 | 0.01 | 0.2 | 0.63 | 0.71 | 0.43 | 0.37 |
© 2020 by the authors. Licensee MDPI, Basel, Switzerland. This article is an open access article distributed under the terms and conditions of the Creative Commons Attribution (CC BY) license (http://creativecommons.org/licenses/by/4.0/).
Share and Cite
Volná, V.; Hladký, D. Detailed Assessment of the Effects of Meteorological Conditions on PM10 Concentrations in the Northeastern Part of the Czech Republic. Atmosphere 2020, 11, 497. https://doi.org/10.3390/atmos11050497
Volná V, Hladký D. Detailed Assessment of the Effects of Meteorological Conditions on PM10 Concentrations in the Northeastern Part of the Czech Republic. Atmosphere. 2020; 11(5):497. https://doi.org/10.3390/atmos11050497
Chicago/Turabian StyleVolná, Vladimíra, and Daniel Hladký. 2020. "Detailed Assessment of the Effects of Meteorological Conditions on PM10 Concentrations in the Northeastern Part of the Czech Republic" Atmosphere 11, no. 5: 497. https://doi.org/10.3390/atmos11050497
APA StyleVolná, V., & Hladký, D. (2020). Detailed Assessment of the Effects of Meteorological Conditions on PM10 Concentrations in the Northeastern Part of the Czech Republic. Atmosphere, 11(5), 497. https://doi.org/10.3390/atmos11050497