Article

The Observation Path Problems and the Formation Conditions of the Elevated Layer of Black Carbon Aerosol

1
Key Laboratory of Meteorological Disaster, Ministry of Education (KLME)/Joint International Research Laboratory of Climate and Environment Change (ILCEC)/Collaborative Innovation Center on Forecast and Evaluation of Meteorological Disasters (CIC-FEMD)/CMA Key Laboratory for Aerosol-Cloud-Precipitation, Nanjing University of Information Science & Technology, Nanjing 210044, China
2
Beijing Weather Modification Office, Beijing 100089, China
3
Liaoning Weather Modification Office, Shenyang 110166, China
*
Author to whom correspondence should be addressed.
Atmosphere 2020, 11(5), 481; https://doi.org/10.3390/atmos11050481
Submission received: 17 April 2020 / Revised: 3 May 2020 / Accepted: 6 May 2020 / Published: 8 May 2020
(This article belongs to the Section Aerosols)

Abstract

:
Studies on the detection of layers with elevated black carbon aerosol (BC) concentrations and the formation conditions of these layers help understand the vertical distribution of BC concentrations, which will provide a basis for the assessment of climate effects and early pollution warnings. By using the Weather Research and Forecasting with Chemistry (WRF-Chem) numerical model, we performed a numerical simulation analysis on the authenticity of strongly elevated BC concentration layers that were detected by an aircraft in the mixing layer over Harbin, China, which is a high-emission area, on a clear sunny afternoon in the early heating period of 2016. We then discuss possible problems and solutions when non-vertical paths are used to detect the vertical distribution of BC concentrations. Finally, we discuss the favorable conditions for the formation of elevated BC concentration layers by a weak vertical flow based on the simulation. The modeling results show that the horizontal variability of BC concentration in the mixing layer in the observation area in Harbin was sufficiently large during the measurement. This produced a false elevated layer, as detected by the aircraft during one round of spiral flight in the mixing layer. The root mean square of the horizontal distribution of BC concentration did not change with height in the mixing layer during the daytime, but it decreased with the thickness of the mixing layer and was higher in the mixing layer than in the free atmosphere. Therefore, the thinner the mixing layer, in which the vertical distribution of the BC concentration is detected in an inclined path, the stronger interference of the horizontal variability on the detected results. In the daytime, due to strong turbulence in the mixing layer, weak vertical uplift is not favorable for the occurrence of elevated BC concentration layers in the mixing layer. In the nighttime, if weak vertical uplift is well-matched with the BC concentration or its vertical gradient, elevated BC concentration layers can be formed in the atmosphere. Compared with upper layers far from the ground, nighttime elevated layers are easier to form in lower layers near the ground because high BC concentrations or large vertical gradients are more likely to occur in the lower layers. Both cases facilitate the occurrence of large vertical upward transport rates of BC.

1. Introduction

Black carbon aerosol particles (BCs) are strongly absorptive atmospheric aerosol particles. BCs absorb solar radiation and heat the surrounding atmosphere, thereby affecting the ground temperature. The impact of BCs on the ground temperature varies with the height of the heated atmosphere [1]. In the Arctic, for example, if the BCs are close to snow and ice, they may increase the ground temperature; if the BCs are located in the free atmosphere, they may decrease the ground temperature and increase sea ice [2,3]. The Intergovernmental Panel on Climate Change Fifth Assessment Report (IPCC-AR5) points out that the uncertainty in the estimated BC direct radiative forcing contributes to a very large proportion of the uncertainty in the estimated aerosol direct radiative forcing [4]. One of the reasons for the uncertainty in the estimated BC direct radiative forcing is that the vertical distribution of BCs is insufficiently understood [5]. In recent years, it has also been shown that BCs can cause heating in the boundary layer atmosphere (especially in the upper boundary layer atmosphere), which is accompanied by a reduction in the ground heat flux. These effects will inhibit the development of the boundary layer and increase the number of extreme haze pollution events. This process is called the BC “dome effect” [6,7,8]. Studies have shown that the vertical distribution of BCs is very important.
The vertical structure of aerosols has certainly been studied more in-depth than that of BCs. However, some observation results showed the difference between the vertical structure of aerosols and BCs, for example, Ferrero et al. [1] found that equivalent BC concentrations behaved contrarily to the number concentration of aerosol between 14 nm and 260 nm in the decoupled negative gradient (DNG) profiles typology in the Arctic. They thought that the reason was the influence of the ambient air conditions on the secondary aerosol formation. On the other hand, some studies showed different ratios of BC to PM2.5 in the air from different sources [9,10]. The air at different levels over a certain location in a given time may be explained by horizontal or vertical transport from different aerosol emissions sources. So, we have a hypothesis that one reason for the difference between vertical profiles of PM2.5 and BC could be different emission sources. Anyway, the vertical structure of BC is expected to be different from that of aerosol, so we still need to study the vertical distribution of BC.
Observational studies have shown that the BC concentration sometimes peaks at a certain height, which indicates the appearance of an elevated BC concentration layer. Elevated BC concentration layers have strong radiation and dome effects [11]. Therefore, studies on the detection and formation conditions of elevated BC concentration layers help understand the vertical distribution of the BC concentration and can provide a basis for the assessment of the climate impact of BCs and early pollution warnings in pollutant emission regions.
Studies on elevated BC concentration layers often rely on in-situ observation. The observation platforms mainly include iron towers, tethered balloons, unmanned and manned aircraft. In recent years, researchers have conducted detection studies in multiple locations around the world using tethered balloons [1,12,13,14,15,16], unmanned aircraft [17], and manned aircraft [5,18,19,20,21,22,23,24,25]. Some of the detections have had global or continental coverage, for example, in the Arctic, Europe, North America, the tropical North Atlantic [5], the Pacific Ocean from 80 N to 67 S [20,26], the Arctic [18], and western and northern Europe [21]; some of the detections have focused on regional areas of a country, such as two cities in southern India [22], four cities in New Zealand [12], the largest city in the Yarlung Zangbo Valley [23], valleys in Italy [13], Beijing in China [24,27,28], Shanghai in China [14], Delhi in India [15], Wisłok Valley in Poland [17], the North China Plain [16], and Ny-Ålesund (Svalbard) in the Arctic [1].
Through the observation studies mentioned above, we have gained a large amount of knowledge about elevated BC concentration layers. Schwarz et al. [5] collected airborne Soot-Particle Photodiameter (SP2) observation data in the Arctic, Europe, North America, and the tropical North Atlantic from 2011 to 2013. Approximately 500 vertical profiles of the concentration of accumulation mode refractory black carbon (referred to as rBC) aerosol particles obtained by the SP2 in the entire troposphere were analyzed. The averaged BC concentration profiles in the different regions include the constant-decrease-constant type and two other types of elevated BC concentration layers in the atmosphere, namely, the inverted C type and the constant-decrease-increase type. Bisht et al. [15] used an Aethalometer (model AE33) attached to a tethered balloon to observe the nighttime vertical distribution of BC during a dense foggy period in 2016. The five-day observation results showed that the BC concentration profiles in the boundary layer have a multilayer structure. Rahul et al. [23] measured the vertical distribution of BC three times over three days using aircraft observations in the largest city in the Brahmaputra River Valley region from the end of August to early September 2009. The altitude range of the detection was from the ground to 5.5–6.5 km. The results show that there were elevated layers in each profile, which are in the 1.5–3.0 km, 2.5–6.5 km, and 0–1.5 km layers. During a strong foggy period in autumn and winter, Chilinski et al. [17] observed BC concentrations along a 100-m uphill trail on a slope of the Wisłok Mountain valley in Poland using a manually carried micro-aethalometer AE-51. Their results show that the BC concentration generally decreased significantly with altitude. However, multilayer structures were also observed during nighttime inversion conditions. They also used unmanned aerial vehicles to measure up to the top of the boundary layer, sometimes reaching the free atmosphere. As a result, many multilayer structures of BC concentrations were observed. Ferrero et al. [1] analyzed the observation results of 200 vertical profiles of BC concentrations in Ny-Ålesund (Svalbard) in the Arctic in the spring and summer of 2011–2012, as detected by an AE51 carried by a tethered balloon. They classified the BC vertical profiles, and two of the classes included elevated BC concentration layers.
It can be seen that the elevated BC concentration layers do not occur by accident. The cause of elevated BC concentration layers has been analyzed from the perspective of horizontal transport and vertical upward transport. For instance, Spackman et al. [18] found that elevated BC concentration layers appear in the free atmosphere in the Arctic in the spring. They believe that the elevated layers were caused by long-distance transport of biomass combustion and anthropogenic emissions; Chilinski et al. [17] observed many multi-layered structures of BC concentrations during heavy smog periods in autumn and winter. Their results showed that the high values in the lower layer were related to BC emissions in neighboring areas. The high BC concentration values above 1000 m and away from BC emission sources suggest that the high concentration is related to mid/long-distance transport. Ding et al. [29] and Zhang et al. [30] proposed that eastern China is a region controlled by large-scale monsoon circulation. Frequent cyclones, fronts, and convections facilitate the vertical upward transport of ground pollutants to the middle and even upper parts of the troposphere, which likely forms elevated BC concentration layers in the atmosphere. However, it is still unclear what conditions are more favorable for the formation of elevated BC concentration layers by vertical upward transport.
A large amount of BCs is emitted during the winter heating period in northern China. In this study, we use the results of aircraft BC observation during the heating period in Harbin, a northern city of China. Based on the Weather Research and Forecasting with Chemistry (WRF-Chem) numerical model, we analyze the impact of the observation path on the observation results of elevated BC concentration layers through numerical simulation. Given that vertical upward transport is weak in winter, we compare between daytime and nighttime, between lower and upper layers, determine which case is more favorable for the formation of elevated BC concentration layers under weak vertical upward transport conditions.

2. Cases and Research Scheme

2.1. Cases

The Beijing Weather Modification Office conducted an observation experiment in Harbin, Heilongjiang Province under the support of the National Key Research and Development Program of China titled the “Impact of Black Carbon Emission of Agricultural and Living Sources on Climate and Air Quality in East Asia and the associated Climate-Health Effect Assessment.” The observations were conducted in the afternoon of 20 October 2016 and 25 October 2016 during the heating period. The sea level pressure (Figure 1) at 11:00 (Beijing time) on these two days shows that Harbin (indicated with black stars in Figure 1) is located on the edge of a high-pressure and a low-pressure system, respectively, and the weather conditions were fine and partly cloudy. The surface wind speed was not high during the two observations.
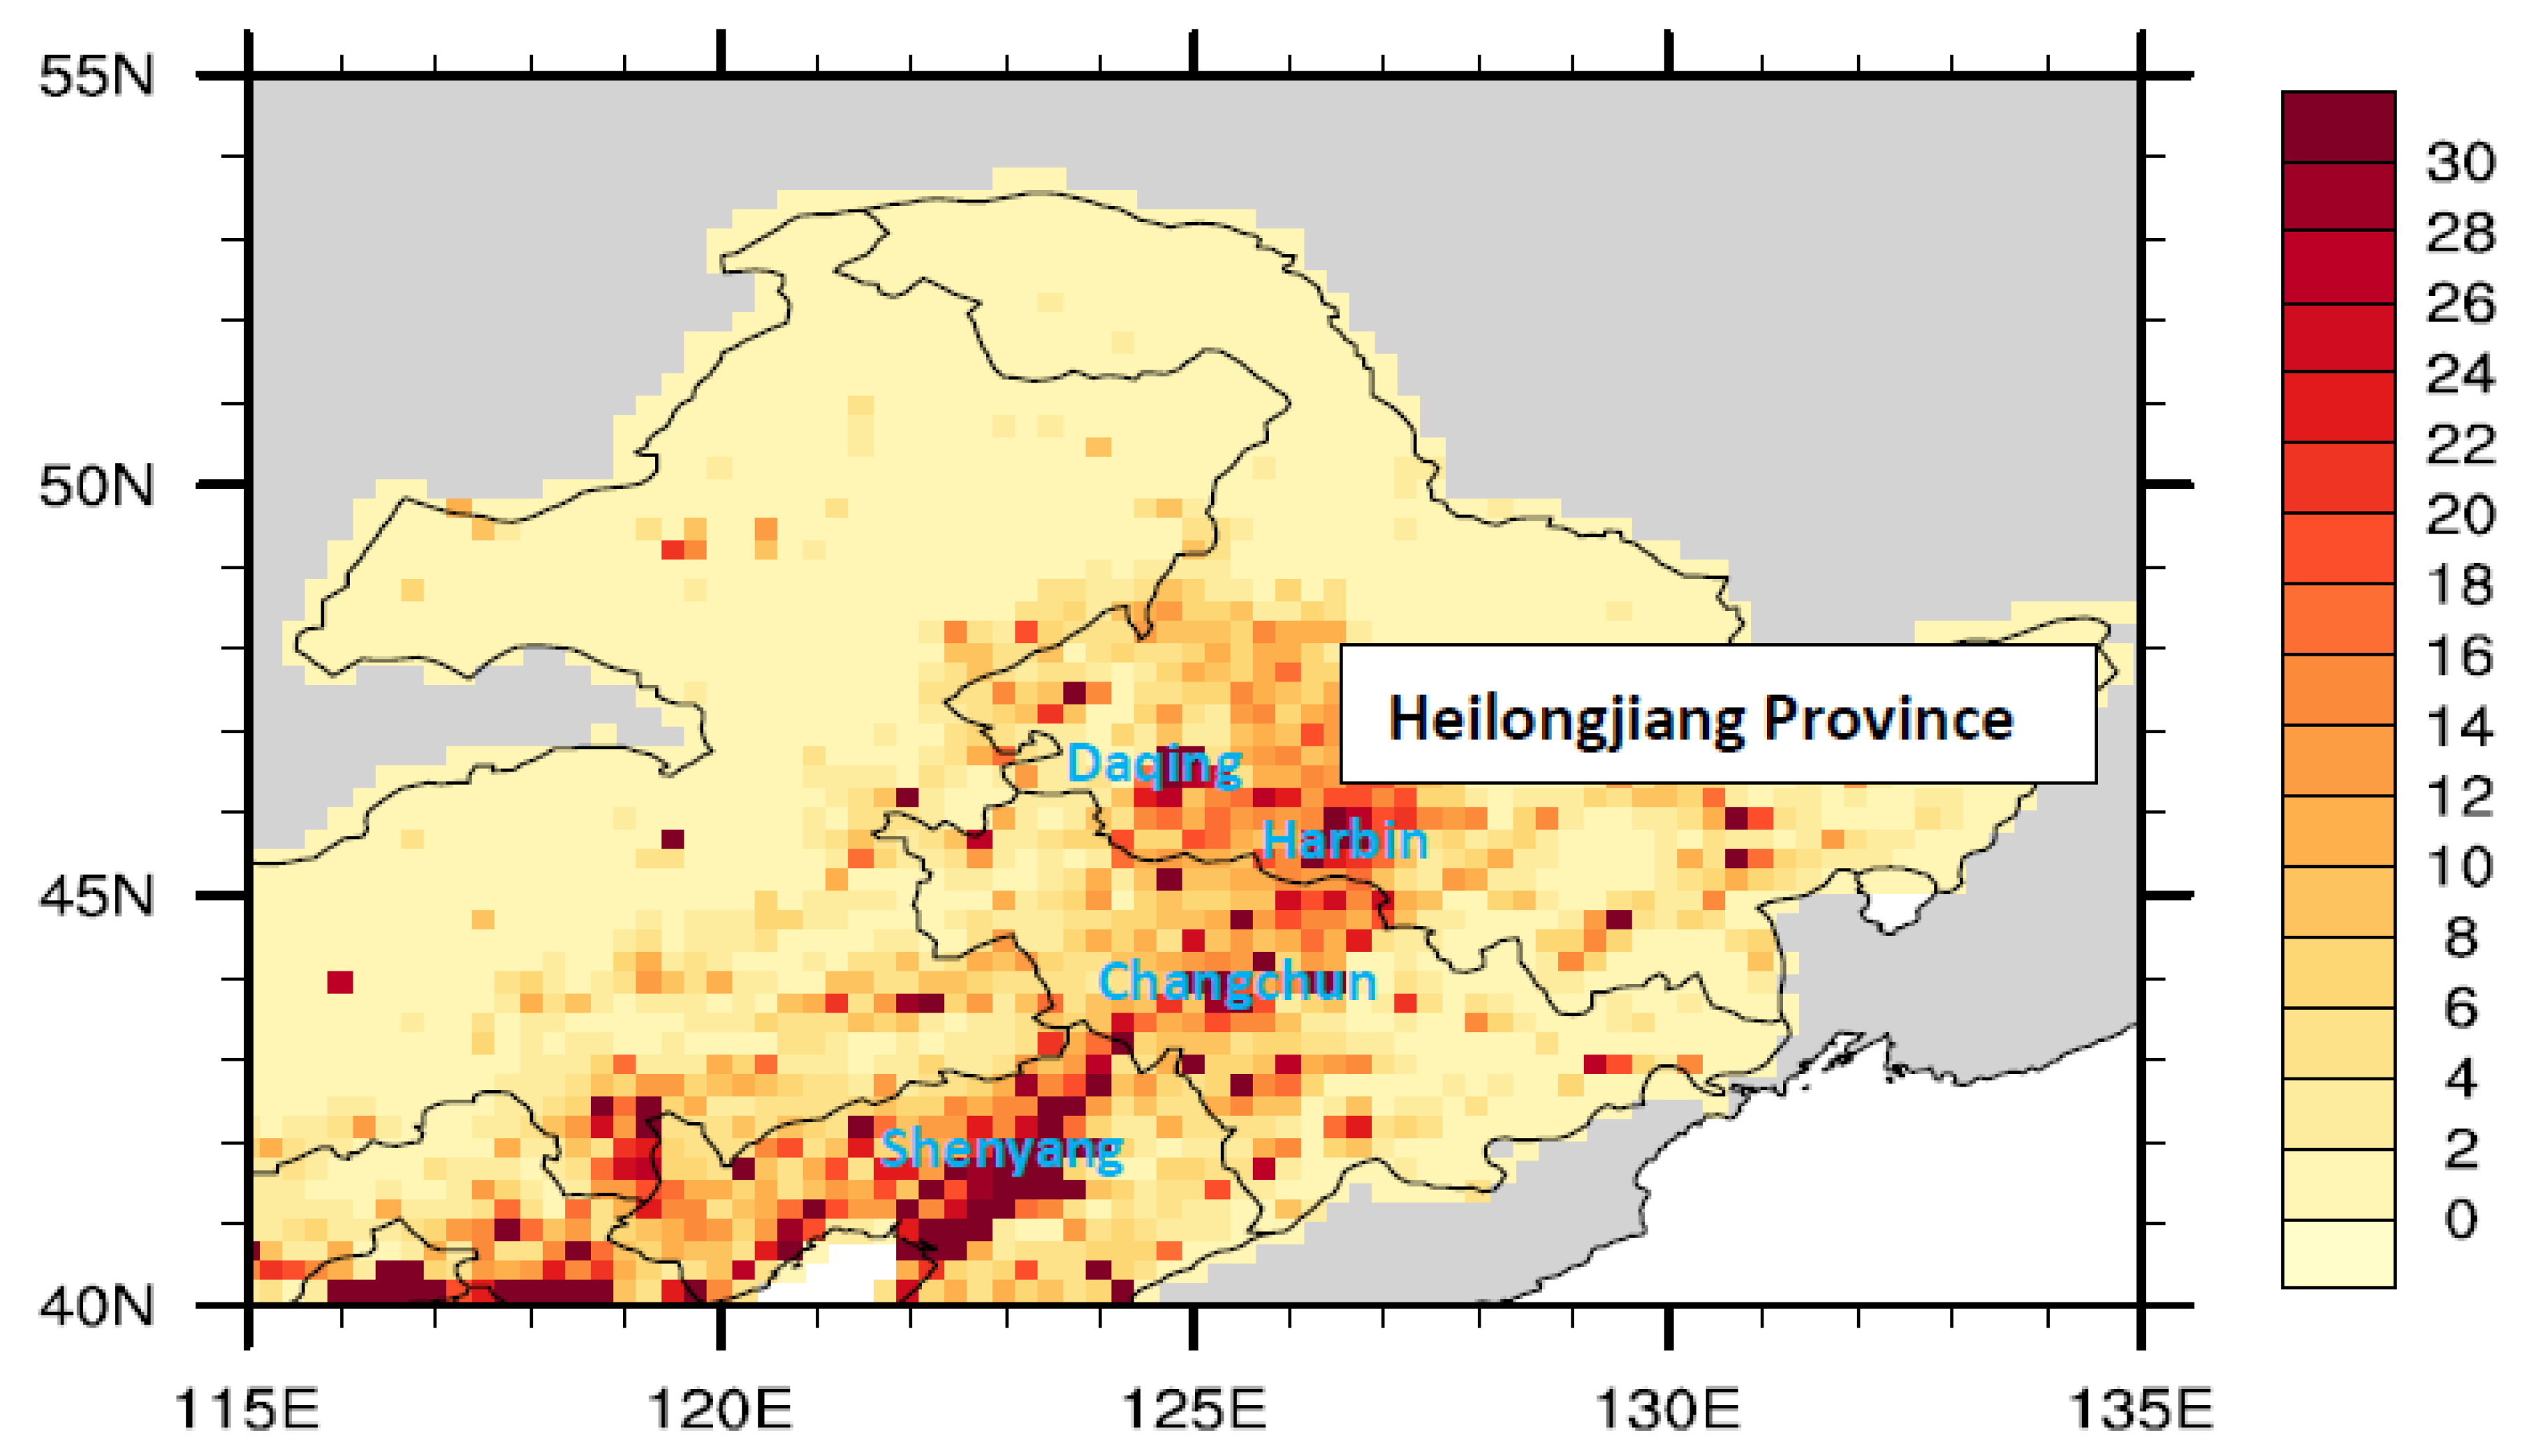
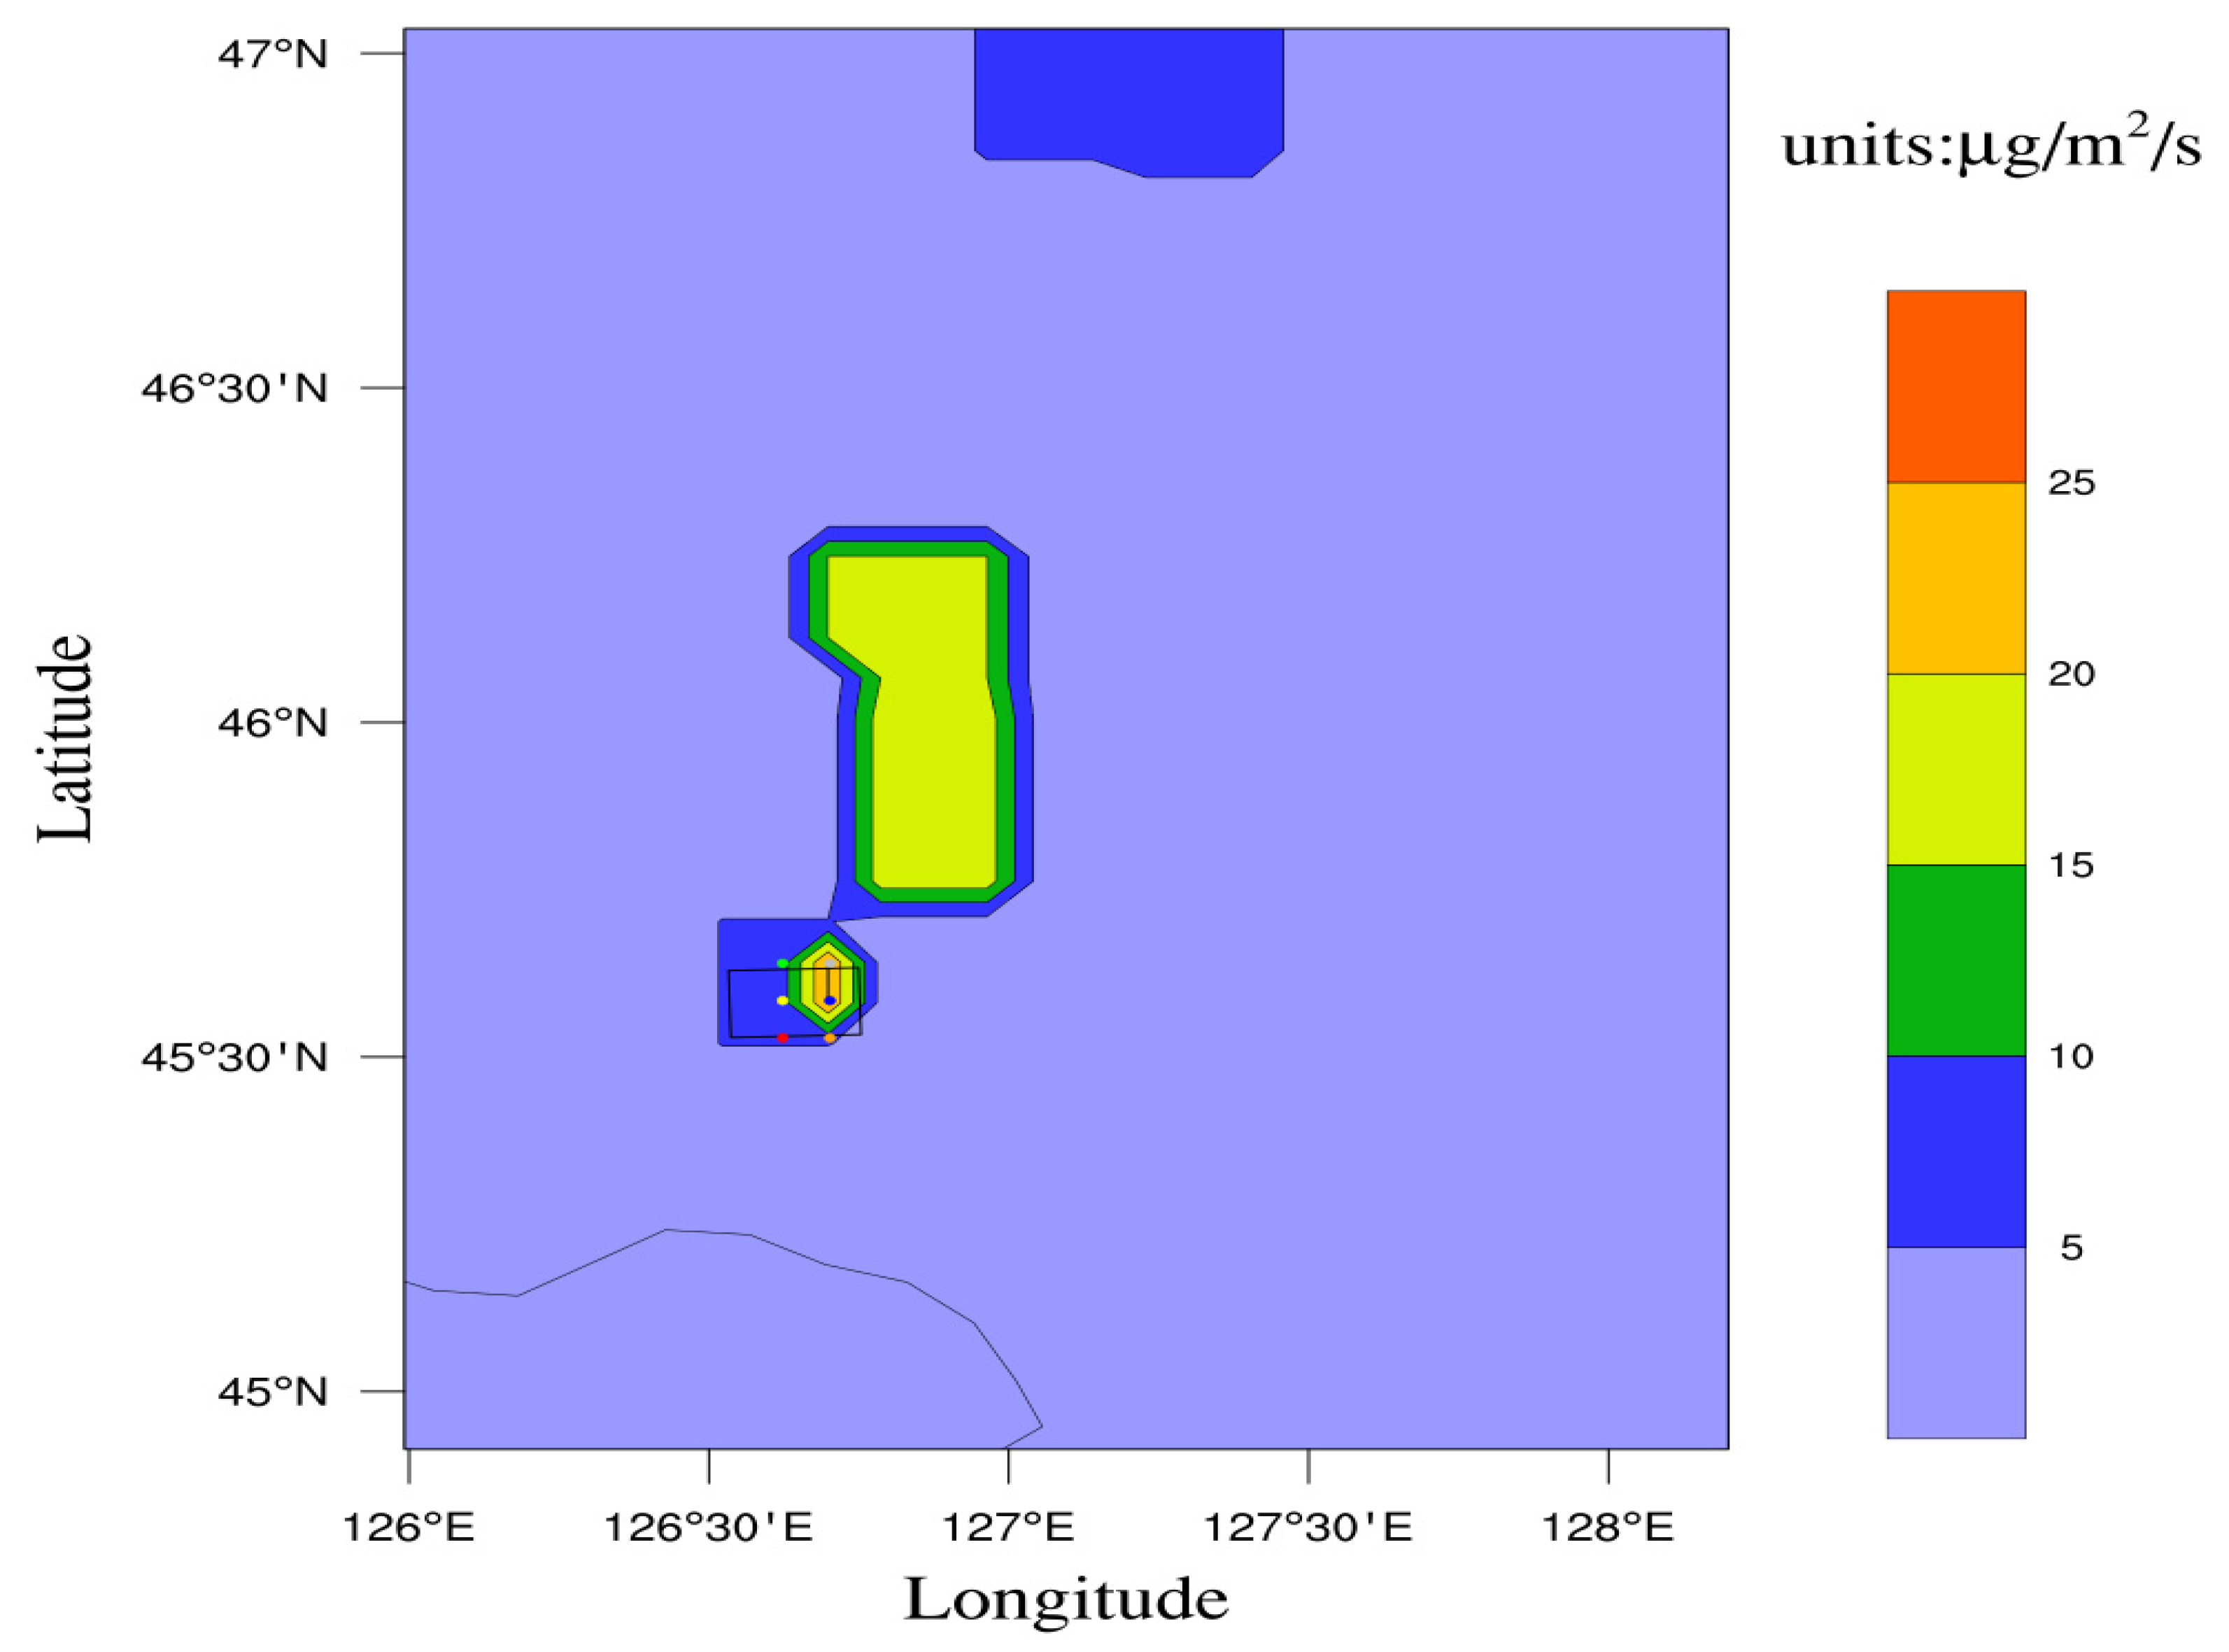
Figure 2 shows the distribution of BC emissions in October 2012 based on the output data of the latest Multi-resolution Emission Inventory for China (MEIC) (http://www.meicmodel.org/index.html), He (2012) [31] reported the model framework and 1990–2010 anthropogenic emissions on MEIC. As seen, Harbin and the surrounding areas emit much BC. In the map, Harbin, Daqing, Changchun, and Shenyang are marked. Figure 2 shows that Harbin and Daqing are the major emission regions of BCs in Heilongjiang Province.

2.2. Observation Scheme

The King Air aircraft was selected for this observation. The King Air has a long-range fuel tank on its wing and a flight distance of 4000 km. In this observation, the speed of the aircraft was approximately 250–300 km/h, and an SP2 manufactured by Droplet Measurement Technologies, Inc. was used to observe BCs. The operation and data interpretation procedures for the aircraft SP2 have been described by researchers [21,32]. The SP2 is the only precise instrument in the world that can directly measure the mass of black carbon in a single particle. The detection diameter ranges from 45 to 470 nm. The mass of BCs outside the detection range is estimated by fitting the measured data using a lognormal distribution. The mass concentration of BCs is obtained by dividing the total mass of BCs by the volume of the air samples. The sample flow rate was controlled at 120 cm3/min, and the temporal resolution for data collection was 1 s. The BC mass concentration value was processed under standard temperature (288.15 K) and pressure (1013.25 hPa), in units of ng.m−3. The SP2 was calibrated before each flight. The SP2 research team provided a method for calibrating incandescent signals with colloidal graphite samples. Monodisperse polystyrene latex (PSL) spheres of different sizes were used to calibrate the scattering channels.
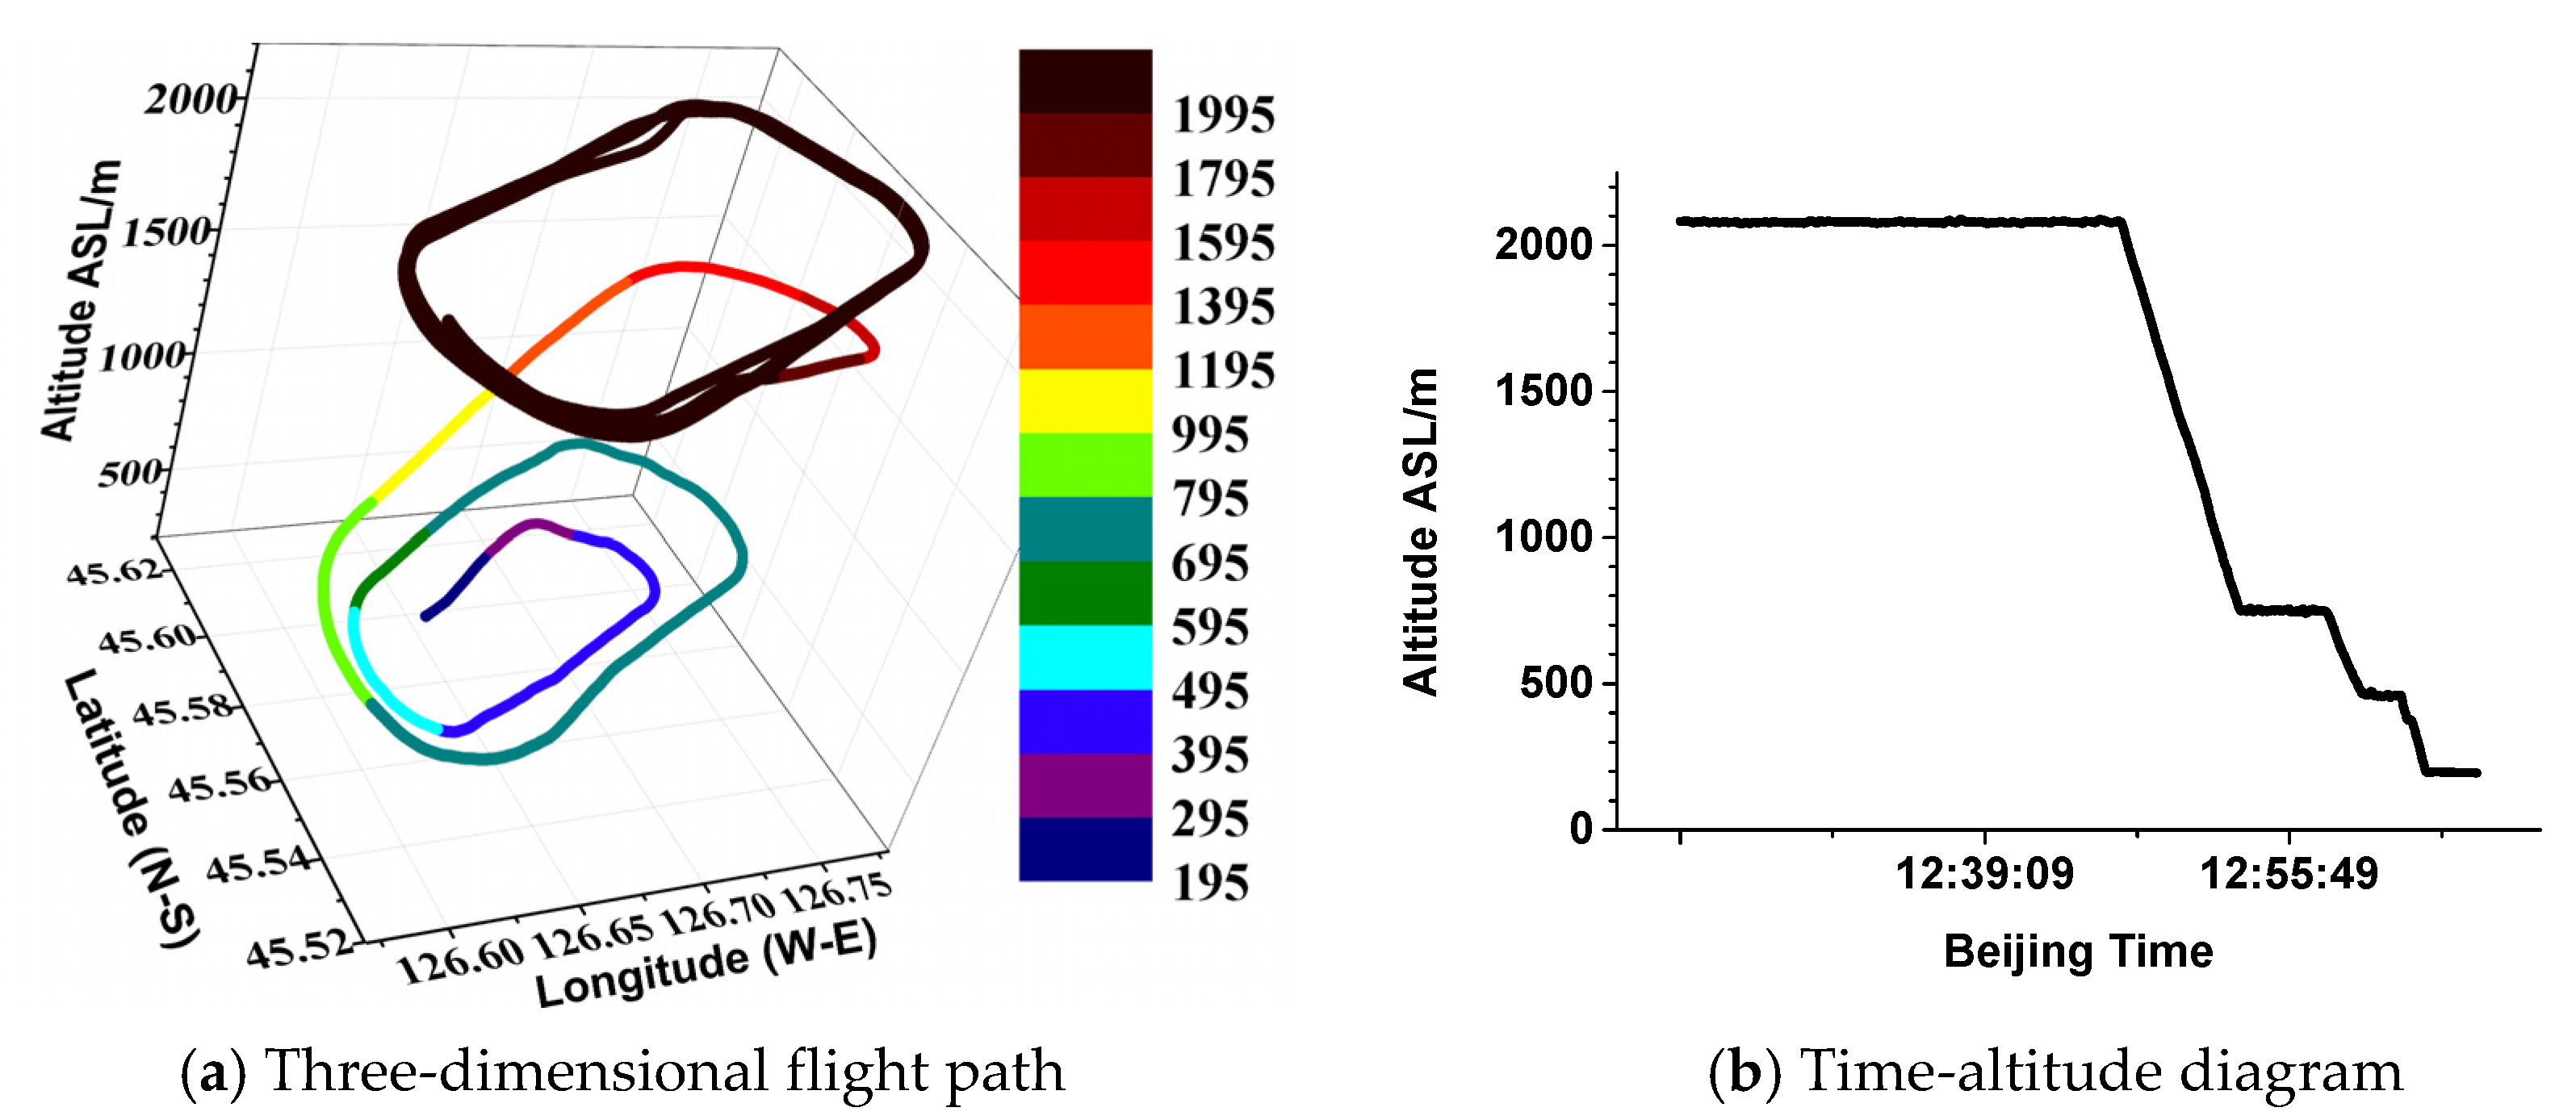
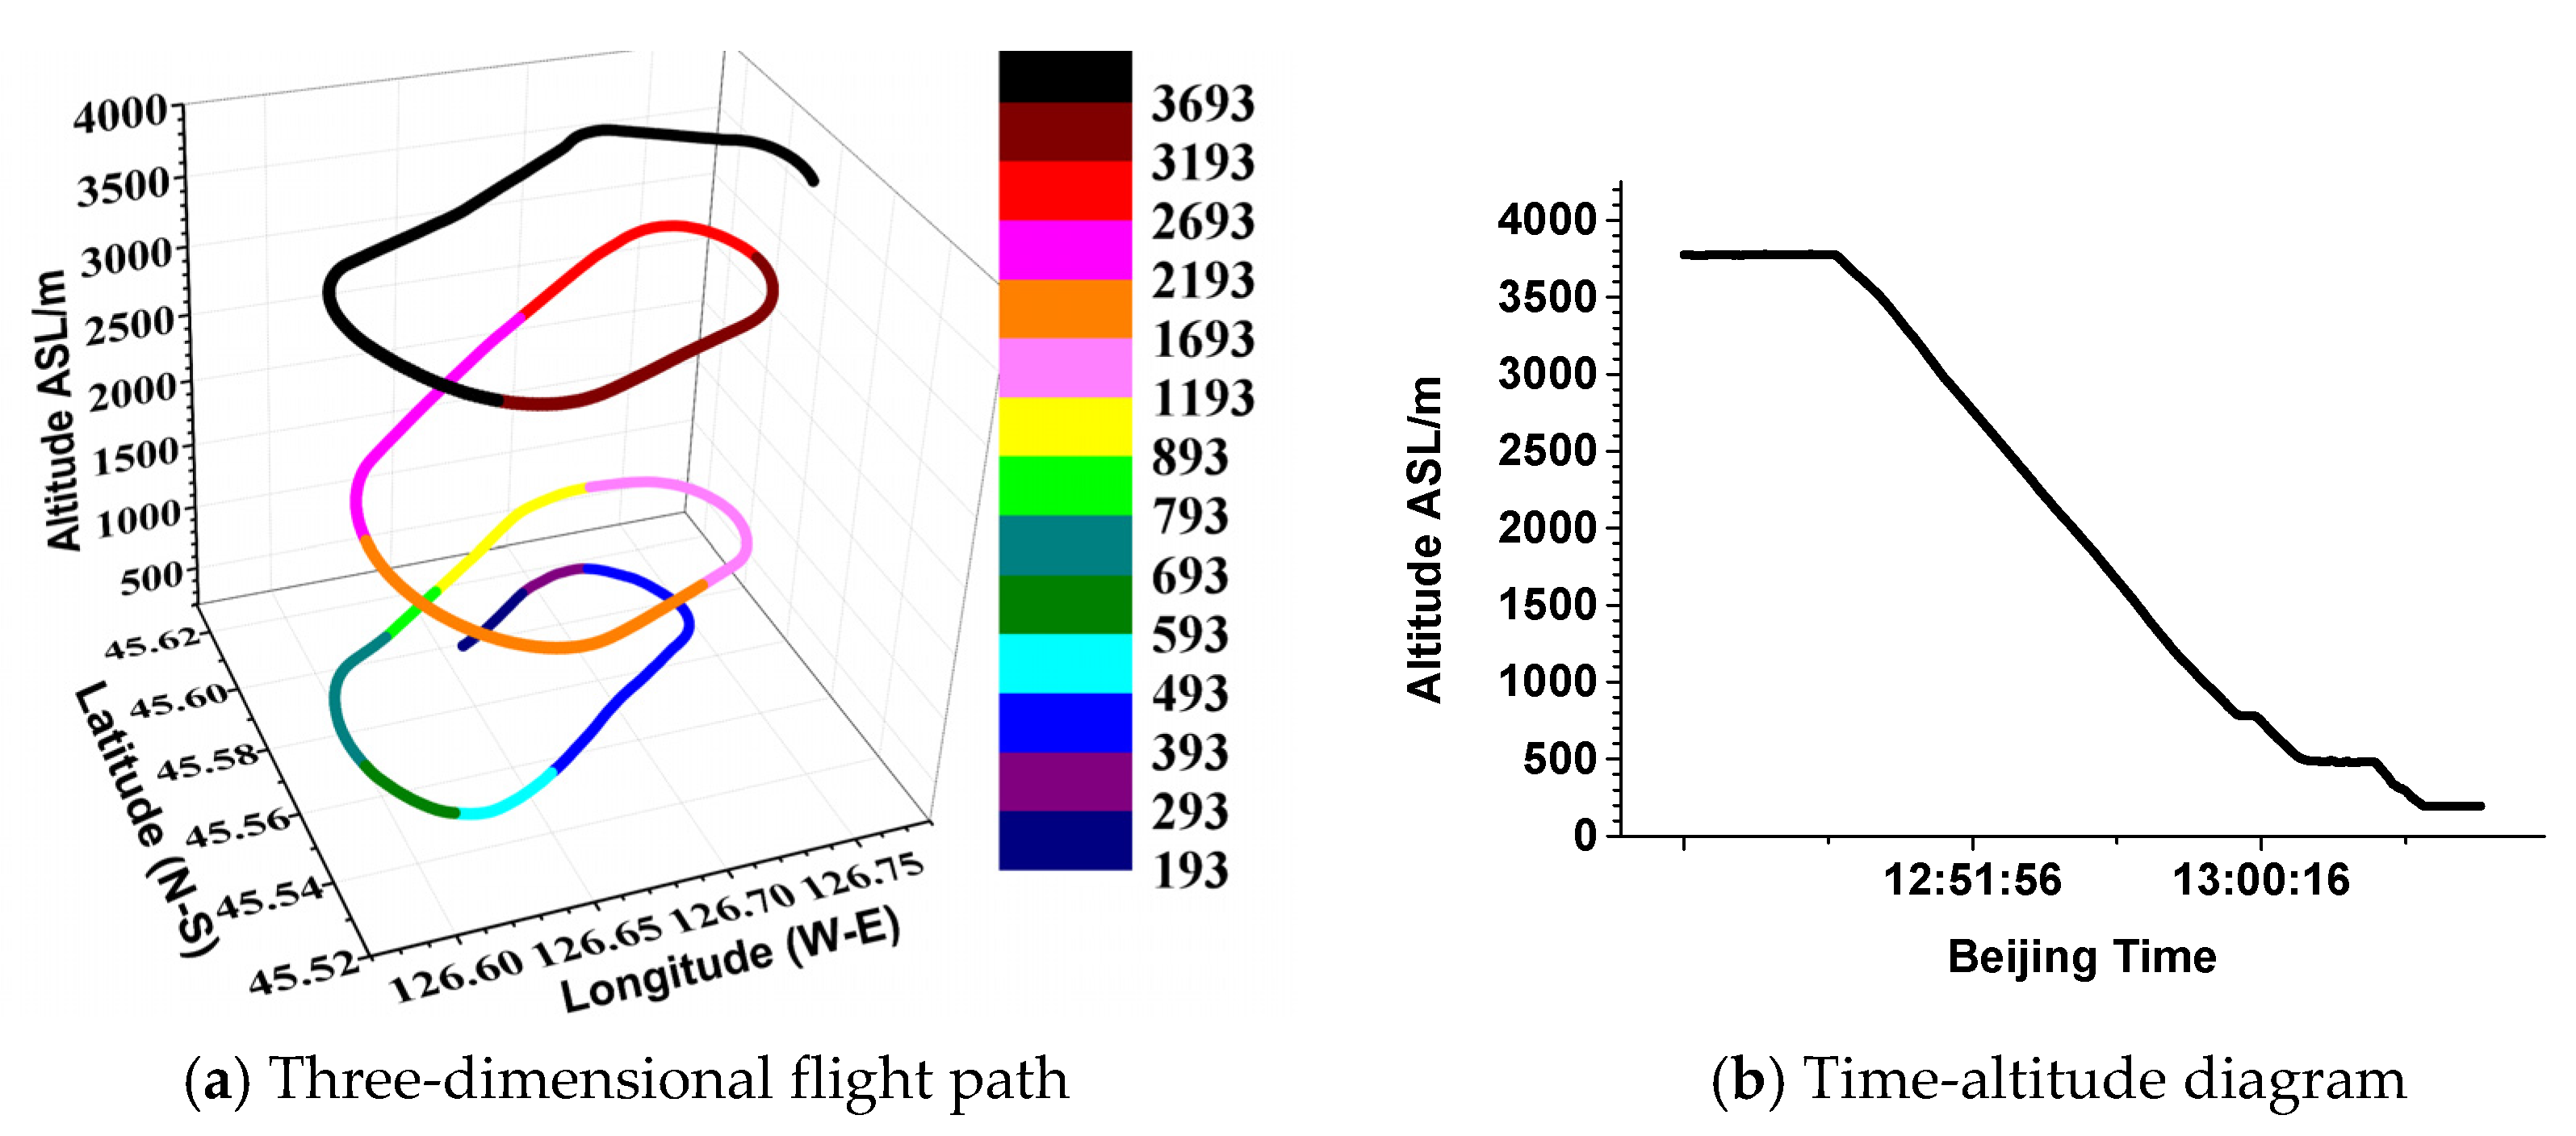
Both flights took off and landed at Ping Fang Airport of Harbin city. The altitude given by the aircraft GPS is the height above sea level (ASL), and therefore, the altitudes corresponding to the subsequent observation data refer to the ASL height. Because the SP2 did not work properly for a period of time after the aircraft took off, the BC detection data during the takeoff phase are incomplete. Therefore, only the detection results during the descent phase were analyzed in this study. The path of the two flights followed an elliptical spiral descent shape, the flight axis was southwest–northeast, and the flight path viewed from above was a counterclockwise descent (Figure 3a and Figure 4a).
On 20 October, the descent phase was from 12:22:30 to 13:06:03. The flight path is shown in Figure 3. The flight duration was approximately 44 min. The flight range was from 45.52° N to 45.62° N and from 126.57° E to 126.79° E. The aircraft descended spirally from an altitude of 2089 m and landed at Ping Fang Airport at 195 m ASL. More specifically, the aircraft circled 3.25 rounds at 2000 m before spiraling down, then circled 1 round at 700 m, and finally spiraled to land on the ground. During the entire flight, the aircraft circled 5.5 rounds, and each round lasted approximately 8 min.
On 25 October, the descent phase was from 12:43:47 to 13:06:35. The flight path is shown in Figure 4. The flight duration was approximately 23 min. The flight range was from 45.52° N to 45.62° N and from 126.58° E to 126.78° E. The aircraft descended spirally from a high altitude of 3781 m to the ground at 193 m ASL. More specifically, the aircraft circled 1 round at a height of 3400 m and then descended spirally to the ground. During the entire flight, the aircraft circled 3.5 rounds, and each round lasted approximately 7 min.

2.3. Simulation Scheme

The WRF-Chem model [33], which was jointly developed by multiple institutions including the National Center for Atmospheric Research (NCAR) and the National Oceanic and Atmospheric Administration (NOAA), the version 3.8.1 was used in this study. In the modeling, the Lambert projection was used, with a horizontal resolution of 6 km. The number of grid points in the horizontal area was 140 × 140, and the center was located at 124.4° E, 45.2° N. The top of the simulated area was at 100 hPa. The number of vertical layers was 45 layers, and 24 layers were below 1 km. The initial and boundary conditions of the meteorological field were provided by the six-hour global NCEP/NCAR reanalysis Final (FNL) data. The initial conditions and boundary conditions of the chemical substance concentrations were provided by the six-hour Model for Ozone and Related Chemical Tracers-4 (MOZART-4) [34] simulation results.
The physical and chemical process parameterization schemes used in this study are shown in Table 1. For parameterization of cloud and precipitation processes the Lin microphysics scheme [35] together with the Grell–Freitas ensemble cumulus parameterization [36] were employed. The RRTMG short- and long-wave radiation schemes [37] were used to couple with the aerosol scheme to reproduce aerosol–radiation interactions. QNSE-EDMF boundary layer scheme [38] and the unified Noah land surface scheme [39] were applied for boundary layer evolution and land-atmosphere interactions, respectively. The photolysis rate required for photochemical reaction processes is calculated by the Fast-J method [40]. In the calculation process, the scattering and absorption of solar radiation by the atmosphere are considered. The photolysis rate is updated once per hour for the gas-phase chemical module. Wesely parameterization of dry deposition [41,42] was used. The model gas-phase chemical mechanism used Carbon Bond Mechanism Version Z (CBM-Z) [43], which contains 55 substances and 134 chemical reactions. The aerosol chemical scheme used the Model for Simulating Aerosol Interactions and Chemistry (MOSAIC) [44], which includes eight types of aerosols: sulfate, nitrate, ammonium, chloride, sodium, other inorganics, organic carbon, and elemental carbon. Both anthropogenic and natural sources are included in the model. The anthropogenic source used in the model is from MEIC and contains 10 major air pollutants and greenhouse gases (SO2, NOx, CO, NMVOC (Non-Methane Volatile Organic Compound), NH3, CO2, PM2.5, PM10, BC, and OC) and more than 700 anthropogenic sources. BioSource emissions are from the Model of Emissions of Gases and Aerosols from Nature (MEGAN) [45]. Biomass combustion values are from the Fire Inventory from NCAR (FINN) [46]. The simulation time is 36 h from 8:00 on 24 October 2016 to 20:00 on 25 October 2016.

3. Results and Discussion

3.1. Airborne Detection Results and the Interpretation

3.1.1. Airborne Detection Results

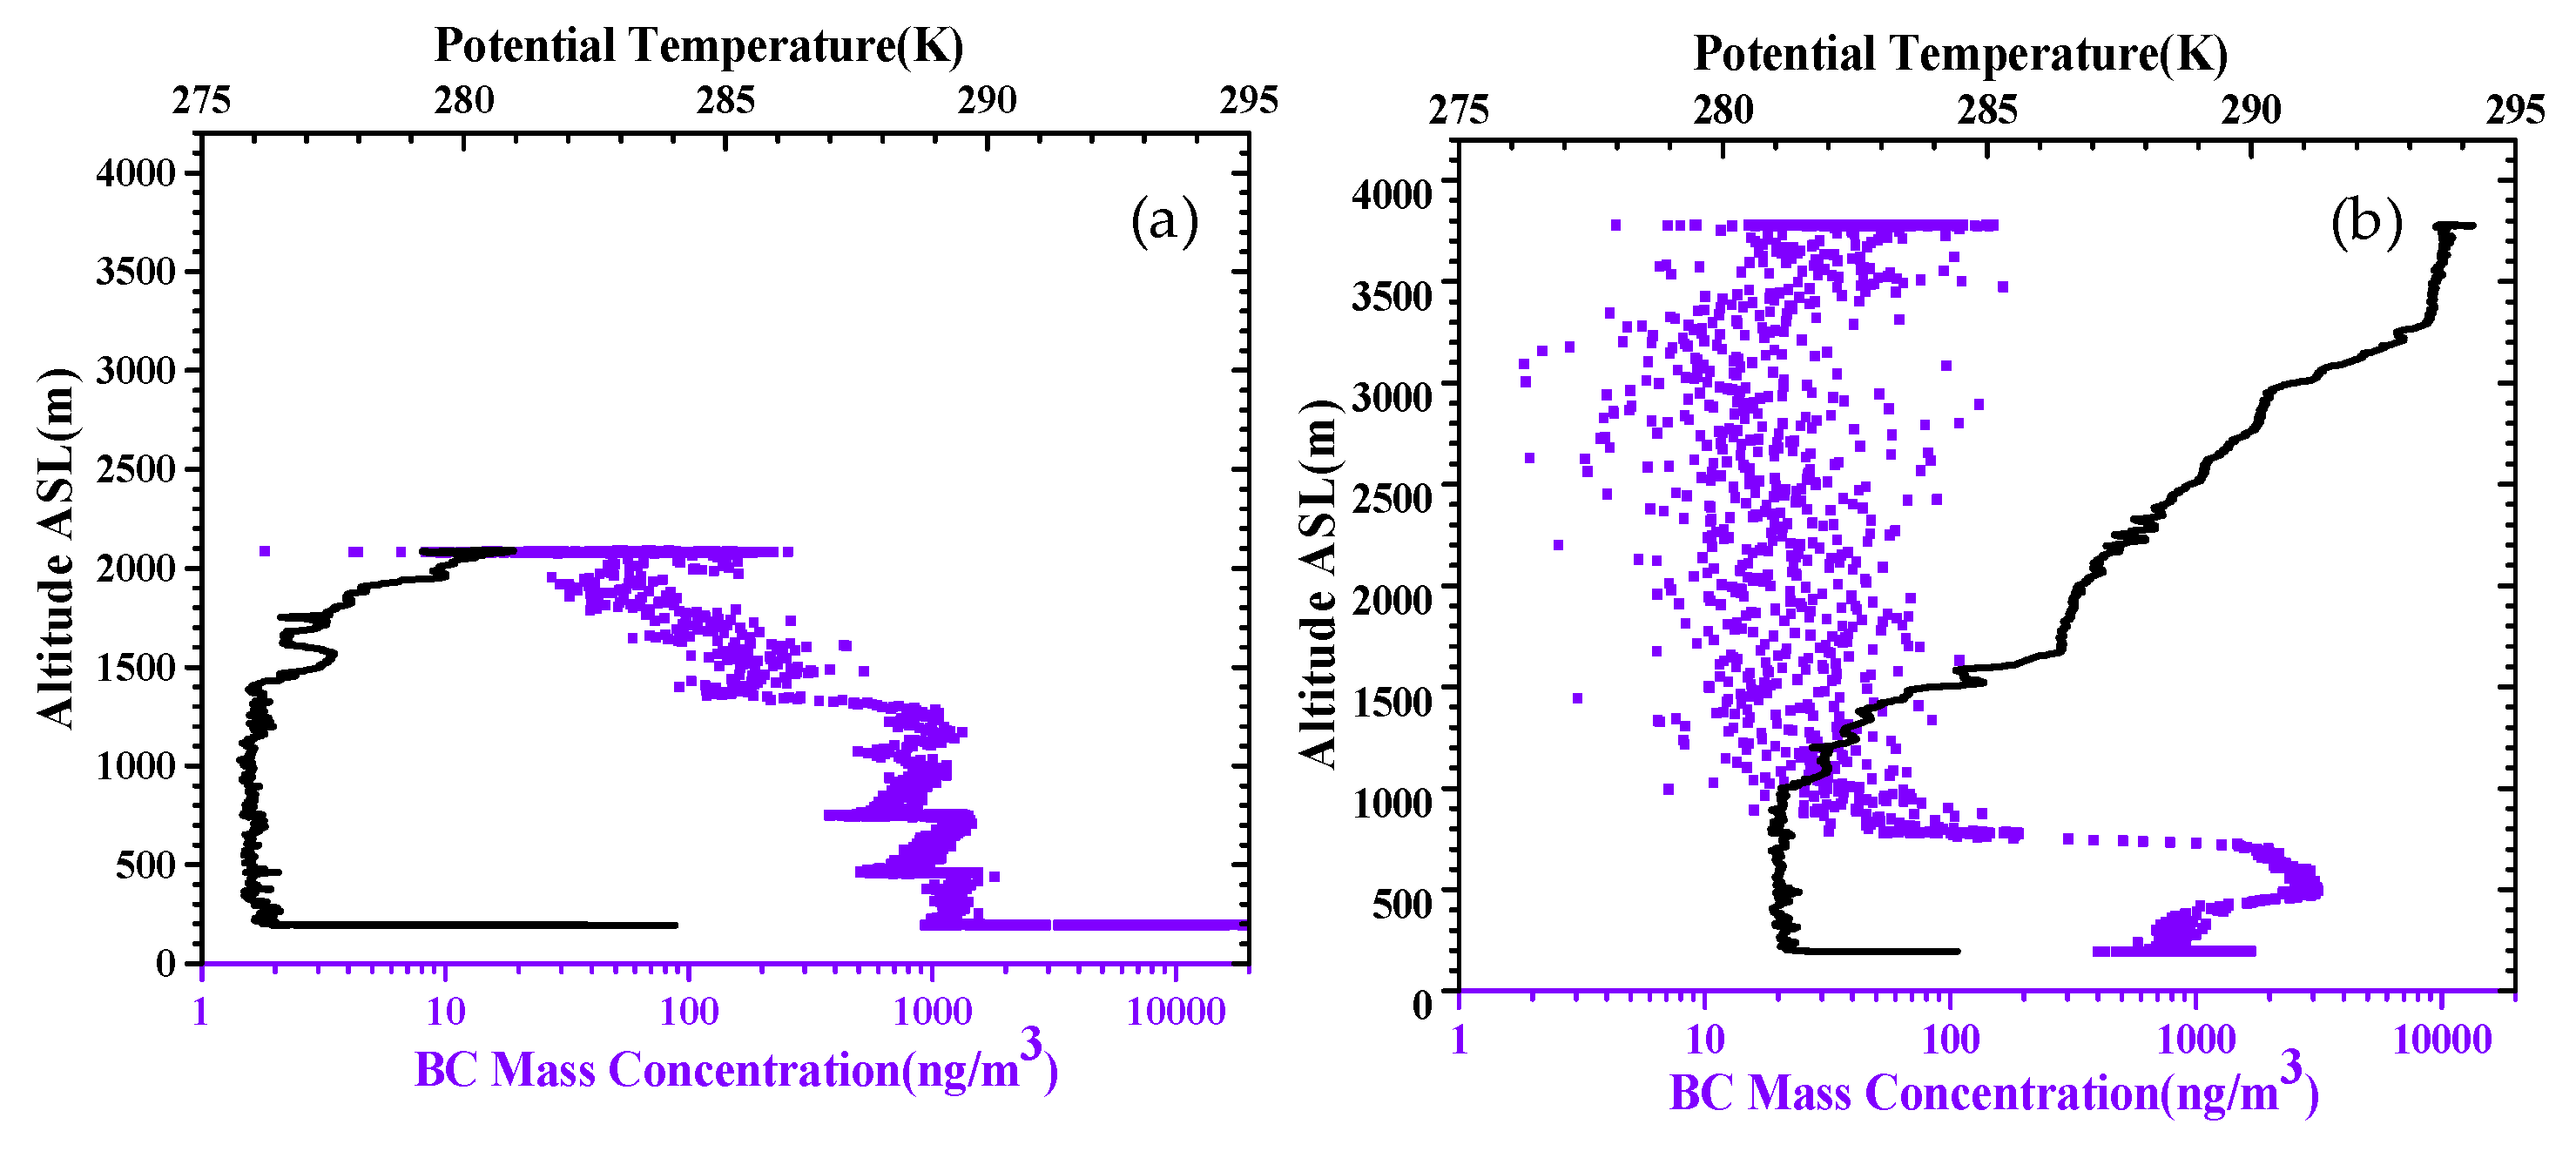
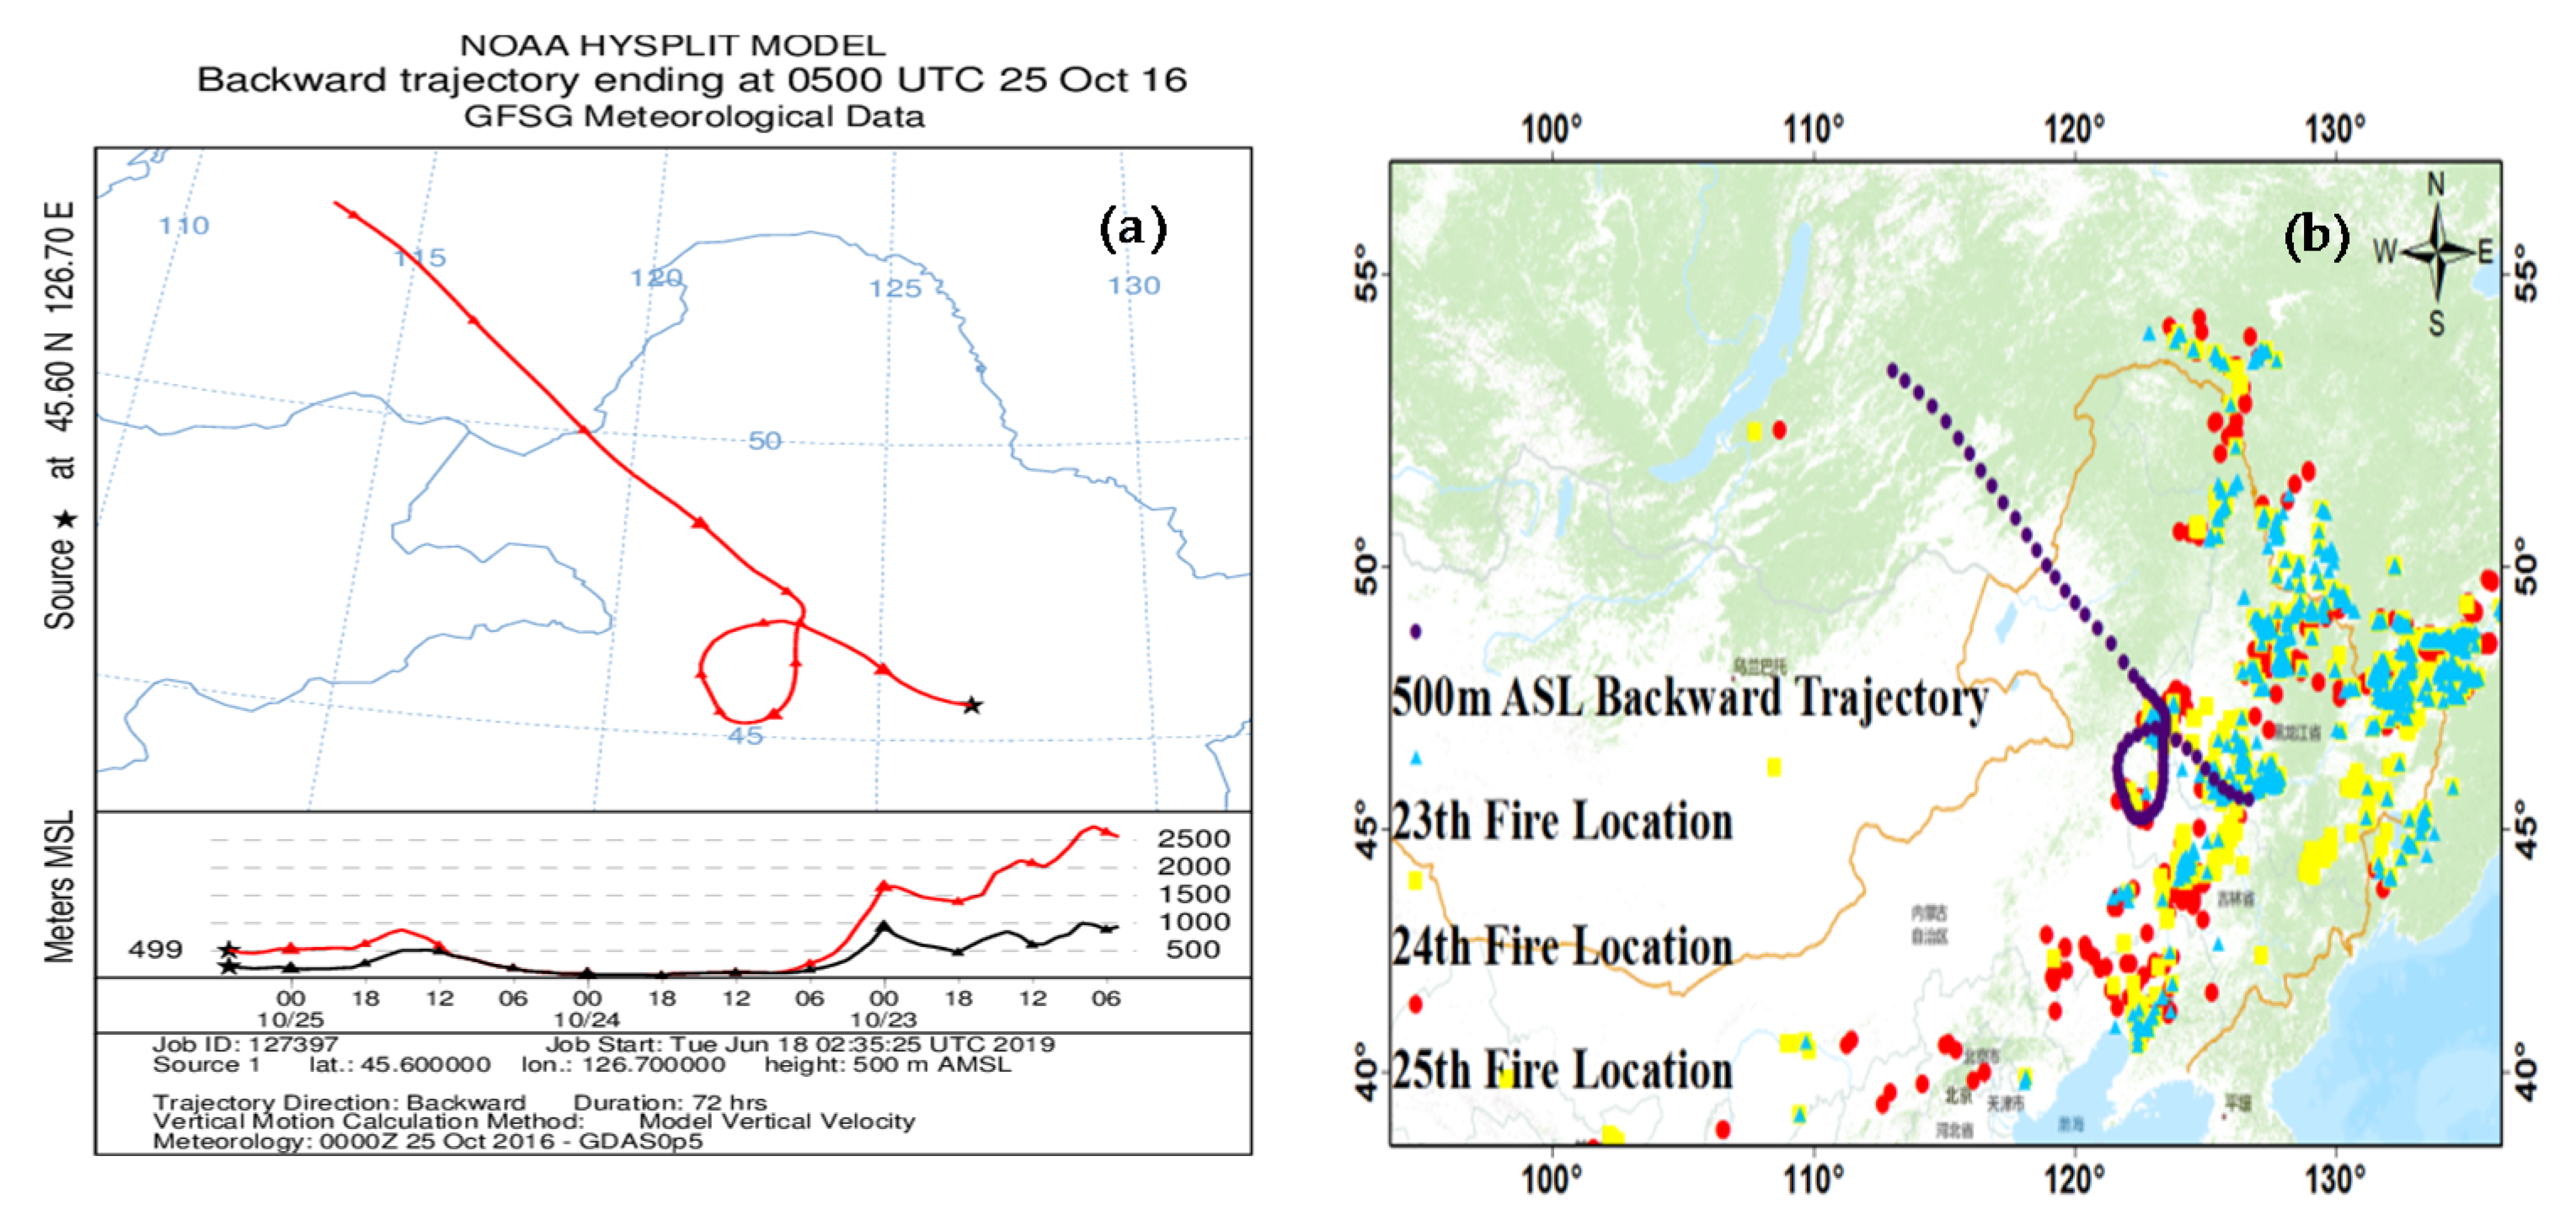
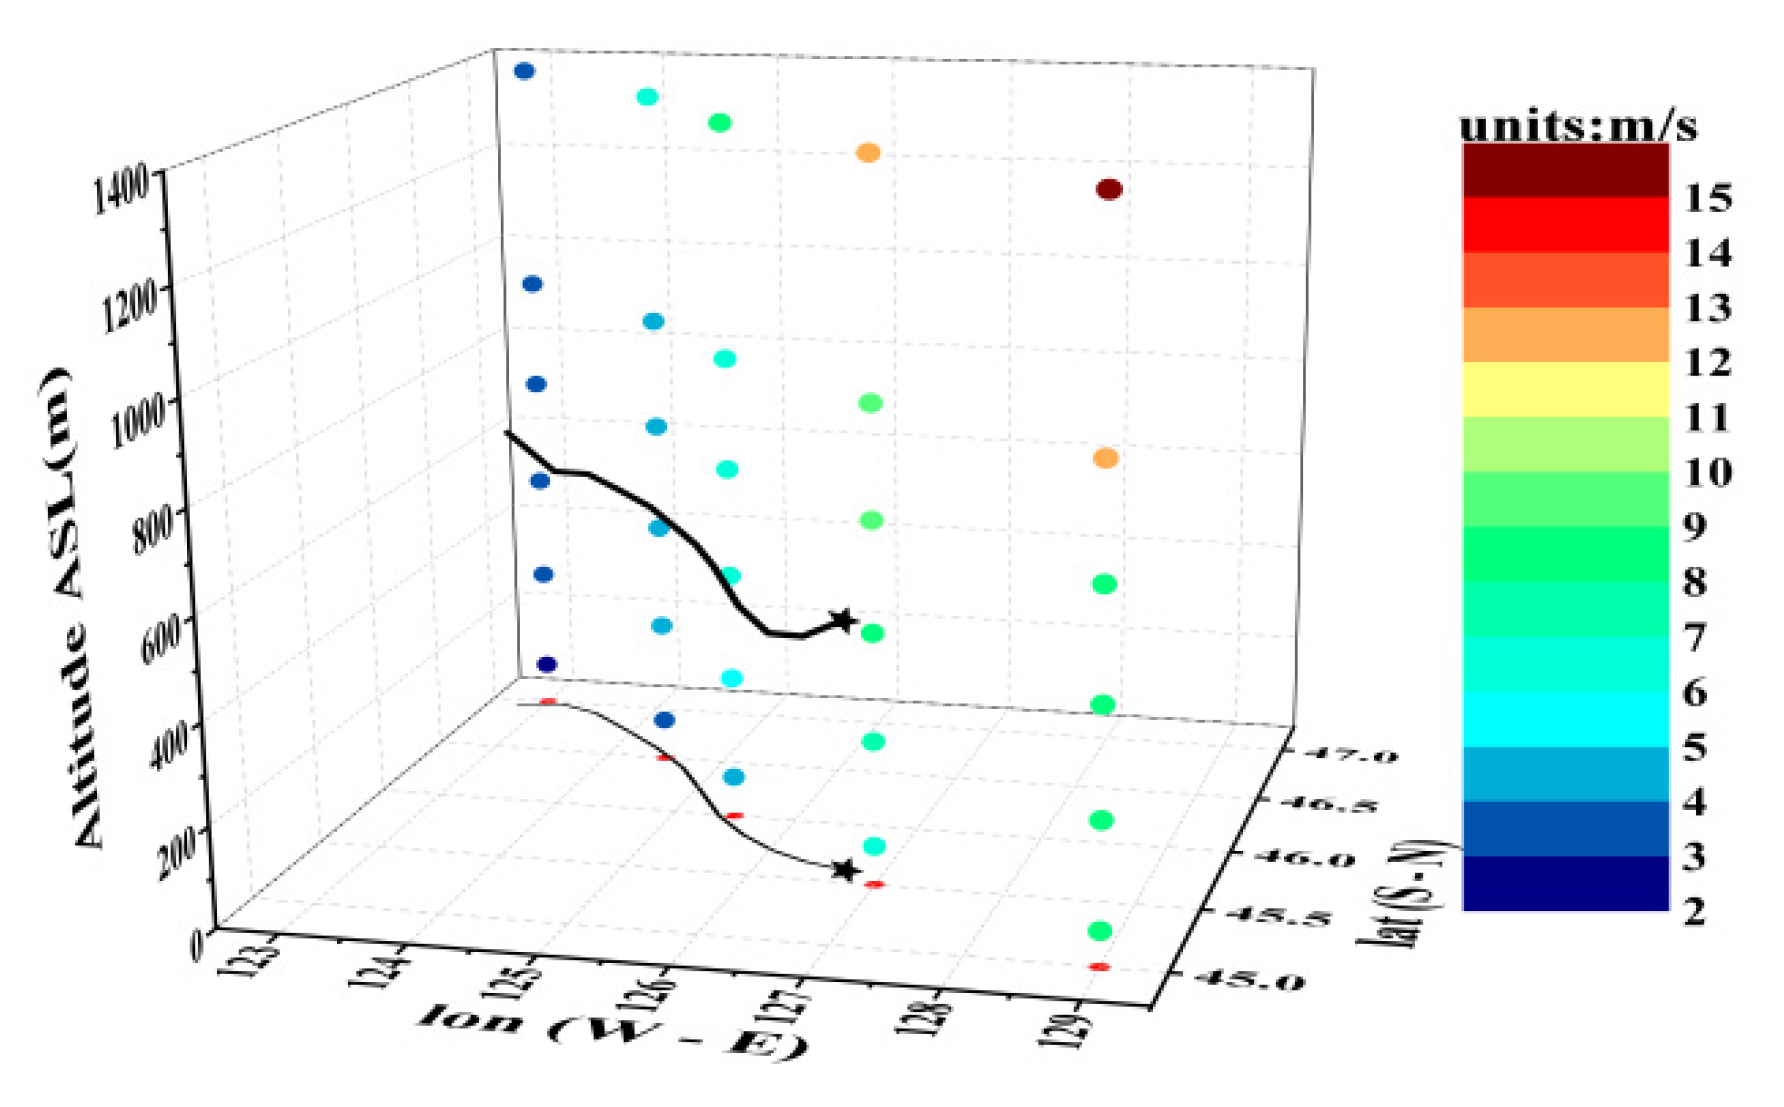
Figure 5 shows the potential temperature and the BC mass concentration detected by the two flights. Based on the potential temperature, it can be seen that the altitudes of the mixing layer top during the flight period on 20 October and 25 October were approximately 1300 m and 1000 m, respectively. The BCs were compressed in the mixing layer, similar to other observations [13,16,24]. In the mixing layer, the BC mass concentration did not change with the altitude on 20 October, which was caused by turbulent mixing. On 25 October, anomalies occurred, that is, there was an elevated layer from the ground to an altitude of 700 m where the BC mass concentration was larger than that at the ground, and a peak value appeared at an altitude of approximately 500 m. The 72-h backward trajectory is calculated using the numerical model, Hybrid Single-Particle Lagrangian Integrated (HYSPLIT, Figure 6a). The starting time was 13:00 (Beijing time, 5:00 UTC) on 25 October 2016. From Figure 6a and the diagram combining the backward trajectory and satellite fire spots (Figure 6b), it can be seen that the air mass at the position of the observed peak value at 5:00 UTC on 25 October (45.6° N, 126.7° E, 500 m ASL) originated at 2500 m ASL in Russia 72 h ago. This air mass, after passing over Inner Mongolia, fell to the ground near Qiqihar, Heilongjiang Province with densely distributed fire spots 48 h prior to the observation. Then, the air mass moved southward along the ground to fire spot areas in Bai Cheng, Jilin Province and rose to 500 m ASL 18 h prior to the observation. After passing over Qiqihar and Daqing at a height parallel to the ground from the northwest direction, the air mass reached Ping Fang District of Harbin at an altitude of 500 m ASL. Therefore, the peak BC mass concentration value observed in the afternoon on 25 October may be related to the horizontal advection of BCs in the surroundings. However, on the vertical cross-section where the backward trajectory (the last 13 h) is located (Figure 7), the distribution of the FNL horizontal wind speed at 14:00 shows no peak at approximately 500 m. Given the low spatial resolution of the FNL analysis data and the lack of horizontal distribution of BC concentrations, we tried to simulate the peak at 500 m ASL and give an interpretation of it using the WRF-Chem model.

3.1.2. The Evaluation of Modeling on the Case on 25 October

BC concentration is simulated by using the WRF-Chem model with schemes written in Section 2.3. Kipling et al [47] showed that point-by-point analysis allowed the model improvements to be demonstrated more clearly, the point-by-point analysis is also used in this paper. To compare the simulation results to the aircraft observation results (shown in Figure 5b), the simulated BC concentration sampled along the flight track at 13:00 on 25 October is plotted (see Figure 8). To reduce the influence of insufficient grid distance on the results, the values in the figure are processed by bilinear interpolation. It is worth mentioning that since the flight path is not vertical (see Figure 4a), neither Figure 8 nor Figure 5b are vertical profiles. As can be seen from Figure 8, this result simulates the peak at the altitude of approximately 500 m, which occurs in the observation results of the aircraft (see Figure 5b), and the peak value in simulation results is close to the observation results, that is, between 3.0 and 4.0 μg/kg. It is a good simulation.

3.1.3. A Numerical Simulation Analysis on the Authenticity of the Elevated BC Concentration Layers

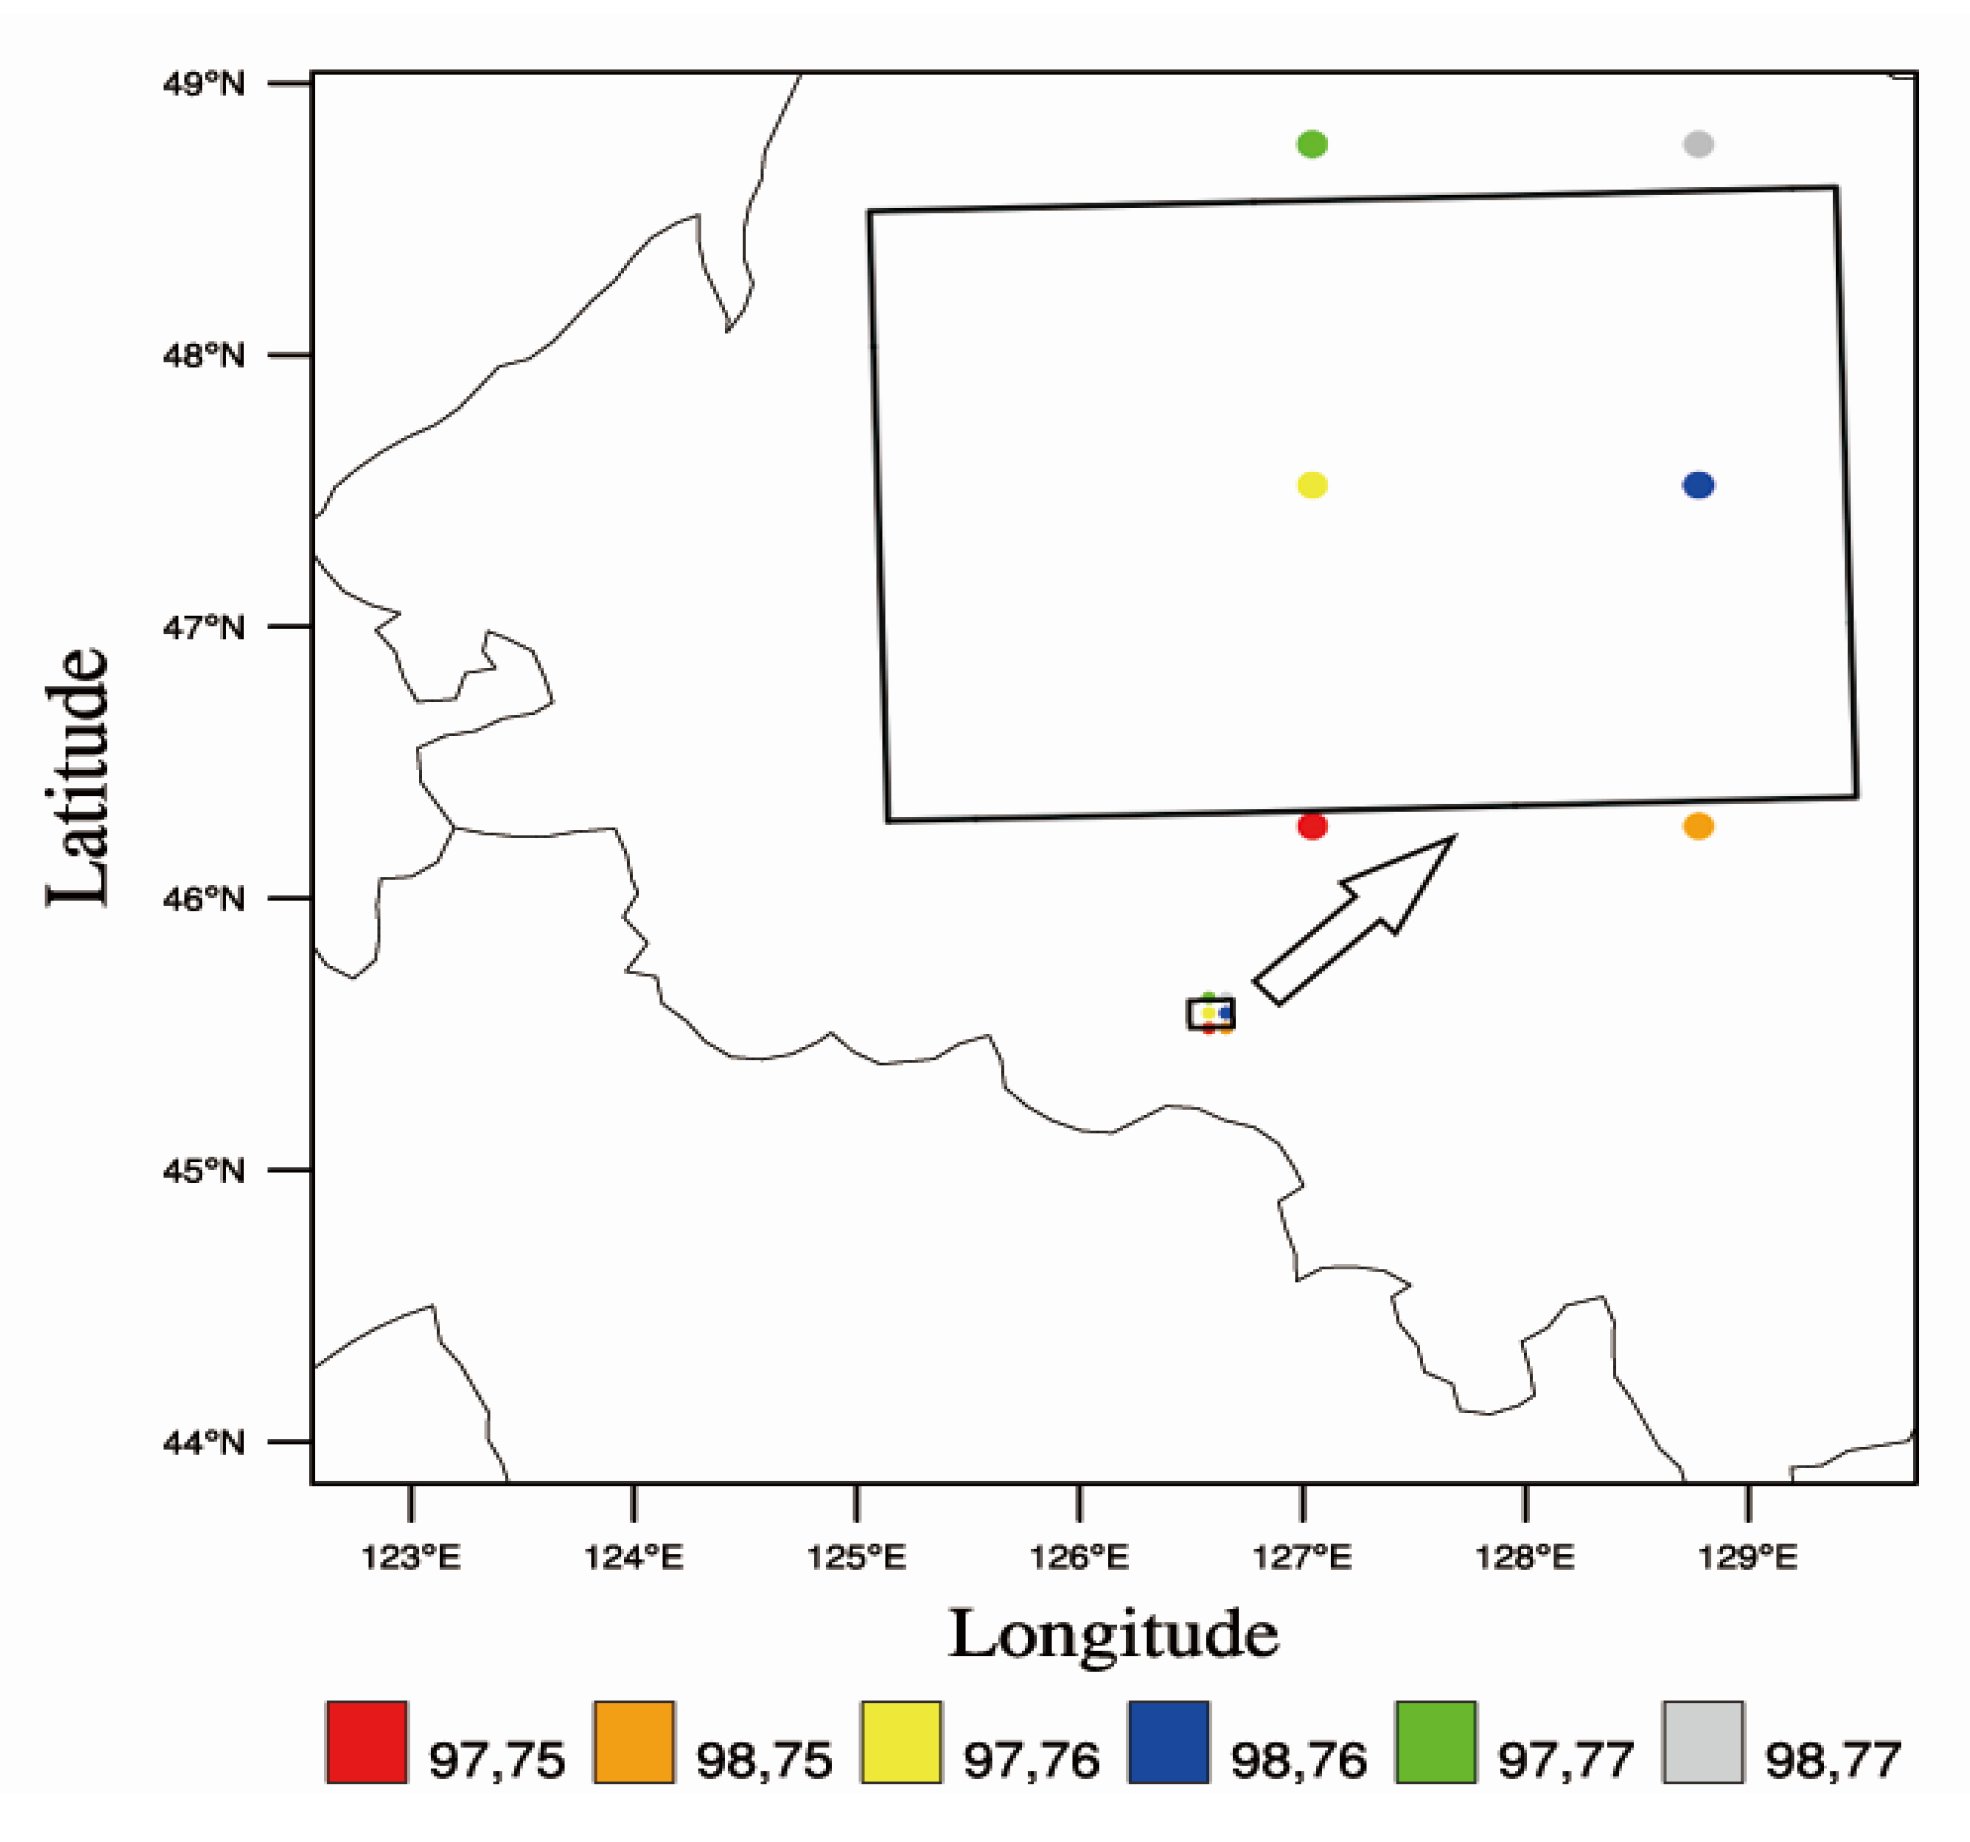
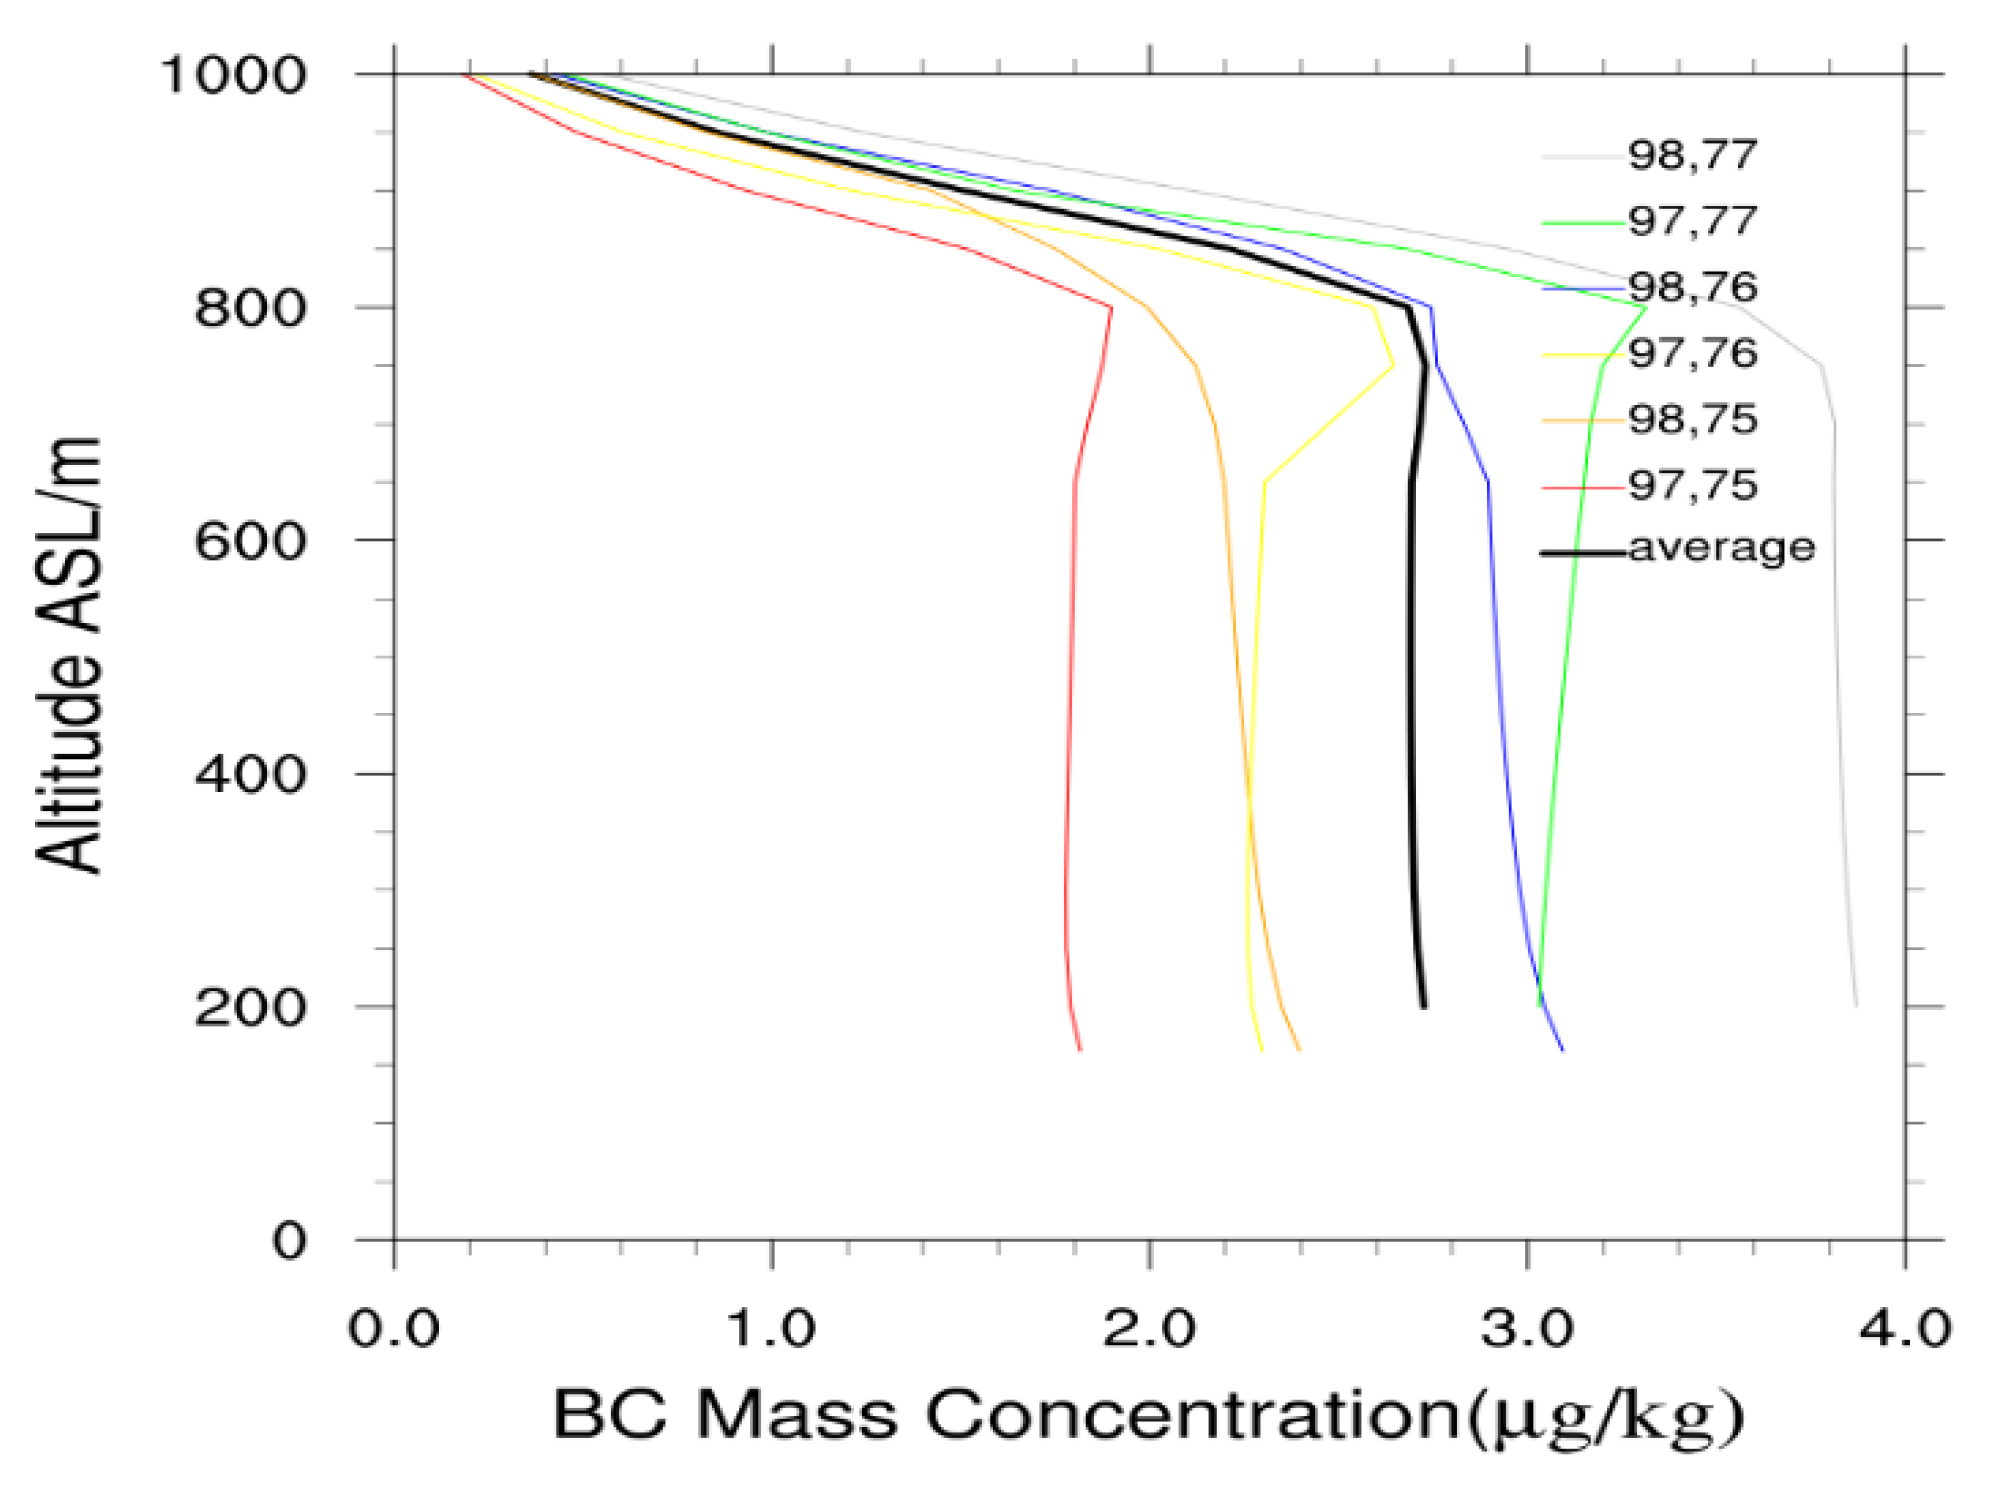
Figure 9 shows the location of the flight area and the six nearby ground grid points in the simulation. Figure 10 shows the vertical distribution of the simulated BC concentration at 13:00 on 25 October at these points. We can find in Figure 10 that all of these BC concentration vertical profiles don’t display the peak at the height of approximately 500 m, but they show that the BC concentrations under the altitude of 800 m do not change with height. In addition, Figure 10 shows that the difference between any two vertical profiles is large. This finding reflects that the horizontal variability of BC concentration is relatively large. Combining Figure 10 with the locations of the six grid points (Figure 9), it can be seen that, for the simulation results of BC concentration below 800 m altitude, the concentration in the southwest of the flight area is lower than that in the northeast, which horizontal distribution is consistent with the MEIC ground emission rate distribution of black carbon aerosol in October 2012 (see Figure 11) used by the simulation in this paper.
As we know, the aircraft did not descend vertically during the measurement. If the aircraft first descended from a low-concentration area to a high-concentration area and then returned to the low-concentration area, the observed “vertical profile” of the BC concentration would inevitably show a peak at the turning altitude. For our simulation results, when the aircraft descends along the flight path (Figure 4a) in the mixing layer where the vertical distribution of the simulated BC concentration is as shown in Figure 10, it can be seen that the aircraft flew from the southwest (low-concentration area) at an altitude of approximately 600 m to the northeast (high-concentration area). At an altitude of 400–500 m, the aircraft turns to the northwest and then to the southwest (low-concentration area) and then quickly descends, consequentially leading to the occurrence of a peak at approximately 500 m as shown in Figure 8.
In summary, the simulation results in this paper show that the BC concentration does not change with the height and has big horizontal variability below 800 m on 25 October in the flight area, however, the flight path matched so well with the horizontal distribution of BC concentration that a peak at the altitude of approximately 500 m occurs. Therefore, it can be seen at a simulation view that the elevated BC concentration layer in the mixing layer observed by the aircraft on 25 October (see Figure 5b) is false.
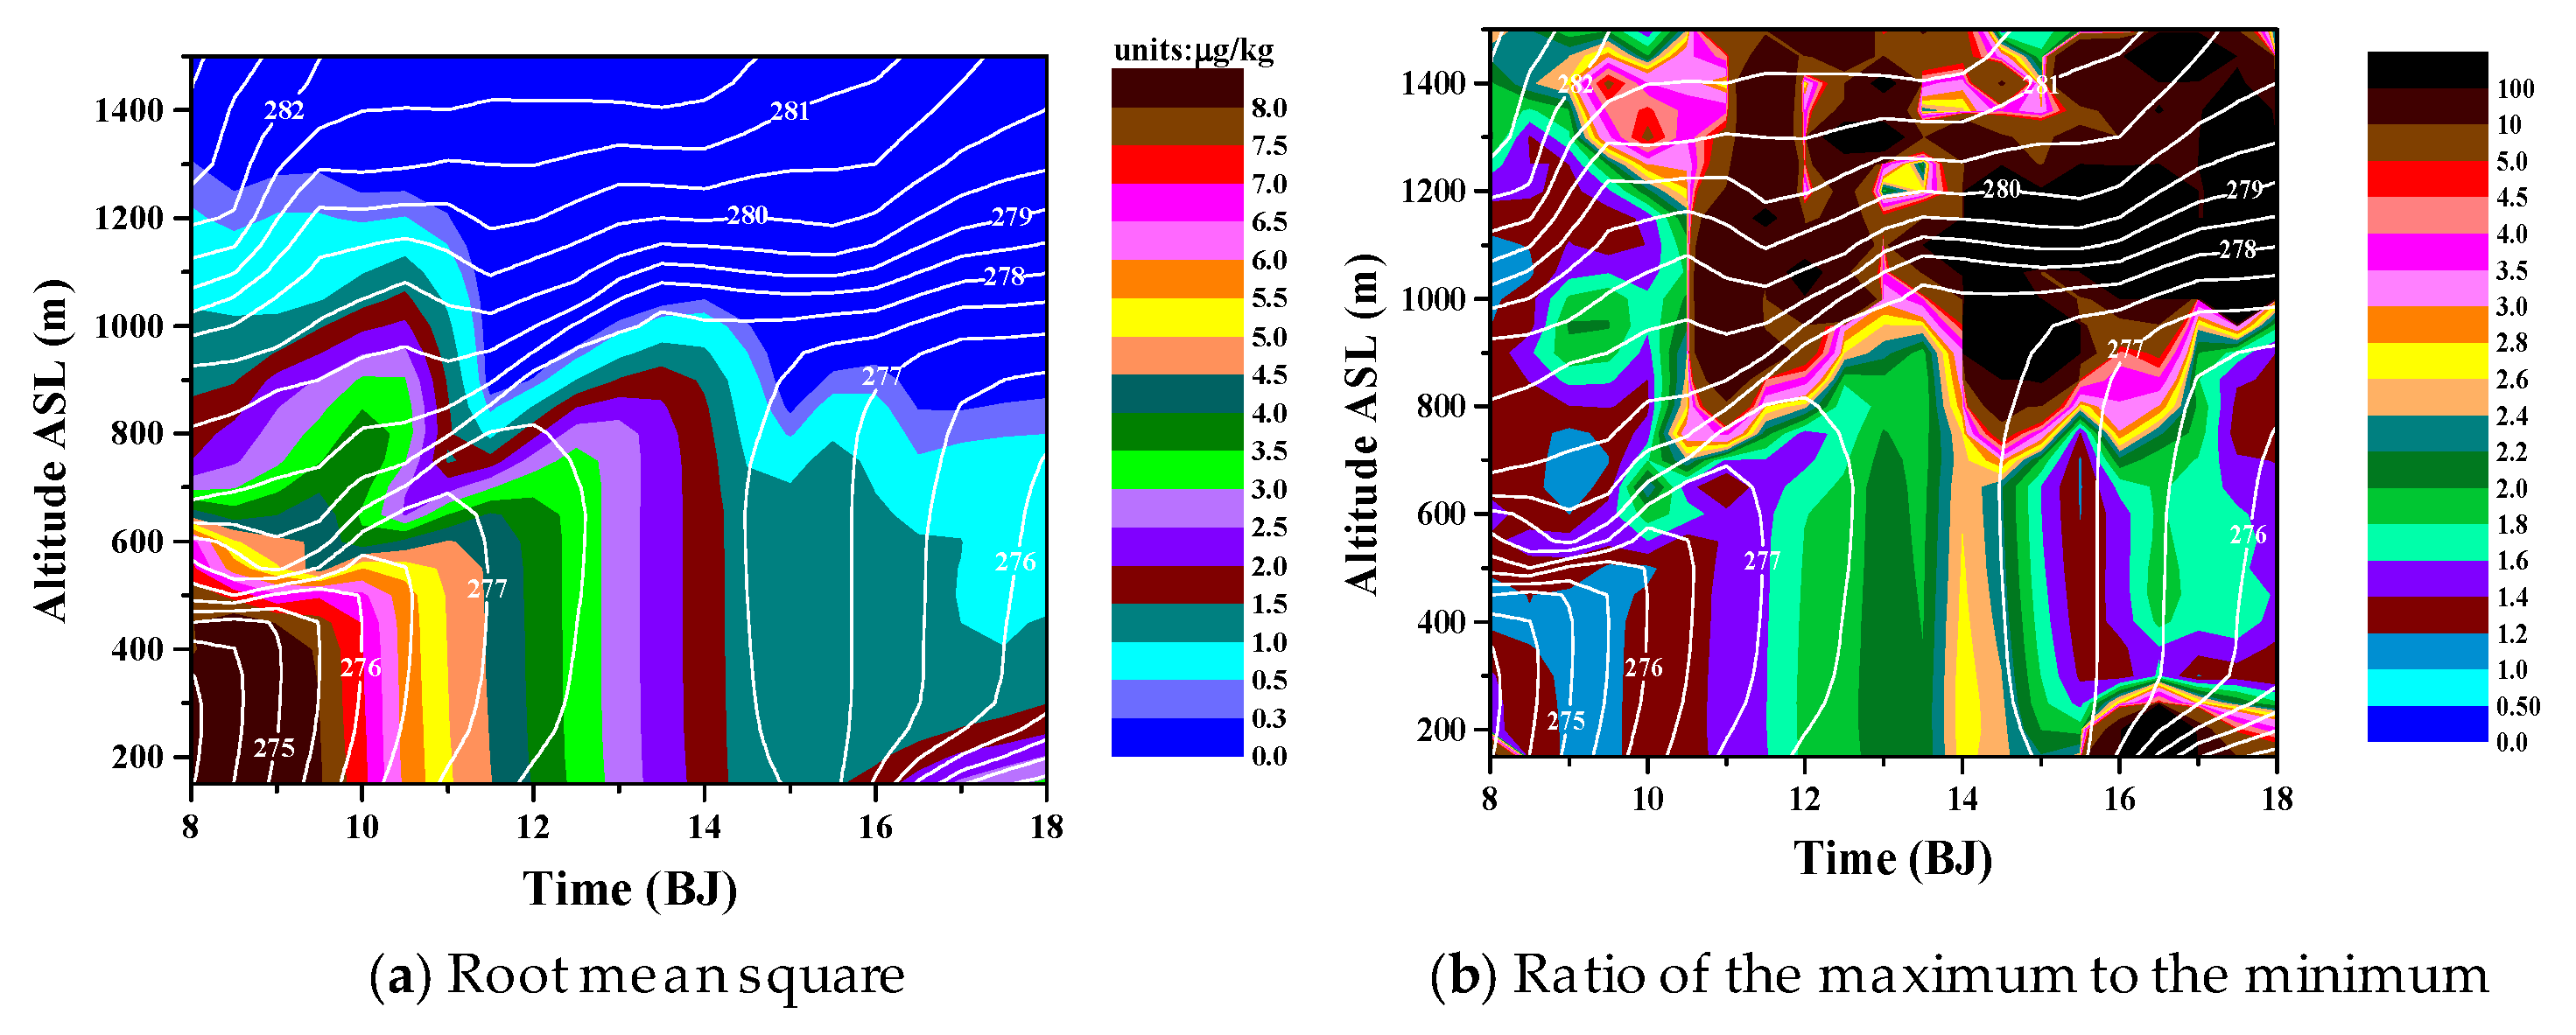
We can see from the above that we must be cautious in the horizontal heterogeneity of BC concentration. The root mean square of the simulated BC concentration and the ratio of the maximum to the minimum simulated BC concentration among the six grid points (Figure 12) show that between 8:00 and 14:00 the horizontal variability of the BC concentration among the six grid points did not change with the altitude in the mixing layer. Above the mixing layer, the root mean square decreased rapidly with the altitude, while the ratio of the maximum to the minimum was larger than the value within the mixing layer. As the thickness of the mixing layer increased, the root mean square in the mixing layer decreased, while the ratio of the maximum to the minimum increased.

3.1.4. Discussion about the Observation Path

It is necessary to discuss whether it is possible for the BC concentration not to change with the height and to vary significantly at the same altitude in the middle and lower layers of the mixing layer in the real atmosphere, as shown in Figure 10. It is reasonable that the BC concentration in the mixing layer does not vary with the height when the local mixing is the key factor in the vertical distribution [16]. In addition, significant differences in BC concentration on the ground have also been observed in high-emission areas. For example, the ground movement monitoring conducted by researchers in Shanghai showed that the BC concentration of traffic sources was 10.77 ± 3.50 g/m3, BC concentrations showed a significant spatial heterogeneity [48]. Moreover, if the results at the horizontal flight stage on 20 October in Harbin (as shown in Figure 5a) are paid attention to, the horizontal differences of BC concentration at several levels in the mixing layer are also found.
Therefore, the vertical distribution of BC concentration can be as shown in Figure 10 in the actual atmosphere in the flight area during the observation period. This means that the horizontal variability of the BC concentration in the lower and middle layer of the atmospheric mixing layer may be sufficiently large in the early phase of the heating period even though the Ping Fang District in Harbin covers a horizontal area of only 10–20 km. As a result, false elevated BC concentration layers may be detected during spiral flight measurements.
Therefore, the aircraft detection path needs to be carefully designed. When the vertical distribution of the BC concentration is observed, the more attention should be paid to the horizontal variability of the BC concentration for the smaller thickness of the mixing layer to avoid observing false elevated BC concentration layers. If the vertical distribution of the actual atmospheric BC concentration belongs to the type shown in Figure 10, it is possible to observe the false BC high-value layer when the aircraft only conducts one round of spiral flight in the mixing layer, if the aircraft conducts a few rounds of spiral flight in the mixing layer, it cannot be mistaken for a BC high-value layer, for example, The flight path on 20 October (Figure 3) shows that the aircraft circled twice and a half in the mixing layer, and correspondingly, the BC concentration also shows multiple fluctuations with the altitude (Figure 5a). Therefore, it is still possible to use the detection results of this flight to estimate the vertical distribution of the BC concentration. In addition to one aircraft observation, two aircrafts may be considered to spiral in opposite directions at the same time. We may also consider aircraft spiraling in conjunction with ground-based lidar detection, or consider manned (unmanned) helicopter detection.

3.2. Simulation Analysis of the Influence of the Turbulence on the Formation of the Elevated BC Layer

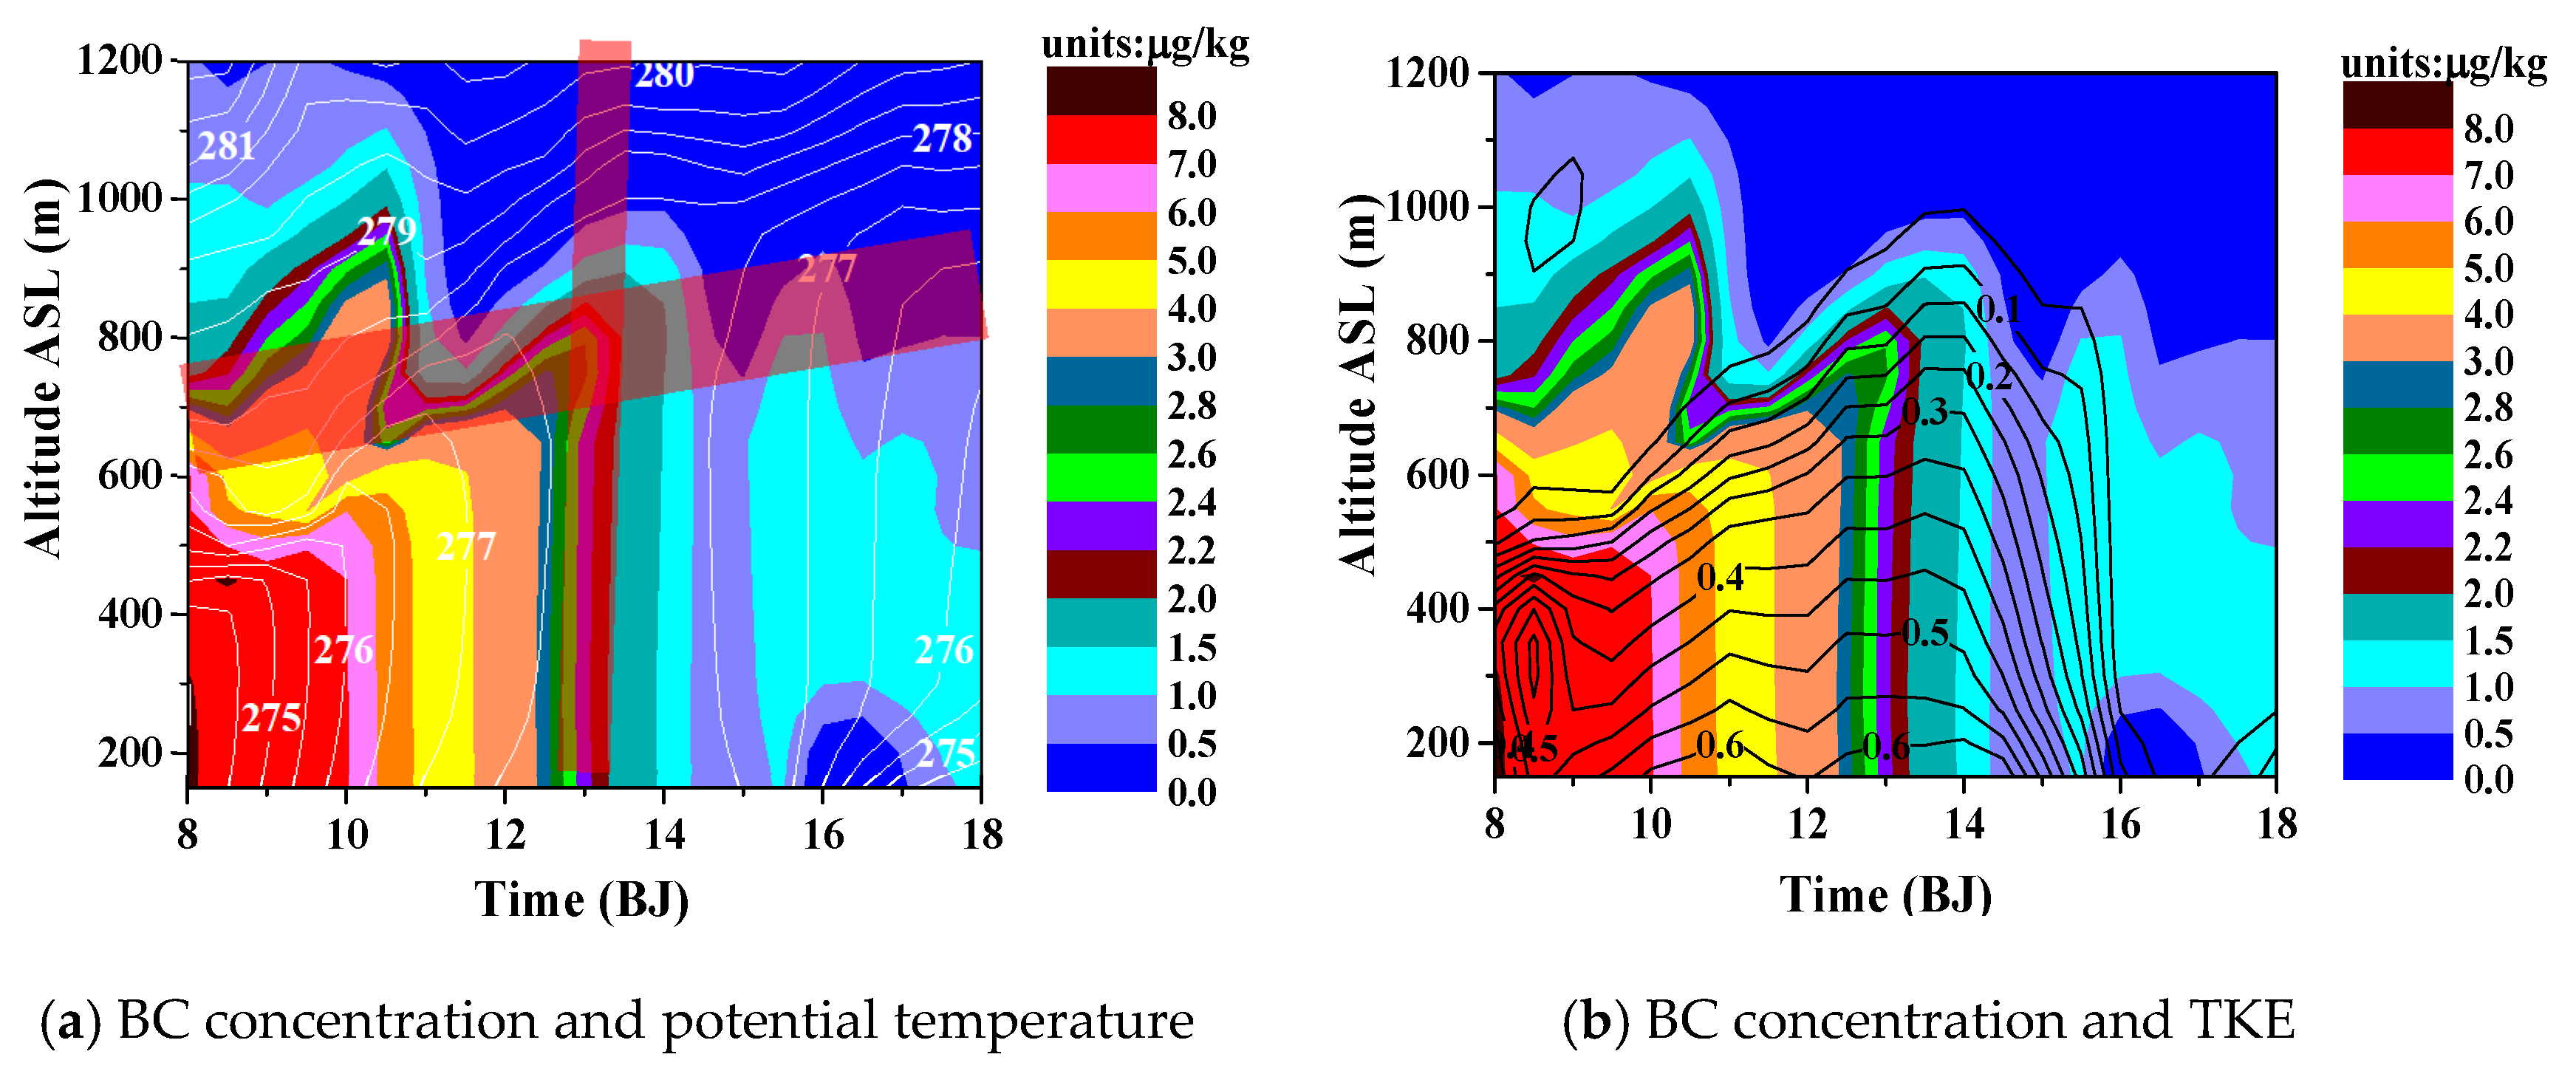
The simulation results at 13:00 (Figure 10) show that although the peak values of the BC concentration did not occur at 500 m, they did occur at 800 m at three grid points. At the grid point (97, 76), the vertical BC profile shows the most distinct elevated layer. The temporal evolution of the vertical distribution of the BC concentration at grid point (97, 76) (Figure 13a) shows that a short-term elevated layer occurred at a height of 660–800 m only between 12:40 and 13:20. From the perspective of the vertical gradient of the potential temperature, the height of the mixing layer top is about 1000 m during this period (see Figure 13a), indicating that the elevated layer occurred in the upper part of the mixing layer, where the turbulent kinetic energy (TKE) is relatively small (see Figure 13b) in the simulation of this paper.
To investigate the relationship between advection transport and the peak in the upper part of the mixing layer, the advection transport rate is calculated. The horizontal advection transport rate and vertical advection transport rate are calculated by the following equations:
T R h = 1 ρ ( ( ρ b u ) x + ( ρ b v ) y )
T R v = 1 ρ ( ρ b w ) z
In Equations (1) and (2), ρ, b, u, v, and w represent the air density, BC concentration (here, it is the mass of BCs per unit mass of air), the east-west component of the wind, the south-north component of the wind, and vertical component of the wind, respectively. In the calculation, we use simulation results and the approximate values are calculated using the central difference format, except that for the grid points at the boundary, the approximate values are calculated using forward or backward differencing.
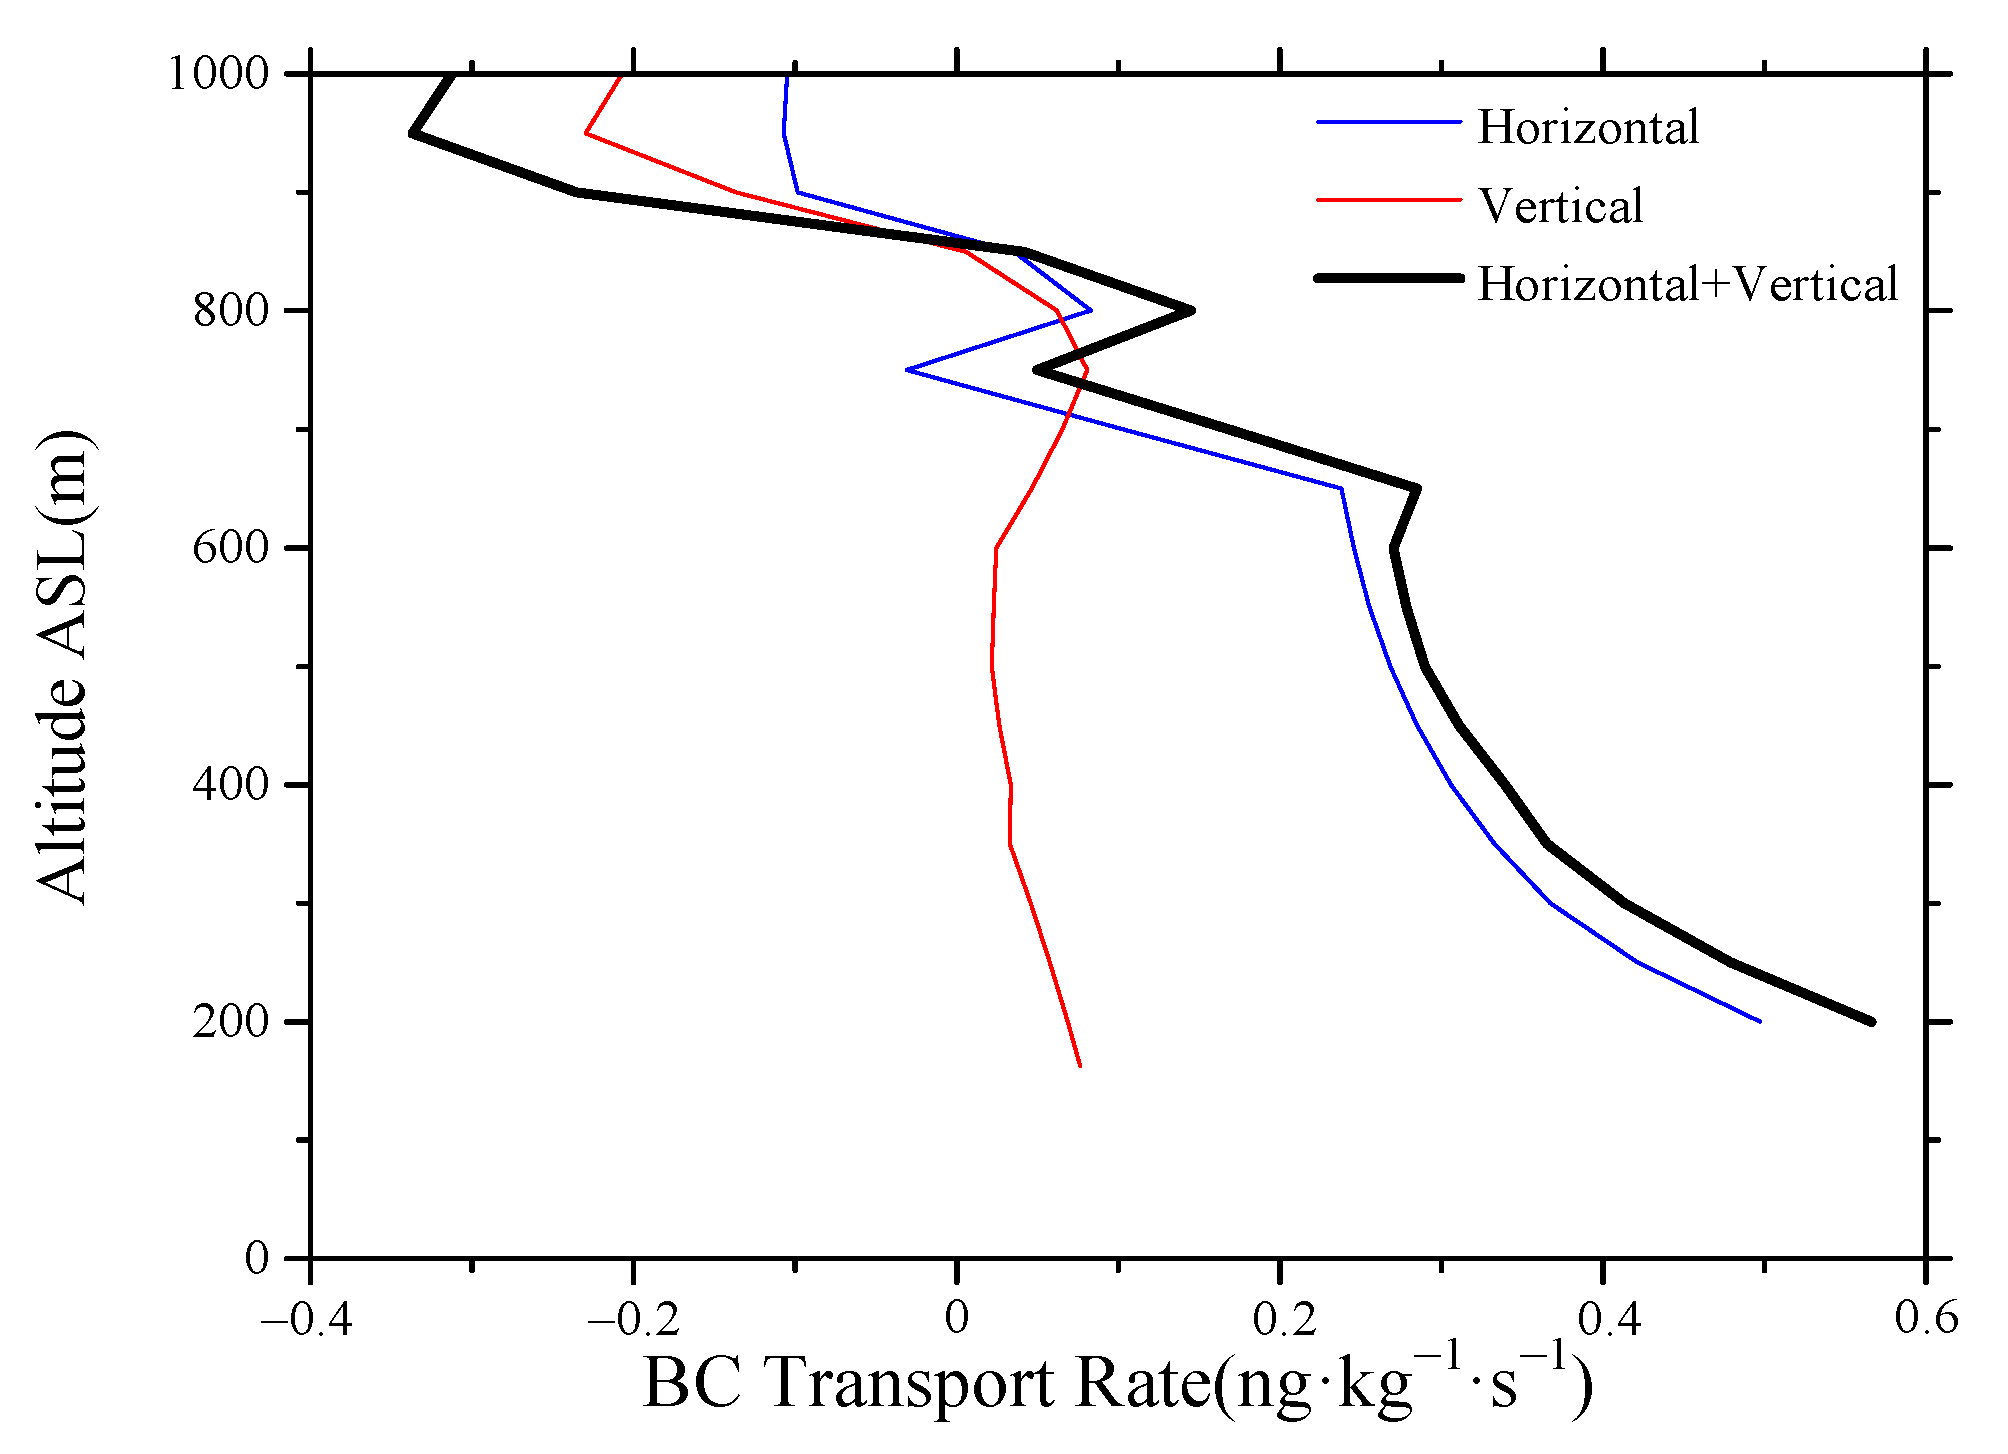
Figure 14 shows the simulated profiles of the horizontal advection transport rate, the vertical advection transport rate, and the total advection transport rate (which is the sum of the first two) of the BC concentration at grid point (97, 76) at 13:00. It can be seen that the simulated total advection transport rate was negative at altitudes above 850 m and positive at altitudes below 850 m. Except for certain altitudes, the simulated horizontal advection transport rate was greater than the vertical advection transport rate. The simulated total advection transport rate shows a peak at approximately 650 m and 800 m, but the simulated BC concentration only shows a peak at 800 m. This result could be related to the fact that the former has greater turbulent energy than the latter (Figure 13b). The simulation results of this case show that compared with the upper layer of the mixing layer, the turbulent energy in the lower and middle layers is larger, and there is no particularly prominent peak advection transport. Therefore, the simulation results do not show the peak value of BC concentrations at approximately 500 m.

3.3. Simulation Analysis of the Formation of the Elevated BC Concentration Layers Due to the Weak Upward Motion

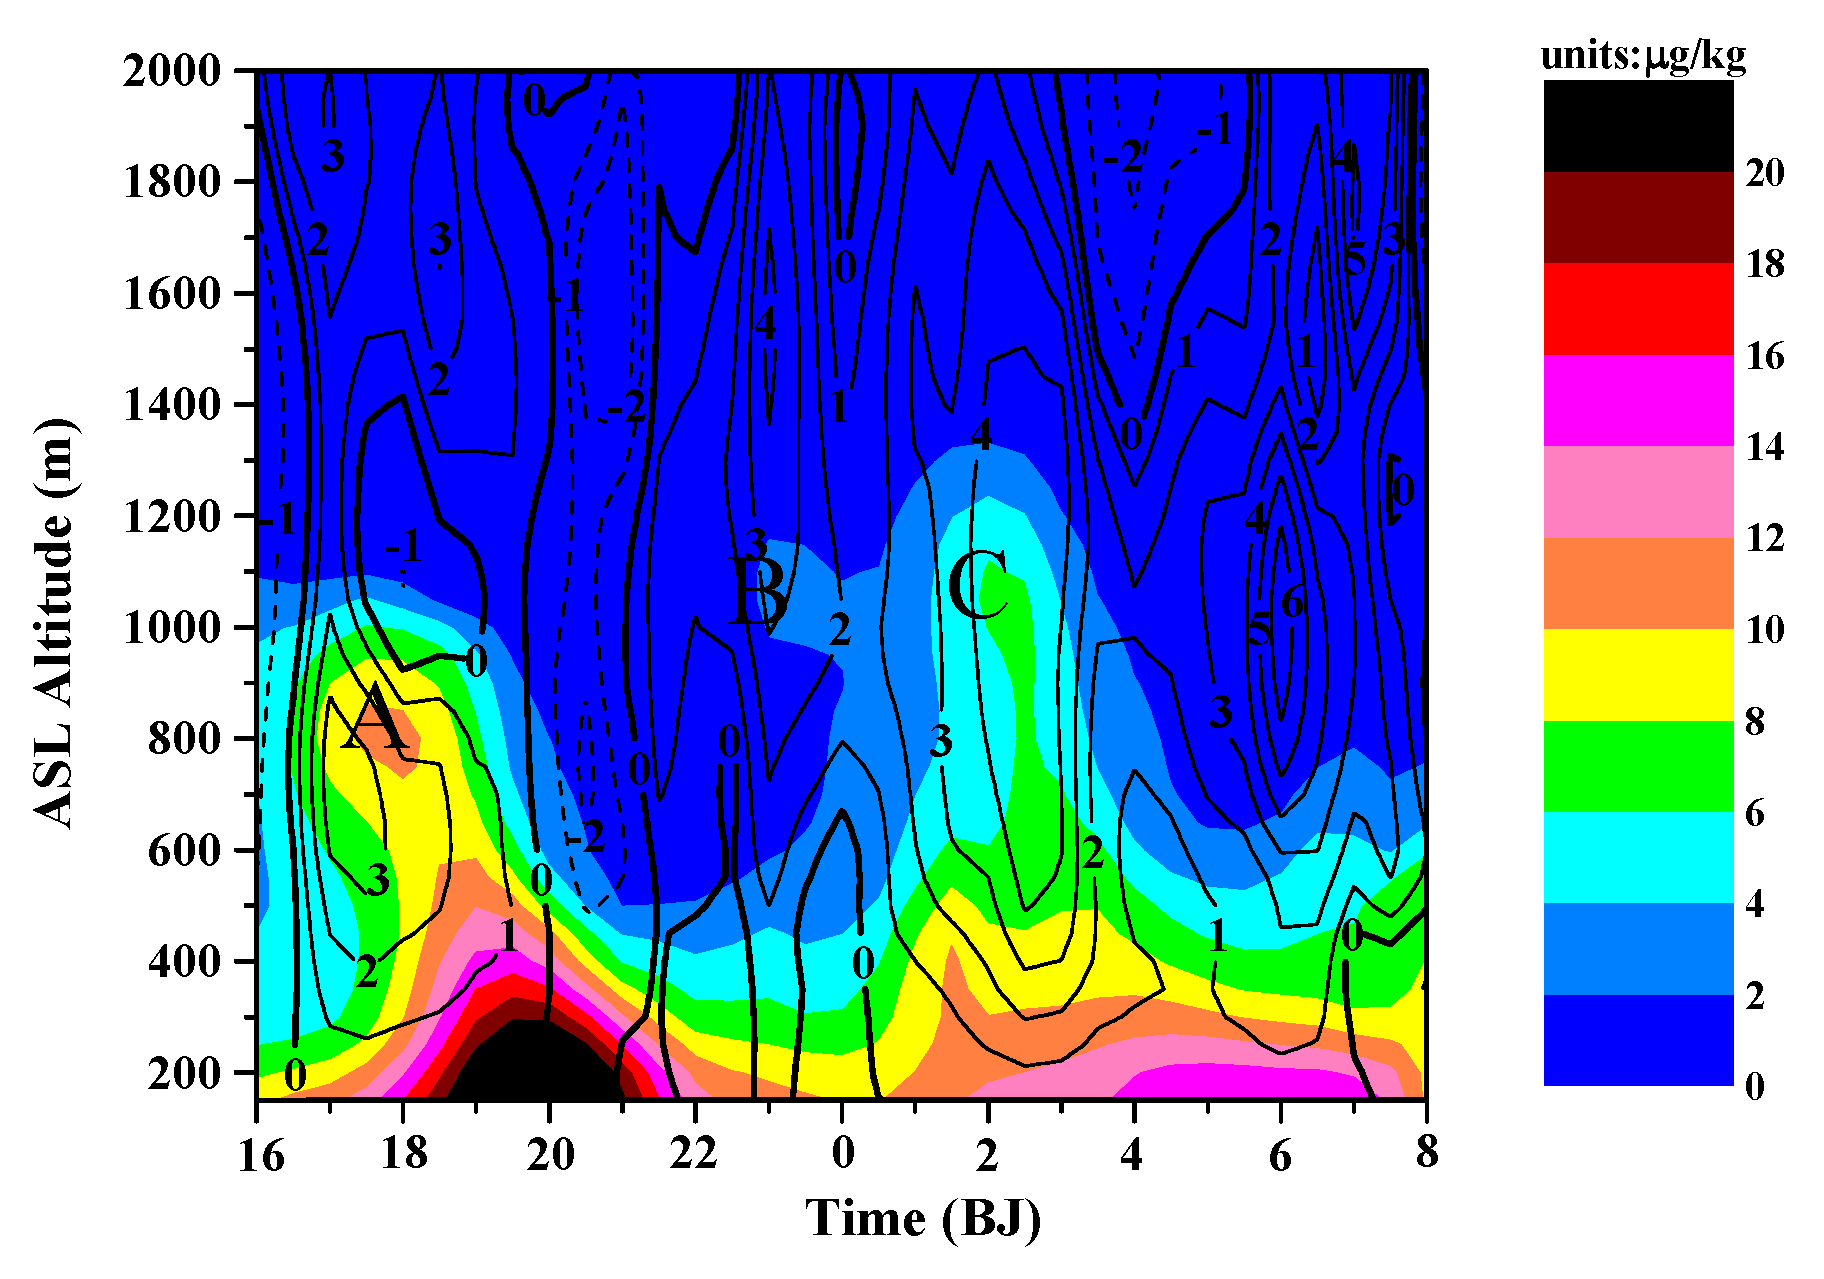
When we calculated the vertical advection rate above, we found that in the daytime numerical simulation results on 25 October, there was a weak vertical upward flow in the mixing layer (on the order of cm/s, figure not shown). However, it is not easy for the weak upward flow to form an elevated BC concentration layer in the mixing layer due to strong turbulence during the daytime. In the nighttime simulation results, weak vertical upward motions also occurred in the lower layer over Harbin and Daqing. How does the nighttime weak upward motion affect the formation of elevated BC concentration layers? Because the elevated BC concentration layer over Daqing (124.82° E–125.147° E, 46.71° N–46.88° N) is relatively obvious in the simulation results, we focus on the situation in this area. Figure 15 is the mean of the simulated values in this region. The shading is the BC concentration (units: μg/kg). The contours are the vertical velocity (units: cm/s), the solid contour lines represent positive values, and the dashed contour lines represent negative values. From the evening of 24 October to the morning of 25 October, an elevated BC concentration layer appeared three times below 2000 m: approximately from 17:00 to 18:30, a strong elevated BC concentration layer lasting for more than one hour appeared in the layer where the center is near 800 m, referred to as A; from 23:00 to 24:00 and from 2:00 to 2:30 weak elevated BC concentration layers appeared twice around approximately 1100 m, referred to as B and C, respectively. Figure 15 also shows that the three elevated BC concentration layers, A, B, and C were all accompanied with a weak vertical upward flow, but not all weak vertical upward flow areas corresponded to elevated BC concentration layers. Further, no elevated BC concentration layer appeared in downward flow areas.
From Equation (2), we can obtain
T R v = 1 ρ ( ρ b w ) z b w z w b z
That is, the vertical advection rate of the BC concentration can be approximately decomposed into the BC concentration term b w z and the vertical BC concentration gradient term w b z . Figure 16 is the simulated time-altitude diagram of the vertical advection transport rate, the BC concentration term b w z , and the vertical gradient term of the BC concentration w b z . It can be found that, despite the weak vertical flow, the two elevated BC concentration layers, A and C, corresponded to high values of the vertical advection transport rate of the BC concentration. That the convergence of the vertical upward flow just occurred at the altitude of the high BC concentration indicates that A was mainly caused by the BC concentration term b w z ; C was mainly caused by a combination of the vertical upward velocity and the vertical gradient of the BC concentration, that is, the vertical BC concentration gradient term w b z . From Figure 17, one can see that some convergence zones (such as zone D in Figure 17a) of the upward flow were too high in altitude, where the BC concentration was too low, and thus, no positive vertical advection transport rate occurred. Some strong upward flow zones showed no positive vertical advection transport rate of BC concentration because there was no corresponding large vertical BC concentration gradient, and thus, no elevated BC concentration layers occurred. None of the downward flows formed a positive vertical advection transport rate of BC concentration. Comparing Figure 16 and Figure 17, we can see that in the numerical simulation results of the case in this paper, the number of vertical flow convergence zones is greater than the number of elevated zones of the vertical advection transport rate of the BC concentration. Flow convergence in the high BC concentration areas facilitated the formation of elevated BC concentration layers. The analysis above also indicates that the proper combination of a weak vertical flow with the BC concentration or the vertical gradient of the BC concentration is also conducive to the formation of elevated BC concentration layers. Specifically, if the BC concentration in the convergence region of weak vertical upward flow is sufficiently large or the vertical gradient of the BC concentration at the center of weak vertical upward flow is sufficiently large, the conditions are conducive for the formation of elevated BC concentration layers.
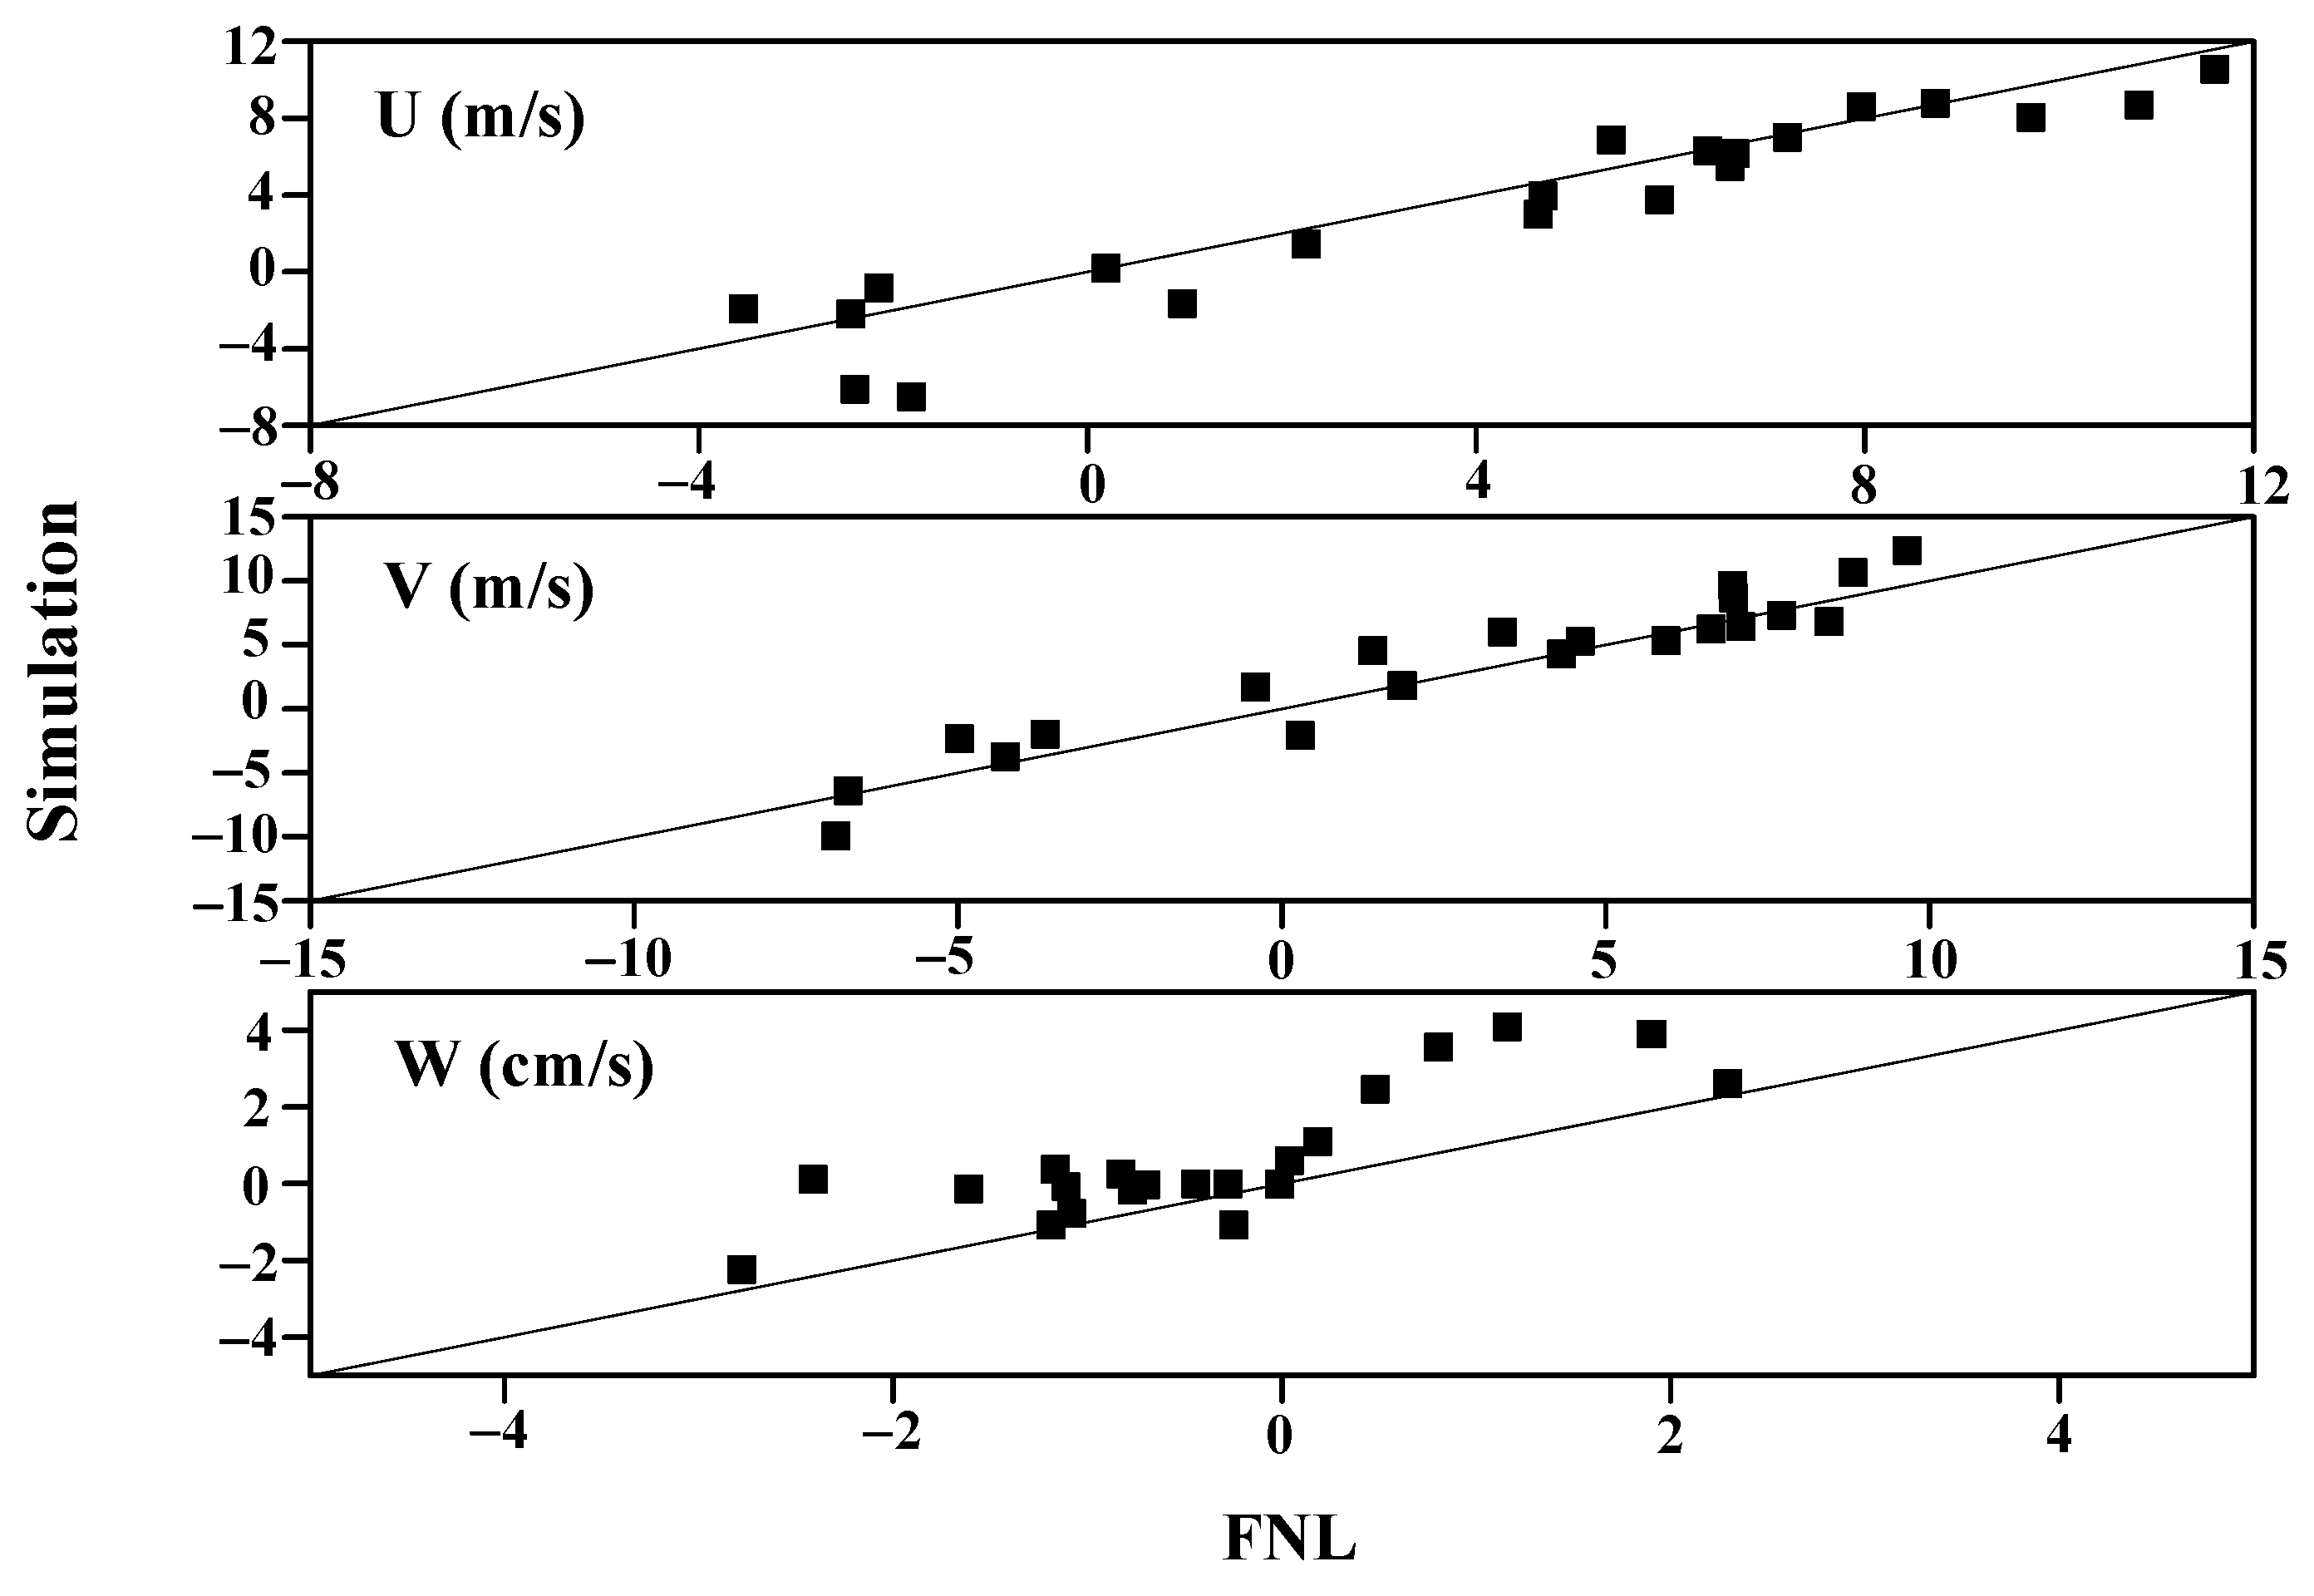
Notably, we just use the simulation results to calculate the above values, including the vertical advection transport rate and the divergence, in calculation, we use the simulated velocity and BC concentration. However, there are not any sounding data of BC and velocity to test the model results. We have to use FNL (six-hour global NCEP/NCAR reanalysis Final) data. As we know the FNL data cannot provide BC data, so we just consider velocity. The simulated velocity is compared to FNL data at 20:00 on October 24, 02:00 and 08:00 on October 25 over Daqing area at the pressure of 1000, 975, 950, 925, 900, 850, 800 hPa. Figure 18 shows the velocity scatter point of FNL versus simulation, in which U, V, W represents the east-west component of the wind, the south-north component of the wind, and vertical component of the wind, respectively. Figure 18 displays that the simulation matches the FNL well for U and V, but W is overestimated.

4. Conclusions

Using aircraft detection, elevated layers in the lower-middle part of the mixing layer were detected in Harbin on the afternoon of 25 October 2016. The vertical distribution of the BC concentration in the lower atmosphere over Harbin from 24 October to 25 October 2016 was numerically simulated using the WRF-Chem model version 3.8.1 based on the actual cases. The results show the following:
(1)
The numerical simulation results for the flight area on the afternoon of that day show that the turbulent energy in the lower and middle layers of the mixing layer is greater than that in the upper layers, and there is no particularly prominent peak of total advection transport in the lower and middle layers of the mixing layer. Therefore, in the lower and middle layers of the mixing layer, no elevated BC concentration layers appear, but constant BC concentration occurs. The numerical simulation shows that even though Ping Fang District in Harbin covers a horizontal area of only 10–20 km, in the early phase of the heating period, the horizontal variability of the BC concentration in the atmospheric mixing layer is sufficiently large. As a result, an elevated BC concentration layer is simulated when we conduct the point-by-point analysis along with one round of spiral flight, the same as the flight path on 25 October, however, it is a false elevated layer. The horizontal variability of the BC concentration in the mixing layer does not change with the altitude. Above the mixing layer, the root mean square decreases rapidly with the altitude. As the thickness of the mixing layer increases, the root mean square in the mixing layer decreases. Therefore, in the observation of the vertical distribution of the BC concentration, more special attention should be paid to the horizontal variability of the BC concentration for smaller thicknesses of the mixing layer to avoid observing false elevated BC concentration layers. In the planning of the flight path, a few rounds of spiral flights should be performed in the mixing layer.
(2)
The numerical simulation results also show that the weak vertical upward flow (on the order of cm/s) in the mixing layer during the daytime can hardly form elevated BC concentration layers due to strong turbulence in the mixing layer. However, during the nighttime, the proper combination of a weak vertical flow with the BC concentration or the vertical gradient of the BC concentration is conducive for the formation of elevated BC concentration layers. More specifically, if the BC concentration in the convergence region of weak vertical upward flow is sufficiently large or the vertical gradient of the BC concentration at the center of the weak vertical upward flow is sufficiently large, the conditions are conducive to the formation of elevated BC concentration layers. Because in the high BC emission areas, the BC concentration and the vertical gradient of the BC concentration in the lower layer of the atmosphere are large in all probability in the nighttime, the lower altitude of the weak vertical upward flow in the nighttime favors more the formation of elevated BC concentration layers.
However, the above conclusions are principally based on the simulation which has uncertainty. Many factors can significantly contribute to the uncertainty of the simulation of the vertical distribution of the BC concentration, for example, the emission inventories, scavenging process, the model resolution (both vertical resolution and horizontal resolution). Some papers conducted about the effect of the model resolution on the inference of the BC (or aerosol) vertical distribution. The results from Wang et al [49] showed that the influence of the vertical resolution on BC vertical distribution within PBL was obvious and the finer resolution in the upper PBL and near the ground improved the model performance. However, the climate model run by Allen and Landuyt [50] didn’t display that coarse vertical resolution leads to excessive BC aloft, which was speculated in the former researches. It is a little complicated for vertical resolution. For horizontal resolution, the influence only on the whole troposphere was paid attention to so far. The horizontal resolution affected the vertical distribution pattern of some aerosol species [51], and a finer horizontal resolution improved the model performance [52]. However, the studies on the effect of the horizontal resolution on the inference of BC vertical profile within PBL are limited, which should be done in the future.

Author Contributions

L.J. and B.Z. conceived the idea. L.J. wrote the manuscript and analyzed the results. L.L. performed the calculations, and data analysis. D.D. and D.Z. observed and collected the data. Q.Z. performed technical support on observation. Z.L. performed part of the data analysis. D.D. and B.Z. initiated discussions. All authors have read and agreed to the published version of the manuscript.

Funding

This research was funded by National Key Research and Development Program of China, grant number 2016YFA0602001 and 2016YFA0602003; This research was also funded by Natural Science Foundation of Liaoning province, grant number 2019-MS-199. The APC was funded by National Key Research and Development Program of China, grant number 2016YFA0602003.

Acknowledgments

This research was supported by the National Key Research and Development Program of China (2016YFA0602001, 2016YFA0602003) and the Natural Science Foundation of Liaoning province (2019-MS-199). The anthropogenic pollution sources were obtained from the Multi-resolution Emission Inventory for China (MEIC) of Tsinghua University. The data were implemented into the WRF-Chem model with the help of Tianliang Zhao’s group. Figure 2 of this study was produced with the help of Lei Zhang. We thank all of them here!

Conflicts of Interest

The authors declare no conflict of interest.

References

  1. Ferrero, L.; Cappelletti, D.; Busetto, M.; Mazzola, M.; Lupi, A.; Lanconelli, C.; Becagli, S.; Traversi, R.; Caiazzo, L.; Giardi, F.; et al. Vertical profiles of aerosol and black carbon in the Arctic: A seasonal phenomenology along 2 years (2011–2012) of field campaigns. Atmos. Chem. Phys. 2016, 16, 12601–12629. [Google Scholar] [CrossRef] [Green Version]
  2. Flanner, M.G. Arctic climate sensitivity to local black carbon. Geophys. Res. Lett. 2013, 118, 1840–1851. [Google Scholar] [CrossRef]
  3. Brock, C.A.; Cozic, J.; Bahreini, R.; Froyd, K.D.; Middlebrook, A.M.; McComiskey, A.; Brioude, J.; Cooper, O.R.; Stohl, A.; Aikin, K.C.; et al. Characteristics, sources, and transport of aerosols measured in spring 2008 during the aerosol, radiation, and cloud processes affecting Arctic Climate (ARCPAC) Project. Atmos. Chem. Phys. 2011, 11, 2423–2453. [Google Scholar] [CrossRef] [Green Version]
  4. Myhre, G.; Samset, B.H.; Schulz, M.; Balkanski, Y.; Bauer, S.; Berntsen, T.K.; Bian, H.; Bellouin, N.; Chin, M.; Diehl, T.; et al. Radiative forcing of the direct aerosol effect from AeroCom Phase II simulations. Atmos. Chem. Phys. 2013, 13, 1853–1877. [Google Scholar] [CrossRef] [Green Version]
  5. Schwarz, J.P.; Weinzierl, B.; Samset, B.H.; Dollner, M.; Heimerl, K.; Markovic, M.Z.; Perring, A.E.; Ziemba, L. Aircraft measurements of black carbon vertical profiles show upper tropospheric variability and stability. Geophys. Res. Lett. 2017, 44, 1132–1140. [Google Scholar] [CrossRef]
  6. Ding, A.J.; Huang, X.; Nie, W.; Sun, J.N.; Kerminen, V.M.; Petäjä, T.; Su, H.; Cheng, Y.F.; Yang, X.Q.; Wang, M.H.; et al. Enhanced haze pollution by black carbon in megacities in China. Geophys. Res. Lett. 2016, 43, 2873–2879. [Google Scholar] [CrossRef]
  7. Li, Z.; Guo, J.; Ding, A.; Liao, H.; Zhu, B. Aerosol and boundary-layer interactions and impact on air quality. Nat. Sci. Rev. 2017, 6. [Google Scholar] [CrossRef]
  8. Huang, X.; Wang, Z.; Ding, A. Impact of aerosol-PBL interaction on haze pollution: Multiyear observational evidences in North China. Geophys. Res. Lett. 2018, 45, 8596–8603. [Google Scholar] [CrossRef] [Green Version]
  9. Chow, J.C.; Watson, J.G.; Lowenthal, D.H.; Chen, L.W.; Motallebi, N. PM2.5 source profiles for black and organic carbon emission inventories. Atmos. Environ. 2011, 45, 5407–5414. [Google Scholar] [CrossRef]
  10. Liu, Y.; Yan, C.; Zheng, M. Source apportionment of black carbon during winter in Beijing. Sci. Total Environ. 2018, 618, 531–541. [Google Scholar] [CrossRef]
  11. Wang, Z.L.; Huang, X.; Ding, A.J. Dome effect of black carbon and its key influencing factors: A one-dimensional modelling study. Atmos. Chem. Phys. 2018, 18, 2821–2834. [Google Scholar] [CrossRef] [Green Version]
  12. Trompetter, W.J.; Grange, S.K.; Davy, P.K.; Ancelet, T. Vertical and temporal variations of black carbon in New Zealand urban areas during winter. Atmos. Environ. 2013, 75, 179–187. [Google Scholar] [CrossRef]
  13. Ferrero, L.; Castelli, M.; Ferrini, B.; Moscatelli, M.; Perrone, M.; Sangiorgi, G.; D’Angelo, L.; Rovelli, G.; Moroni, B.; Scardazza, F.; et al. Impact of black carbon aerosol over Italian basin valleys: High resolution measurements along vertical profiles, radiative forcing and heating rate. Atmos. Chem. Phys. 2014, 14, 541–591. [Google Scholar] [CrossRef]
  14. Li, J.; Fu, Q.; Huo, J.; Wang, D.; Yang, W.; Bian, Q.; Duan, Y.; Zhang, Y.; Pan, J.; Lin, Y.; et al. Tethered balloon-based black carbon profiles within the lower troposphere of Shanghai in the 2013 East China smog. Atmos. Environ. 2015, 123, 327–338. [Google Scholar] [CrossRef]
  15. Bisht, D.S.; Tiwari, S.; Dumka, U.C.; Srivastava, A.K.; Safai, P.D.; Ghude, S.D.; Chate, D.M.; Rao, P.S.P.; Ali, K.; Prabhakaran, T.; et al. Tethered balloon-borne and ground-based measurements of black carbon and particulate profiles within the lower troposphere during the foggy period in Delhi, India. Sci. Total Environ. 2016, 573, 894–905. [Google Scholar] [CrossRef] [PubMed]
  16. Ran, L.; Deng, Z.; Xu, X.; Peng, Y.; Lin, W.; Wang, Y.; Tian, P.; Wang, P.; Pan, W.; Lu, D. Vertical profiles of black carbon measured by a micro-aethalometer in summer in the North China Plain. Atmos. Chem. Phys. 2016, 16, 10441–10454. [Google Scholar] [CrossRef] [Green Version]
  17. Chilinski, M.T.; Markowicz, K.M.; Markowicz, J. Observation of vertical variability of black carbon concentration in lower troposphere on campaigns in Poland. Atmos. Environ. 2016, 137, 155–170. [Google Scholar] [CrossRef]
  18. Spackman, J.R.; Gao, R.S.; Neff, W.D.; Schwarz, J.P.; Watts, L.A.; Fahey, D.W.; Holloway, J.S.; Ryerson, T.B.; Peischl, J.; Brock, C.A. Aircraft observations of enhancement and depletion of black carbonmass in the springtime Arctic. Atmos. Chem. Phys. 2010, 10, 9667–9680. [Google Scholar] [CrossRef] [Green Version]
  19. Spackman, J.R.; Gao, R.; Schwarz, J.P.; Watts, L.A.; Fahey, D.W.; Pfister, L.; Bui, T.P. Seasonal variability of black carbon mass in the tropical tropopause layer. Geophys. Res. Lett. 2011, 38, L09803. [Google Scholar] [CrossRef]
  20. Schwarz, J.P.; Spackman, J.R.; Gao, R.S.; Watts, L.A.; Stier, P.; Schulz, M.; Davis, S.M.; Wofsy, S.C.; Fahey, D.W. Global-scale black carbon profiles observed in the remote atmosphere and compared to models. Geophys. Res. Lett. 2010, 37, L18812. [Google Scholar] [CrossRef] [Green Version]
  21. McMeeking, G.R.; Hamburger, T.; Liu, D.; Flynn, M.; Morgan, W.T.; Northway, M.; Highwood, E.J.; Krejci, R.; Allan, J.D.; Minikin, A.; et al. Black carbon measurements in the boundary layer over western and northern Europe. Atmos. Chem. Phys. 2010, 10, 9393–9414. [Google Scholar] [CrossRef] [Green Version]
  22. Safai, P.D.; Raju, M.P.; Maheshkumar, R.S.; Kulkarni, J.R.; Rao, P.S.P.; Devaral, P.C.S. Vertical profiles of black carbon aerosols over the urban locations in South India. Sci. Total Environ. 2012, 431, 323–331. [Google Scholar] [CrossRef] [PubMed]
  23. Rahul, P.R.C.; Bhawar, R.L.; Ayantika, D.C.; Panicker, A.S.; Safai, P.D.; Tharaprabhakaran, V.; Padmakumari, B.; Raju, M.P. Double blanket effect caused by two layers of black carbon aerosols escalates warming in the Brahmaputra River Valley. Sci. Rep. 2014, 4, 3670. [Google Scholar] [CrossRef] [PubMed] [Green Version]
  24. Zhao, D.; Tie, X.; Gao, Y.; Zhang, Q.; Tian, H.; Bi, K.; Jin, Y.; Chen, P. In-Situ Aircraft Measurements of the Vertical Distribution of Black Carbon in the Lower Troposphere of Beijing, China, in the Spring and Summer Time. Atmosphere 2015, 6, 713–731. [Google Scholar] [CrossRef] [Green Version]
  25. Zhao, D.; Huang, M.; Liu, D.; Ding, D.; Tian, P.; Liu, Q.; Zhou, W.; Sheng, J.; Wang, F.; Bi, K.; et al. Aircraft measurements of black carbon in the boundary layer over the north china plain. Atmos. Chem. Phys. Discuss. 2018, 1–25. [Google Scholar] [CrossRef] [Green Version]
  26. Schwarz, J.P.; Samset, B.H.; Perring, A.E.; Spackman, J.R.; Gao, R.S.; Stier, P.; Schultz, M.G.; Moore, F.L.; Ray, E.A.; Fahey, D.W. Global-scale seasonally resolved black carbon vertical profiles over the Pacific. Geophys. Res. Lett. 2013, 40, 5542–5547. [Google Scholar] [CrossRef] [Green Version]
  27. Zhao, D.; Liu, D.; Yu, C.; Tian, P.; Hu, D.; Zhou, W.; Ding, S.; Hu, K.; Sun, Z.; Huang, M.; et al. Vertical evolution of black carbon characteristics and heating rate during a haze event in Beijing winter. Sci. Total Environ. 2019. [Google Scholar] [CrossRef]
  28. Zhao, D.; Huang, M.; Tian, P.; He, H.; Lowe, D.; Zhou, W.; Sheng, J.; Wang, F.; Bi, K.; Kong, S.; et al. Vertical characteristics of black carbon physical properties over Beijing region in warm and cold seasons. Atmos. Environ. 2019, 213, 296–310. [Google Scholar] [CrossRef]
  29. Ding, A.J.; Wang, T.; Xue, L.K.; Gao, J.; Stohl, A.; Lei, H.C.; Jin, D.Z.; Ren, Y.; Wang, X.Z.; Wei, X.L.; et al. Transport of north China air pollution by midlatitude cyclones: Case study of aircraft measurements in summer. Geophys. Res. Lett. 2009, 114, D08304. [Google Scholar] [CrossRef] [Green Version]
  30. Zhang, Q.; Ma, X.; Tie, X.; Huang, M.; Zhao, C. Vertical distributions of aerosols under different weather conditions: Analysis of in-situ aircraft measurements in Beijing, China. Atmos. Environ. 2009, 43, 5526–5535. [Google Scholar] [CrossRef]
  31. He, K. Multi-resolution Emission Inventory for China (MEIC): Model framework and 1990–2010 anthropogenic emissions. In Proceedings of the AGU Fall Meeting Abstracts, San Francisco, CA, USA, 3–7 December 2012. [Google Scholar]
  32. Schwarz, J.; Gao, R.; Fahey, D.; Thomson, D.; Watts, L.; Wilson, J.; Reeves, J.; Darbeheshti, M.; Baumgardner, D.; Kok, G. Single particle measurements of midlatitude black carbon and light-scattering aerosols from the boundary layer to the lower stratosphere. J. Geophys. Res. Atmos. 2006, 111, D16207. [Google Scholar] [CrossRef]
  33. Grell, G.; Peckham, S.; Schmitz, R.; McKeen, S.; Frost, G.; Skamarock, W.; Eder, B. Fully coupled “online” chemistry within the WRF model. Atmos. Environ. 2005, 39, 6957–6976. [Google Scholar]
  34. Emmons, L.K.; Walters, S.; Hess, P.G.; Lamarque, J.F.; Pfister, G.G.; Fillmore, D.; Granier, C.; Guenther, A.; Kinnison, D.; Laepple, T.; et al. Description and evaluation of the Model for Ozone and Related chemical Tracers, version 4 (MOZART-4). Geosci. Model Dev. 2010, 3, 43–67. [Google Scholar] [CrossRef] [Green Version]
  35. Lin, Y.L.; Farley, R.D.; Orville, H.D. Bulk Parameterization of the Snow Field in a Cloud Model. J. Clim. Appl. Meteorol. 1983, 22, 1065–1092. [Google Scholar] [CrossRef] [Green Version]
  36. Grell, G.A.; Freitas, S.R. A scale and aerosol aware stochastic convective parameterization for weather and air quality modeling. Atmos. Chem. Phys. 2014, 14, 5233–5250. [Google Scholar] [CrossRef] [Green Version]
  37. Iacono, M.J.; Delamere, J.S.; Mlawer, E.J.; Shephard, M.W.; Clough, S.A.; Collins, W.D. Radiative forcing by long-lived greenhouse gases: Calculations with the AER radiative transfer models. J. Geophys. Res. Atmos. 2008, 113. [Google Scholar] [CrossRef]
  38. Tastula, E.M.; LeMone, M.A.; Dudhia, J.; Galperin, B. The impact of the QNSE-EDMF scheme and its modifications on boundary layer parameterization in WRF: Modelling of CASES-97. Q. J. R. Meteorol. Soc. 2016, 142, 1182–1195. [Google Scholar] [CrossRef]
  39. Tewari, M.; Chen, F.; Wang, W.; Dudhia, J.; LeMone, M.A.; Mitchell, K.; Ek, M.; Gayno, G.; Wegiel, J.; Cuenca, R.H. Implementation and verification of the unified Noah land-surface model in the WRF model. In Conference on Weather Analysis & Forecasting/Conference on Numerical Weather Prediction; American Meteorological Society: Seattle, WA, USA, 2004. [Google Scholar]
  40. Wild, O.; Zhu, X.; Prather, M.J. Fast-J: Accurate simulation of in-and below-cloud photolysis in tropospheric chemical models. J. Atmos. Chem. 2000, 37, 245–282. [Google Scholar] [CrossRef]
  41. Wesely, M.L. Parameterization of surface resistances to gaseous dry deposition in regional-scale numerical models. Atmos. Environ. 2007, 41 (Suppl. S), 52–63. [Google Scholar] [CrossRef]
  42. Wesely, M.L.; Hicks, B.B. A review of the current status of knowledge on dry deposition. Atmos. Environ. 2000, 34, 2261–2282. [Google Scholar] [CrossRef]
  43. Zaveri, R.A.; Peters, L.K. A new lumped structure photochemical mechanism for large-scale applications. J. Geophys. Res. Atmos. 1999, 104, 30387–30415. [Google Scholar] [CrossRef]
  44. Zaveri, R.A.; Easter, R.C.; Fast, J.D.; Peters, L.K. Model for Simulating Aerosol Interactions and Chemistry (MOSAIC). J. Geophys. Res. Atmos. 2008, 113. [Google Scholar] [CrossRef]
  45. Guenther, A.; Karl, T.; Harley, P.; Wiedinmyer, C.; Palmer, P.I.; Geron, C. Estimates of global terrestrial isoprene emissions using MEGAN (Model of Emissions of Gases and Aerosols from Nature). Atmos. Chem. Phys. 2006, 6, 3181–3210. [Google Scholar] [CrossRef] [Green Version]
  46. Wiedinmyer, C.; Akagi, S.K.; Yokelson, R.J.; Emmons, L.K.; Al-Saadi, J.A.; Orlando, J.J.; Soja, A.J. The Fire Inventory from NCAR (FINN): A high resolution global model to estimate the emissions from open burning. Geosci. Model Dev. 2010, 3, 2439–2476. [Google Scholar] [CrossRef] [Green Version]
  47. Kipling, Z.; Stier, P.; Schwarz, J.P.; Perring, A.E.; Spackman, J.R.; Mann, G.W.; Johnson, C.E.; Telford, P.J. Constraints on aerosol processes in climate models from vertically-resolved aircraft observations of black carbon. Atmos. Chem. Phys. 2013, 13, 5969–5986. [Google Scholar] [CrossRef] [Green Version]
  48. Liu, M.; Peng, X.; Meng, Z.; Zhou, T.; Long, L.; She, Q. Spatial characteristics and determinants of in-traffic black carbon in Shanghai, China: Combination of mobile monitoring and land use regression model. Sci. Total Environ. 2019, 658, 51–61. [Google Scholar] [CrossRef] [PubMed]
  49. Wang, Z.L.; Huang, X.; Ding, A.J. Optimization of vertical grid setting for air quality modelling in China considering the effect of aerosol-boundary layer interaction. Atmos. Environ. 2019, 210, 1–13. [Google Scholar] [CrossRef]
  50. Allen, R.J.; Landuyt, W. The vertical distribution of black carbon in CMIP5 models: Comparison to observations and the importance of convective transport. J. Geophys. Res. Atmos. 2014, 119, 4808–4835. [Google Scholar] [CrossRef]
  51. Saji, V.; Baerbel, L.; Darius, C.; Colin, D.; O’Dowd, C.D. Effect of horizontal resolution on meteorology and air-quality prediction with a regional scale model. Atmos. Res. 2011, 101, 574–594. [Google Scholar]
  52. Raut, J.C.; Marelle, L.; Fast, J.D.; Thomas, J.L.; Weinzierl, B.; Law, K.S.; Berg, L.K.; Roiger, A.; Easter, R.C.; Heimerl, K.; et al. Cross-polar transport and scavenging of Siberian aerosols containing black carbon during the 2012 ACCESS summer campaign. Atmos. Chem. Phys. 2017, 17, 10969–10995. [Google Scholar] [CrossRef] [Green Version]
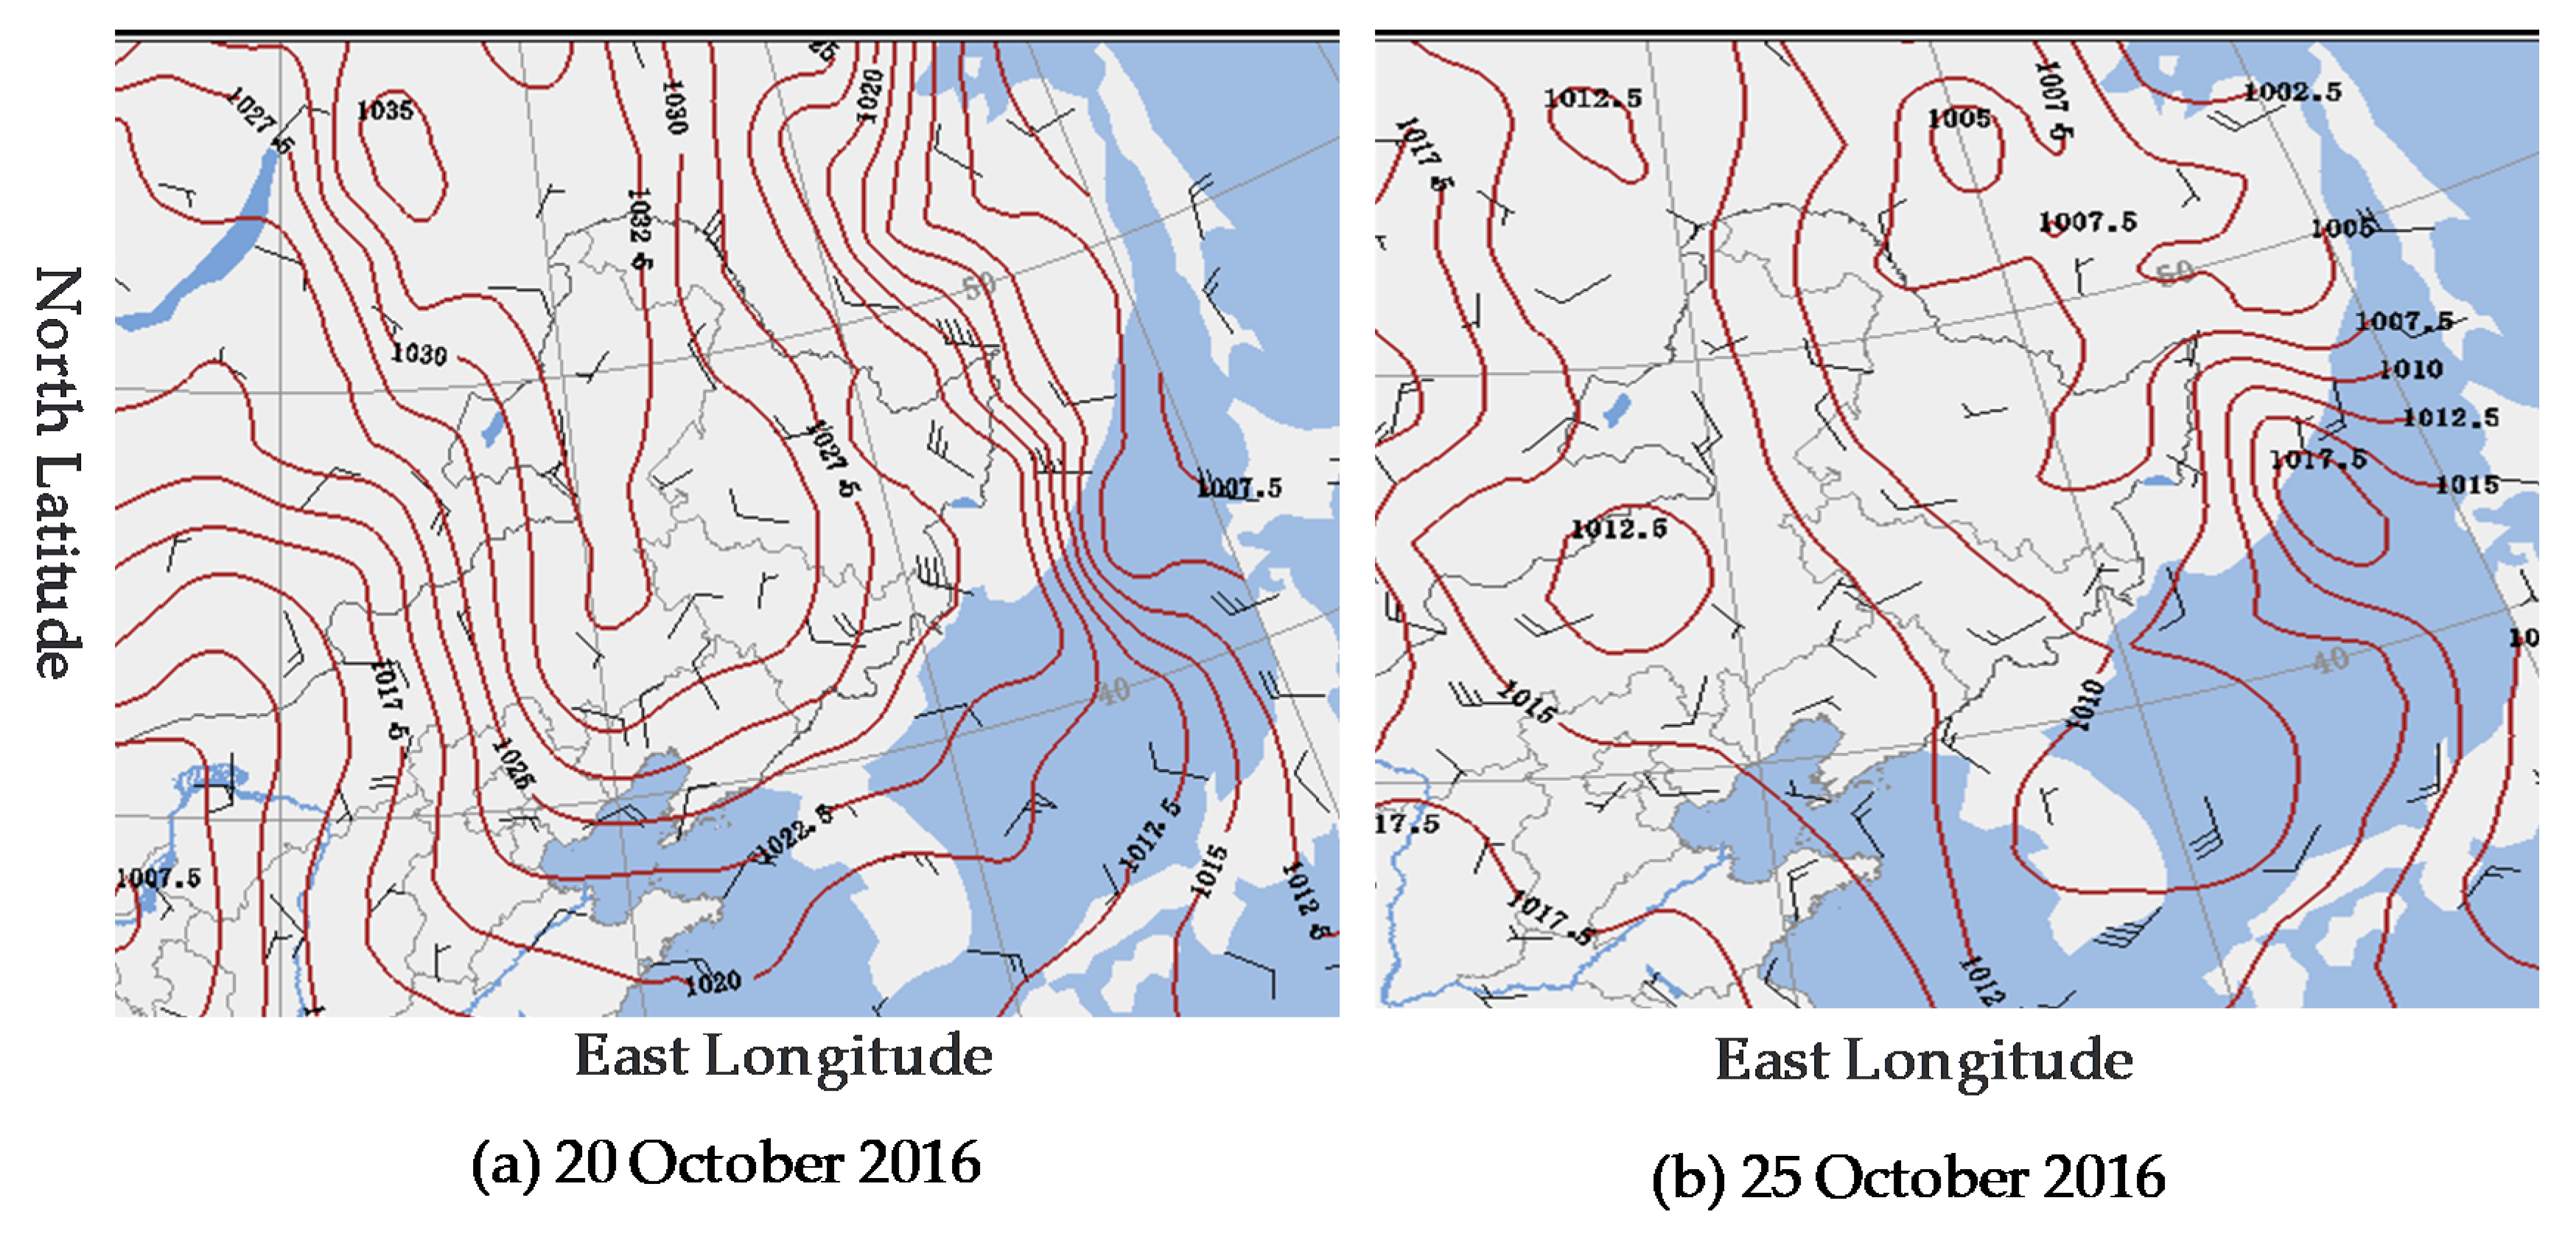
Figure 1. Sea level pressure at 11:00 (hereafter Beijing time). (a) 20 October 2016; (b) 25 October 2016
Atmosphere 11 00481 g001
Figure 2. Distribution of black carbon aerosol mass emitted in October 2012 in northeastern China and Inner Mongolia (Unit: ton per month per 0.25 × 0.25 cell).
Atmosphere 11 00481 g002
Figure 3. The flight path during the descent phase on 20 October 2016. (a) Three-dimensional flight path; (b) Time-altitude diagram.
Atmosphere 11 00481 g003
Figure 4. The flight path during the descent phase on 25 October 2016. (a) Three-dimensional flight path; (b) Time-altitude diagram.
Atmosphere 11 00481 g004
Figure 5. Potential temperature (black solid line) and black carbon aerosol (BC) mass concentration (purple solid squares) detected by the two flights in October 2016: (a) 20 October 2016; (b) 25 October 2016.
Atmosphere 11 00481 g005
Figure 6. The 72-h backward trajectory and satellite fire spots. (a) Horizontal and vertical section of the 72-h backward trajectory (black line represents the topography); (b) combined view of the 72-h backward trajectory and three-day satellite fire spots from 23 October to 25 October.
Atmosphere 11 00481 g006
Figure 7. The FNL horizontal wind speed at 14:00 on the vertical section near the projected point of the backward trajectory of the last 13 h (the black thick line is the backward trajectory. The red dots and black thin line are the projection of the trajectory on the xOy plane. The black star is the starting point of the trajectory).
Atmosphere 11 00481 g007
Figure 8. Simulated BC concentration at points along the flight path at 13:00 on 25 October.
Atmosphere 11 00481 g008
Figure 9. Position of the flight area (area in the black rectangular box) and the six grid points (colored circles. The grid points are named with a pair of numbers in the simulated area. The two numbers represent the position in the west-east and south-north directions, respectively.).
Atmosphere 11 00481 g009
Figure 10. Simulated BC concentration profiles at the six grid points in the flight area (as shown in Figure 9) at 13:00 on 25 October and the mean of the six profiles.
Atmosphere 11 00481 g010
Figure 11. Distribution diagram of the ground emission rate of black carbon aerosol in October 2012 (the rectangle box is the flight area, and the color of the six colored points is consistent with Figure 9).
Atmosphere 11 00481 g011
Figure 12. Simulation results of the root mean square (shading, unit: μg/kg) and the ratio of the maximum to the minimum (shading) BC concentration at the six grid points. The white contours represent the potential temperature (unit: K). (a) Root mean square; (b) Ratio of the maximum to the minimum
Atmosphere 11 00481 g012
Figure 13. Simulated time-altitude diagram of the BC concentration (shading, unit: μg/kg), potential temperature (white contour, unit: K), and TKE (black contour, unit: m−1 s−1) at grid point (97, 76). (a) BC concentration and potential temperature; (b) BC concentration and TKE.
Atmosphere 11 00481 g013
Figure 14. Simulation results of the BC advection transport rate at grid point (97, 76) at 13:00.
Atmosphere 11 00481 g014
Figure 15. Time-altitude diagram of the simulated BC concentration (shading, unit: μg/kg) and vertical velocity (black contours. Solid contour lines represent positive values, and dashed contour lines represent negative values, unit: cm/s.) over Daqing from the evening of 24 October to the morning of 25 October.
Atmosphere 11 00481 g015
Figure 16. Time-altitude diagram of the simulated vertical advection transport rate and its components over Daqing from the evening of 24 October to the morning of 25 October. (a) Vertical advection transport rate; (b) BC concentration term; (c) Vertical gradient term of BC.
Atmosphere 11 00481 g016
Figure 17. Time-altitude diagram of the simulated divergence from the evening of 24 October to the morning of 25 October. (a) Total divergence; (b) Horizontal divergence; (c) Vertical divergence.
Atmosphere 11 00481 g017
Figure 18. Velocity scatter plot of the simulation versus the FNL (The line y = x is also plotted).
Atmosphere 11 00481 g018
Table 1. Physical and chemical process parameterization schemes selected in this study.
ProcessesSelected Schemes
Cloud microphysicsLin
Cumulus convection Grell–Freitas ensemble
Long-wave radiation RRTMG
Short-wave radiation RRTMG
Boundary layer QNSE–EDMF
Land-surface unified Noah
Photolysis Fast-J
Dry depositionWesely
Gas-phase chemical CBM-Z
Aerosol mechanismMOSAIC