1. Introduction
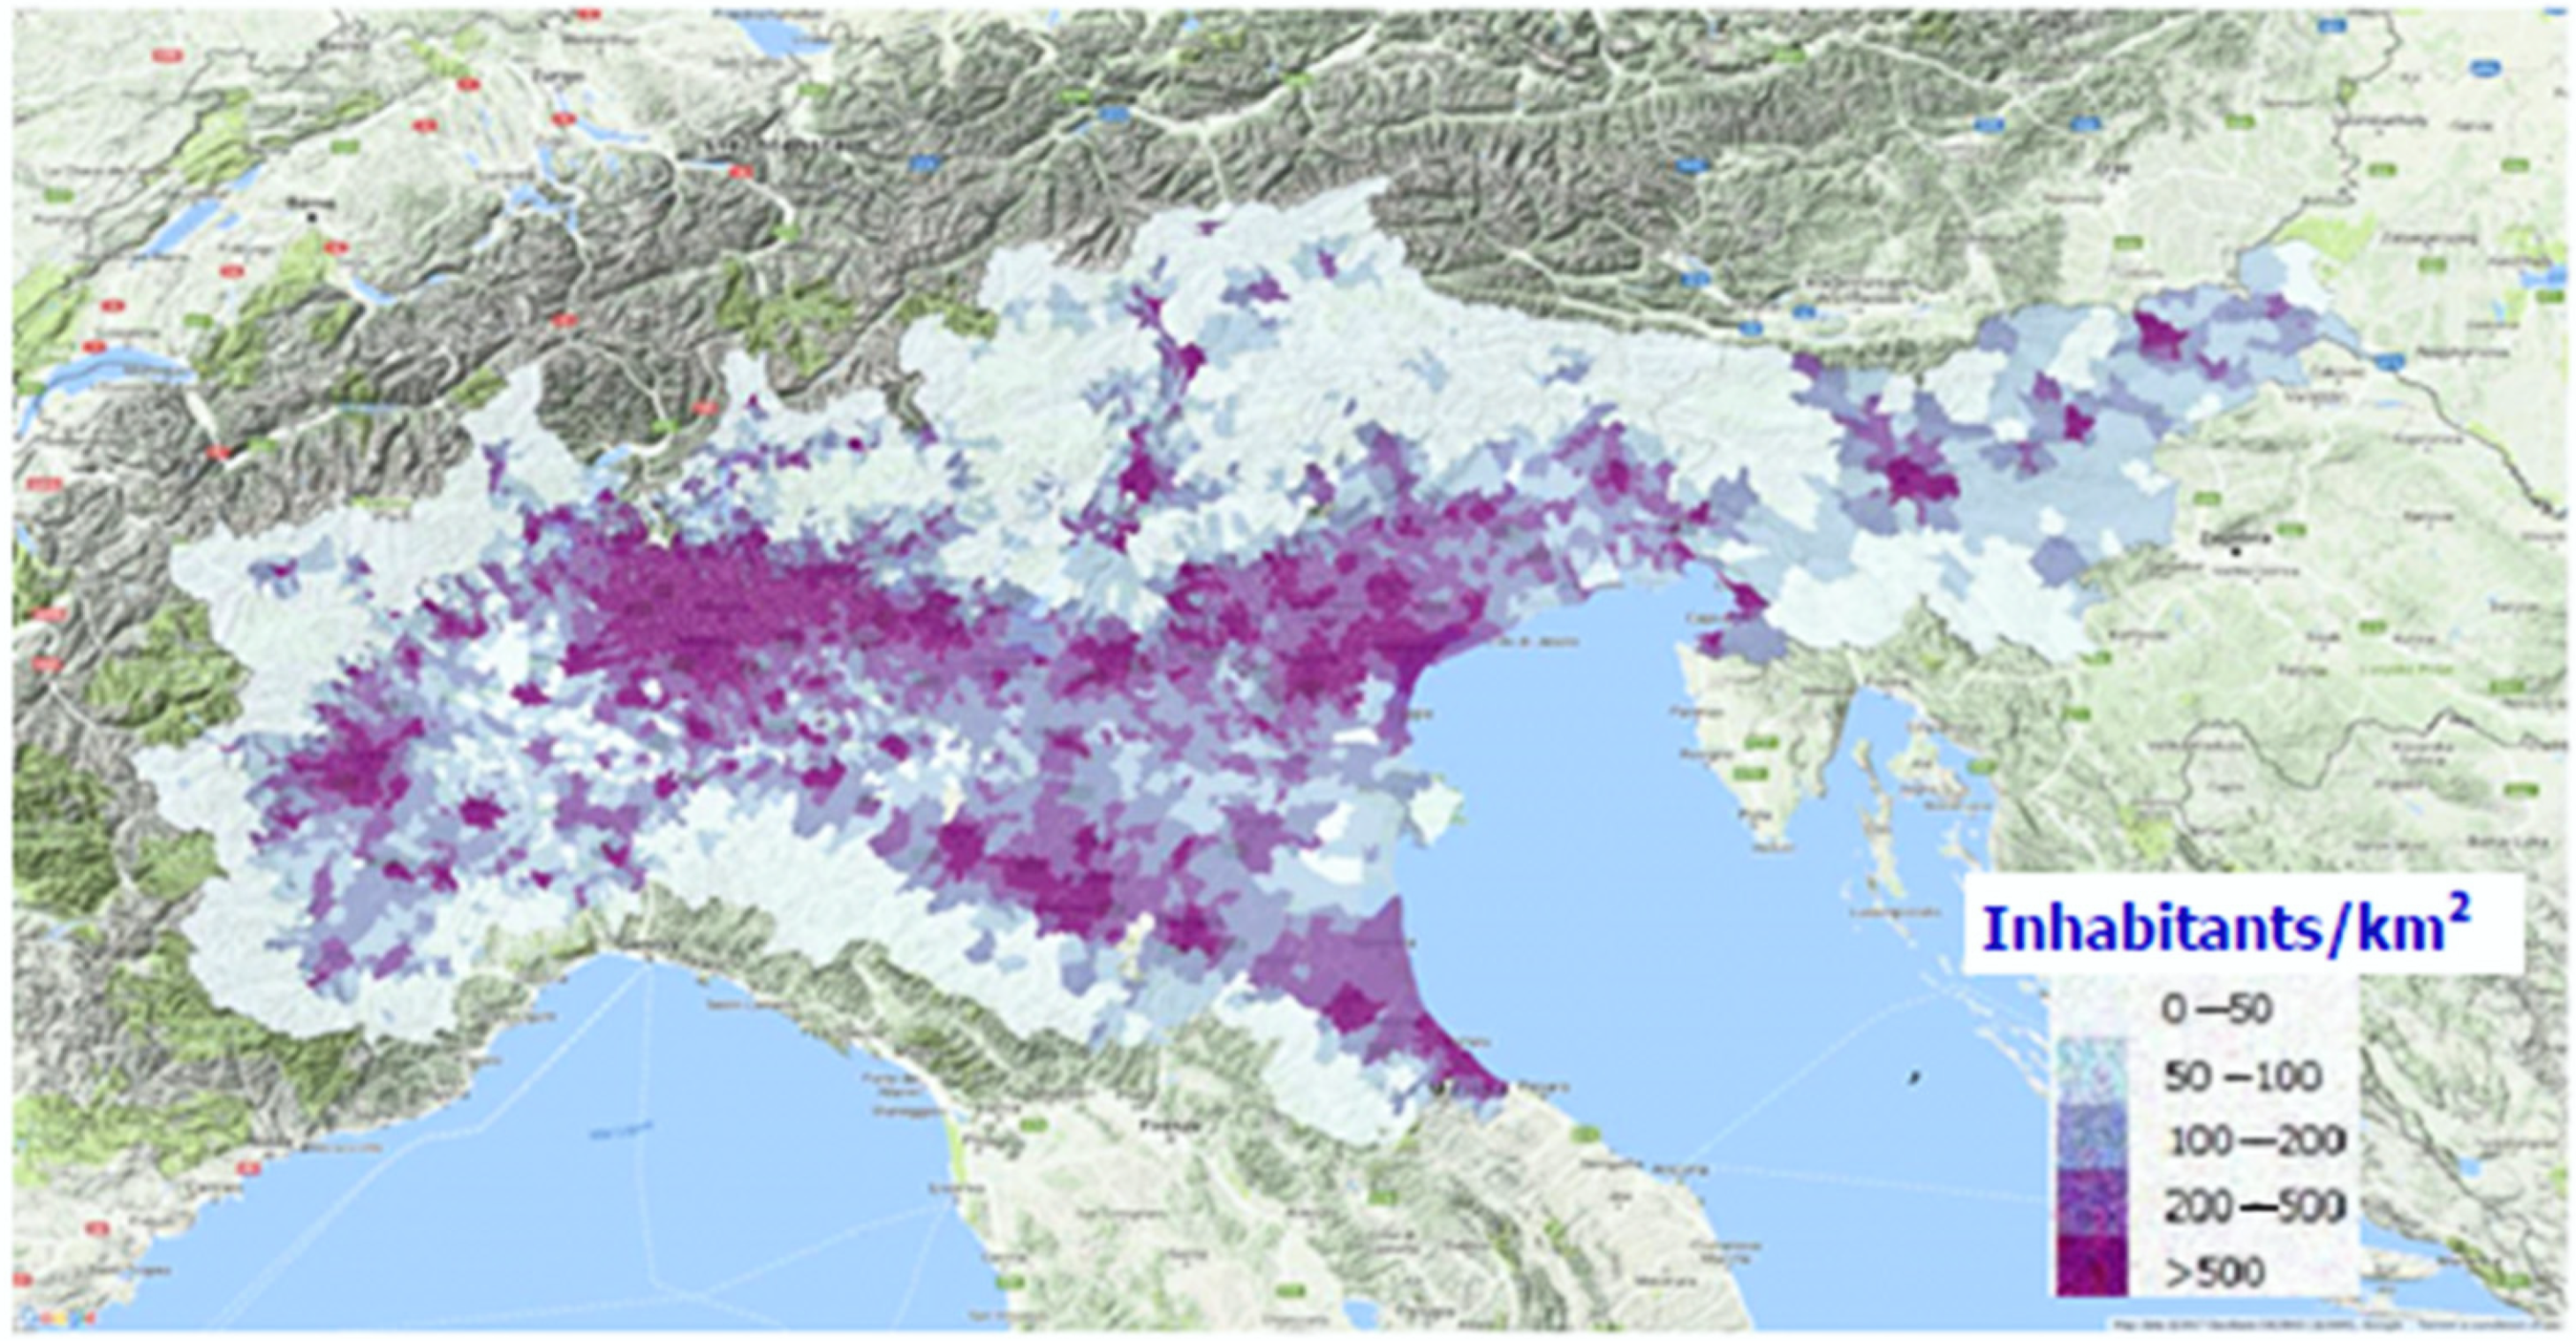
The Po Valley represents a non-attaining zone for PM (particulate matter), NO2 (nitrogen dioxide) and O3 (ozone), thus the need of enforcing the respect of the EU air quality limit values. This zone covers the territory of several regions in Northern Italy and includes many urban agglomerates, such as Milan, Turin, Venice and Bologna. The area is densely populated and heavily industrialized. About 400.000 tons of NOx, 80.000 tons of PM, 250.000 tons of NH3 (ammonia) and only 50.000 of SO2 are emitted per year, into the atmosphere, by a wide variety of pollution sources, which are mainly related to traffic, domestic heating, industry and energy production, agriculture and farming activities.
Meteorological conditions and the resulting efficiency of the transport and dispersion of pollutants are strongly influenced by the morphological characteristics of the Po Valley and the Northern Adriatic Basin. The transport of pollutants, of the main drivers of ozone and of secondary particulate, are limited by the Alps, the Apennines and the Dinaric Alps. Due to both the dominating meteorological conditions and the morphologic characteristics of the Po valley, pollutants’ background concentrations are often high, with a large part of the particulate matter being due to secondary production.
Although all the regions in the Po Valley have been implementing air-quality plans over the last decades, such plans turned out not to be fully effective in achieving a sufficient reduction of PM, NO2 and O3 concentration levels below the EU limit values. Previous experience demonstrates that coordinated and large-scale actions are necessary in this area. A comprehensive policy, acting on a large scale and on several sources of pollutant precursors of PM and O3, is essential in order to further reduce pollution levels. In order to reduce such levels of air pollution, all the regions have clustered in the so-called Po Basin Board and planned actions, with the aim of further reducing the emission of pollutants and their precursors. The need for implementing such coordinated actions led the National and Regional governments to sign a first agreement, in December 2013, aimed at developing and coordinating short- and long-term measures for improving the air quality of the Po Valley. This first Po Valley Agreement identifies the main sectors where actions are needed: biomass burning, transportation of goods and passengers, domestic heating, industry and energy, and agriculture. In 2017 a second Agreement was signed among the four Regions Emilia-Romagna, Lombardy, Piedmont and Veneto, for the implementation of further measures in the field of biomass burning, circulation of diesel vehicles and use of fertilizers in agriculture.
The aim of this work is to evaluate the effectiveness of the emission reduction measures achieved by a number of emission scenarios, in order to meet compliance with the limit values of PM
10 and NO
2 set up by the Air Quality Directive 2008/50/EC(AQD) [
1].According to the AQD, The most critical air-quality standards in the Po Valley, according to the AQD, are considered in this work: the 24-hourlimit value of PM
10 (50 µg/m
3 to not exceed for more than 35 days each year) and the annual mean limit value of NO
2 (40 µg/m
3). The evaluation was achieved through the use of the air-quality models suite NINFA (Northern Italy Network to Forecast Aerosol pollution) [
2,
3]. NINFA is the operational Transport Model of the Environmental Agency of the Emilia-Romagna Region (ARPAE). The model suite includes a Chemical Transport Model (CTM), a meteorological model and an emissions preprocessing tool. The CTM is nested (one-way nesting) by taking initial and boundary conditions from a larger-scale model.
2. LIFE Integrated Project (IP)Po Regions Engaged to Policies of Air (PREPAIR)
The LIFE integrated project (IP)Po Regions Engaged to Policies of Air (PREPAIR) [
4] supports the implementation of the regional air-quality plans (AQPs) and of the Po Valley agreements on a larger scale, acting in a synergic way, so to strengthen the sustainability and durability of the results. Although the geographical coverage of the project is the Po Valley and of the regions and urban areas that mainly influence air quality in the basin, the project actions are extended to Slovenia, in order to assess and reduce pollutants transport across the Adriatic Sea. Regarding air quality, in fact, all the regions located south of the Alps face the same adverse climatic conditions, which require higher technical and financial efforts, in comparison with other regions, to resolve compliance problems, as we try to show later.
The project PREPAIR, which started in 2017 and lasts until 2024, is financed under the EU LIFE Program for a total budget of 17 M€, in order to improve air quality in the Po Valley and in Slovenia and fully comply with the Directive 2008/50/EC and the European strategy for clean air, but it also contributes to the attempt to reach the objectives of the National Emission Ceilings Commitments and other environmental policies, like energy efficiency and climate action.
The main goal of PREPAIR is to increase the know-how of public bodies and private operators. Among all the measures foreseen in the regional AQPs, PREPAIR focuses, in particular, on four main sectors: biomass burning, energy efficiency, transport and agriculture. The project also aims at integrating a wide set of technical tools (emissions inventories, air-quality models, enhanced monitoring stations, etc.) that, up until now, have been implemented independently in the various regions. This goal will be achieved by establishing a permanent networking structure between the environmental agencies of the Po Valley and of Slovenia. During the first phase of the project, the impact on the air quality of the Po Valley of several groups of measures, related to different levels of government, was evaluated. The group of measures considered are as follows:
The current legislation measures, which will be fully implemented by 2025 through the enforcement of the EU and member states’ legislations;
The national/interregional measures established by the agreements between the Regions of the Po Valley and the Italian government;
The AQPs implemented by the regions.
3. The Emission Scenarios in LIFE-IP PREPAIR
3.1. Baseline Scenario
In the first phase of PREPAIR, a common emission inventory has been implemented in the project area. All available emission data for the Po Valley and Slovenia have been collected and analyzed [
5]. Po Valley inventories were made using the INEMAR system [
6] and following the national methodologies and the methodologies reported by the EMEP/EEA Atmospheric Emission Inventory Guidebook (AEIG) [
7]
The dataset covers an area of about 135,000 km
2 with a population of about 28 million people (
Figure 1).
The emission dataset refers to the year 2013 and contains the emissions for each municipality. It was obtained merging local and national inventories (in the case of Slovenia), maintaining the greatest possible detail. In this way, it is possible to identify extremely localized or peculiar sources of a specific area. In
Table 1, the emissions of main pollutants related to the air pollution of the Po Valley are summarized. The Table shows that the major contributor to the production of primary PM
10 is the sector non-industrial combustion plants, which mostly contributing through biomass burning. The second contributor is the sector road transport. As far as NO
2 is concerned, the biggest contribution is due to road transport and secondarily to combustion in the manufactory industry. Considering ammonia, an important precursor of secondary particulate, it is evident that almost all the emissions are produced by agriculture, while organic compounds, contributing to the formation both of PM
10 and ozone, are mainly emitted by the sector solvent and other products. As far as SO
2 is concerned, the biggest contribution is due to combustion in the manufactory industry and secondarily to production processes. Because the domestic heating in the Po Valley mainly employs natural gas, the total amount of SO
2 emissions is negligible in comparison with NOx (1/8) and NH
3 (1/5).
3.2. The Current Legislation Scenario
The emissions scenario related to the implementation of the current legislation in the year 2025 is called CLE2025. The emission reduction for CLE2025 has been estimated by the application of emission projections provided, for each Italian region, by the Greenhouse Gas and Air Pollution Interactions and Synergies (GAINS)-Italian national model [
8] managed by National Agency for new Technologies Energy and Sustainable Economic Development (ENEA). Starting from the baseline scenario, projections are calculated by a time proxy obtained from GAINS trends. The time projections are calculated for each sector and activity and remapped to Standard Nomenclature for Air Pollution (SNAP) and fuel categories. The methodology is described in detail in the PREPAIR report [
5].
3.3. The Action-Plans Scenario
The action-plans scenario (hereafter scenario APS2025) is the emissions scenario which considers the emissions resulting from the reduction measures due to the full application of the combination of the current legislation plus the air-quality plans (AQPs), plus the Po Basin Agreement, plus the PREPAIR actions. The APS2025 scenario was built thanks to the web-based platform realized by PREPAIR. This platform, called “System for the environmental accountability of the measures of AQ plans”, collects data about all the actions for the Po valley implemented by the regions and in the project itself. The data in the platform are constantly updated by the project partners. The system includes a web-based tool used by the project partners for periodically monitoring and updating the actions/measures. With this system, a common database has been produced which contains a catalogue of all the emissions reduction measures included in the AQPs and of the measures adopted by the regions, thanks to the Po Valley Agreements. The database considers both end-of-pipe (technological) and energy/behavior (non-technological) measures.
Among the non-technological measures, the improved performances of the emissions reduction of AQPs due to the PREPAIR project were also considered. The PREPAIR actions mainly consist of communication actions (workshops, guidelines, promotion, citizen’s involvement, etc.) that act in four different sectors: agriculture, biomass burning, transports and energy efficiency. The different levels of expected improvement were estimated for the different types of action, considering the intensity of application and the numbers of activities involved.
Due to this "basin approach", the measures adopted by the regions in their own AQPs will lead to a comprehensive framework and strategy necessary to improve air quality in the whole area.
Table 2, below, summarizes the 382 measures included in the Catalogue of Measures.
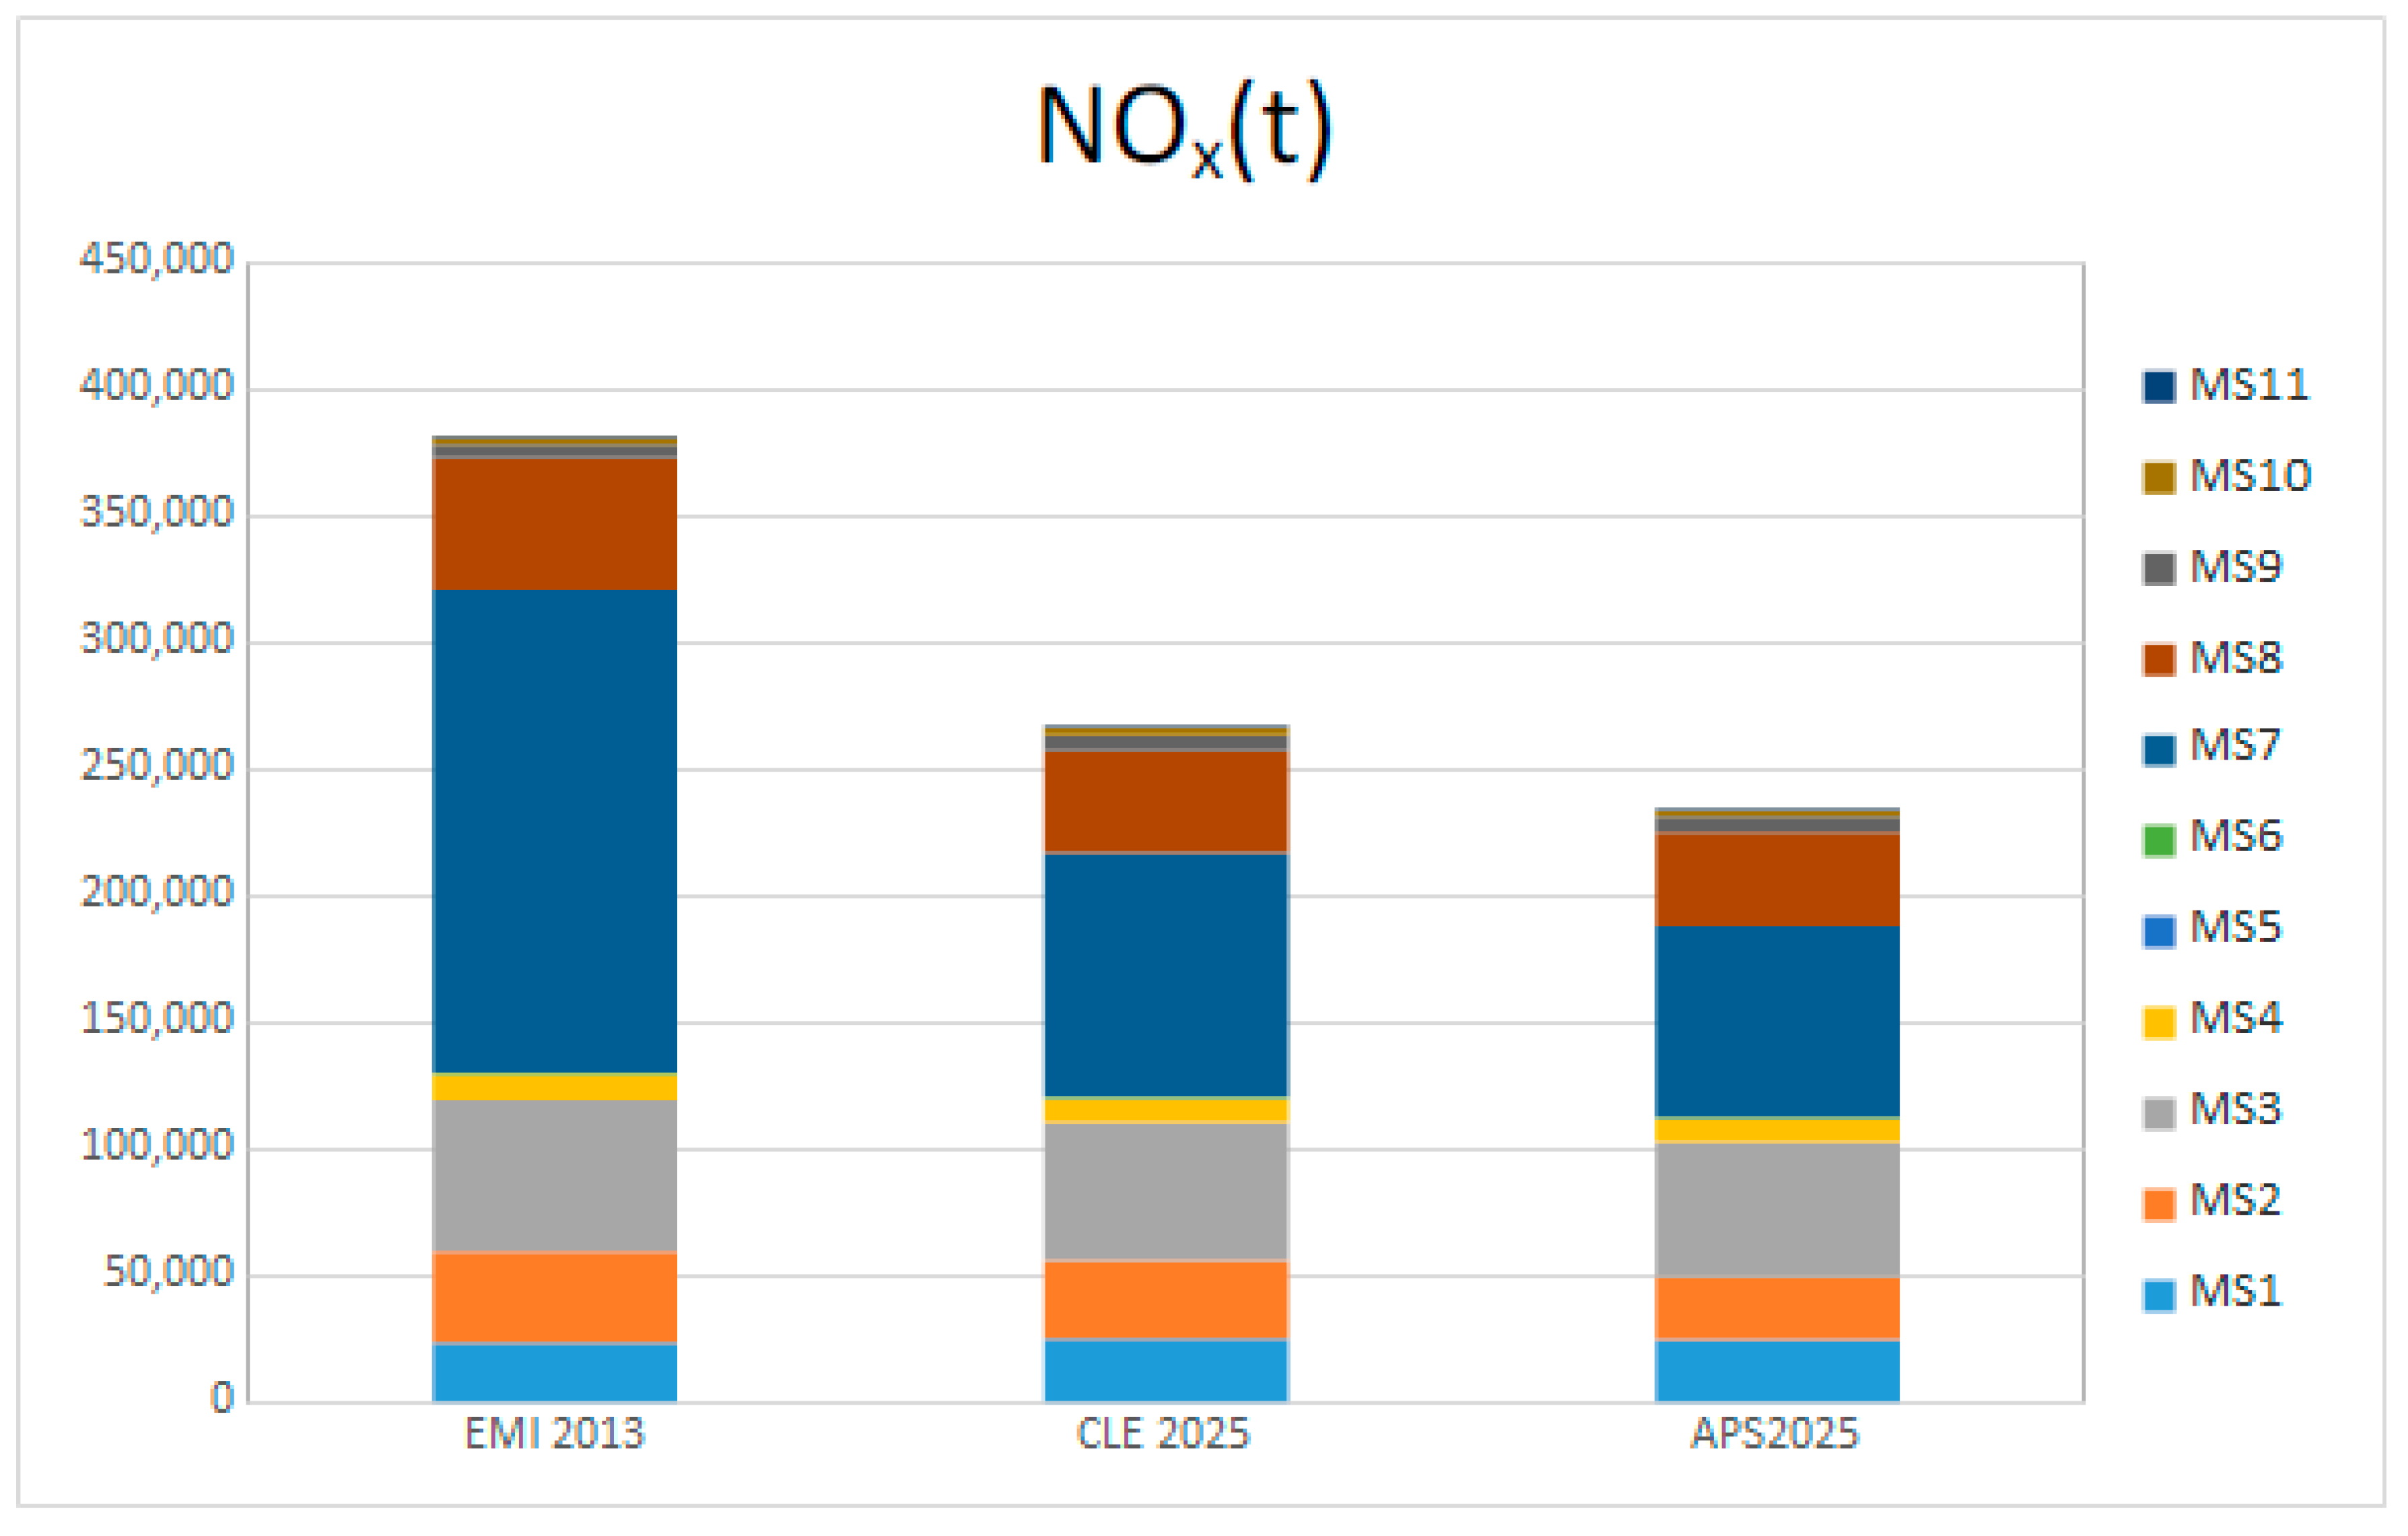
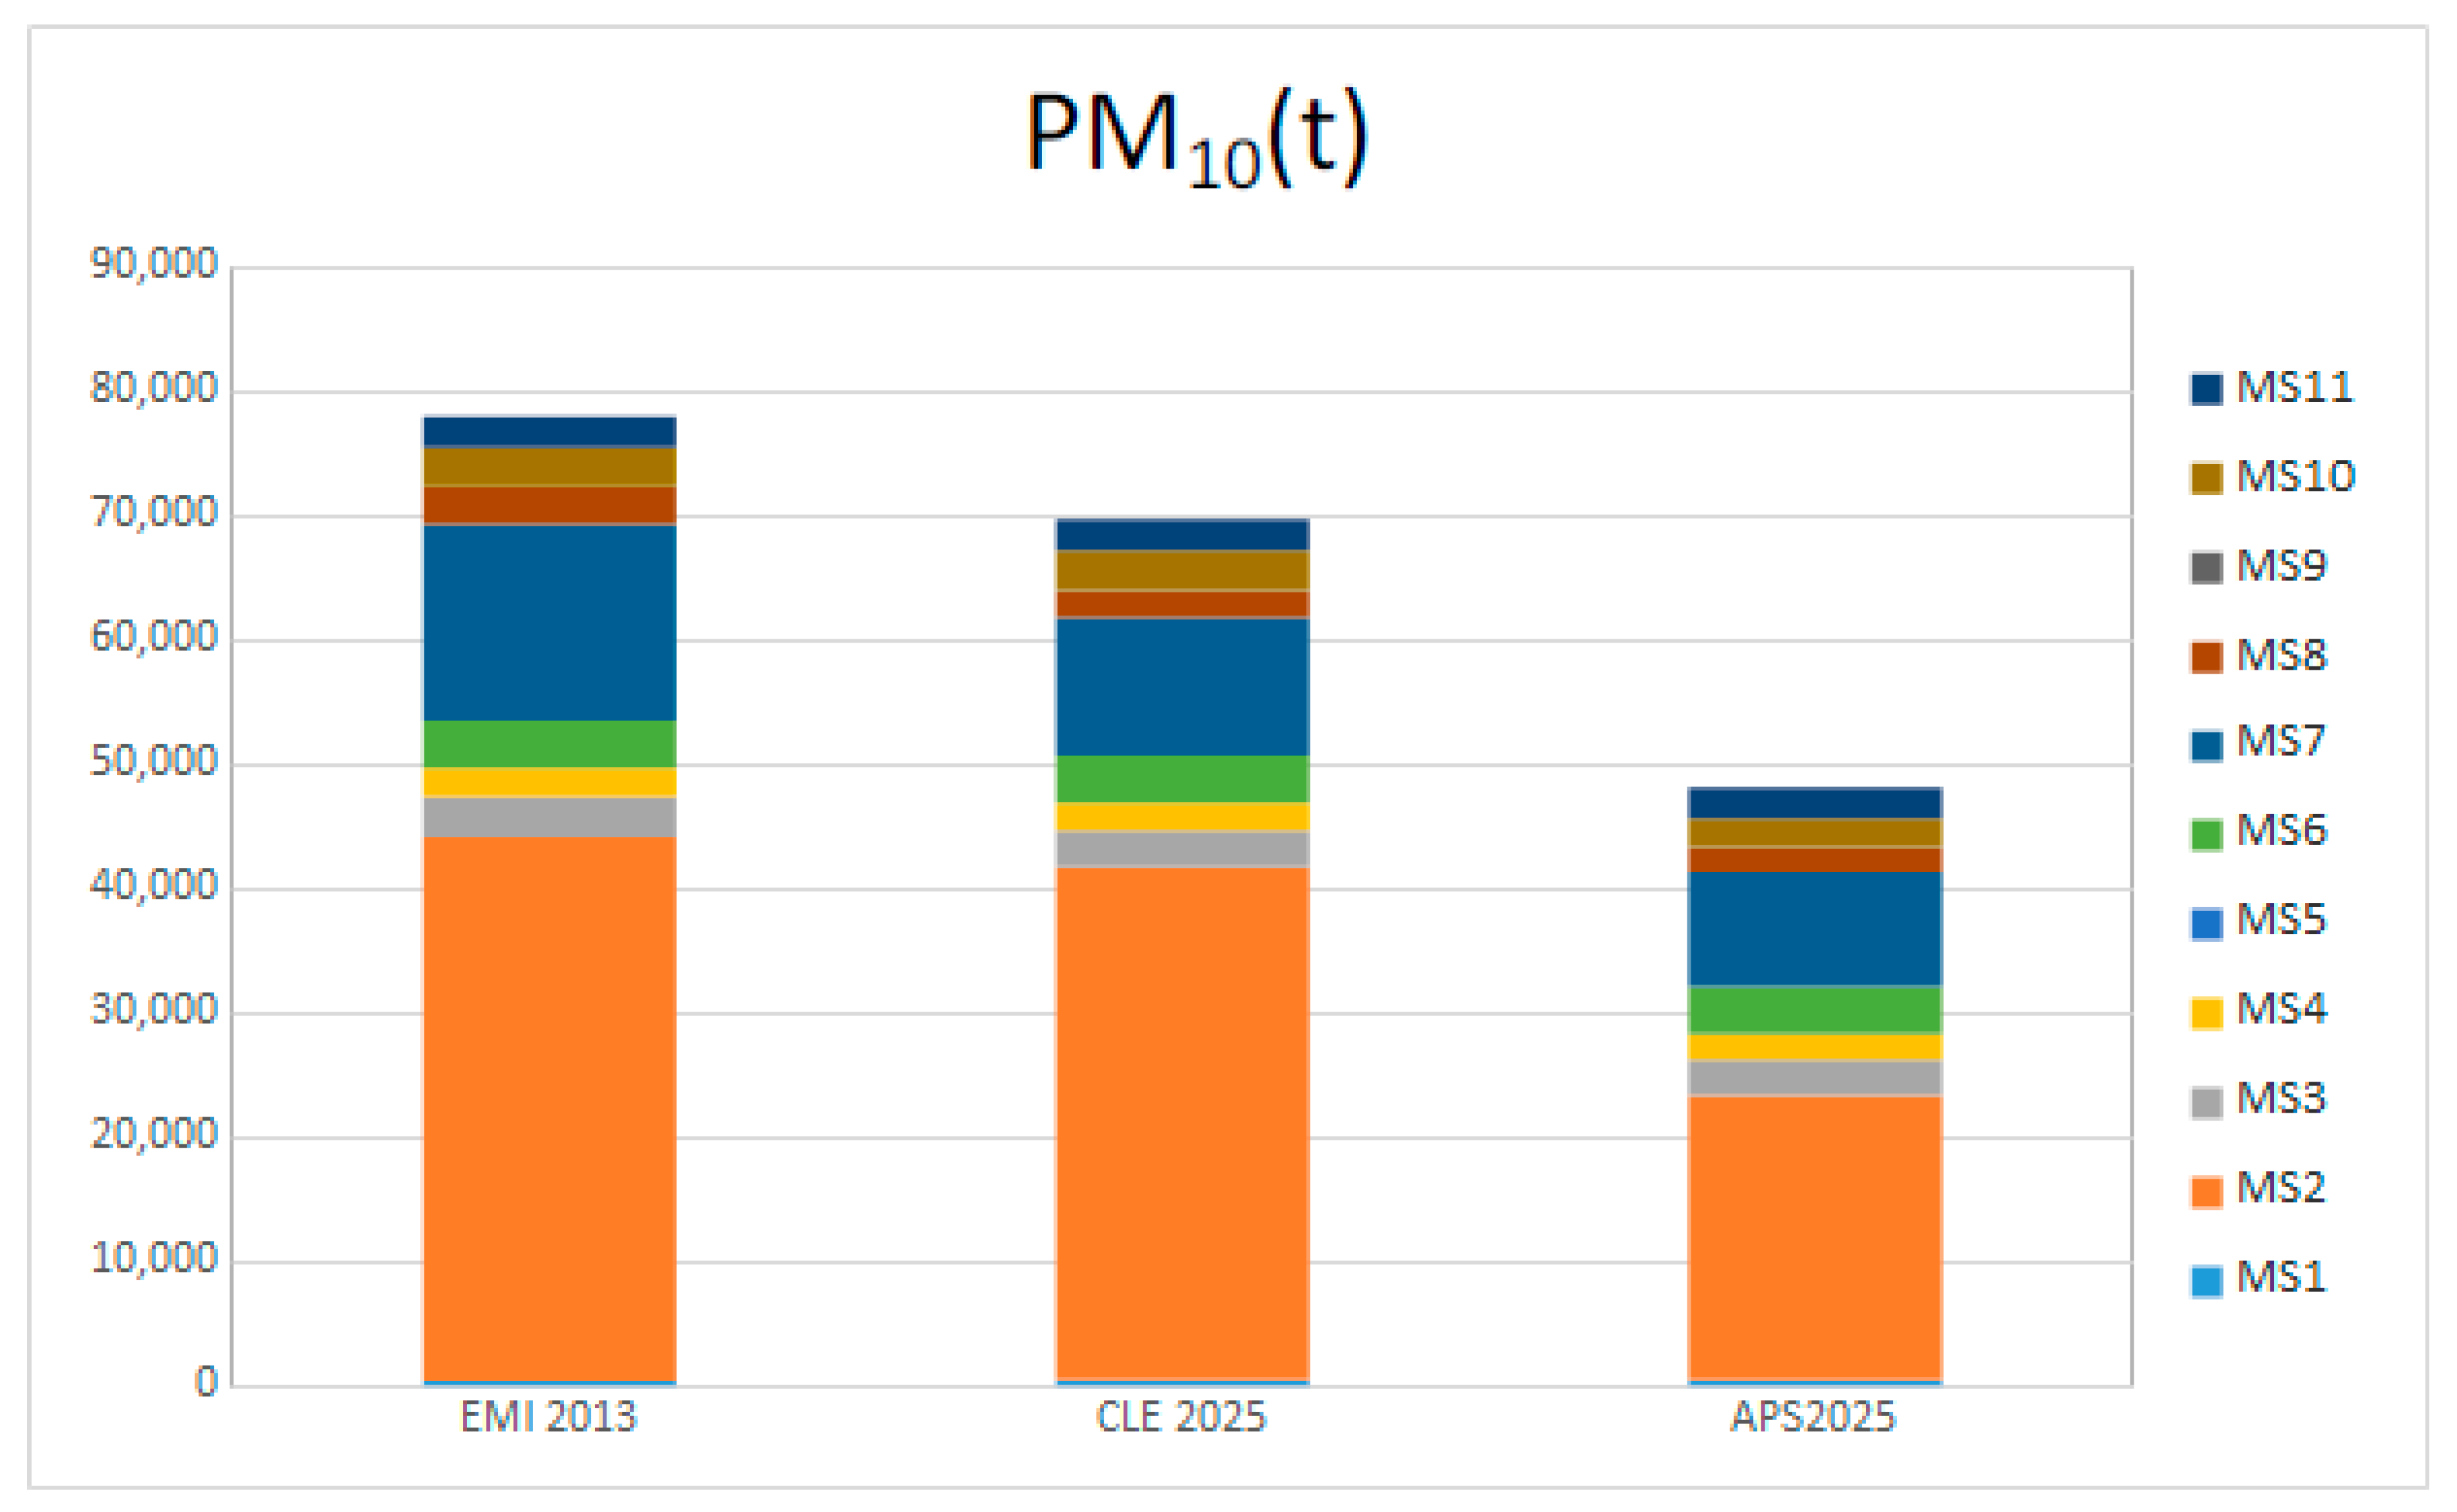
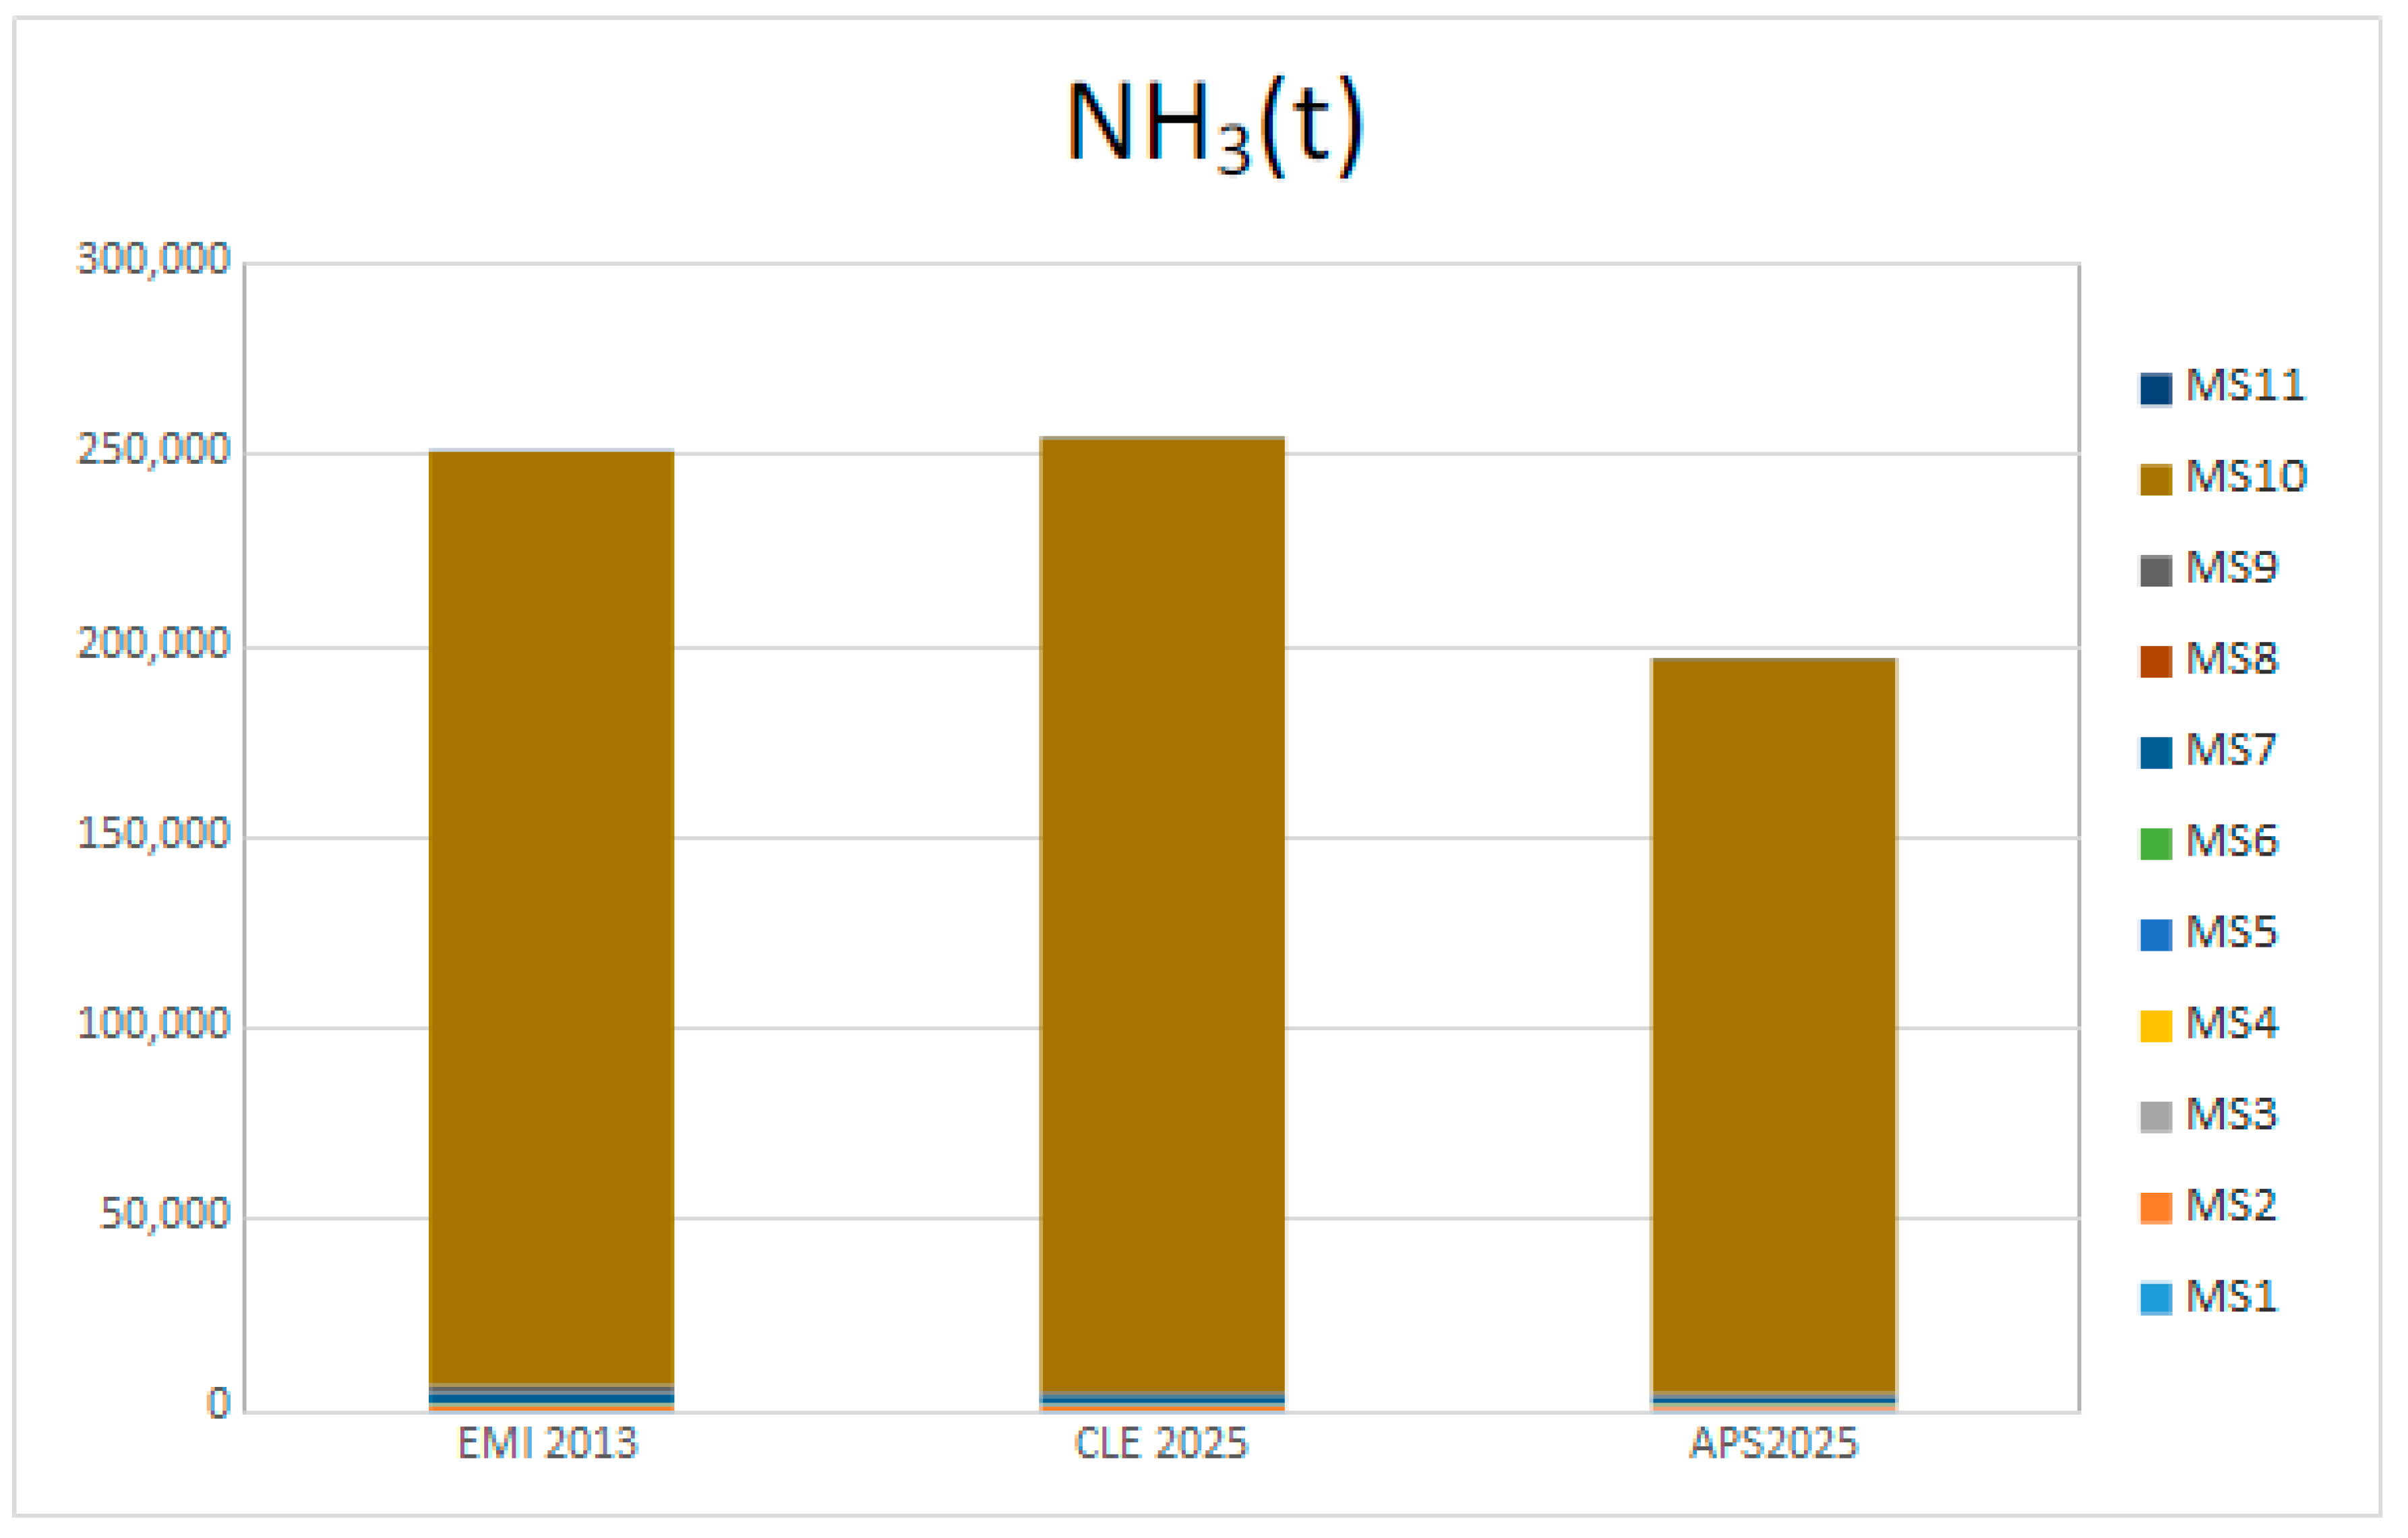
The emissions levels [
9] related to the main pollutants (NOx, PM
10, NH
3 and SO
2), for the three following scenarios, are shown in
Figure 2,
Figure 3,
Figure 4 and
Figure 5:
Baseline scenario (EMI2013);
Current legislation scenario (CLE2025);
Action-plans scenario (APS2025).
From the figures, the following can be seen:
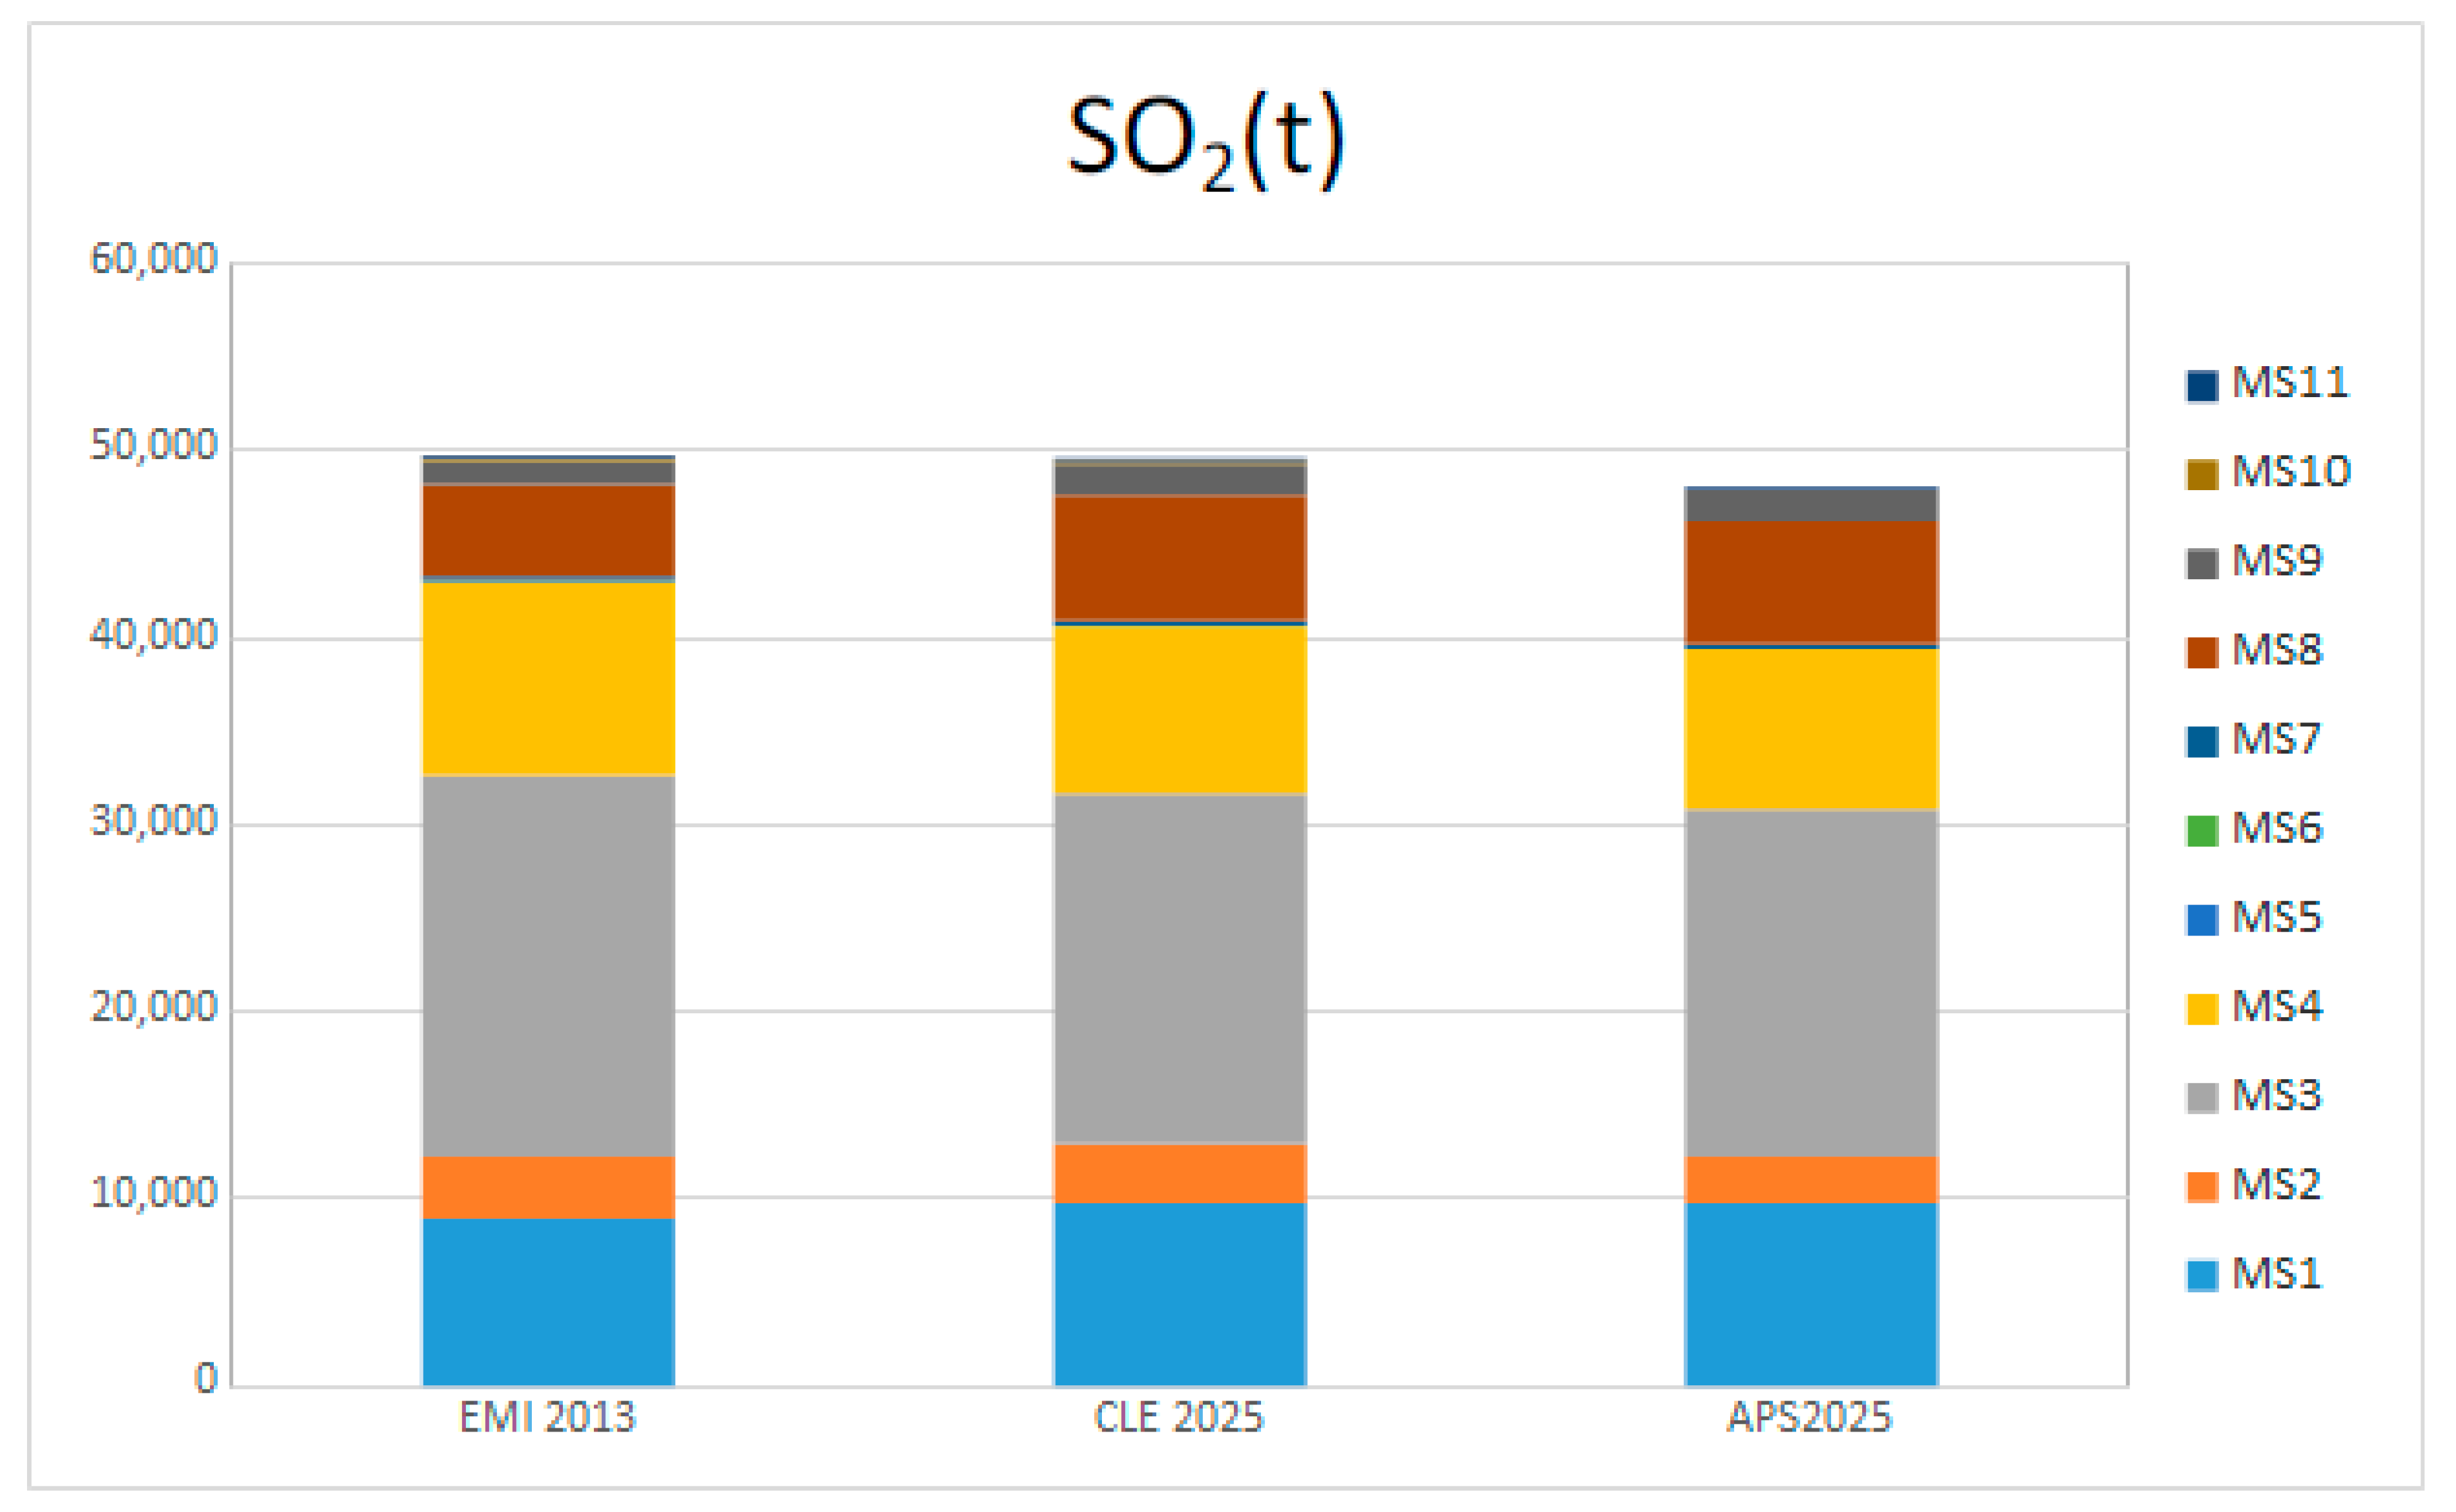
In the CLE2025 scenario, most of emissions reductions are due to the traffic macro-sector: overall NOx decrease is about 30%, while PM10 decrease is only 10%. Ammonia (NH3) emissions increase slightly (ammonia is an important PM precursor), and SO2 emissions do not change at all.
In the APS2025 scenario, the emission reductions are higher for all pollutants: NOx decrease is 39%, PM10 38%, PM25 40%, NH3 22%and SO2 3%. These high emissions decreases are due mainly to the reduction measures applied to agriculture (the main source of ammonia) and domestic biomass burning (the main source of primary PM10) sectors. Such sectors are regulated by the regions through the air-quality plans (AQPs) and the Rural Development Programs (RDP). Another relevant sector on which the air-quality plans acts mobility management. Measures such as the promotion of cycle-pedestrian mobility or the introduction of low-emission zones also contribute to reducing the emissions levels, as well as the effectiveness of European approval limits for vehicles.
4. Chemical Transport Model Simulation (CTM)
4.1. Definition of CTM Model Setup
The pollutants concentration in air due to the emissions scenarios described above has been evaluated by using the air-quality-models suite NINFA (Northern Italy Network to Forecast Aerosol pollution [
2,
3]. NINFA is the operational AQ model of the Environmental Agency of the Emilia-Romagna Region (ARPAE). The model suite includes a Chemical Transport Model (hereafter CTM), a meteorological model and an emissions preprocessing tool. The CTM is nested (one-way nesting) by taking initial and boundary conditions from larger-scale national or continental models.
The chemical transport model is CHIMERE [
10], an Eulerian-type numerical model, which simulates transport, dispersion, chemical transformations and deposition (dry and wet) of air pollutants and aerosols. The model input data are emissions, meteorology and physiographic data. The model includes routines that calculate biogenic, dust and sea salt additions that contribute to the anthropogenic emissions provided as input.
Starting from the emission data for the Po Valley, Slovenia and the other regions/countries present in the model domain, as described above, the emissions are prescribed to the numerical model by using specific proxy variables for each emission activity SNAP (i.e., road network for traffic emission, population and urban fabric for domestic heating, and so on).
The meteorological hourly input is provided by COSMO, the National NWP model used by the National Civil Protection Department [
11,
12]. COSMO is a non-hydrostatic, limited-area atmospheric prediction model, based on the primitive thermo-hydrodynamical equations describing compressible flow in a moist atmosphere, with a variety of physical processes taken into account by dry and moist parameterization schemes.
The time-dependent boundary conditions (with hourly frequency) can be provided either by PREV’AIR (the French national platform of quality air forecast covering Europe) [
13], or by the Italian CAMS downstream service [
14].
4.2. The Model Runs
For this work, NINFA is integrated at 0.07 × 0.05-degree horizontal resolution, nine vertical levels from surface up to 500 hPa, in hindcast mode for one year, using COSMO meteorology, with hourly boundary conditions coming from PREV’AIR.
The meteorological hourly input data are from the 1 January 2016 to 31 December 2016 period. Moreover, 2016 represents the median year in the time series of the number of days with meteorological conditions favorable to the PM10 accumulation in the Po Valley.
The model was run to evaluate the ground level pollutants concentrations for the three emission scenarios described in
Section 3 and summarized here below:
Baseline emission scenario: emissions levels in the reference year 2013;
CLE2025 current legislation scenario;
APS2025 air-quality plans scenario: maximum feasible reduction due to current legislation plus the implementation of the AQPs, the Po valley agreement and the action of PREPAIR project in the year 2025.
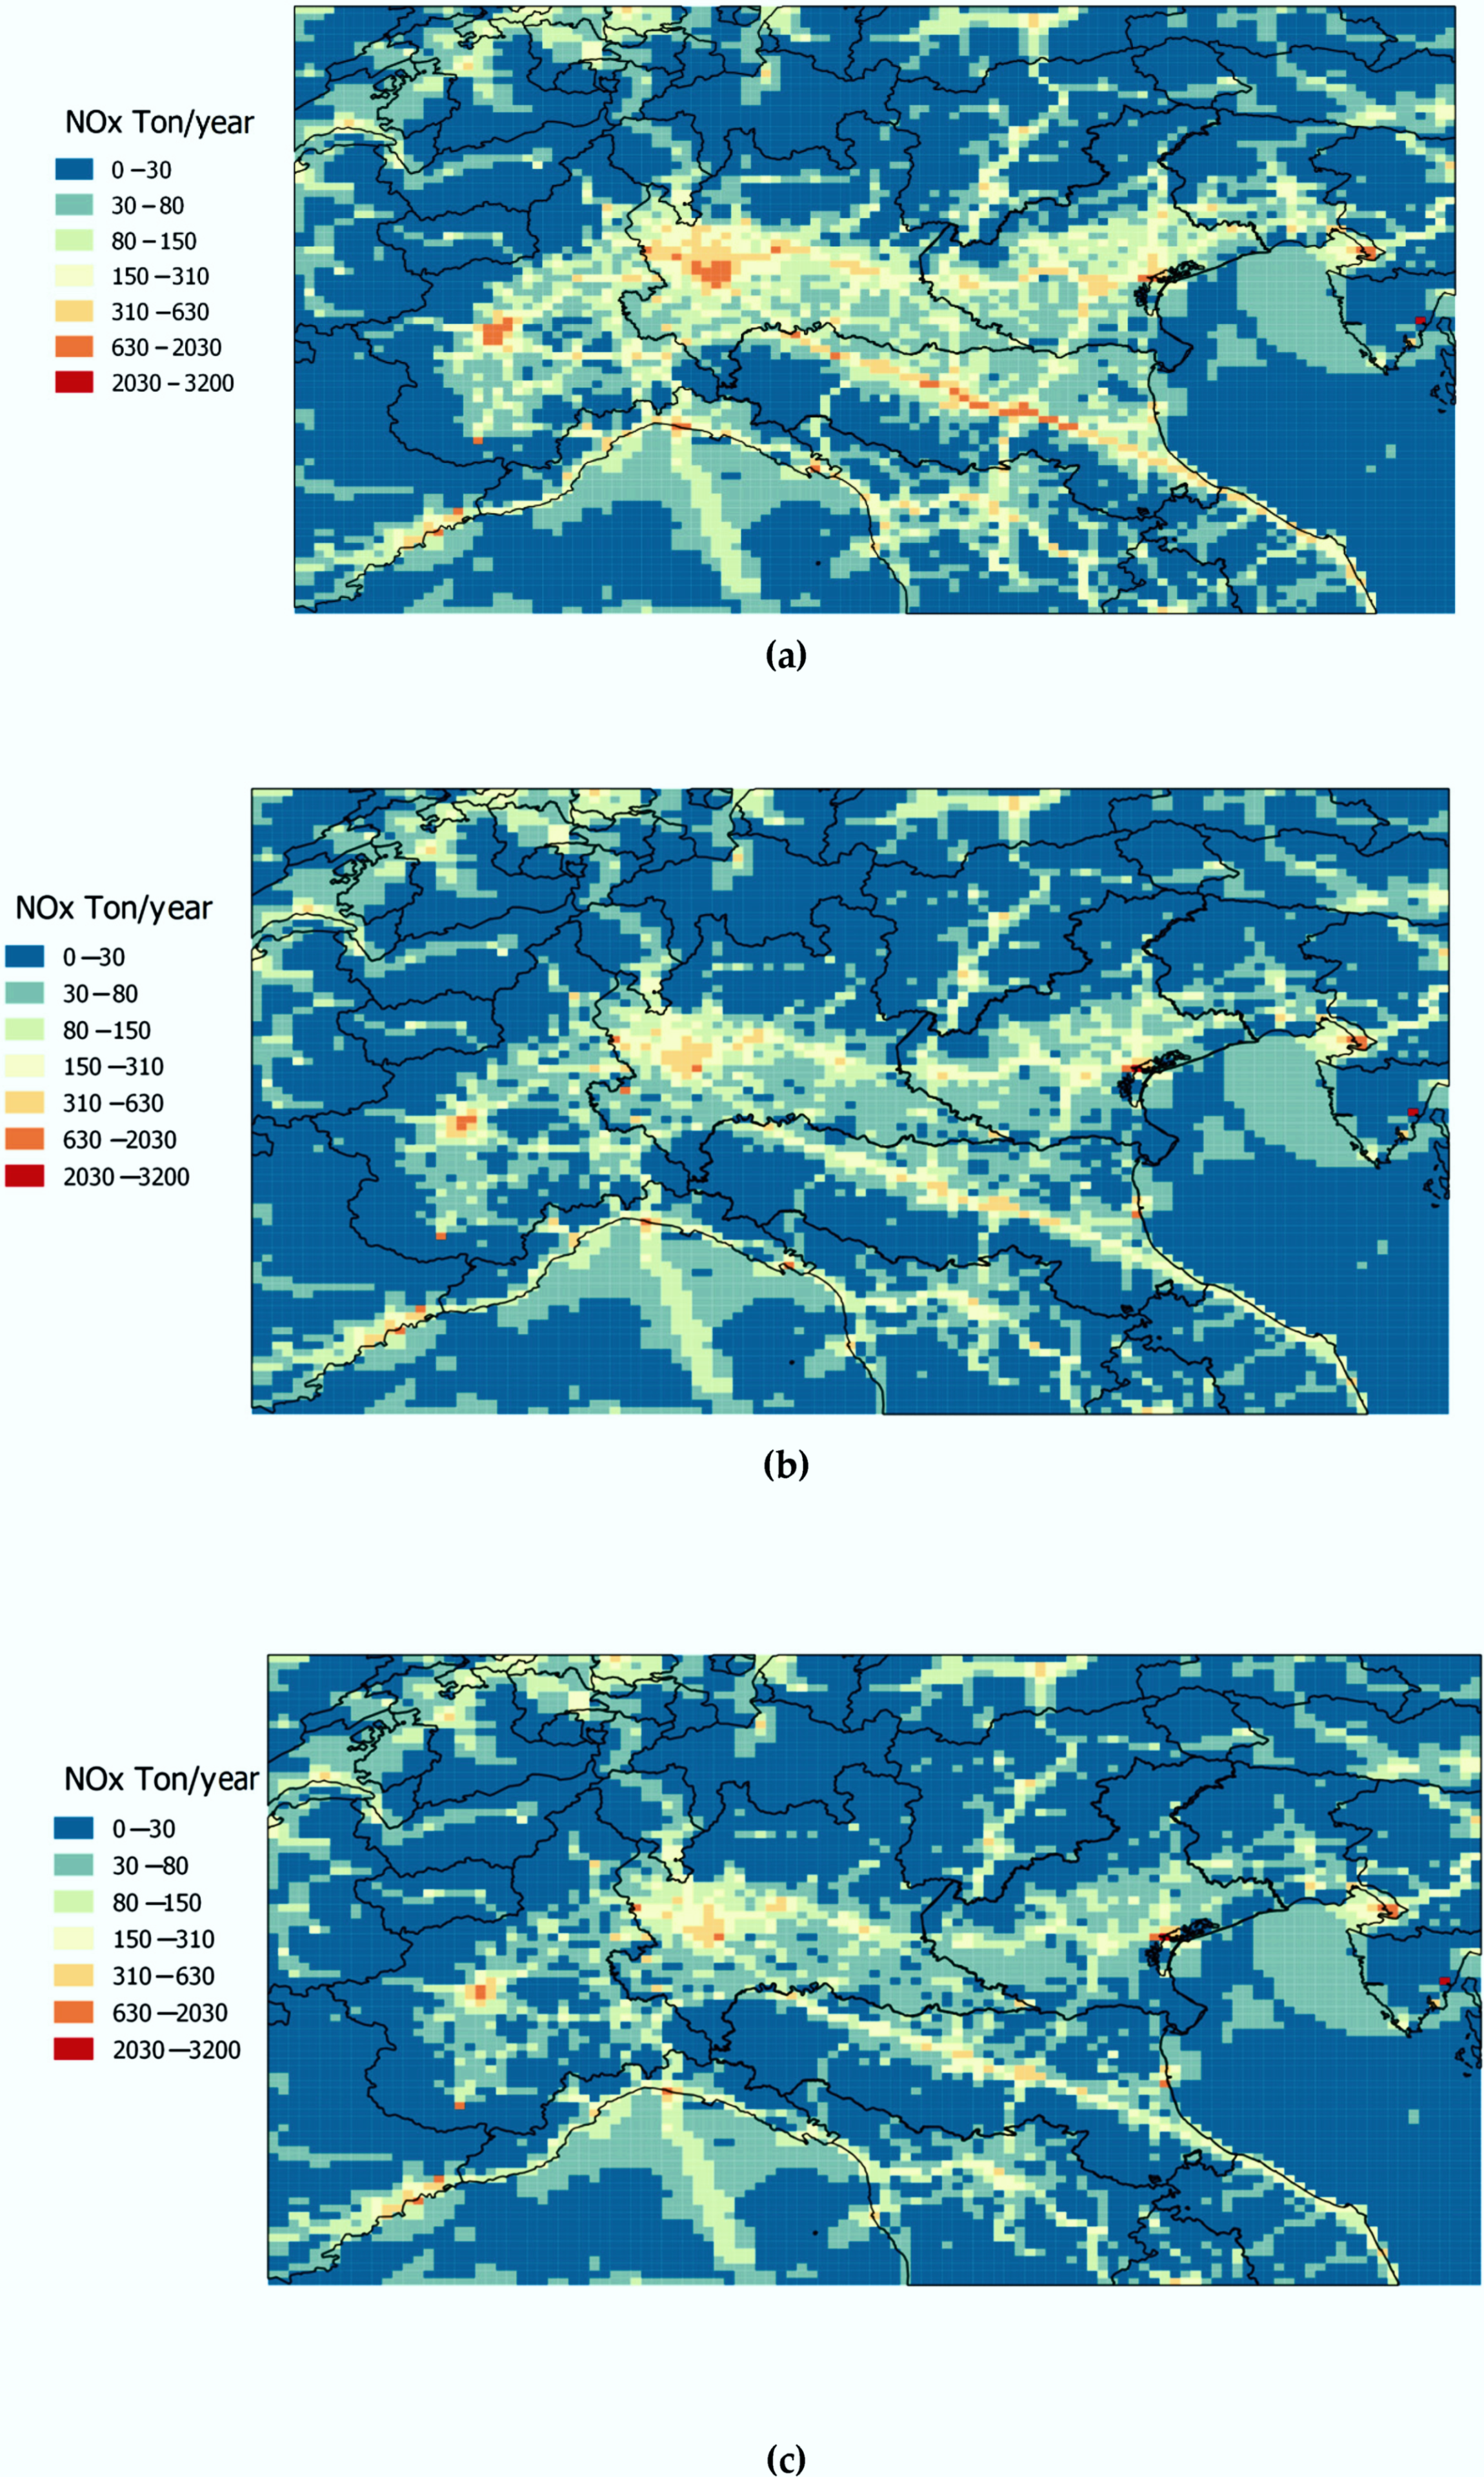
Figure 6 shows an example of the NO
2 emission maps fed into the model for the three simulated scenarios.
The purpose of these three scenarios is to evaluate the effectiveness of the emission reduction measures to achieve compliance with the Air Quality Directive limit values for PM
10 and NO
2 [
1]. The limit values considered are the annual average of PM
10 (less than 40 μg/m
3), the daily value of PM
10, i.e., the average concentration of 24 h (no more than 35 days per year which exceed the 24 h average concentration of 50 μg/m
3) and the annual average of NO
2 (less than 40 μg/m
3). These limit values are not achieved in most of the Po Valley.
4.3. Baseline Simulation and Bias Removal Method
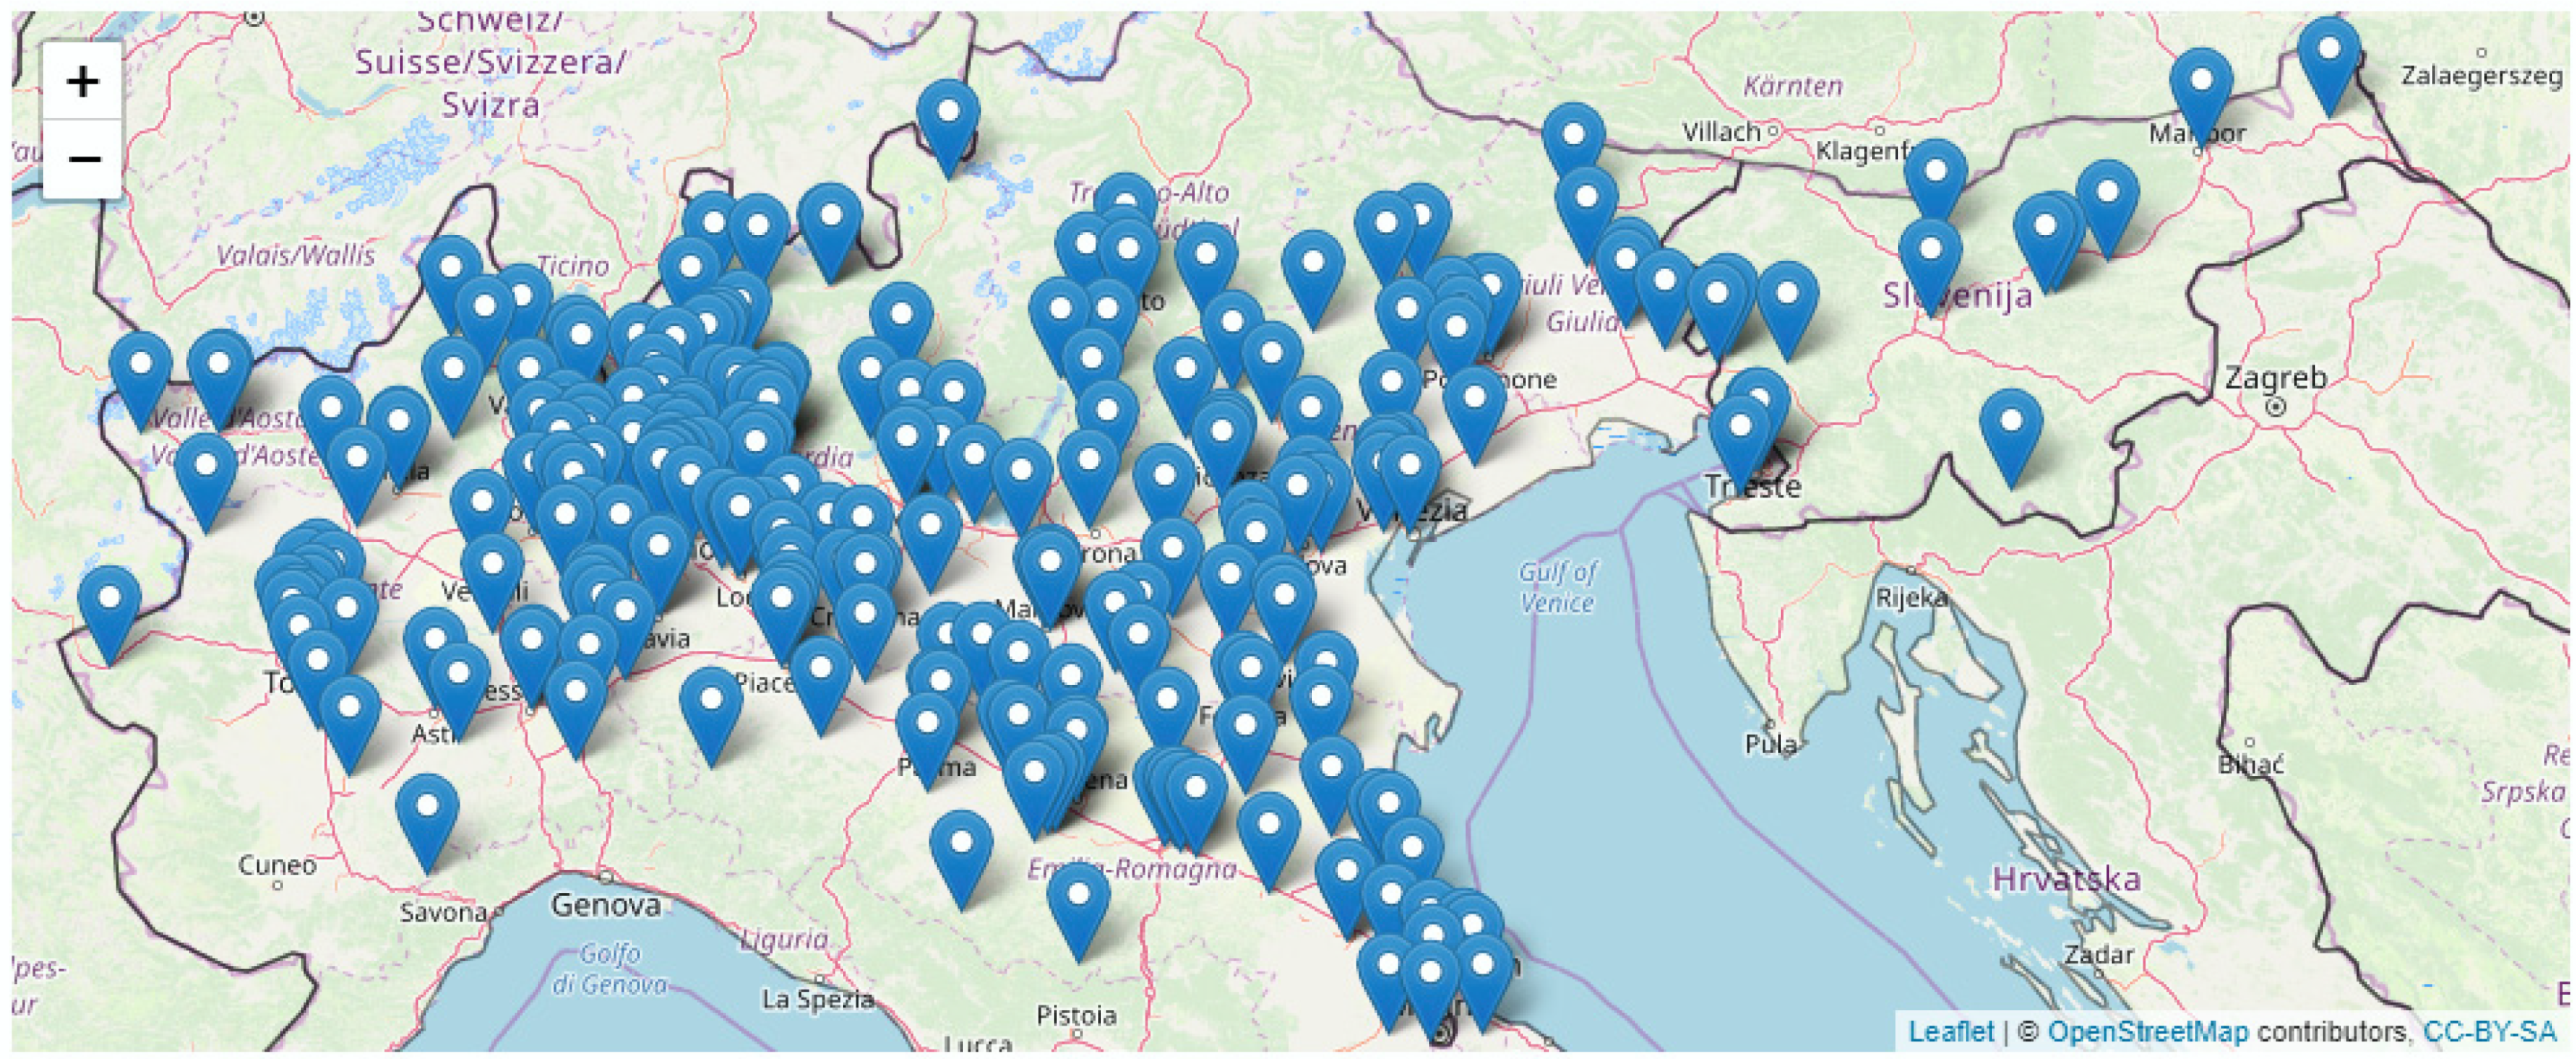
The annual average model output for the baseline scenario simulation was compared first with the ground-level concentration for 2016 year, recorded by the network of air-quality monitoring stations. (
Figure 7) which contains more than 140 stations belonging to the environmental agencies of the Italian regions and Slovenia, all partners to the project, and shared via the data-sharing platform set up by the PREPAIR C1 action.
The first comparison highlighted a systematic bias for the PM
10 and NO
2 annual average concentration. Therefore, in order to remove the bias, a space-dependent correction using insitu observations data was applied. The correction field is obtained by using a spatialization of the adjustment factor:
where Obs
j is the monitoring annual average, and Mod
j is the model annual average at station j.
The correction field was estimated by applying an ordinary kriging technique. The correction field is then used to adjust the output concentration of the NINFA model. In
Table 3, skill scores with and without kriging correction are shown. Given the overall improvement in the quantitative scores, that results can be considered a good estimate of the “true” annual mean.
In order to estimate the compliance with the daily limit value (LV), a statistic relationship between the numbers of days and annual average concentration was used. Following this approach, an equivalent limit value (ELV) can be defined. Following the literature [
15,
16], an ELV equal to 28 μg/m
3 can be applied.
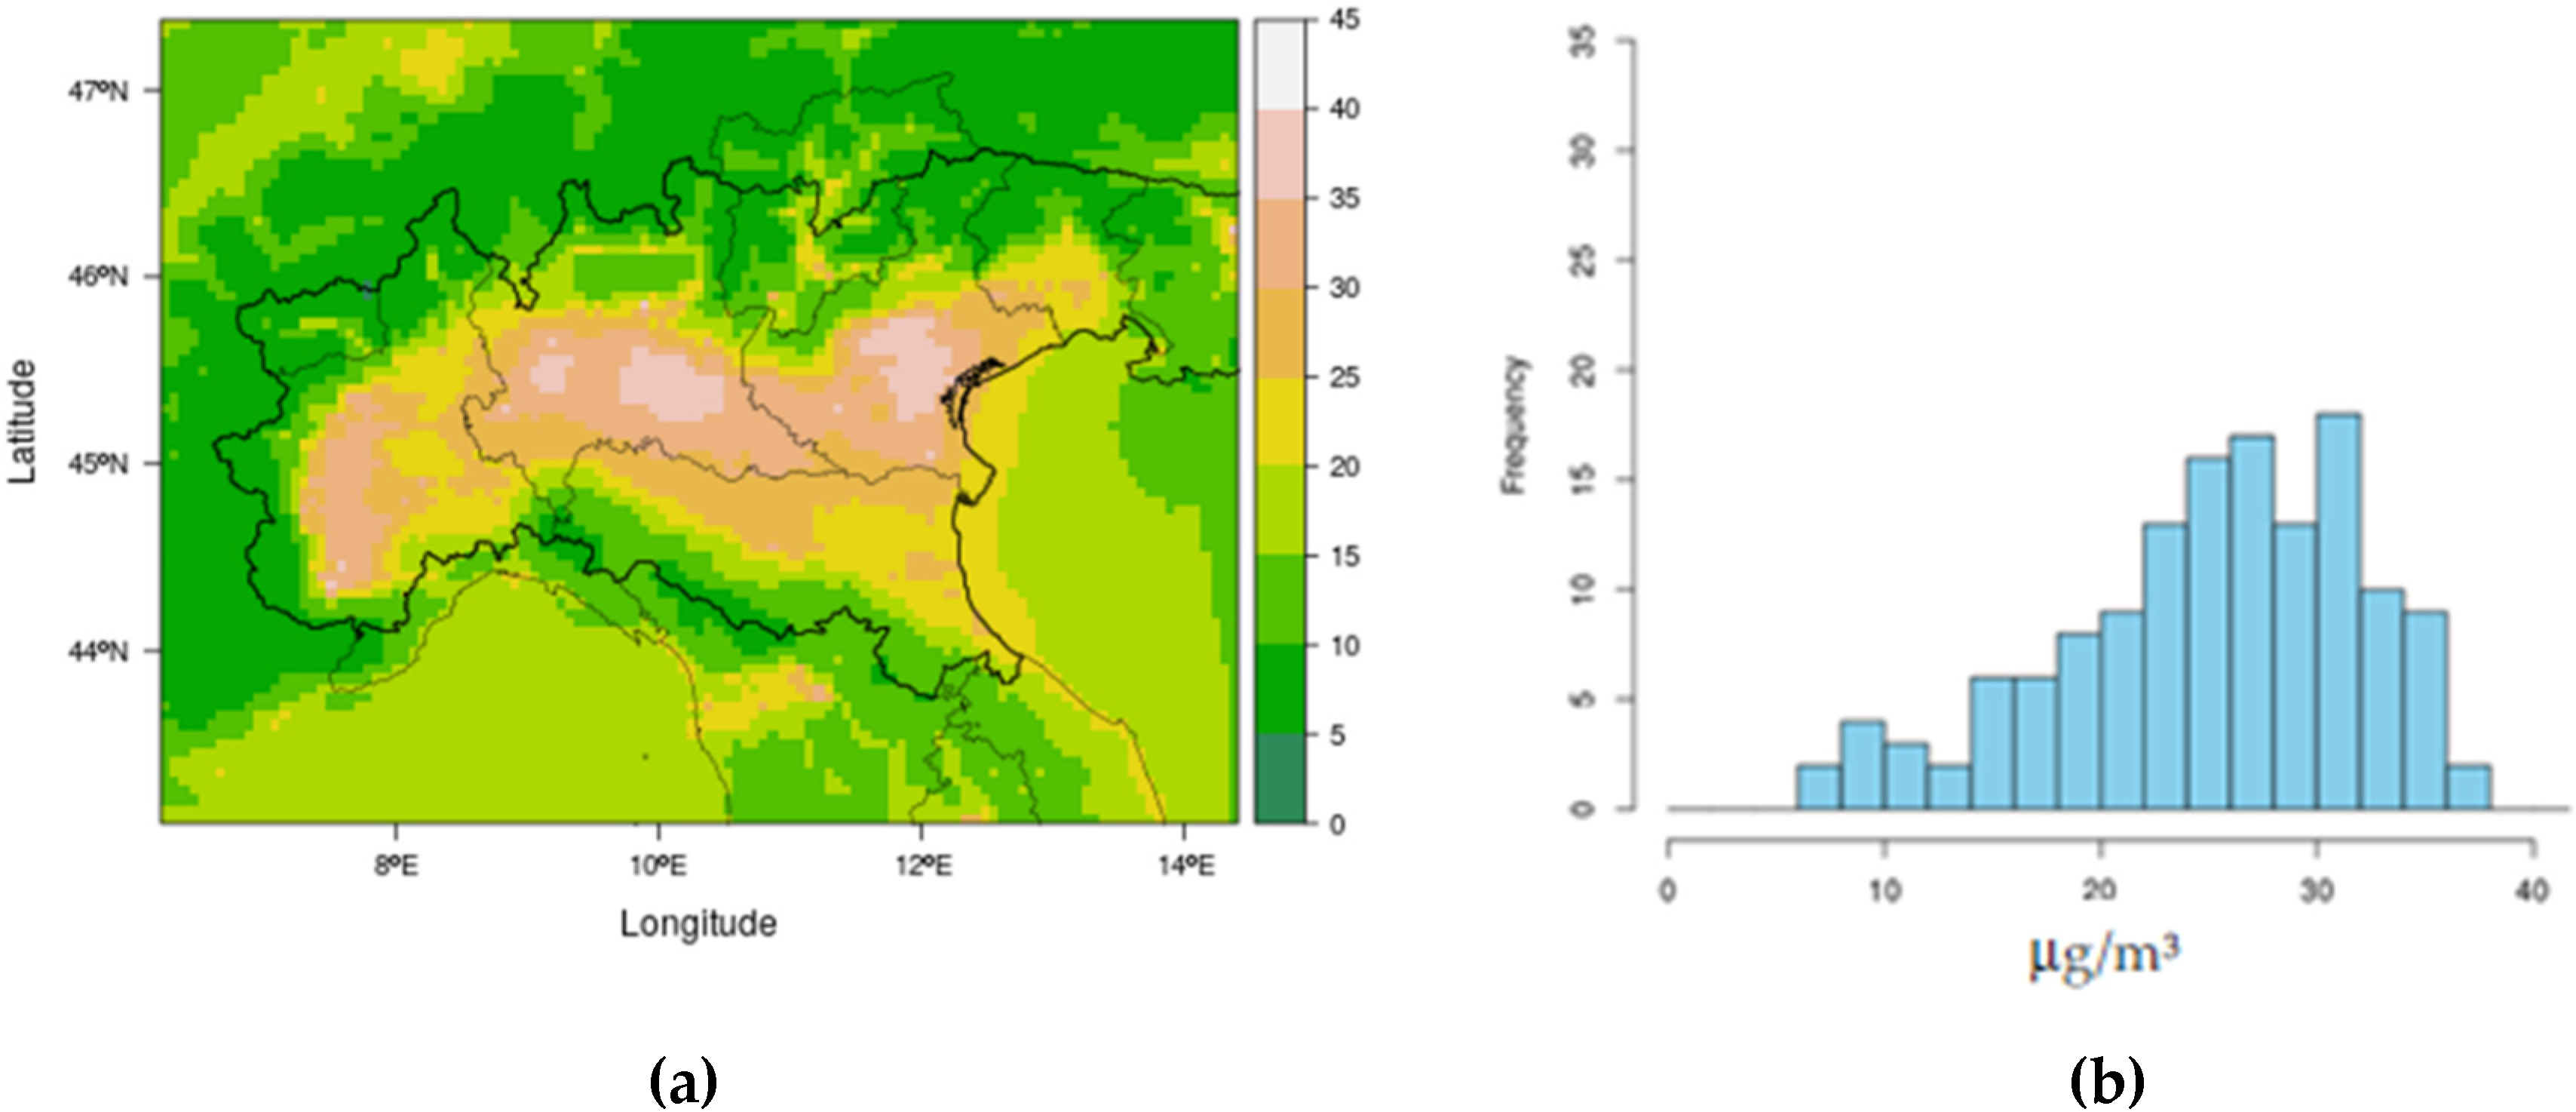
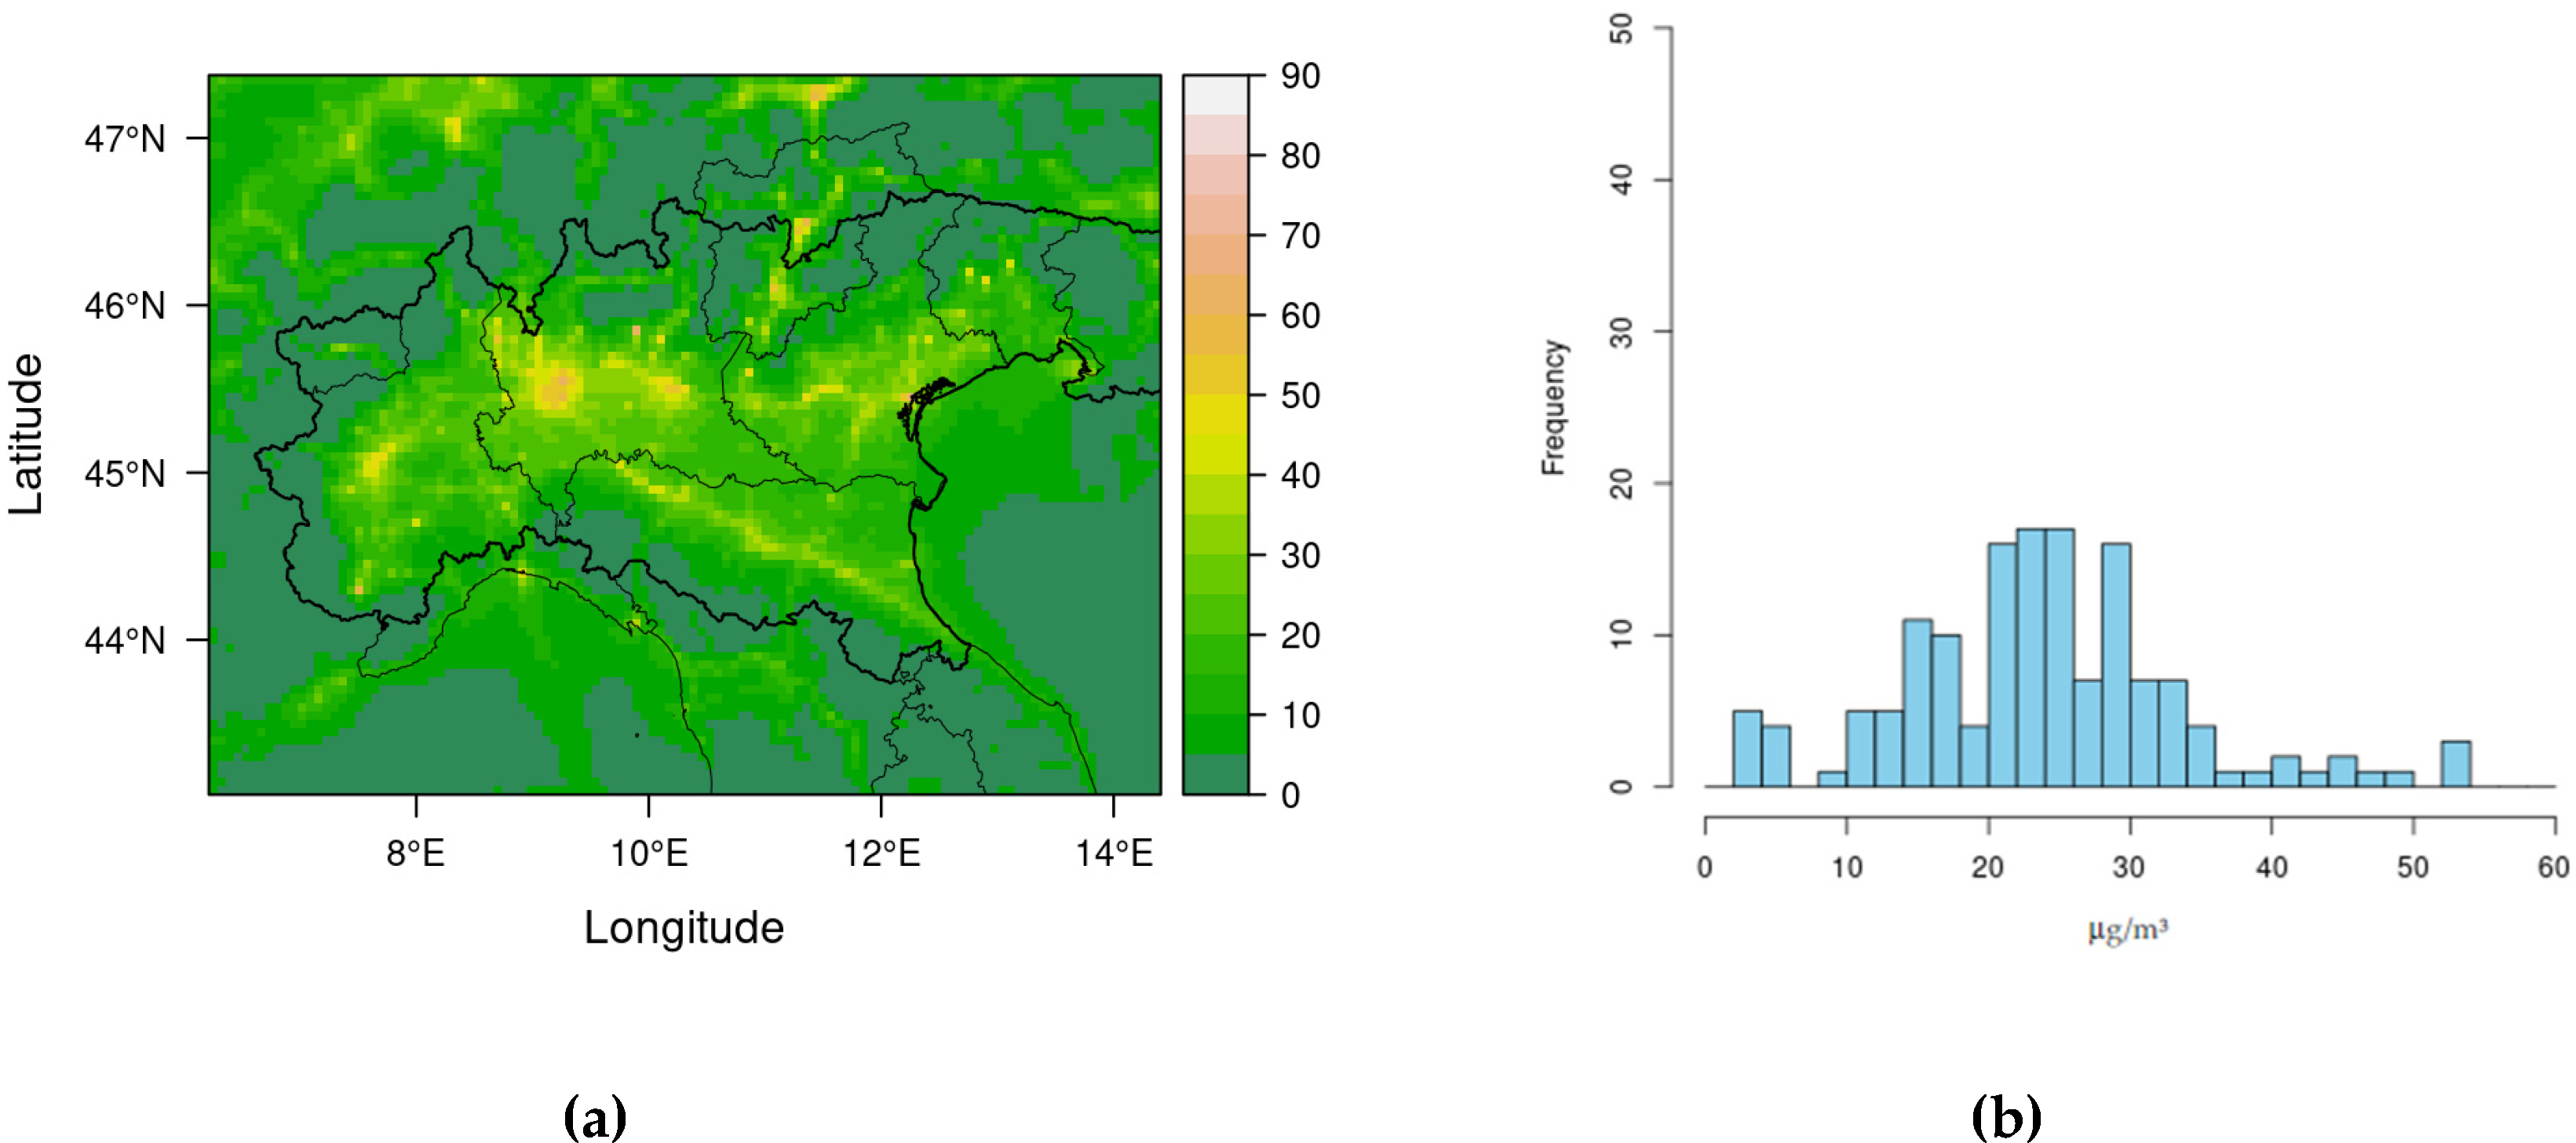
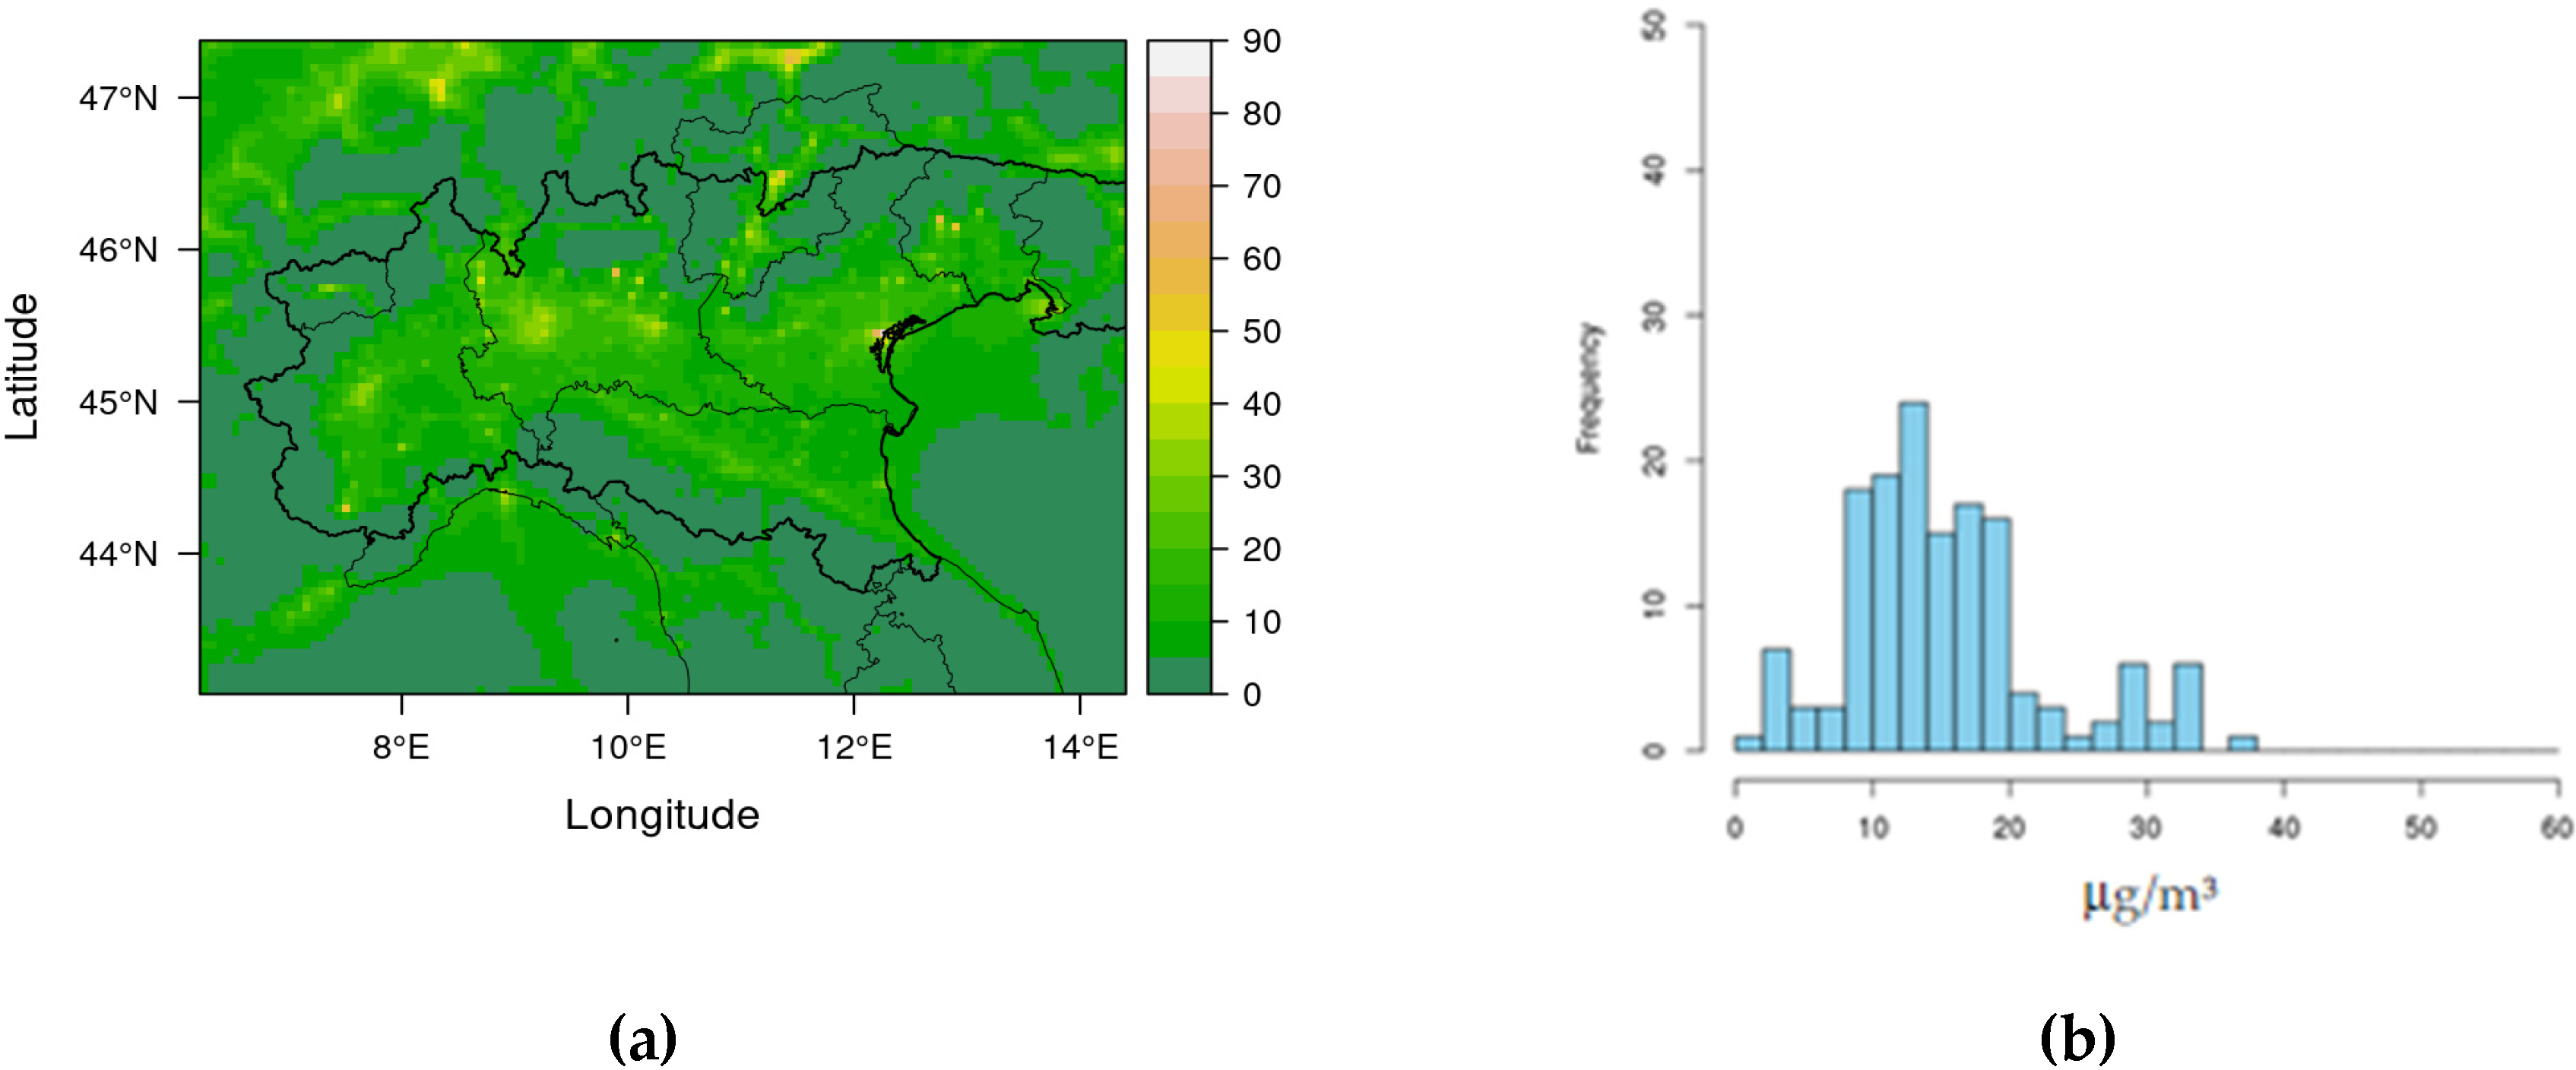
The following figures show the ground field (left) and the frequency distribution for the background station (right) of the PM
10 (
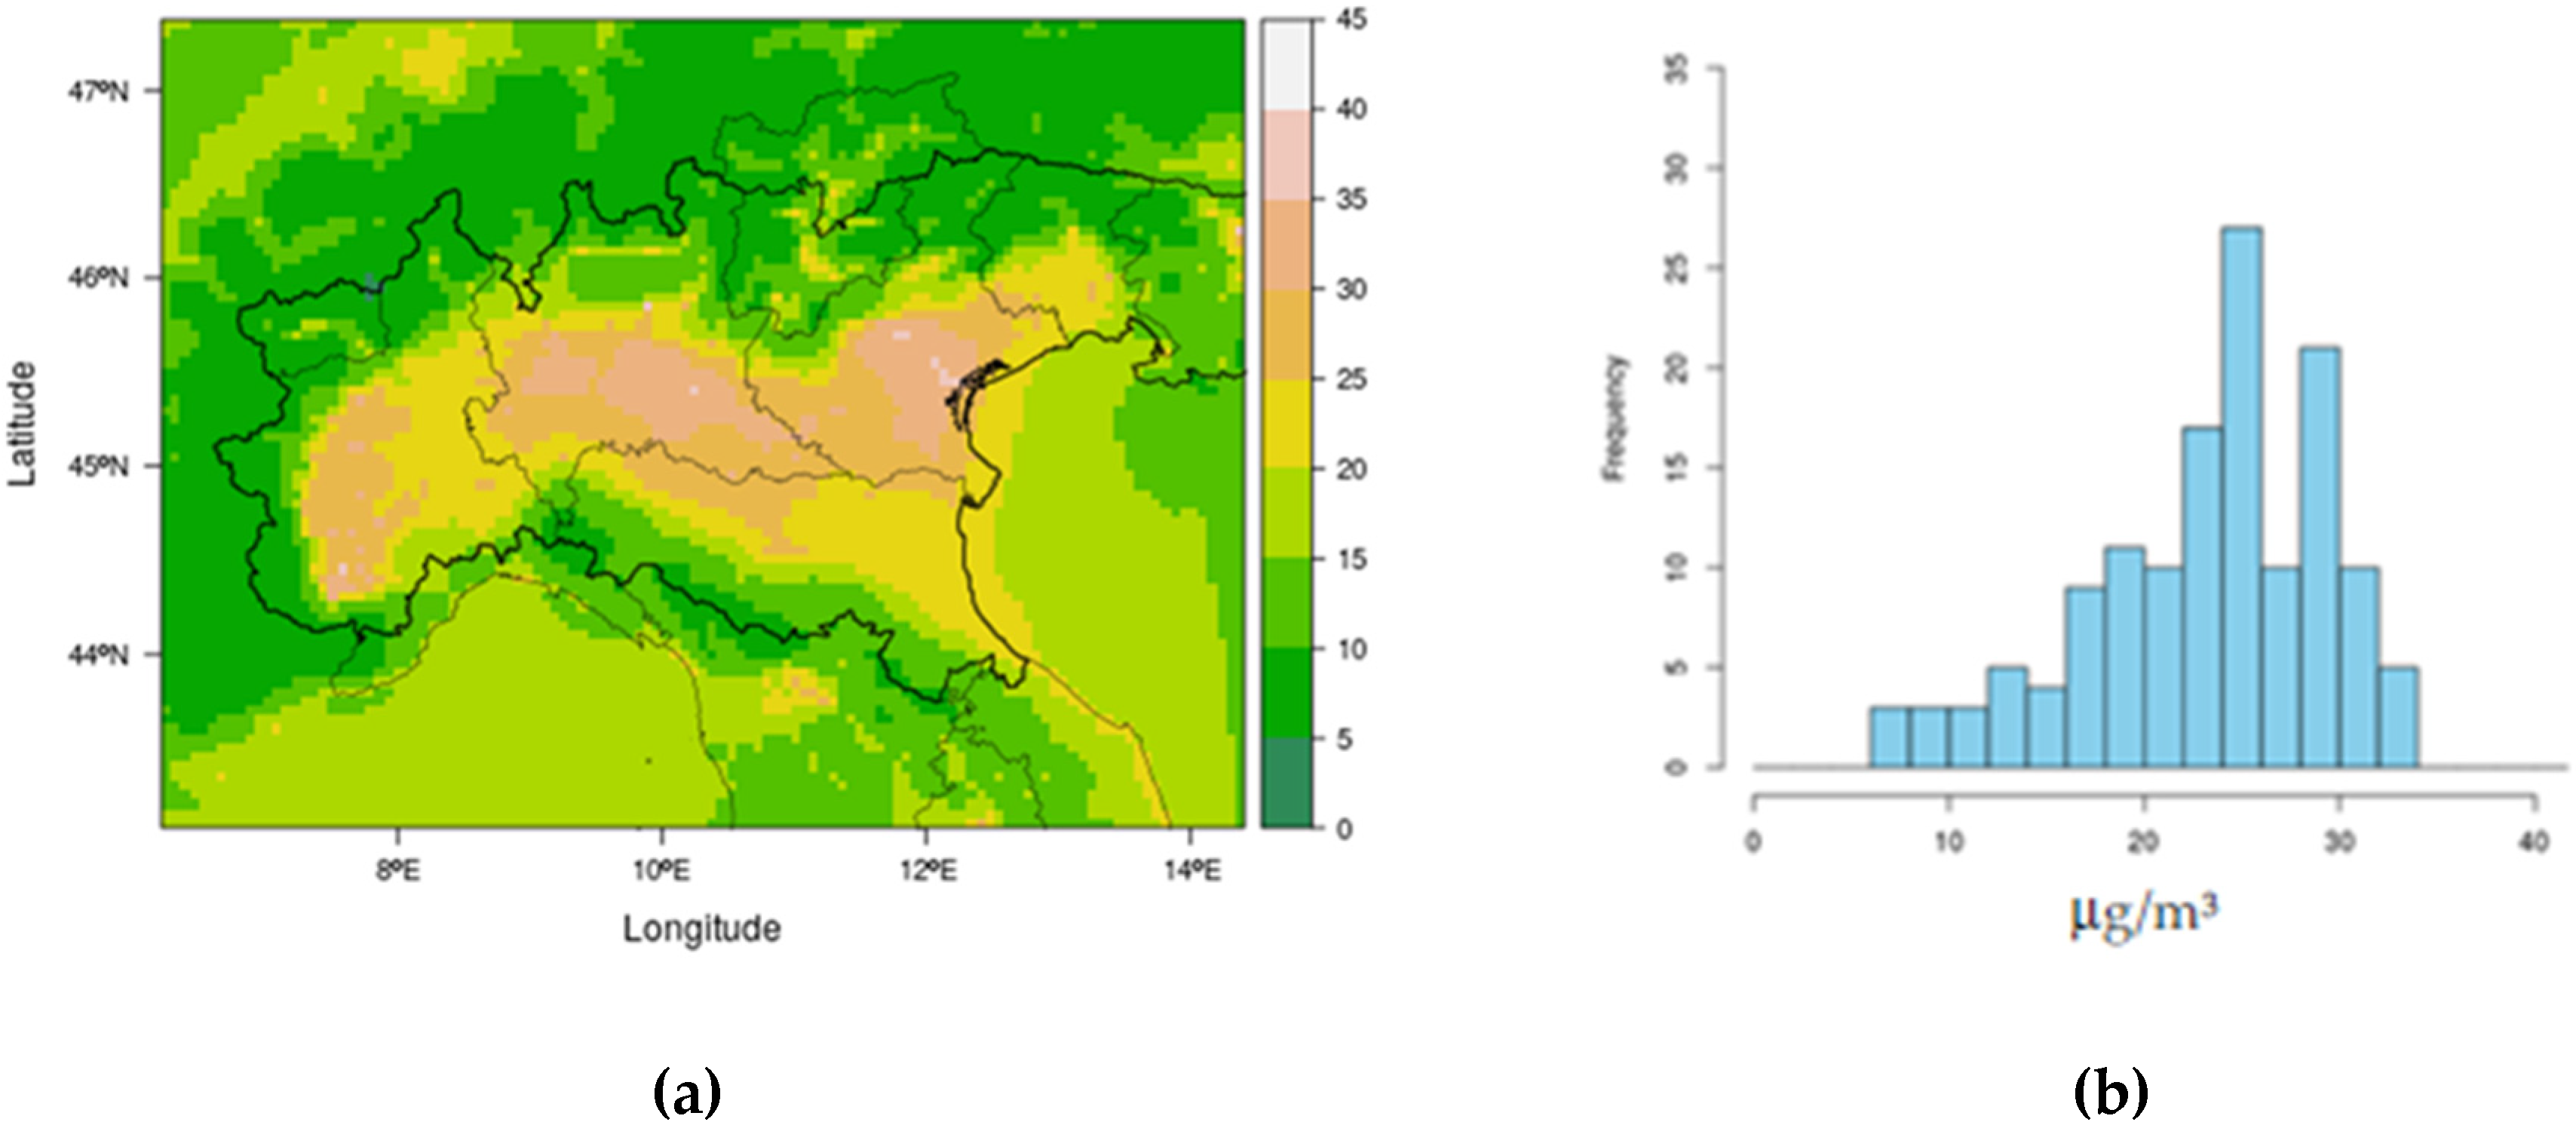
Figure 8) and NO
2 (
Figure 9) annual average calculated by the unbiased model. In the baseline scenario, the PM
10 annual average is lower than the LV of 40 μg/m
3, but most stations exceed the ELV of 28 μg/m
3. That means that the daily LV for PM
10 is not attained. About ten stations exceed the LV for NO
2 (
Figure 9).
4.4. Emissions Scenarios Simulation
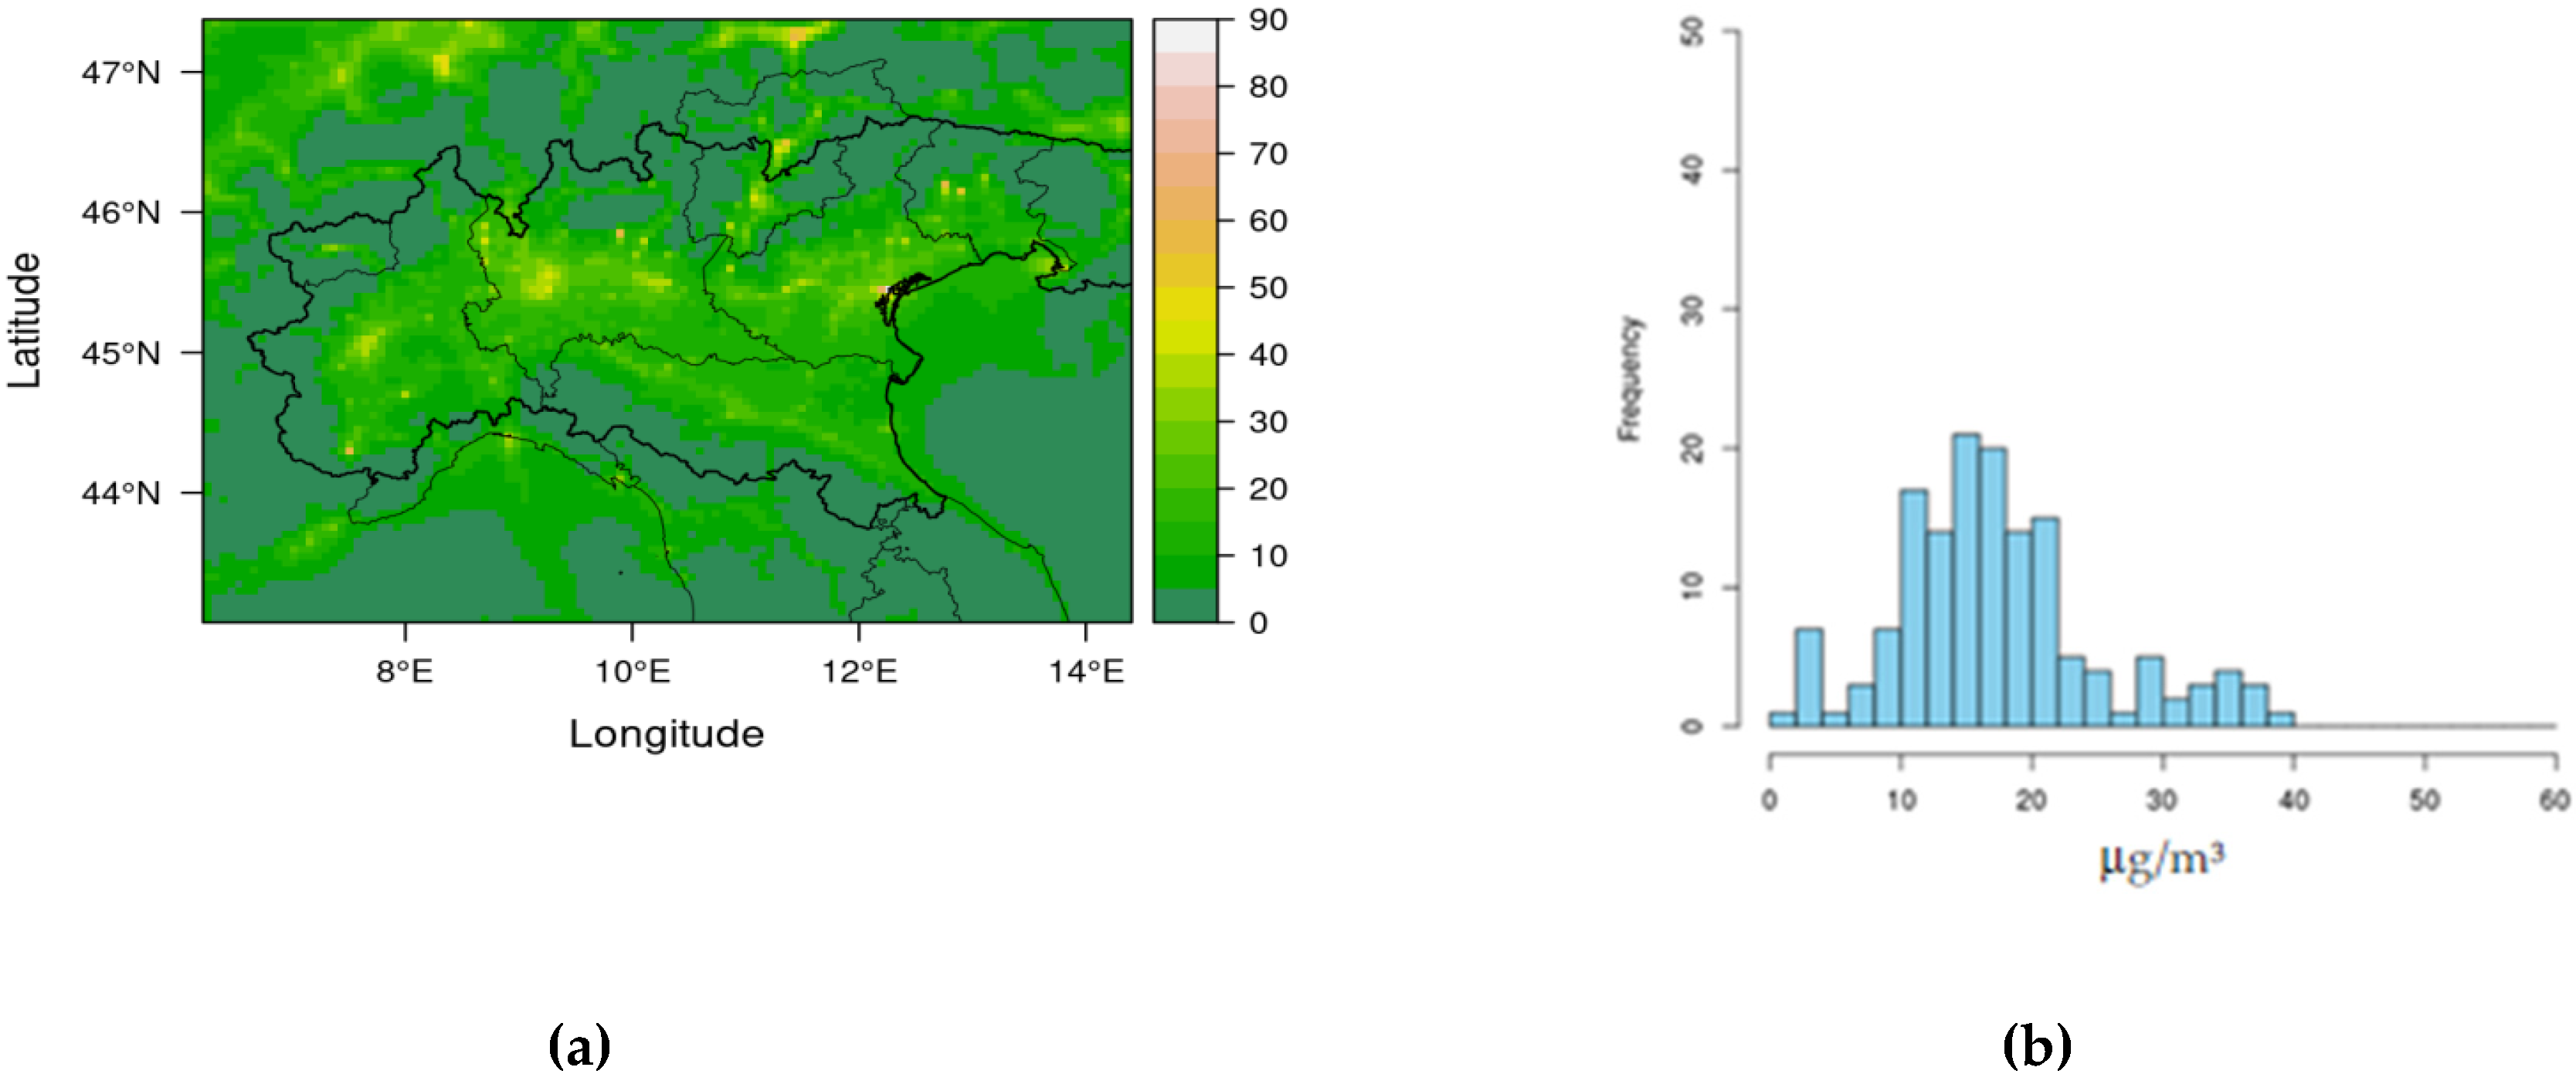
In the current legislation emissions scenario (CLE2025), the decrease of PM
10 annual average is evident in the central area of the Po Valley—the area of the big Milan urban agglomeration—and in correspondence with the main traffic arteries, although the annual values for PM
10 concentration are higher than the ELV also in several background stations. The average reduction of the ground level concentration of PM
10 is around 10% (
Figure 10) with respect to the baseline. For NO
2, the annual average concentration is lower than AQD LV in the background stations, with an average reduction of about 20% (
Figure 11).
The above results indicate that, for PM10, the compliance with AQD directive cannot be achieved by the year 2025. Therefore, as far as the CLE2025 emission scenarios are concerned, further emission-reduction actions are needed to reach the compliance.
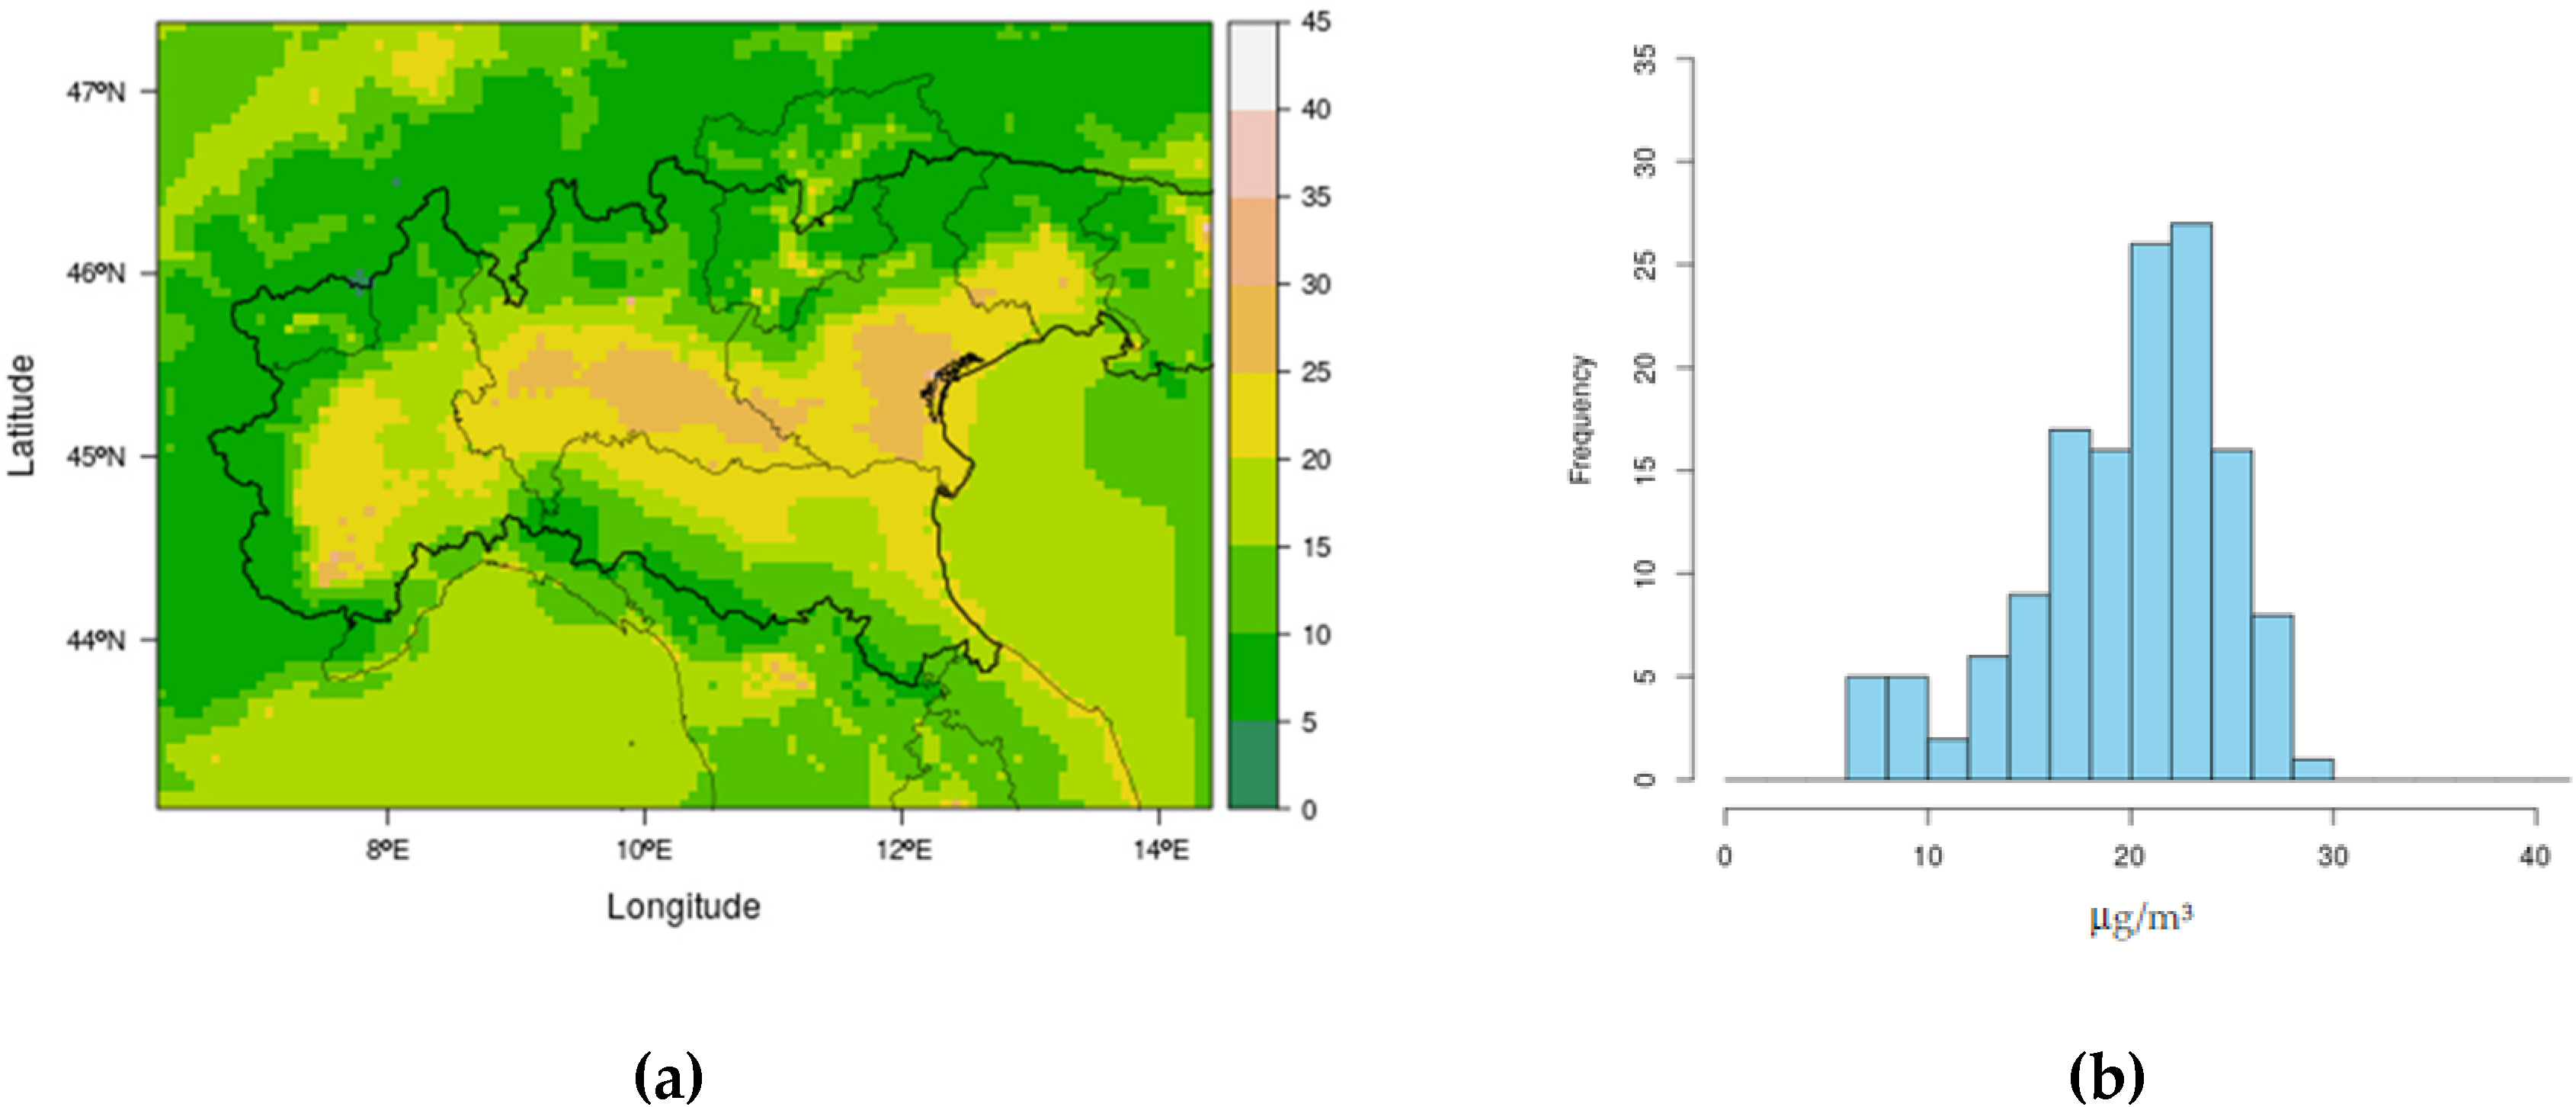
The results for the model simulation of the action-plans emissions scenario (APS2025) are shown in
Figure 12 for PM
10 and in
Figure 13 for NO
2.
The exceedances areas (PM10 > 28 μg/m3) are strongly reduced in this scenario, and only one background station has a PM10 annual average concentration greater than the ELV. The average reduction of the ground-level concentration of PM10, compared to the baseline case, is around 20%.
All background stations respect AQD LV for NO2 and the average reduction compared to baseline case is about 35%.
The above results indicate that the compliance with AQD directive could be achieved in year 2025 by the full implementation of the sum of all the emissions reduction measures prescribed by the current legislation, the air-quality plans and Po valley agreements, i.e., in the APS2025 scenario. In this scenario, the overall emissions reductions of the main pollutants, compared with the emissions levels in the baseline, range between 20% (NH3) and 40% (PM10 and NOx). To reach such a strong decrease in emissions, a deep transformation of the economy of the region and of the lifestyle of its population should take place. Low emissions technologies should be introduced in all sectors, with considerable economic and social impacts.
The next question we address is as follows: Which is the role of the geographical characteristics and climatological conditions of the Po Valley? Due to those features, does the task of the complying to the European limits values in the Po Valley bear an element of disparity when compared to other regions of Europe and, therefore, to other member states? In the following section, a numerical experiment attempting to answer these questions is shown.
5. Meteorological Scenario
The topographical characteristics of the Po Valley strongly influence the local meteorology, leading to the typical climate of the region [
17,
18] characterized by low winds, particularly weak in the winter months, with average speeds that are among the lowest in comparison to the rest of the European continent. In the Po Valley, due to the average weakness of the wind speed, the most important contribution to vertical mixing in the PBL (Planetary Boundary Layer) comes from the thermal component (vertical overturning due to buoyancy, mostly in summer and intermediate seasons). On the contrary, during wintertime, there are frequent thermal inversion conditions near the ground, particularly at night. This creates a single layer of diffuse and uniform pollution in the lowermost portion of atmosphere. Under these conditions, which can sometimes persist throughout the day, the dispersion of pollutants is severely hampered, with the primary pollutants tending to progressively accumulate near the ground, reaching high concentrations, and therefore favoring the formation of further secondary pollution. During these episodes, pollution is no longer limited to urban and industrial areas, but homogeneous high concentrations are recorded throughout the basin, including in rural areas, far from the emission sources. These explains why in the Po Valley the concentrations of most pollutants show a marked seasonal cycle, with winter values much higher than summer values, which in turn explains why almost all exceedances of LV occur in winter.
To check the sensitivity of the simulated monthly mean aerosol and gas concentration (PM10 and NO2) in the Po valley upon the meteorology of the region (i.e., to highlight how a calm meteorological condition can impact on the pollutants concentration), we performed an adhoc experiment. The aim of the experiment is to investigate the change in concentrations, with the same emission levels, under different and “realistic” meteorological conditions.
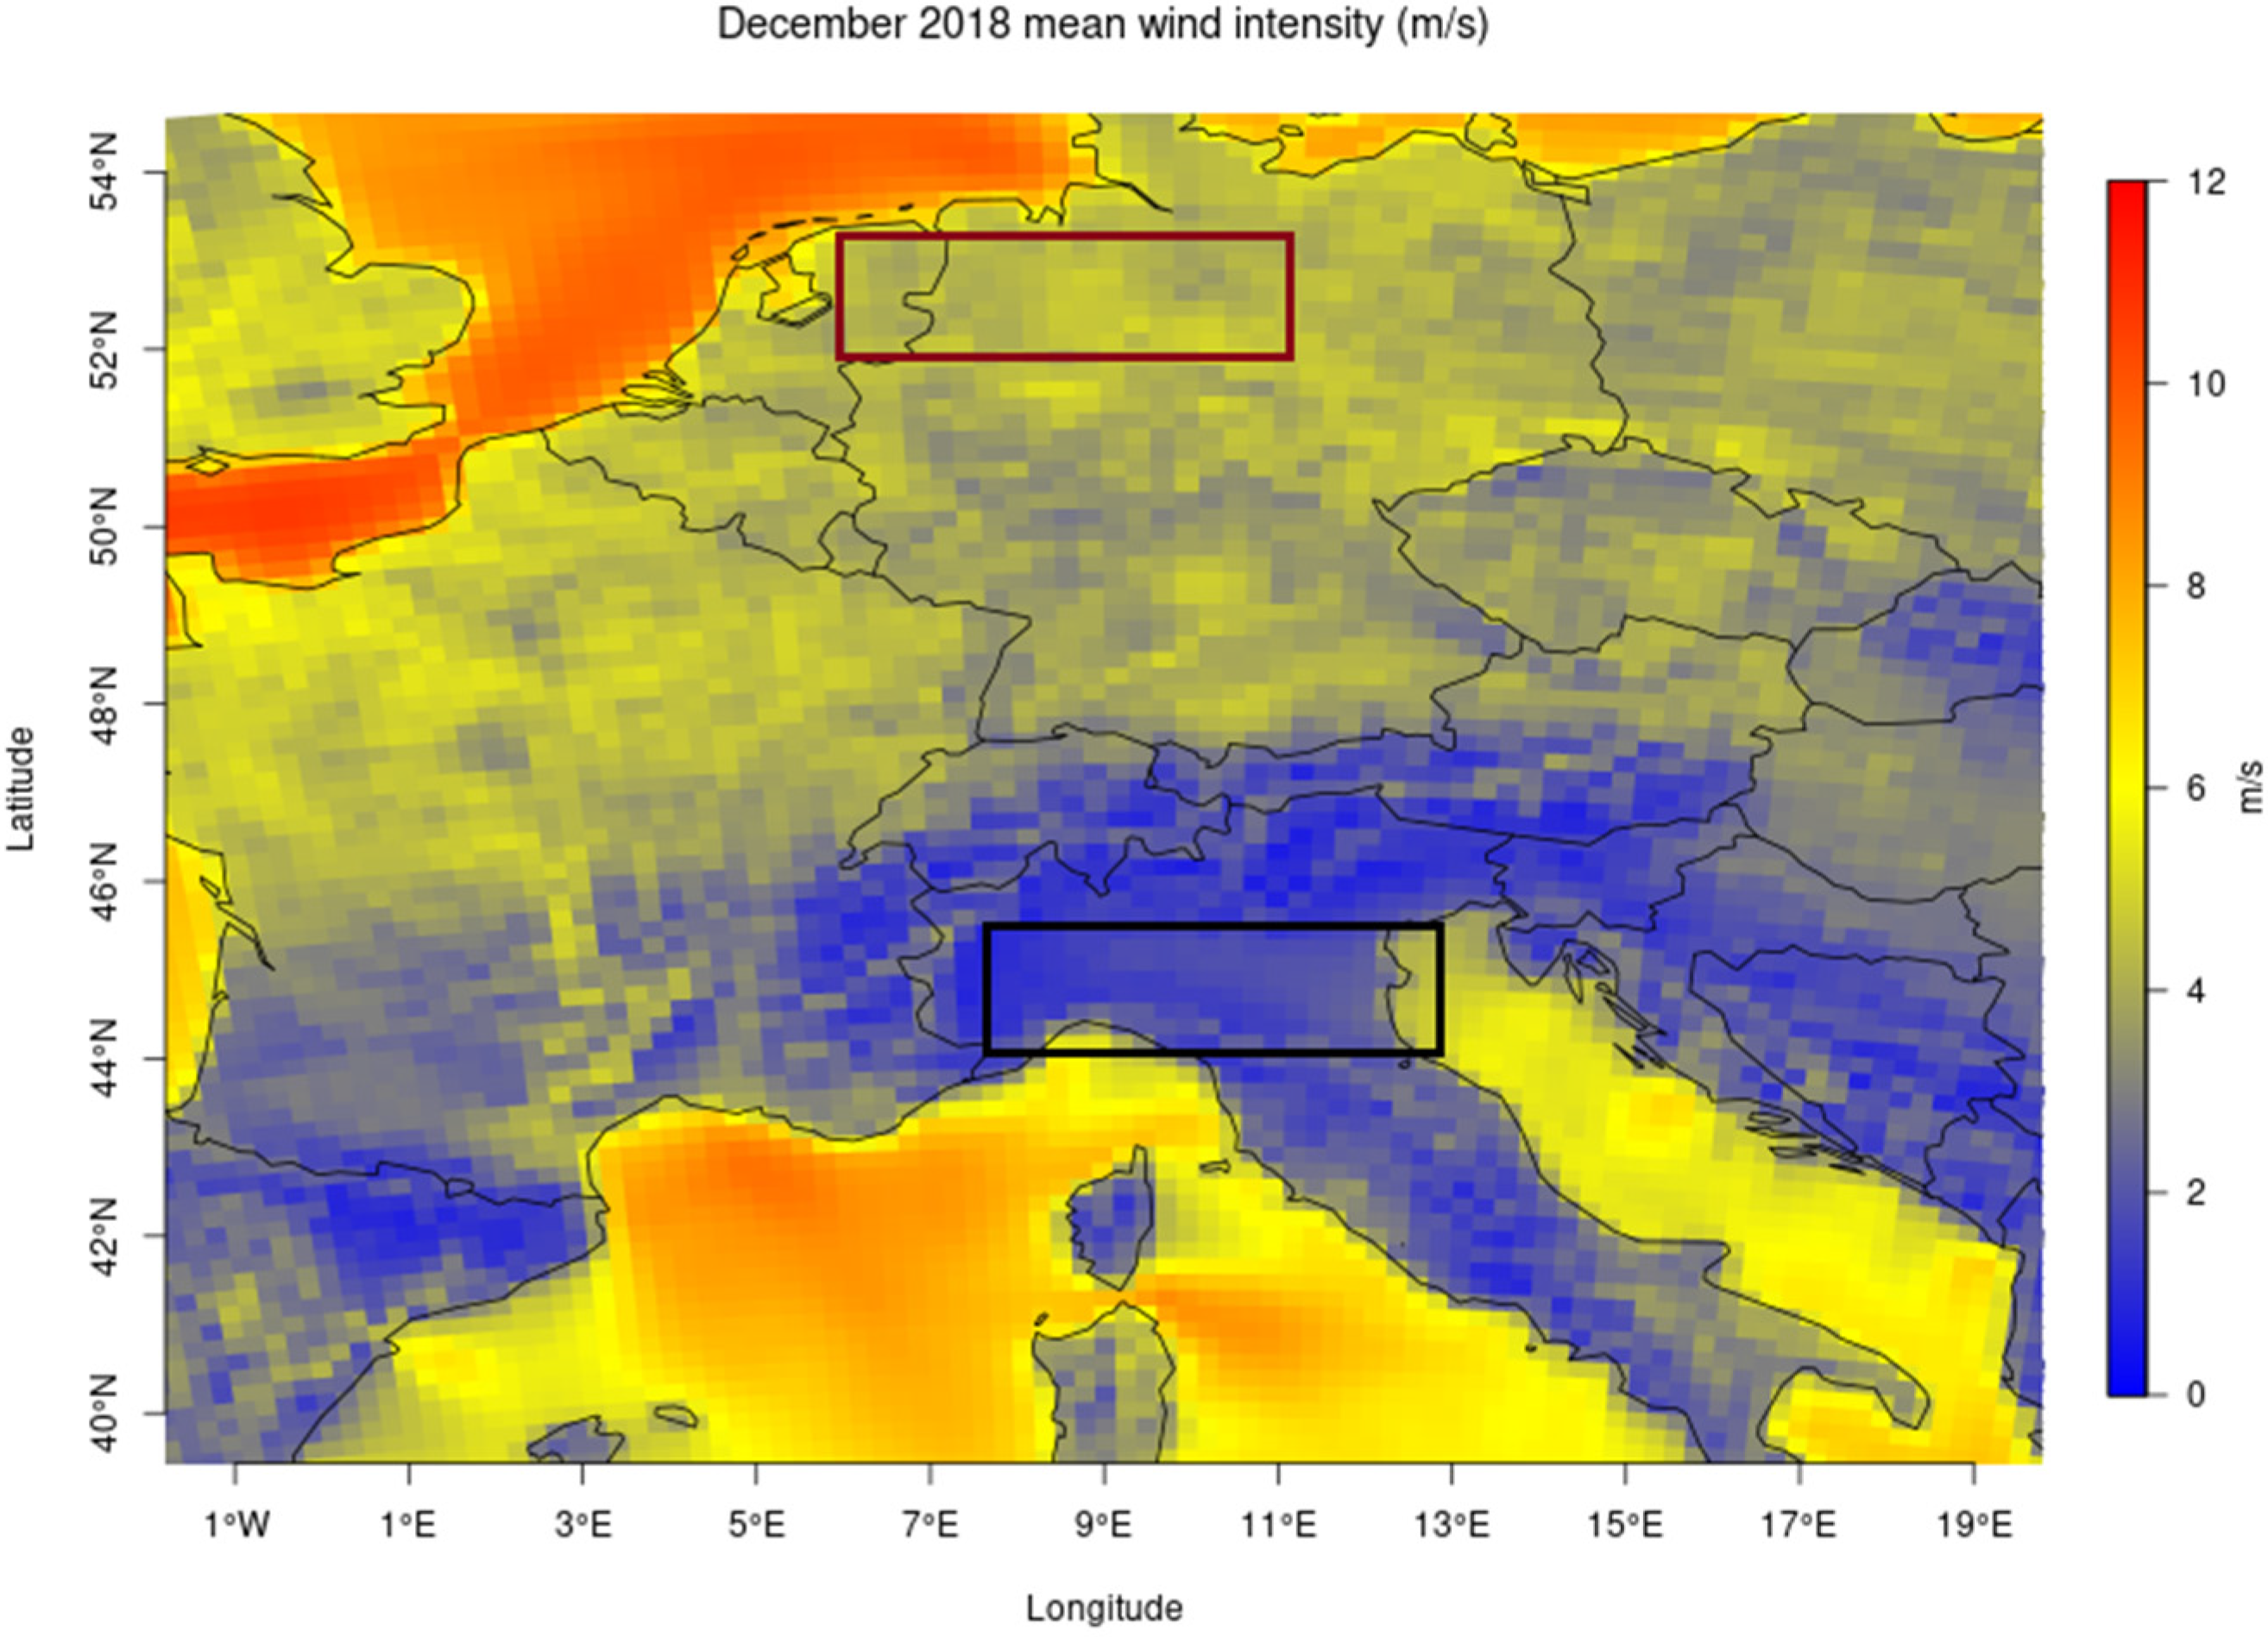
This consisted of simulating pollutant concentrations over the Po Valley, in the presence of meteorological conditions more favorable to the dispersion of pollutants, at least compared to those which occur in situations typical of winter months. This investigation was therefore an attempt to provide a quantitative evaluation of how the peculiar mesoscale atmospheric circulation of the Po Valley, linked to low-level frequent stagnant conditions, influences the pollutant concentrations during winter months. We first identified a geographical area in which reasonably favorable dispersion conditions occurred during December 2018, and then we used the atmospheric variables estimated in this area (i.e., the upper box of
Figure 14) as meteorological input for the experimental run. We selected an area of Central Europe in which the 10m wind speed averaged over December 2018, as estimated through daily analyses of the COSMO-5M model, showed considerably higher values than in the Po Valley. As a caveat, it is worth pointing out that this operation is internally consistent only if we consider Northern Italy substantially as a flat region
The experiment then consisted of running two examples of the NINFA system in hindcast mode simulating the air quality for a one-month period with an integration domain which falls inside the Po basin (lowermost blue box,
Figure 14). In both cases, the anthropogenic emissions were taken from baseline scenario. The first run uses the standard Po Valley meteorology during December 2018, while in the second, the meteorology is substituted with the meteorology present in Northern–Central Europe (uppermost box of
Figure 14) in the same period (Meteotest Scenario).
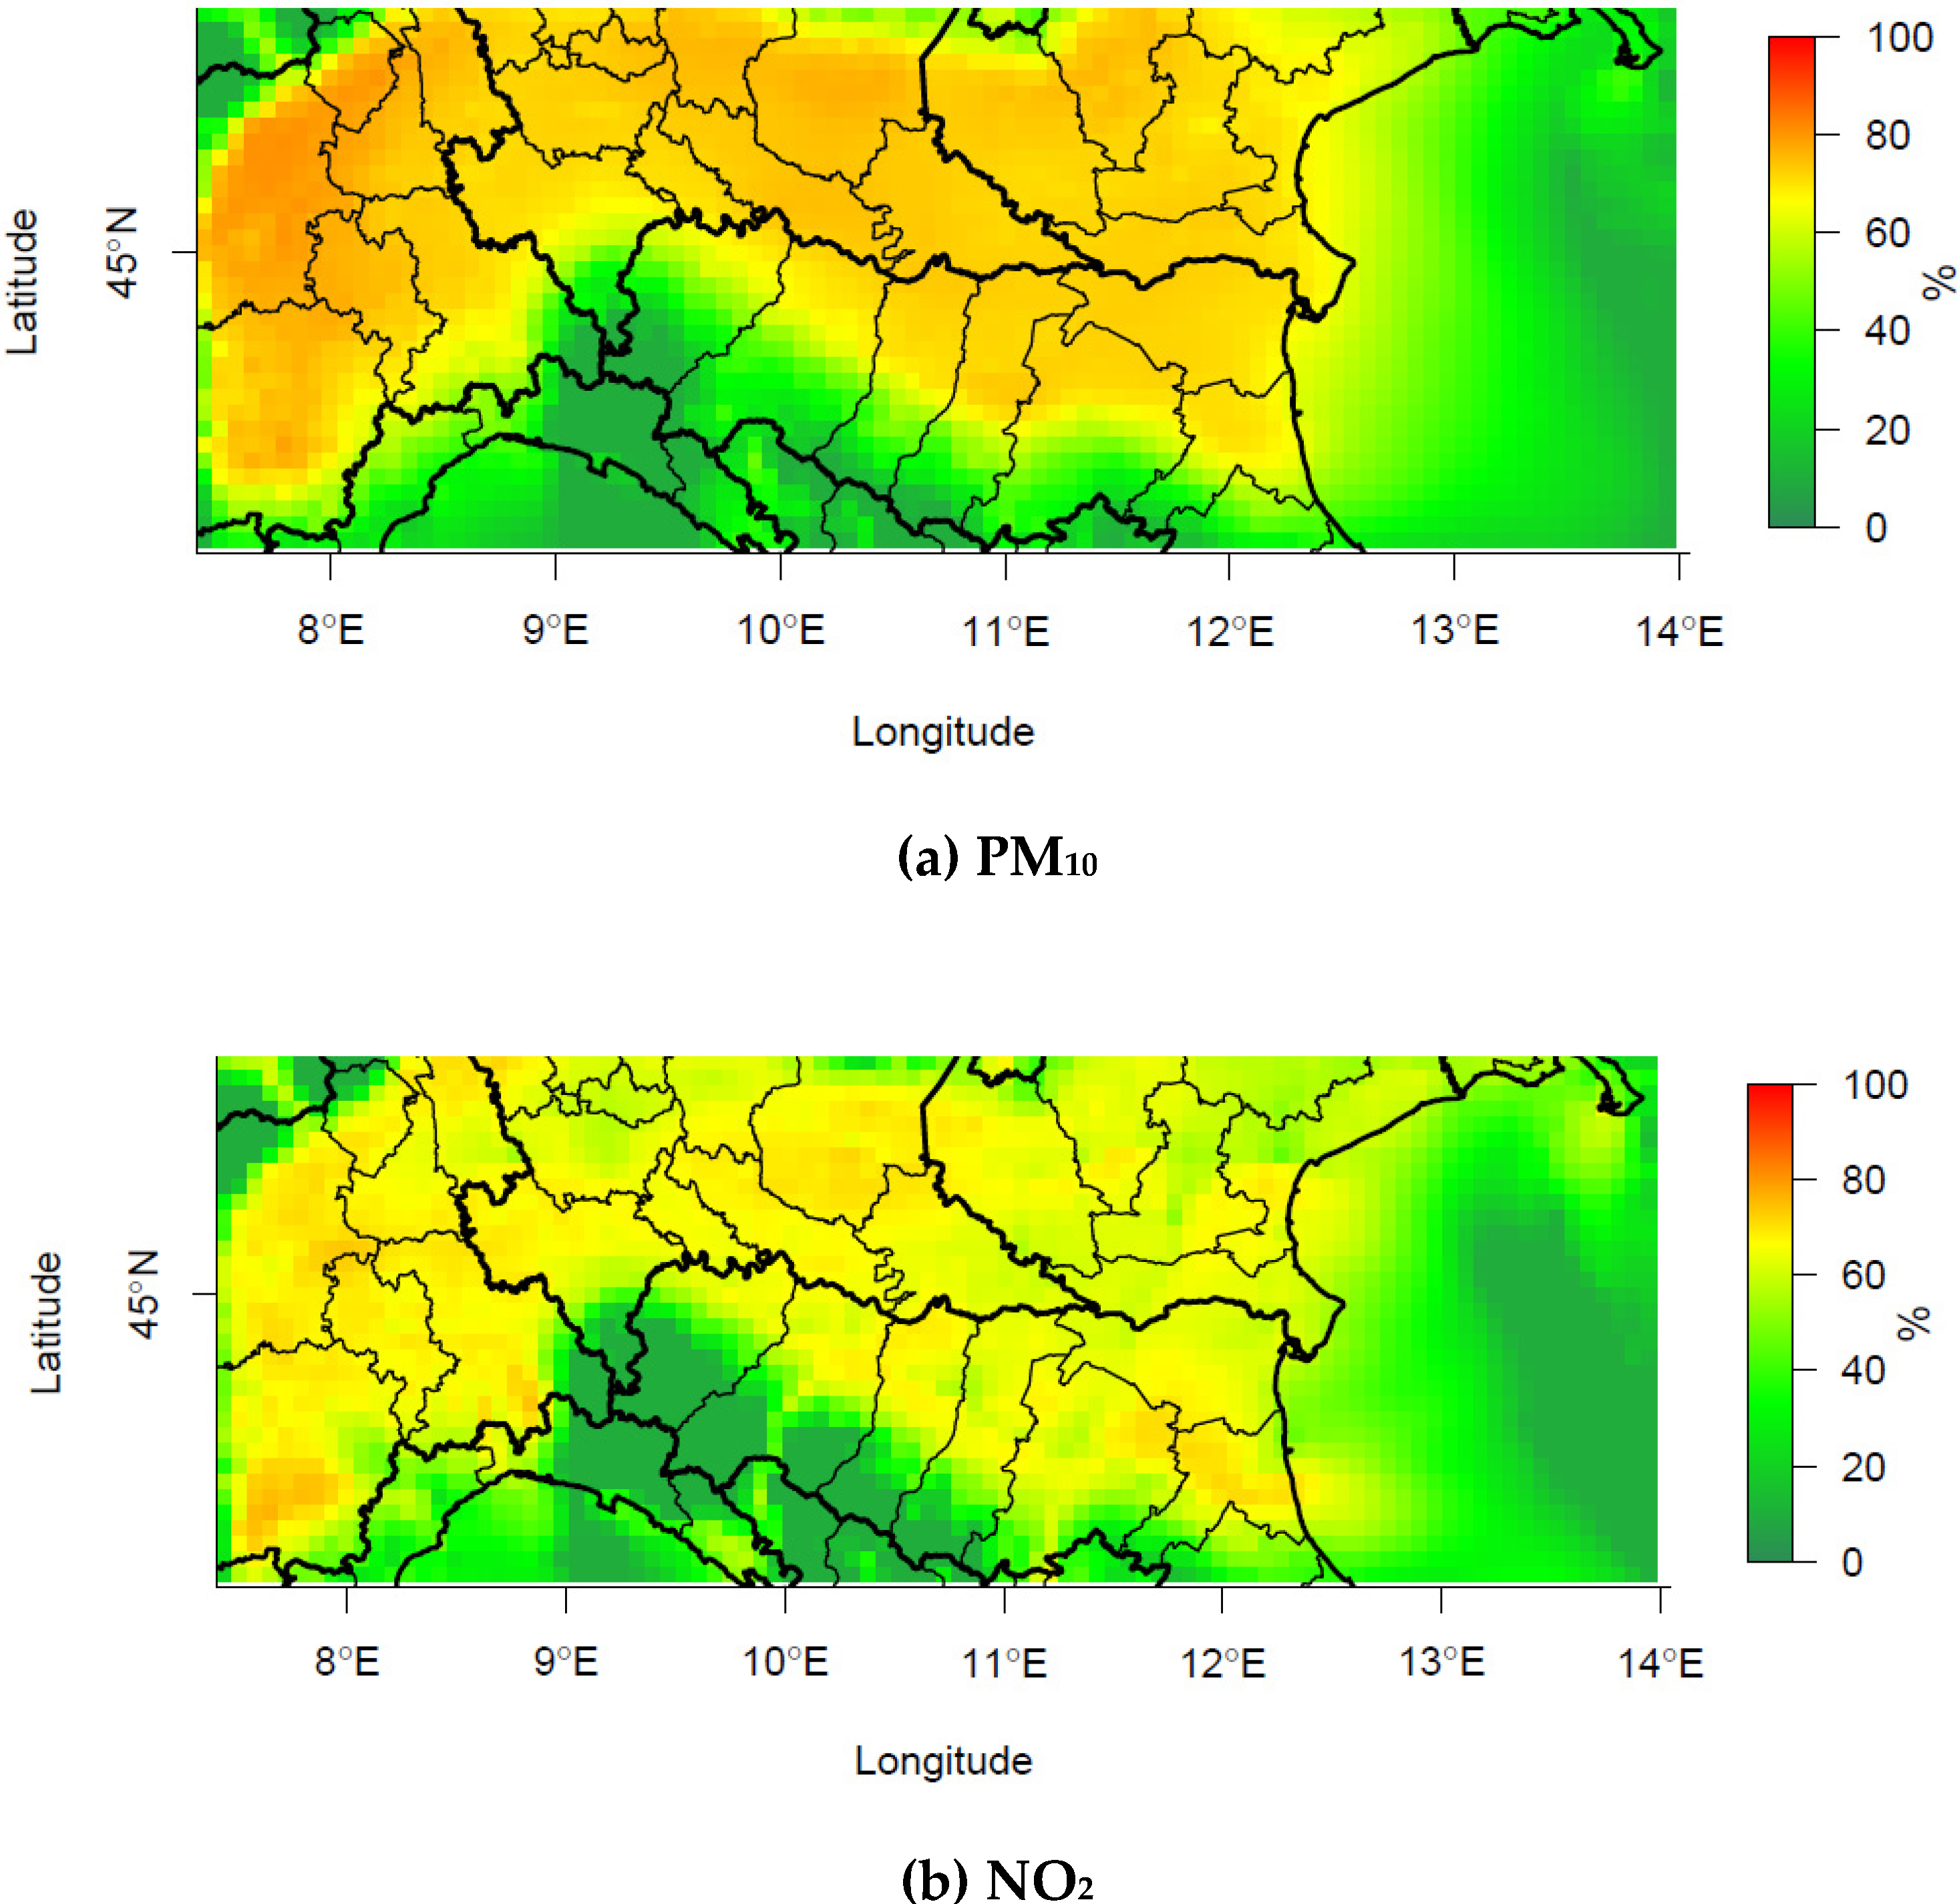
The ground level pollutants concentration obtained through the two simulations are then compared in terms of monthly averaged values, instead of day-by-day values. The monthly average is chosen to filter out the day-to-day high-frequency variability of the meteorological systems acting at the synoptic scale. The main results obtained are presented in the next two figures, in which the decrease of the monthly average concentration of PM10 and NO2 for the two integrations is compared.
The maps clearly show an overall reduction in the Meteotest Scenario, with respect to the baseline scenario:
For PM10 concentration, a decrease of about 60–70% in the plane areas. The maximum decrease, up to 70–80%, is in the west part of the Po Valley.
For NO2 concentration, the decrease in the Meteotest Scenario is about 60%.
6. Conclusions
This work describes the air-quality monitoring and evaluation system implemented in the first phase of the project LIFE-IP PREPAIR. It also illustrates the results of a first application of the system aimed at evaluating the level of air pollutants expected in the Po Valley in the year 2025 as it might result from the possible implementation of several emission reduction scenarios. The results of these assessments are used to support air-quality improvement policies by the regional administrations, which are partners of the project.
The PREPAIR air-quality monitoring and evaluation system allows us to collect and share, among the project partners, data and information necessary to evaluate the effectiveness of air-quality plans and to monitor the state of implementation of the measures. The system is composed of a platform for collecting and sharing data on emissions, a web-tool for monitoring the state of implementation of the measures of the air-quality plans and by a platform for sharing the data registered by the monitoring stations. These data are used as input to a chemical transport model (NINFA) bias-corrected with the observed data. The model is integrated to evaluate the air quality in the Po Valley and in Slovenia.
The emissions inventory referring to the current situation (baseline scenario) identifies the main contributions to the emissions of particulate matter (PM) and precursors. Primary PM
10 emissions are mainly due to the macro-sector of non-industrial combustion (
Table 2), with a strong contribution from domestic biomass combustion. The second major contribution comes from road transport, which, together with combustion in productive activities, represents the main contribution to NO
X emissions. Ammonia, an important precursor, together with VOCs and NOx, of secondary PM, is emitted almost entirely from agriculture. Volatile organic compounds (VOCs) are mainly emitted using solvents. The evaluation of the baseline scenario by the NINFA model, in typical meteorological conditions of the Po Valley (year 2016), confirms the presence of large exceedance areas of the annual and daily limit values for PM
10 (
Figure 8) and the occurrence of a considerable number of stations recording values higher than the Limit Value for NO
2 (
Figure 9).
In the emission scenario that considers the emissions reduction due to enforcement in 2025 of the current legislation applied to the current baseline scenario, (CLE2025), the limit values for PM
10 are not reached (
Figure 10 and
Figure 11). Consequently, in order to reach LVs, more measures must be applied to contain emissions. These measures are introduced in Italy by a series of regional plans and national agreements. A further element is represented by the capacity building measures contained in the PREPAIR project. It is estimated that these measures would lead to an overall emissions reduction ranging between 20% (NH
3) and 40% (PM
10 and NOx). These reductions were used to build the further emission scenario (APS2025). The evaluation of the air quality in this scenario leads to the conclusion that, in the typical meteorological conditions of the Po Valley, the annual and daily limit values for PM
10 would be attained (
Figure 12). The annual limit value for NO
2 would be attained in all the background stations (
Figure 13).
A further numerical simulation based upon the same baseline scenario, with alternative meteorological conditions typical of Central–Northern Europe, shows that, with the same emission levels, the PM
10 concentrations in the central Po Valley would be lowered to about 60%, (
Figure 15). This shows, convincingly, the disadvantages always faced by the Italian Po Valley regions in trying to comply with LVs, compared to other regions and member states of the EU.
As said before, one of the goals of the PREPAIR project is to assist the administrations in implementing the air-quality plans, in order to comply with the European air-quality standards. The indications for policy makers that arise from this preliminary assessment can be summarized as follows:
A strong role in reducing emissions is played by European policies, but a rigorous application of all further measures envisaged by regional plans and national agreements is necessary. The European legislation measures that make up the CLE2025 scenario act mainly on the transport sectors, through the introduction of new approval limits for vehicles and the progressive replacement of internal combustion technology with electric technology.
The measures of the regional air-quality plans mainly act on the sectors of regional competence, such as agriculture, which produces ammonia (NH3). The reductions of ammonia are due solely to the measures implemented by the regional Rural Development Programmes (RDP). Other relevant sectors on which to act are the containment of emissions due to the domestic combustion of biomass and mobility management measures.
The rigorous application of these measures has a strong socioeconomic impact. It is therefore necessary to accompany these measures with initiatives aimed at improving the speed of their application and their social acceptability. The LIFE-IP PREPAIR project plays an important role in helping a quicker diffusion of advanced technologies and in changing individual behavior in order to accelerate the implementation of the AQ plans. Capacity building actions must be further strengthened by incentives and by research into use and development of low-emission technologies.
To achieve the goals of the air-quality improving policies, it is therefore indispensable that European, national, regional and local levels shall cooperate closely.
7. Post Scriptum
During the COVID-19 pandemic, the relationships between air pollution and health are becoming more and more significant, showing once again the importance of actions aimed at improving air quality [
19].
As far as the project PREPAIR is concerned, due to the so-called lockdown measures adopted in Italy and over the world to contain the pandemic, some data will not be available in the period. On the other side, the lockdown allows to get data on scenarios so far only hypothesized (such as the reduction of traffic on the roads and the reduction of the industrial consumptions) in order to improve monitoring and evaluation modelling. Therefore, it has been decided inside the project itself to realize an analysis for the assessment of air quality in the Po Valley and in Slovenia during the period of application of the COVID-19 measures (COVID lock down). The outcomes of this analysis will be available for epidemiological studies related to the effects of air pollution on health, also with reference to the COVID-19 pandemic.
Author Contributions
Data curation, M.S.; funding acquisition, K.R.; methodology, M.S., R.A. and M.V.; project administration, K.R. and M.D.; software, M.S., R.A., M.V. and G.G.; supervision, K.R. and M.D.; validation, G.G. R.A.; writing—original draft, K.R.; writing—review and editing, M.D., M.S., R.A. and M.V. All authors have read and agreed the published version of the manuscript.
Funding
This study was developed under the project LIFE-IP PREPAIR (Po Regions Engaged to Policies of AIR), which was co-funded by the European Union LIFE Program, in 2016, Grant Number LIFE15 IPE/IT/000013.
Acknowledgments
Acknowledgments are given to all the Beneficiaries of the project LIFE-IP PREPAIR: Emilia-Romagna Region (Project Coordinator) Veneto Region, Lombardy Region, Piedmont Region, Friuli Venezia Giulia Region, Autonomous Province of Trento, Regional Agency for Environment of Emilia-Romagna (ARPAE), Regional Agency for Environment of Veneto, Regional Agency for Environment of Piedmont, Regional Agency for Environmental Protection of Lombardy, Environmental Protection Agency of Valle d’Aosta, Environmental Protection Agency of Friuli Venezia Giulia, Slovenian Environment Agency, Municipality of Bologna, Municipality of Milan, City of Turin, ART-ER, Lombardy Foundation for Environment. We are grateful to Stefano Tibaldi for several useful comments about this work.
Conflicts of Interest
The authors declare no conflict of interest.
References
- AQD. Directive 2008/50/EC of the European Parliament and of the Council of 21 May 522 2008 on Ambient Air Quality and Cleaner Air for Europe. Off. J. 2008, 152, 1–44. Available online: http://eur-lex.europa.eu/LexUriServ/LexUriServ.do?uri=OJ:L:2008:152:0001:0044:EN:PDF (accessed on 8 July 2012).
- Monterio, A.; Durka, P.; Flandorfer, C.; Georgieva, E.; Guerreiro, C.; Kushta, J.; Malherbe, L.; Maiheu, B.; Miranda, A.I.; Santos, G.; et al. Strengths and weaknesses of the FAIRMODE benchmarking. Air Qual. Atmos. Health 2018, 11, 373–383. [Google Scholar] [CrossRef]
- Viaene, P.; Janssen, S.; Thunis, P.; Trimpeneers, E.; Wesseling, J.; Montero, A.; Miranda, A.; Stocker, J.; Olesen, H.R.; Guerreiro, C.; et al. Guidance Document on Model Quality Objectives and Benchmarking. 2015. Available online: https://fairmode.jrc.ec.europa.eu/document/fairmode/WG1/Guidance_MQO_Bench_vs1.0.pdf (accessed on 10 March 2017).
- LIFE PREPAIR Presentation of the Project. Available online: http://www.lifeprepair.eu/wp-content/uploads/2018/02/PREPAIR_introduction-to-the-project.pdf (accessed on 10 December 2019).
- Marongiu, A.; Angelino, E.; Fossati, G.; Moretti, M.; Pantaleo, A.; Peroni, E. LIFE IP PREPAIR ACTION A.1 Emissions Data Set—Final Report. 2019. Available online: http://www.lifeprepair.eu/wp-content/uploads/2017/06/Emissions-dataset_final-report.pdf (accessed on 4 January 2020).
- INEMAR Official Site. Available online: http://www.inemar (accessed on 10 December 2019).
- EMEP/EEA Air Pollutant Emission Inventory Guidebook. 2019. Available online: https://www.eea.europa (accessed on 10 December 2019).
- GAINS Italy Online—Air Quality and Greenhouse Gases—IIASAgains.iiasa.ac.at Gains. Available online: https://gains.iiasa.ac.at/gains/IT/index.login?logout=1 (accessed on 10 January 2020).
- Stortini, M.; Amorati, R.; Deserti, M.; Ramponi, L.; Carbonara, C.; Raffaelli, K.; Pillon, S.; Bonafè, G.; Petrini, A.; Clemente, M.; et al. LIFE IP PREPAIR ACTION A3 Preliminary Assessment of the Air Quality Plans—Final Report. 2019. Available online: http://www.lifeprepair.eu/wp-content/uploads/2017/06/PRELIMINARY-ASSESSMENT-OF-THE-AIR-QUALITY-PLANS.pdf (accessed on 10 January 2020).
- Mailler, S.; Menut, L.; Khvorostyanov, D.; Valari, M.; Couvidat, F.; Siour, G.; Turquety, S.; Briant, R.; Tuccella, P.; Bessagnet, B.; et al. CHIMERE-2017: From urban to hemispheric chemistry-transport modeling. Geosci. Model Dev. 2017, 10, 2397–2423. [Google Scholar] [CrossRef]
- Doms, G.; Baldauf, M. A Description of the Non Hydrostatic Regional COSMO-Model. Part I: Dynamics and Numeric. User Guide Documentation. 2018. Available online: www.cosmo-model.org (accessed on 10 January 2020).
- Steppeler, J.; Doms, G.; Schättler, U.; Bitzer, H.W.; Gassmann, A.; Damrath, U.; Gregoric, G. Meso-gamma scale forecasts using the non-hydrostatic model LM. Meteorol. Atmos. Phys. 2003, 82, 75–96. [Google Scholar] [CrossRef]
- Bienvenue sur PREVAIR. Available online: http://www2.prevair (accessed on 15 December 2019).
- Stortini, M.; Arvani, B.; Deserti, M. Operational Forecast and Daily Assessment of the Air Quality in Italy: A Copernicus-CAMS Downstream Service. Atmosphere 2020. “Special Issue Recent Advances of Air Pollution Studies in Italy” (under review). [Google Scholar]
- Deserti, M.; Stortini, M.; Minguzzi, E.; Maccaferrri, S. RIAT+, an integrated assessment tool useful for air quality planning: An application to Emilia Romagna region. Int. J. Environ. Pollut. 2019, 65, 59–70. [Google Scholar] [CrossRef]
- Stedman, J.R.; Kent, A.J.; Grice, S.; Bush, T.J.; Derwent, R.G. A consistent method for modeling PM10 and PM2.5 concentrations across the United Kingdom in 2004 for air quality assessment. Atmos. Environ. 2007, 41, 161–172. [Google Scholar] [CrossRef]
- Finardi, S.; Pellegrini, U. Systematic analysis of meteorological conditions causing severe urban air pollution episodes in the central Po Valley. In Proceedings of the 9th International Conference on Harmonisation within Atmospheric Dispersion Modelling for Regulatory Purposes, Garmish-Partenkirchen, Germany, 1–4 June 2004; pp. 250–254. [Google Scholar]
- Pernigotti, D.; Georgieva, E.; Thunis, P.; Bessagnet, B. Impact of meteorological modelling on air quality: Summer and winter episodes in the Po valley (Northern Italy). Int. J. Envir. Poll. 2014, 50, 111–119. [Google Scholar] [CrossRef]
- Wu, X.; Nethery, R.C.; Sabath, M.B.; Braun, D.; Dominici, F. Exposure to Air Pollution and COVID-19 Mortality in the United States; Harvard T.H. Chan School of Public Heath: Boston, MA, USA, 2020. [Google Scholar] [CrossRef]
Figure 1.
Po Regions Engaged to Policies of Air (PREPAIR)project target area.
Figure 1.
Po Regions Engaged to Policies of Air (PREPAIR)project target area.
Figure 2.
Emission scenarios for NOx
Figure 2.
Emission scenarios for NOx
Figure 3.
Emission scenarios for PM10.
Figure 3.
Emission scenarios for PM10.
Figure 4.
Emission scenarios for NH3.
Figure 4.
Emission scenarios for NH3.
Figure 5.
Emission scenarios for SO2.
Figure 5.
Emission scenarios for SO2.
Figure 6.
NOx emissions (Ton/year) for three simulated scenarios: (a) baseline; (b) CLE2025; and (c) APS2025.
Figure 6.
NOx emissions (Ton/year) for three simulated scenarios: (a) baseline; (b) CLE2025; and (c) APS2025.
Figure 7.
Station network for data sharing.
Figure 7.
Station network for data sharing.
Figure 8.
Baseline PM10: (a) ground field of annual average concentration (μg/m3); (b) frequency distribution of annual average concentration in background stations.
Figure 8.
Baseline PM10: (a) ground field of annual average concentration (μg/m3); (b) frequency distribution of annual average concentration in background stations.
Figure 9.
Baseline NO2: (a) ground field of annual average concentration (μg/m3); (b) frequency distribution of annual average concentration in background stations.
Figure 9.
Baseline NO2: (a) ground field of annual average concentration (μg/m3); (b) frequency distribution of annual average concentration in background stations.
Figure 10.
CLE2025 PM10: (a) ground field of annual average concentration (μg/m3); (b) frequency distribution of annual average concentration in background stations.
Figure 10.
CLE2025 PM10: (a) ground field of annual average concentration (μg/m3); (b) frequency distribution of annual average concentration in background stations.
Figure 11.
CLE2025 NO2: (a) ground field of annual average concentration (μg/m3); (b) frequency distribution of annual average concentration in background stations.
Figure 11.
CLE2025 NO2: (a) ground field of annual average concentration (μg/m3); (b) frequency distribution of annual average concentration in background stations.
Figure 12.
APS2025 PM10: (a) ground level field(μg/m3); (b) frequency distribution of annual average concentration in background stations.
Figure 12.
APS2025 PM10: (a) ground level field(μg/m3); (b) frequency distribution of annual average concentration in background stations.
Figure 13.
APS2025 NO2: (a) ground field of annual average concentration (μg/m3); (b) frequency distribution of annual average concentration in background stations.
Figure 13.
APS2025 NO2: (a) ground field of annual average concentration (μg/m3); (b) frequency distribution of annual average concentration in background stations.
Figure 14.
December 2018 average wind speed. The two areas (boxes) selected for the experiment are the Po Valley flat area and Northern–Central Europe area.
Figure 14.
December 2018 average wind speed. The two areas (boxes) selected for the experiment are the Po Valley flat area and Northern–Central Europe area.
Figure 15.
December 2018 (a) PM10 reduction and (b) NO2 reduction.
Figure 15.
December 2018 (a) PM10 reduction and (b) NO2 reduction.
Table 1.
Emissions for PoValley, baseline 2013.
Table 1.
Emissions for PoValley, baseline 2013.
| Macro-Sectors | NH3 | Non-Methane Organic Compound (NMVOC) | NMVOC without MS10 and MS11 | NOx | PM10 | SO2 |
|---|
| MS1—Combustion in energy and transformation industries | 0% | 0% | 0% | 6% | 1% | 18% |
| MS2—Non-industrial combustion plants | 0% | 5% | 11% | 9% | 56% | 7% |
| MS3—Combustion in manufacturing industry | 0% | 1% | 2% | 15% | 4% | 41% |
| MS4—Production processes | 0% | 4% | 9% | 3% | 3% | 21% |
| MS5—Extraction and distribution of fossil fuel and geothermal energy | 0% | 2% | 4% | 0% | 0% | 0% |
| MS6—Solvent and other product | 0% | 28% | 58% | 0% | 5% | 0% |
| MS7—Road transport | 1% | 6% | 14% | 50% | 20% | 1% |
| MS8—Other mobile sources and machinery | 0% | 1% | 2% | 13% | 4% | 10% |
| MS9—Waste treatment and disposal | 1% | 0% | 0% | 1% | 0% | 2% |
| MS10—Agriculture | 97% | 22% | 0% | 1% | 4% | 0% |
| M11—Other sources and sinks | 0% | 31% | 0% | 0% | 3% | 0% |
| Total Emissions | 100% | 100% | 100% | 100% | 100% | 100% |
Table 2.
Catalogue of Measures, technological/non-technological measures.
Table 2.
Catalogue of Measures, technological/non-technological measures.
| PREPAIR Sectors | Technological Measures | Non-Technological Measures | Total Measures |
|---|
| Agriculture and livestock | 8 | 42 | 50 |
| Green areas and forests | 0 | 2 | 2 |
| Cross-sector actions | 2 | 58 | 60 |
| Energy, networks and infrastructures | 6 | 18 | 24 |
| Industry and productive activities | 12 | 19 | 31 |
| Civil sector and public administration | 18 | 50 | 68 |
| Transports and mobility | 23 | 124 | 147 |
| Total number of measures | 69 | 313 | 382 |
Table 3.
Skill scores for PM10 and NO2 annual average with kriging and without kriging.
Table 3.
Skill scores for PM10 and NO2 annual average with kriging and without kriging.
| | PM10 | NO2 |
|---|
| | No Kriging | With Kriging | No Kriging | With Kriging |
|---|
| Bias (μg/m3) | −6.34 | 0.24 | −4.89 | 6.37 |
| RMSE (μg/m3) | 7.73 | 3.73 | 7.80 | 7.70 |
| MAE (μg/m3) | 6.72 | 2.78 | 6.37 | 5.69 |
© 2020 by the authors. Licensee MDPI, Basel, Switzerland. This article is an open access article distributed under the terms and conditions of the Creative Commons Attribution (CC BY) license (http://creativecommons.org/licenses/by/4.0/).


