Article

Climate Change Impacts on Sugarcane Production in Thailand

by
Siwabhorn Pipitpukdee
1,2,
Witsanu Attavanich
1,* and
Somskaow Bejranonda
1
1
Department of Economics, Kasetsart University, 50 Phahonyothin Rd., Chatuchak, Bangkok 10900, Thailand
2
Center for Advanced Studies for Agriculture and Food, Kasetsart University Institute for Advanced Studies, Kasetsart University, Bangkok 10900, Thailand
*
Author to whom correspondence should be addressed.
Atmosphere 2020, 11(4), 408; https://doi.org/10.3390/atmos11040408
Submission received: 29 February 2020 / Revised: 14 April 2020 / Accepted: 17 April 2020 / Published: 19 April 2020
(This article belongs to the Special Issue Plant Adaptation to Global Climate Change)

Abstract

:
This study investigated the impact of climate change on yield, harvested area, and production of sugarcane in Thailand using spatial regression together with an instrumental variable approach to address the possible selection bias. The data were comprised of new fine-scale weather outcomes merged together with a provincial-level panel of crops that spanned all provinces in Thailand from 1989–2016. We found that in general climate variables, both mean and variability, statistically determined the yield and harvested area of sugarcane. Increased population density reduced the harvested area for non-agricultural use. Considering simultaneous changes in climate and demand of land for non-agricultural development, we reveal that the future sugarcane yield, harvested area, and production are projected to decrease by 23.95–33.26%, 1.29–2.49%, and 24.94–34.93% during 2046–2055 from the baseline, respectively. Sugarcane production is projected to have the largest drop in the eastern and lower section of the central regions. Given the role of Thailand as a global exporter of sugar and the importance of sugarcane production in Thai agriculture, the projected declines in the production could adversely affect the well-being of one million sugarcane growers and the stability of sugar price in the world market.

1. Introduction

Sugar is a low-cost energy source that can alleviate malnutrition problems in the case of energy deficiency [1]. About 80% of the global sugar produced from sugarcane [2,3] are cultivated in 120 countries with approximately 27 million ha and an average production is 1.8–2 billion tons per year [4]. In addition to sugar, sugarcane can be used to produce several products such as falernum, molasses, rum, bagasse, and ethanol, creating economic benefits along the supply chain [2].
Among sugarcane producing countries, Thailand ranked fourth for sugar production, accounting for 8.10% of the world’s total sugar production [5] and ranked second for sugar export contributing to 16.95% of global export quantity with an export value of 2.97 billion USD in 2019 [5,6]. At the national level, sugarcane production plays an increasing role in Thai agriculture. With support from government policies aiming to reduce rice production and promote alternative energy, the harvested area of sugarcane has steadily increased 44.61% in the last decade from 1.35 million ha in the 2010/2011 production year to 1.96 million ha in 2018/2019 [7] with approximately 1 million farmers in 2019 [8]. In 2018/2019, the harvested area of sugarcane ranked third among major economic crops in Thailand following rice (11 million ha) and natural rubber (3.66 million ha). It accounted for 12% of total land use for 11 major economic crops. Cassava and maize ranked fourth and fifth with harvested areas of 1.39 and 1.10 million ha, respectively.
Over the last several decades, it has become increasingly clear that human activities, especially burning fossil fuels and deforestation, are changing the world’s climate conditions, through increases in temperatures, extreme temperatures, droughts, and rainfall intensity [9]. Agriculture is the most vulnerable economic sector through such changes and for the past 30 years numerous studies have attempted to estimate the effect of changing climate on crop yields and their production [10,11,12,13,14,15].
Climate change can directly affect crops through rising temperature and changing rainfall patterns, or indirectly affect crops through soil, nutrient, and increasing pests interference [16]. Studies revealed that crop yields have been affected by the variability of temperature, rainfall, and the interaction between them and climate change impacts will be different across locations, types of crop, scenarios, and farmer adaptation [17,18,19,20,21]. Although the world may be able to cope with food insecurity at the macro level, the problem may also exist at the micro level with the shortage of food in developing countries compensated by developed countries receiving the benefits from climate change [13]. Previous studies also revealed that climate change is projected to negatively affect the global food system and food supply may not be available to meet demand in the future [21,22,23].
For sugarcane, all previous studies only assessed the impact of climate change on yield. Overall, studies showed mixed findings regarding changes in sugarcane yield from climate change. Singels et al. [24] employed the Canegro model and revealed that future sugarcane yields with constant CO2 concentration set at 360 ppm were expected to decline in two sites, ranging from 4.15% for rainfed crops at Piracicaba (Brazil) and 4.65% for irrigated crops at Ayr (Australia) from the 1980–2010 baseline period. On the other hand, sugarcane yield was predicted to increase 2.58% for La Mercy (South Africa). By adding CO2 fertilization effect, Marin et al. [25] found that the sugarcane yield would increase 24% for rainfed sugarcane in the 2050s in São Paulo, Brazil. Moreover, Silva et al. [26] found that rainfall was positively correlated with sugarcane production, whereas the temperature negatively influenced production in municipalities within Paraiba, Brazil. They also found that the mesoregion of Mata Paraibana has a higher probability of producing sugarcane than other mesoregions.
The positive impact of climate change on sugarcane yield was also found in Mexico [27] and southern China [28]. In Mexico, Baez-Gonzalez et al. [27] developed the Agricultural Land Management Alternatives model and revealed the positive impacts of future climate change on sugarcane yields with increases of 1%–13% under the A2 scenario from the baseline. In southern China, Ruan et al. [28] used the Agricultural Production Systems Simulator (APSIM)-Sugarcane model and found that the largest percentage change in sugarcane yields occurred at high latitude locations (e.g., Hezhou), with increased mean values of 44.2% and 23.5% for Representative Concentration Pathway (RCP)4.5 and RCP8.5 in the 2060s, respectively. On the other hand, in Africa, Adhikari, Nejadhashemi, and Woznicki [29] reviewed studies projecting the climate change impacts on sugarcane production and revealed that sugarcane will be resilient to temperature rise, but it will be vulnerable to rainfall variability. Yield of sugarcane is projected to decline less than 5% in East Africa by 2030 as compared to 1998–2002 [30].
In Thailand, Yoshida et al. [31] present the only research study to explore the relationship between climate and sugarcane yield in the Northeastern region of Thailand. Their study revealed that sugarcane yield had a significant positive relationship with four months of accumulated rainfall. This finding could imply that sugarcane yield is likely increased where the rainfalls are projected to increase under climate change scenarios. Unfortunately, their study did not analyze this relationship at the national level and did not differentiate the heterogenous effect of climate change on sugarcane yield among regions of Thailand. To our knowledge, there is no study that projects the future change in yield, harvested area, and production of sugarcane in Thailand under climate change scenarios.
Therefore, this study aims to estimate the effect of climate change on yield, harvested area, and production of sugarcane in Thailand using the provincial-level panel data analysis. Then, we project future changes in yield, harvested area, and production of sugarcane under climate change using climate projections from the Fifth Assessment Report (AR5) of the Intergovernmental Panel on Climate Change (IPCC) [9].
Our study provides several contributions to climate change related to sugarcane production. First, our study is a pioneer in simultaneously investigating the effect of climate change including yield, harvested area, and production, and analyzing climate change impacts for a whole country at the provincial level. Second, we add the prices of output and input in the model and address the issue of endogeneity bias in economics using spatial econometrics and the instrumental variable approach as suggested by Miao and colleagues [14]. Third, unlike other studies done in Thailand, we put additional effort to estimate the weighted average of climate data for each province using weighted least square regression, as first introduced by Mendelsohn, Nordhaus, and Shaw [12]. Fourth, we include variables capturing climate variability and extreme events in the model and use the recent AR5 downscaled projections of precipitation at the watershed level to deeply understand the variation of future precipitation at the local level. Finally, we include and project the population density as a variable capturing the change in socio-economic condition that could affect harvested areas of sugarcane.
This article is organized as follows: Section 2 presents details of materials and methods used for the analysis; Section 3 provides results and discusses the findings; and Section 4 presents the conclusions and policy implications that were drawn from the findings.

2. Materials and Methods

2.1. Model Estimation Approach

To quantify the effect of climate change on the production of sugarcane in Thailand, we constructed models by including factors that determine yield and harvested area of sugarcane following Miao and colleagues [14]. The province-specific sugarcane yield model and harvested area are shown below in Equations (1) and (2), respectively:
Y j t = β o + β 1 C l i m a t e j t + β 2 P r i c e j t + β 3 P c t I r r i g j t + β 4 T j t + β 5 T j t 2 + u j + ϵ j t
H j t = α o + α 1 C l i m a t e j t + α 2 P r i c e j t + α 3 P c t I r r i g j t + α 4 P o p d e n j t + α 5 T j t + α 6 T j t 2 + v j + e j t
where j and t are indexed for province and year, respectively. Yjt is yield of sugarcane in province j at time t. For brevity, we will omit explanations for the subscripts. H is the harvested area of sugarcane. β and α are vectors of parameters to be estimated. Climate is the vector of climate variables including growing season average temperature, extreme maximum temperature, total rainfall, maximum rainfall in 24 h, and the dummy variables capturing El Niño–Southern Oscillation (ENSO) phases including El Niño, La Niña, and neutral phases. Price is the vector capturing output and input prices (i.e., farm received price of sugarcane and wage rate of labor). PctIrrig is the percent of irrigated area to total area in the province and T and T 2 are time trend capturing technological progress. In the model of harvested area, we added a variable Popden capturing population density, which determines the demand for land and pressure of land on non-agricultural development use; u and v are region fixed effects and ϵ and e are error terms.
For estimation, this study uses spatial regression to address spatial bias because the climate conditions, input prices, and labor wage in a large region can be quite similar, and the provincial-level yield and harvested area of sugarcane may be correlated with those in neighboring provinces. We also address endogeneity bias from using sugarcane price and wage rate by employing the instrumental variable (IV) approach together with the generalized method of moment (GMM), following procedures suggested by Miao and colleagues [14]. By testing for the good IVs, this study uses one-year lagged variables of the Southern Oscillation Index (SOI), extreme maximum temperature, and total stock of sugar as IVs for the yield model. For the harvested area model, it uses one-year lagged variables of extreme maximum temperature, total stock of sugar, and total amount of rainfall as IVs. After obtaining estimated coefficients from the yield and harvested area models for sugarcane, we then obtain climate projections from IPCC AR5 to predict future yield and harvested area for sugarcane. Finally, we estimate the quantity of sugarcane production by multiplying yield to its corresponding harvested area.

2.2. Data

This study constructs a unique provincial-level panel dataset during 1989–2016—the longest period used compared to other studies done in Thailand—from several sources [31]. Yield and harvested area plus crop prices were obtained from the Office of Agricultural Economics, Ministry of Agriculture and Cooperatives. Irrigation area was obtained from the Royal Irrigation Department. We obtained the historical monthly climate data including average temperature, maximum temperature, and mean precipitation for all climate stations in Thailand from the Meteorological Department. Climate projections during 2046–2055 were obtained from the IPCC AR5. They are the average values of all general circulation models produced by the Royal Netherlands Meteorological Institute (KNMI) using IPCC AR5 report. We also collected population statistics and future population projections under the assumption of a moderate fertility rate at the provincial level from the Ministry of Interior and the National Economic and Social Development Council (NESDC), respectively. Lastly, we constructed dummy variables capturing three ENSO phases (i.e., El Niño, La Niña, and neutral) from the National Oceanic and Atmospheric Administration (NOAA).
Unlike other studies in Thailand, we linked the agricultural data organized by province and the climate data organized by station by conducting a spatial statistical analysis following Mendelsohn and co-workers [12]. While climatic variables examined in this study are measured frequently, there are some provinces with several weather stations and others with no stations. Furthermore, some provinces are large enough that there is variation in climate within the province. We therefore proceeded by constructing an average climate for each province using weighted least square regression by controlling for the distance from the centroid, latitude, longitude and height of climate stations. The weight is the inverse of the square root of a station’s distance from the province center because closer stations usually contain more information about the climate of the center. We located the centroid of each province and drew a circle within the radius of 250 km by assuming that all the weather stations within this radius provide some useful climate information.
We estimated a separate regression for each province since the set of stations within 250 km and the weights (distances) are unique for each province. The regression fits a second-order polynomial over four climate variables, so that there were 20 final variables in the regression, plus a constant term. Four regressions for each of the 77 provinces and 36 years led to over 11,088 estimated regressions. Table A1 in the Appendix A shows examples of the estimated coefficients of the weighted least square regression for each climate variable in July 2016 in Nakon Sawan Province, the largest sugarcane producing province in Thailand. Overall, we observe that the models fit relatively well, especially for the average temperature variable. All predicted values of climate variables are statistically significant at 1% level. Table 1 provides a summary statistic of variables at the provincial level.

3. Results and Discussion

This section provides the estimated coefficients from sugarcane yield and its harvested area models, the projected changes in yield, harvested area, and production of sugarcane under climate change scenarios, as well as a discussion of the findings.

3.1. Estimated Results

The estimated coefficients from the sugarcane yield and its harvested area models are shown in Table 2 and Table 3, respectively. Details are provided in Section 3.1.1 and Section 3.1.2, respectively.

3.1.1. Determinants of Sugarcane Yields

All climate variables (excepting for the El Niño phase) statistically influenced sugarcane yield (Table 2). The inverted U-shape relationship between temperature and sugarcane yield was revealed and we found the U-shape relationship between rainfall and sugarcane yield. Moreover, an increase in extreme maximum temperature showed the harmful impact on sugarcane yield. On the other hand, the maximum rainfall within 24 h was positively correlated to sugarcane yield. This finding could be explained by the fact that a majority of land planting sugarcane in Thailand are dryland above the sea level. Therefore, an increase in rainfall intensity still improved sugarcane yield. Other studies reached a similar conclusion [24,28].
We also revealed that the period with extreme climatic events, especially the La Niña phase, had lower yield than the period with neutral phase. In addition to the climate conditions, increase in the percent of irrigated area to total land area significantly improved the yield of sugarcane. Farm price received and labor wage rate in the previous year are negatively correlated to sugarcane yield. An increase in expected price could lead to a change in rotation practice and expanding area under the crop to marginal, low quality acres [32], which could decrease yield per ha. Furthermore, the reduction in labor use was induced by an increase in wage rate. Finally, technological progress captured by the variable Time trend affected sugarcane yields with a U-shape relationship. We used the estimated coefficients of Time trend and its square term to calculate the rate of technological change to investigate the role of technological progress on sugarcane yield. Our results revealed that sugarcane yield increased 1.36% per year as a result of technological progress during 1992–2016 period.

3.1.2. Determinants of Harvested Area

We found that total rainfall non-linearly determined sugarcane harvested area with inverted U-shape relationship. Its harvested area in the La Niña phase was higher than that in the neutral phase. We also revealed that increases in the percent of irrigated area to total land area reduced sugarcane harvested area because sugarcane usually grows in rainfed areas. Sugarcane growers could obtain a higher yield or switch from sugarcane to other high-valued crops when they can access an irrigation system. Higher population density reduced the sugarcane harvested area as found in previous studies [14] due to higher demand of land for non-agricultural use. The one year-lagged labor wage rate positively correlated to sugarcane harvested area. Increase in expected wage rate could lead farmers to substitute land for labor and expand sugarcane acreage. Lastly, technological progress non-linearly affected the sugarcane harvested area with an inverted U-shape relationship as shown in Table 3. Similar to Section 3.1.1, we calculated the rate of technological change to investigate the role of technological progress on harvested area and found that harvested area slightly dropped 0.000008% per year during the same period implying that technological progress had little impact on the land use of sugarcane.

3.1.3. Improvement in Estimation

To check whether adding the new economic variables and our estimation method improved the fitness of the model, we compared models with and without prices and wage variables and also models with and without IVs and spatial regression. We revealed that our yield and harvested area models that included price and wage variables and used the IV approach plus spatial regression had higher R2 values and lower root mean square error (RMSE) values than the models without prices and wage variables (See Table A2 and Table A3). While the ordinary least square (OLS) method provided the low value of the root mean square error (see model 3 in Table A3) in the harvested area model, it did not address the endogeneity problems from both spatial bias and omitted variables. We performed the Moran’s I test and found the spatial autocorrelation in the model. These above evidences imply that the method used in the current study improves the estimation of the models. Future research should address the problem of endogeneity generated by spatial bias, simultaneity bias, and omitted variables before performing the estimation.

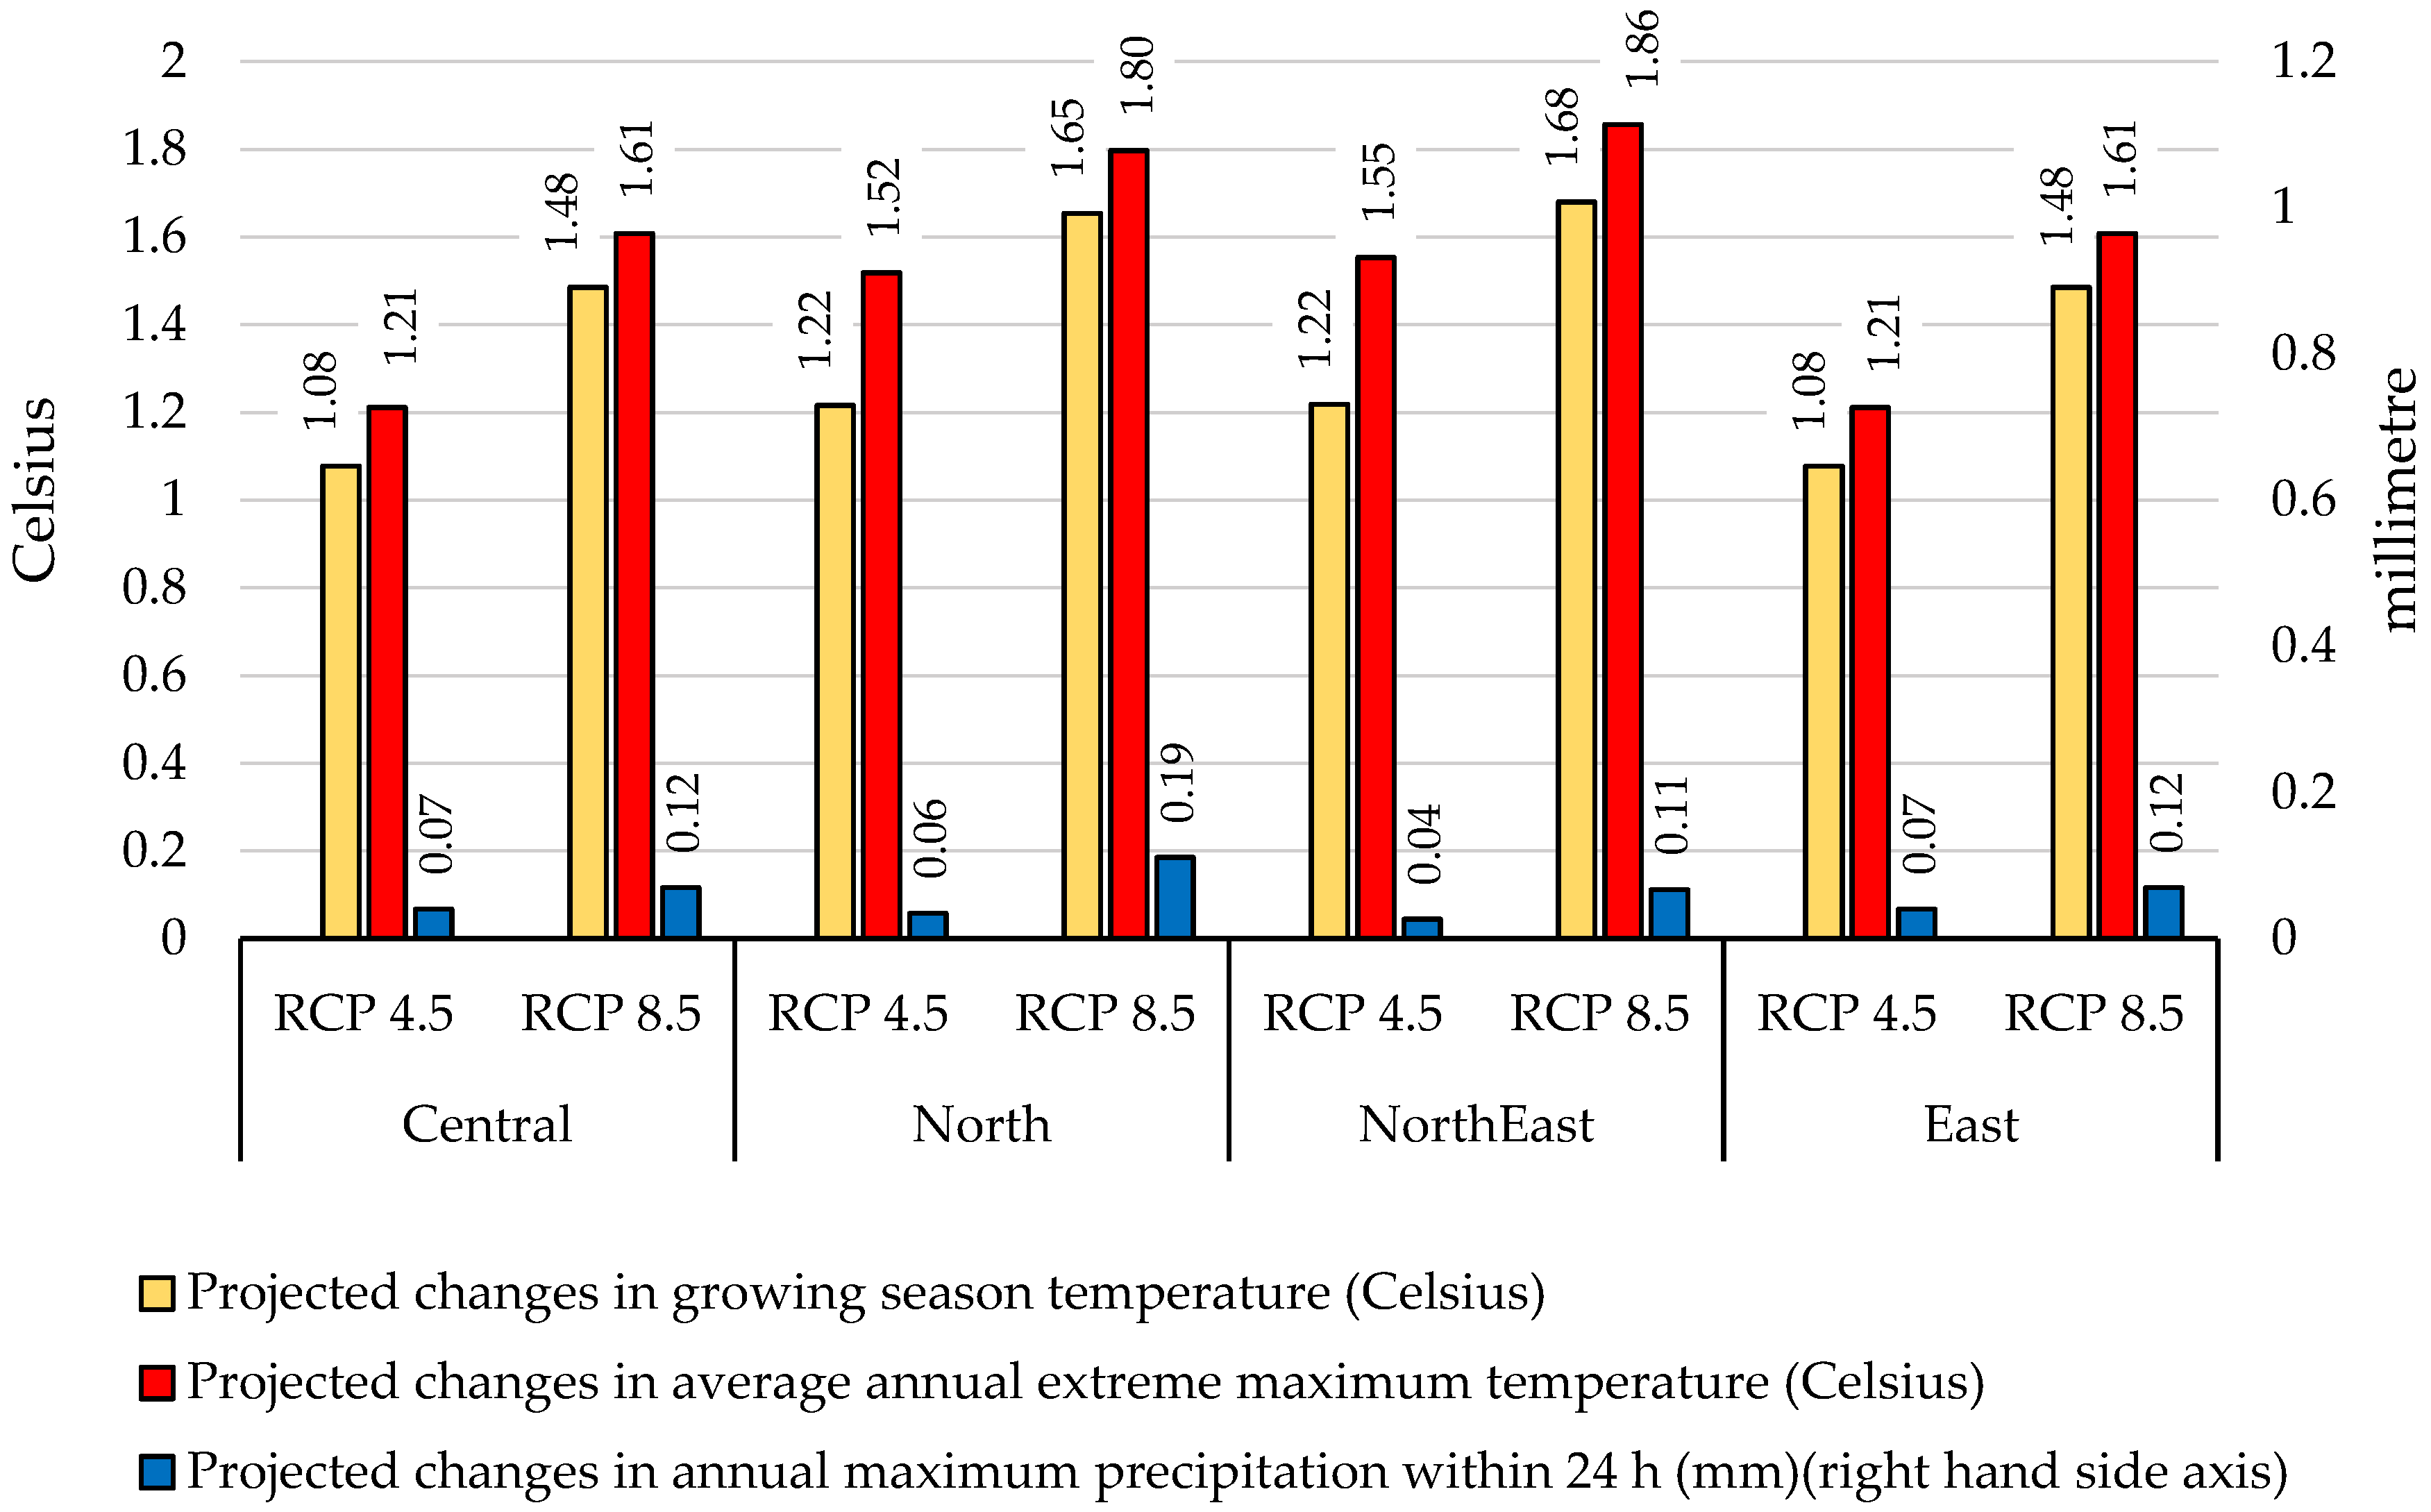
3.2. Simulation of Climate Change Impacts on Production of Sugarcane

To project the impact of climate change on yield, harvested area, and production of sugarcane during 2046–2055 from the baseline during 1992–2016, we obtained future climate projections including growing season temperature, total precipitation, extreme maximum temperature, and maximum precipitation within 24 h from IPCC AR5 [9]. Climate change scenarios RCP4.5 and RCP8.5 were selected to investigate the variation of projected results. RCP8.5 captures rising radiative forcing pathway leading to 8.5 W/m2 in 2100, while RCP4.5 is stabilized without the overshoot pathway to 4.5 W/m2 after 2100.
Figure 1 presents the regional projected changes in climate variables used in the model. Overall, we observed that the Northeastern region is projected to have the highest increase in growing season temperature and extreme maximum temperature from the baseline among other regions. Growing season temperatures of sugarcane (January to December) are projected to increase ranging from 1.08–1.22 °C and 1.48–1.68 °C under RCP4.5 and RCP8.5, respectively. Extreme maximum temperatures are also projected to rise ranging from 1.21–1.55 °C and 1.61–1.86 °C under RCP4.5 and RCP8.5, respectively. All regions are projected to have higher annual maximum precipitation within 24 h.
Since rainfall has high local variation, our study, unlike other studies in Thailand, used the latest IPCC AR5 downscaled projections of total annual rainfall at the watershed level provided by the Office of Natural Resources and Environmental Policy and Planning (ONEP). There are 25 watersheds in Thailand and Figure 2 reveals that the total amount of rainfall under RCP8.5 will be higher than the total amount of rainfall under RCP4.5. Regions in the north, south, and upper section of northeast were projected to have higher future rainfall than the baseline, while the opposite was found in some provinces located in the lower-southern region. Unlike other studies, we obtained population statistics from Ministry of Interior and the National Economic and Social Development Council (NESDC), and then predicted future changes in population using the trend analysis with quadratic time trend and then quantified the projected population density to reflect changes in socio-economic conditions as shown in Figure 3. We observed that the population density was projected to increase in the central, eastern and southern regions, while it was forecasted to drop in the northeastern and northern regions.
After adding projections of climate and population density in estimated models from Table 2 and Table 3, we found that future yields, harvested area, and production were projected to drop in all scenarios at the national level (Table 4). Future sugarcane yield was projected to drop 23.95% under RCP4.5 and 33.26% under RCP8.5 from the baseline. In other words, it was predicted to decline 0.59% and 0.87% per year during 1992–2016 period under RCP4.5 and RCP8.5, respectively. Although no study has investigated the impact of climate change on sugarcane yield in Thailand, our results were in line with findings in Brazil and Australia [24] and East Africa [30]. However, the magnitudes of the yield investigated in our study were higher than those in previous studies, which may come from the fact that a majority of sugarcane in Thailand has been grown in the rainfed area and the total precipitation in the Northeastern region was projected to increase less than other regions.
By incorporating the role of changes in socio-economic condition captured by population density, we found that the harvested area of sugarcane was projected to slightly decline ranging from 1.29–2.49% from the baseline consistent with the findings of Miao and colleagues [14], or about 0.03–0.05% per year during 1992–2016. After multiplying projected sugarcane yield and its corresponding harvested area, this study reveals that sugarcane production is forecasted to decrease between 24.94–34.93% under two climate change scenarios from the baseline without CO2 fertilization effect. As Thailand contributed 16.95% to the world’s sugar export market, climate change could reduce the amount of sugar supplied to the world market.
Considering the distributional impacts of climate change at the provincial level, our findings revealed the reduction in future yield of sugarcane in all provinces ranges from 12.23–30.53% under RCP4.5 and 16.06–43.80% under RCP8.5 from the baseline, respectively as shown in Figure 4. The largest drop in yield was found in the lower section of the country. Prachuap Khiri Khan, Chachoengsao, Chon Buri, Rayong, and Nakhon Sawan were predicted to have the largest reduction. Mixed results were revealed for the harvested area of sugarcane as shown in Figure 5. A majority of provinces located in the northeastern and northern regions were projected to have an expansion of harvested area ranging from 2.78–19.45% under RCP4.5 and 0.35–16.79% under RCP8.5. On the other hand, some provinces located in the eastern and central regions were projected to face a reduction in harvested area with huge variations across provinces ranging from 0.03–93.07% under RCP4.5 and 0.37–98.45% under RCP8.5.
By multiplying yield and harvested area, we found that the sugarcane production was projected to decline at the national level (Table 4) approximately 24.94% under RCP4.5 and 34.93% under RCP8.5 from the baseline during 1992–2016, or equivalent to the declining of 0.62% and 0.92% per year under RCP4.5 and RCP8.5, respectively. Sugarcane production was also predicted to drop in all provinces implying that changes in yield dominated changes in harvested area as demonstrated in Figure 6. The largest drop was predicted in the eastern and lower section of the central regions. Production of the top five provinces (i.e., Kanchanaburi, Suphan Buri, Nakhon Sawan, Kamphaeng Phet, and Nakhon Ratchasima), accounting for 39.30% of total sugarcane production, was projected to decrease 20.13–26.65% under RCP4.5 and 30.35–38.09% under RCP8.5 from the baseline.
Considering the role of technological progress in sugarcane production discussed in Section 3.1.1 and Section 3.1.2, we may need to sustain the rate of technological progress on sugarcane production at least 0.62–0.92% per year in Thailand to address the future impact of climate change. A higher rate of technological progression on sugarcane production may be needed to fulfill the demand of sugarcane-related products given the rising population in the world, which is projected to reach 9.73 billion by 2050 [33].
In addition to Thailand, sugarcane producing countries should be aware of climate change impacts since previous studies also predicted a decline in sugarcane yield induced by climate change. For example, Singels et al. [24] projected the decline of sugarcane production in the rainfed area of Piracicaba (Brazil) and in the irrigated area of Ayr (Australia). Moreover, Adhikari, Nejadhashemi, and Woznicki [29] predicted a drop in sugarcane production in East Africa. Recent drought during the 2019/2020 season also caused a large fall of sugarcane production in India and Thailand [34]. Since India, Brazil, Thailand, and Australia are major sugarcane producing countries, climate change could also cause fluctuation in the world’s markets of sugar, biofuel, and related sugarcane products. Importing and exporting countries plus traders of sugarcane-related products should consider the impact of climate change on sugarcane production in future planning.

4. Conclusions

The objectives of this study were to predict the impacts of climate change on yield, harvested area, and production of sugarcane in Thailand using spatial regression with the instrumental variable. A provincial-level panel dataset during 1989–2016 was constructed with downscaled climate projections under RCP4.5 and RCP8.5 from IPCC AR5 as well as projections of provincial-level future populations under a moderate fertility rate. Our results provide important implications on the well-being of almost one million sugarcane growers in Thailand and the vulnerability of sugar supplied in the world market as Thailand is ranked as the second largest exporter of sugar in the world market. The backward and forward linkage industries also could be affected by the vulnerability of sugarcane production. Several new contributions to climate change related sugarcane production were added.
For the determinants of crop yields, we found that in general climate variables, both mean and variability, statistically determined yields. In addition to climate variables, increased population density also reduced the harvested area for non-agricultural use. Technological progress also statistically determined yields with a non-linear effect. Input and output prices also affected production. Our simulated results demonstrate that sugarcane yield is projected to drop 23.95–33.26% from the baseline with the largest drop in the lower section of Thailand. The harvested area of sugarcane is projected to decline 1.29–2.49% from the baseline with expansion in the northeastern and northern regions and reduction in some provinces located in the eastern and central regions. Moreover, sugarcane production is forecasted to decrease 24.94–34.93% from the baseline with the largest drop in the Eastern and lower section of the central regions. As a result, the amount of sugar exported to the world could reduce approximately 2.49–3.49% and the standard of living of sugarcane growers could be diminished. To address the impact of climate change, the rate of technological progress on sugarcane production may need to increase at least 0.62–0.92% per year.
Several policy implications can be drawn from our findings. First, it is recommended that policy makers should raise awareness to farmers and private sectors on the serious effects of climate change on sugarcane production in predicted vulnerable areas, especially provinces in the eastern and central regions of Thailand. Second, to effectively reduce the impacts of climate change, the government should support the development of proper farm practices (e.g., moisture management, and soil and water conservation), crop insurance programs, and infrastructure (i.e., irrigation systems) to support the adaptation of farmers. Third, agricultural research and development should emphasize the development of heat-resistant species for sugarcane to sustainably adapt to the future warming world. Fourth, governments should promote research to quantify the impacts of climate change on sugarcane production at the finer scales (i.e., tambon and household level) to improve the accuracy of the projections and encourage researchers to analyze the climate change impacts on other crops, livestock, and fisheries. In addition, it is recommended to support the database development for climate change analysis in Thailand because one of the challenging problems of doing climate change research is the lack of a complete database. Last but not least, importing and exporting countries as well as traders of sugarcane-related products should consider the impact of climate change on sugarcane production in their future planning.

Author Contributions

Conceptualization, W.A. and S.B.; methodology, S.P., W.A., and S.B.; formal analysis, S.P. and W.A; investigation, W.A. and S.B.; writing—original draft preparation, S.P.; writing—review and editing, W.A.; visualization, S.P.; supervision, W.A. and S.B. All authors have read and agreed to the published version of the manuscript.

Funding

This research was partially funded by the Center for Advanced Studies for Agriculture and Food, the Institute for Advanced Studies, Kasetsart University under the Higher Education Research Promotion, and the National Research University Project of Thailand, Office of the Higher Education Commission, Ministry of Education, Thailand.

Conflicts of Interest

The authors declare no conflicts of interest.

Appendix A

Table A1. Weighted least square regression of climate variables of July 2016 in Nakon Sawan Province.
Average Temperature Total Rain Maximum Rain in 24 h Extreme Max. Temperature
Latitude14.5154***737.2921*−449.4323***−80.9482***
(2.1368) (433.2796) (127.9690) (24.2753)
Latitude_sq0.0442**9.0523**8.9787***0.2565
(0.0174) (3.5243) (1.0409) (0.1577)
Longitude19.5990***−9188.7530***−296.0857 −204.6332***
(6.4092) (1299.5850) (383.8320) (39.7748)
Longitude_sq−0.0860***46.8822***1.4239 0.9611***
(0.0316) (6.4126) (1.8939) (0.1910)
Latitude* Longitude−0.1616***−9.2311**1.9145*0.7447***
(0.0184) (3.7253) (1.1003) (0.2413)
Height−0.3509***61.0837***16.6274***−0.6956
(0.0385) (7.7988) (2.3034) (0.4141)
Height_sq0.0000 0.0021***0.0002*0.0000*
(0.0000) (0.0006) (0.0002) (0.0000)
Height_*Latitude0.0030***−0.7504***−0.2224***–0.0109**
(0.0003) (0.0695) (0.0205) (0.0051)
Height* Longitude0.0030***−0.5090***−0.1332***0.0082*
(0.0003) (0.0672) (0.0198) (0.0043)
Constant−1056.2490***451,024.7000***17,267.2400 10,929.9900***
(325.1456) (65,928.9500) (19,472.1000) (2084.0220)
R-squared0.9140 0.5537 0.5219 0.6409
Predicted value28.29712***205.7859***53.06985***35.87393***
0.0141769 2.874609 0.8490152 0.131078
Notes: *, **, and *** indicate significance at the 10%, 5%, and 1% level, respectively, and standard errors are reported in parentheses.
Table A2. Comparison of yield models with and without price and wage variables.
1.
Existing Model
(IV and Spatial Regression with Price and Wage Variables)
2.
IV and Spatial Regression without Price and Wage Variables
3.
OLS without Price and Wage Variables
VariablesCoefficientsCoefficientsCoefficients
Time trend−1684.42 ***197.861.32
Time trend_sq127.56 ***26.60 ***35.07 ***
%Irrigated area per province area100.52 ***110.9 ***115.8 ***
Average temperature165,114.40 ***112,887 ***81,758 ***
Average temperature_sq−2942.43 ***−2024 ***−1422 ***
Total rain−37.08 ***−8.485−6.193
Total rain_sq0.01 **0.001950.0016
Maximum rain in 24 h274.62 **−198.2−366.5 ***
Extreme max. temperature−8592.73 ***−9363 ***−11,825 ***
El Niño−513.00190.1247.6
La Niña−2244.31 ***389.2715.1 **
North4057.12 ***4386 ***6610 ***
Northeast5618.21 ***6250 ***8975 ***
Southeast−12,246.34 ***−10,585 ***−13,390 ***
East−3348.69 ***−2834 **−3860
Lag price−645.31 ***--
Lag wage−8765.63 ***--
Constant−1.87 × 10⁶ ***−1.18 × 10⁶ ***−687,863 ***
Observations124212421242
R-square_adj.0.490.400.427
Root MSE6747.977534.017562.85
Notes: *, **, and *** indicate significance at the 10%, 5%, and 1% level, respectively.
Table A3. Comparison of harvested area models with and without price and wage variables.
Harvested Area1.
Existing Model
(IV and Spatial Regression with Price and Wage Variables)
2.
IV and Spatial Regression without Price and Wage Variables
3.
OLS without Price and Wage Variables
VariablesCoefficientsCoefficientsCoefficients
Time Trend1.04 **−0.5280.249
Time Trend_sq−0.05 **0.0411 ***0.0134 *
Population density−0.07 ***−0.0396 **−0.278 ***
%Irrigated area per province area−0.09 **−0.144 ***−0.038
Total rain0.05 *0.0172−0.0347 **
Total rain_sq−2.20 × 10⁻⁵ **−1.30 × 10−51.06 × 10−5 **
Maximum rain in 24 h−0.440.3380.204
Extreme max. temperature−0.432.907 *0.798
El Niño−0.67−0.5511.407 ***
La Niña7.65 ***3.354 **0.0332
North−16.46 ***−17.38 ***−40.50 ***
Northeast−8.37 **−11.59 ***−26.06 *
Southeast−10.82−7.51−51.39 ***
East−19.34 ***−18.42 ***−35.15 **
Lag price0.23--
Lag wage10.78 ***--
Constant−36.04−75.6568.21 **
Observations124212421242
R-square_adj.0.110.090.0965
Root MSE10.9010.9210.310
Notes: *, **, and *** indicate significance at the 10%, 5%, and 1% level, respectively.

References

  1. FAO. Is sugar pure, white and deadly? In Proceedings of the Fiji/FAO Asia Pacific Sugar Conference, Suva, Fiji, 29–31 October 1997; pp. 41–44. [Google Scholar]
  2. International Sugar Organization. The Sugar Market. 2019. Available online: https://www.isosugar.org/sugarsector/sugar (accessed on 23 August 2019).
  3. Murphy, R. Sugarcane: Production Systems, Uses and Economic Importance; Nova Science: New York, NY, USA, 2017; p. 39. [Google Scholar]
  4. FAOSTAT. Food and Agriculture Organization of the United Nations, Statistics Division. Forestry Production and Trade. Available online: http://www.fao.org/faostat/en/#data/FO (accessed on 4 April 2019).
  5. USDA. Foreign Agricultural Service. Production, Supply and Distribution. 2020. Available online: https://apps.fas.usda.gov/psdonline/app/index.html#/app/advQuery (accessed on 28 February 2020).
  6. UN Comtrade. World Cane Sugar Export’s Statistics. 2019. Available online: https://comtrade.un.org/data/https://comtrade.un.org/data (accessed on 25 August 2019).
  7. Office of the Cane and Sugar Board. Production Report. 2019. Available online: http://www.ocsb.go.th/th/home/index.php (accessed on 20 February 2020).
  8. Bangkok Post. Thai Sugar Body Seeks to Sweeten Environment and Health. 2019. Available online: https://www.bangkokpost.com/business/1758849/thai-sugar-body-seeks-to-sweeten-environment-and (accessed on 22 February 2020).
  9. IPCC. 2013: Annex I: Atlas of Global and Regional Climate Projections. In Climate Change 2013: The Physical Science Basis. Contribution of Working Group I to the Fifth Assessment Report of the Intergovermental Panel on Climate Change; Cambridge University Press: Cambridge, UK; New York, NY, USA, 2013; pp. 1311–1393. [Google Scholar]
  10. Adams, R.M.; Rosenzweig, C.; Peart, R.M.; Ritchie, J.T.; McCarl, B.A.; Glyer, J.D.; Curry, R.B.; Jones, J.W.; Boote, K.; Allen, L.H. Global climate change and US agriculture. Nature 1990, 345, 219–224. [Google Scholar] [CrossRef]
  11. Attavanich, W.; McCarl, B.A. How is CO2 affecting yields and technological progress? A statistical analysis. Clim. Chang. 2014, 124, 747–762. [Google Scholar] [CrossRef]
  12. Mendelsohn, R.; Nordhaus, W.D.; Shaw, D. The impact of global warming on agriculture: A Ricardian analysis. Am. Econ. Rev. 1994, 84, 753–771. [Google Scholar]
  13. Parry, M.L.; Rosenzweig, C.; Iglesias, A.; Livermore, M.; Fischer, G. Effects of climate change on global food production under SRES emissions and socio-economic scenarios. Glob. Environ. Chang. 2004, 14, 53–67. [Google Scholar] [CrossRef]
  14. Miao, R.; Khanna, M.; Huang, H. Responsiveness of Crop Yield and Acreage to Prices and Climate. Am. J. Agric. Econ. 2015, 98, 191–211. [Google Scholar] [CrossRef] [Green Version]
  15. Schlenker, W.; Roberts, M.J. Nonlinear temperature effects indicate severe damages to U.S. crop yields under climate change. Proc. Natl. Acad. Sci. USA 2009, 106, 15594–15598. [Google Scholar] [CrossRef] [Green Version]
  16. Rosenzweig, C.; Iglesias, A.; Yang, X.; Epstein, P.R.; Chivian, E. Climate Change and Extreme Weather Events; Implications for Food Production, Plant Diseases, and Pests. Glob. Chang. Hum. Health 2001, 2, 90–104. [Google Scholar] [CrossRef]
  17. Cammarano, D.; Ceccarelli, S.; Grando, S.; Romagosa, I.; Benbelkacem, A.; Akar, T.; Al-Yassin, A.; Pecchioni, N.; Francia, E.; Ronga, D. The impact of climate change on barley yield in the Mediterranean basin. Eur. J. Agron. 2019, 106, 1–11. [Google Scholar] [CrossRef]
  18. Lobell, D.B.; Schlenker, W.; Costa-Roberts, J. Climate Trends and Global Crop Production since 1980. Science 2011, 333, 616–620. [Google Scholar] [CrossRef] [Green Version]
  19. Raymundo, R.; Asseng, S.; Robertson, R.; Petsakos, A.; Hoogenboom, G.; Quiroz, R.; Hareau, G.; Wolf, J. Climate change impact on global potato production. Eur. J. Agron. 2018, 100, 87–98. [Google Scholar] [CrossRef]
  20. Zhao, C.; Liu, B.; Piao, S.; Wang, X.; Lobell, D.B.; Huang, Y.; Huang, M.; Yao, Y.; Bassu, S.; Ciais, P.; et al. Temperature increase reduces global yields of major crops in four independent estimates. Proc. Natl. Acad. Sci. USA 2017, 114, 9326–9331. [Google Scholar] [CrossRef] [PubMed] [Green Version]
  21. Attavanich, W.; McCarl, B.A.; Ahmedov, Z.; Fuller, S.W.; Vedenov, D.V. Effects of climate change on US grain transport. Nat. Clim. Chang. 2013, 3, 638–643. [Google Scholar] [CrossRef]
  22. Brown, M.E.; Antle, J.; Backlund, P.; Carr, E.; Easterling, W.; Walsh, M.; Ammann, C.; Attavanich, W.; Barrett, C.; Bellemare, M.; et al. Climate Change, Global Food Security, and the U.S. Food System. Available online: http://www.usda.gov/oce/climate_change/FoodSecurity2015Assessment/FullAssessment.pdf (accessed on 10 May 2019).
  23. Brown, M.E.; Carr, E.R.; Grace, K.L.; Wiebe, K.; Funk, C.C.; Attavanich, W.; Backlund, P.; Buja, L. Do markets and trade help or hurt the global food system adapt to climate change? Food Policy 2017, 68, 154–159. [Google Scholar] [CrossRef] [Green Version]
  24. Singels, A.; Jones, M.; Marin, F.; Ruane, A.; Thorburn, P. Predicting Climate Change Impacts on Sugarcane Production at Sites in Australia, Brazil and South Africa Using the Canegro Model. Sugar Tech. 2013, 16, 347–355. [Google Scholar] [CrossRef]
  25. Marin, F.R.; Jones, J.W.; Singels, A.; Royce, F.; Assad, E.; Pellegrino, G.Q.; Justino, F. Climate change impacts on sugarcane attainable yield in southern Brazil. Clim. Chang. 2012, 117, 227–239. [Google Scholar] [CrossRef] [Green Version]
  26. Silva, W.K.D.M.; De Freitas, G.P.; Junior, L.M.C.; Pinto, P.A.L.D.A.; Abrahão, R. Effects of climate change on sugarcane production in the state of Paraíba (Brazil): A panel data approach (1990–2015). Clim. Chang. 2019, 154, 195–209. [Google Scholar] [CrossRef]
  27. Baez-Gonzalez, A.D.; Kiniry, J.; Meki, M.N.; Williams, J.R.; Cilva, M.A.; Gonzalez, J.L.R.; Estala, A.M. Potential impact of future climate change on sugarcane under dryland conditions in Mexico. J. Agron. Crop. Sci. 2018, 204, 515–528. [Google Scholar] [CrossRef]
  28. Ruan, H.; Feng, P.; Wang, B.; Xing, H.; O’Leary, G.J.; Huang, Z.; Guo, H.; Liu, D.L. Future climate change projects positive impacts on sugarcane productivity in southern China. Eur. J. Agron. 2018, 96, 108–119. [Google Scholar] [CrossRef] [Green Version]
  29. Adhikari, U.; Nejadhashemi, A.P.; Woznicki, S.A. Climate change and eastern Africa: A review of impact on major crops. Food Energy Secur. 2015, 4, 110–132. [Google Scholar] [CrossRef]
  30. Lobell, D.B.; Burke, M.; Tebaldi, C.; Mastrandrea, M.D.; Falcon, W.P.; Naylor, R.L. Prioritizing Climate Change Adaptation Needs for Food Security in 2030. Science 2008, 319, 607–610. [Google Scholar] [CrossRef]
  31. Yoshida, K.; Srisutham, M.; Sritumboon, S.; Suanburi, D.; Janjirauttikul, N. Weather-induced economic damage to upland crops and the impact on farmer household income in Northeast Thailand. Paddy Water Environ. 2019, 17, 341–349. [Google Scholar] [CrossRef]
  32. Feng, H.; Babcock, B.A. Impacts of Ethanol on Planted Acreage in Market Equilibrium. Am. J. Agric. Econ. 2010, 92, 789–802. [Google Scholar] [CrossRef] [Green Version]
  33. FAO. The Future of Food and Agriculture–Trends and Challenges; Food and Agriculture Organization of the United Nations: Rome, Italy, 2017. [Google Scholar]
  34. Reuters. Thailand’s Sugar Output to Hit Nine-Year Low Due to Drought—Trade Body. 2020. Available online: https://www.reuters.com/article/thailand-sugar-output/thailands-sugar-output-to-hit-nine-year-low-due-to-drought-trade-body-idINKBN1ZU1Z3 (accessed on 13 April 2020).
Figure 1. Projected changes in temperature (Celsius) during 2046–2055 under Representative Concentration Pathway (RCP)4.5 and RCP8.5 from the baseline during 1992–2016.
Atmosphere 11 00408 g001
Figure 2. Projected changes in total annual rainfall (mm) during 2046–2055 under RCP 4.5 and RCP8.5 from baseline during 1992–2016.
Atmosphere 11 00408 g002
Figure 3. Projected changes in population density (people/km2) during 2046–2055 under scenario of moderate fertility rate. (a) Baseline of population density in 1992–2016 (people/km2); (b) percent of change of population density in 2046–2055 from baseline.
Atmosphere 11 00408 g003
Figure 4. Projected percent changes in yield of sugarcane under climate change scenarios. (a) Baseline yield (kg/ha); (b) percent of change in yield under RCP4.5; (c) percent of change in yield under RCP8.5.
Atmosphere 11 00408 g004
Figure 5. Projected percent changes in harvested area of sugarcane under climate change scenarios. (a) Baseline harvested area (1000 ha); (b) percent of change in harvested area under RCP4.5; (c) percent of change in harvested area under RCP8.5.
Atmosphere 11 00408 g005
Figure 6. Projected percent changes in sugarcane production under climate change scenarios. (a) Baseline production (MT); (b) percent of change in production under RCP4.5; (c) percent of change in production under RCP8.5
Atmosphere 11 00408 g006
Table 1. Summary statistics of selected variables at the provincial level.
VariablesMeanSDMinMax
Yield (kg/ha)58,652.5011,093.8418,612.5092,462.50
Harvested area (1000 ha)22.8929.090.03161.41
Average temperature (°C)27.590.6725.5729.10
Maximum rainfall in 24 h (mm/day)33.693.9322.9847.28
Extreme maximum temperature (°C)35.910.5534.4937.38
Total rainfall (mm)1331.35204.97886.762007.98
Population density (person/km2)125.6467.1721.56417.38
Lag received price (USD/ton)25.014.5413.2742.90
Lag wage (USD)6.471.264.889.91
%Irrigated area per province area12.7225.810166.72
No. of observation1242
Table 2. Determinants of yield.
VariablesCoefficientsStandard Errors
Time trend−1684.42 ***278.09
Time trend_sq127.56 ***12.61
%Irrigated area per province area100.52 ***13.20
Average temperature165,114.40 ***22,821.98
Average temperature_sq−2942.43 ***416.03
Total rain−37.08 ***11.09
Total rain_sq0.01 **0.01
Maximum rain in 24 h274.62 **137.55
Extreme max. temperature−8592.73 ***1012.81
El Niño−513.00585.99
La Niña−2244.31 ***622.67
North4057.12 ***1438.25
Northeast5618.21 ***1462.12
Southeast−12,246.34 ***2241.63
East−3348.69 ***1279.85
Lag price−645.31 ***154.72
Lag wage−8765.63 ***640.63
Constant−1.87 × 10⁶ ***312,248.60
Observations1242
R-square_adj.0.49
Root mean square error (MSE)6747.97
Notes: *, **, and *** indicate significance at the 10%, 5%, and 1% level, respectively.
Table 3. Determinants of harvested area.
VariablesCoefficientsStandard Errors
Time trend1.04 **0.51
Time trend_sq−0.05 **0.02
Population density−0.07 ***0.02
%Irrigated area per province area−0.09 **0.05
Total rain0.05 *0.03
Total rain_sq−2.20 × 10⁻⁵ **9.45 × 10⁻⁶
Maximum rain in 24 h−0.440.43
Extreme max. temperature−0.432.78
El Niño−0.671.28
La Niña7.65 ***1.70
North−16.46 ***3.72
Northeast−8.37 **3.88
Southeast−10.826.91
East−19.34 ***4.09
Lag price0.230.37
Lag wage10.78 ***2.91
Constant−36.0495.16
Observations1242
R-square_adj.0.11
Root MSE10.90
Notes: *, **, and *** indicate significance at the 10%, 5%, and 1% level, respectively.
Table 4. National projected changes in yield, harvested area, and production of sugarcane under RCPs 4.5 and 8.5 during 2046–2055 from baseline 1992–2016.
SugarcaneBaselinePercent of Change under RCP4.5Percent of Change under RCP8.5
Yield61,360 (kg/ha)−23.95−33.26
Harvested area1078 (1000 ha)−1.29−2.49
Production66.17 (1000 MT)−24.94−34.93

