Abstract
The paper provides the results of the inventory of greenhouse gases (GHGs) from road transport in Poland over the period 1990–2017. To estimate GHGs’ emission from road transport, a standardized methodology was applied, consistent with 2006 IPCC Guidelines for National Greenhouse Gas Inventories and EEA/EMEP Emission Inventory Guidebook 2019, as well as the COPERT 5 software. In the analysis, emissions of fossil carbon dioxide, methane and nitrous oxide were taken into account. Emissions of all considered GHGs were converted to equivalent carbon dioxide. Throughout the subsequent years of emission inventory, emissions of all GHGs revealed an increasing trend, except for methane. The main cause underlying this increase is the dynamic development of motorization in Poland. Thus, GHGs’ emissions were analyzed, taking into account the number of road vehicles and the intensity of their use. An increase in the average specific distance emission was found for fossil carbon dioxide (by ca. 5%) and for nitrous oxide (by ca. 10%), while for methane, there was a decrease (by more than 150%). The GHGs’ emissions from road transport in Poland could be significantly lower if more emphasis was placed on the use of fuels from renewable energy sources.
1. Introduction
One of the most severe environmental threats, associated with human activities, is global warming of the Earth’s surface and lower layers of the atmosphere and the consequential climate change impact. The distinct long-term rise in the average temperature at the Earth’s surface, compared to the preindustrial average in the mid-19th century, is univocally related to the beginning of the great industrialization [1,2]. Causes of global warming are seen in increasing concentrations of the so-called greenhouse gases (GHGs) in the atmosphere, which result from increasing emissions of these gases [1,2].
The rising concern of threats to the environment resulting from global warming of the Earth’s surface and the atmosphere prompted the international community to undertake supranational efforts to prevent climate change. Since Poland is party to the UNFCCC–United Nations Framework Convention on Climate Change adopted in New York on 9 May 1992 [3] and the Kyoto Protocol to the United Nations Framework Convention on Climate Change adopted in Kyoto on 11 December 1997 [4], the country is committed to participate in the international activity for preventing climate change. Within the framework of this activity, in line with Decision 24/CP.19 of the convention [5], Poland, likewise as other countries listed in Annex I to the convention, establishes national inventory of GHGs’ emissions [6]. Greenhouse gases and other pollutants hazardous to living organisms are inventoried in Poland by the National Centre for Emissions Management (KOBiZE) at the Institute of Environmental Protection–National Research Institute, subject to the Minister of Climate [6].
Emission of GHGs rises widespread concerns. Numerous reports and publications provide evidence that monitoring of GHGs’ emissions constitutes an indispensable element of care for the human environment [6,7,8,9,10,11,12,13,14]. There is a common understanding that motorization belongs to those human activities which have a special contribution to increasing GHGs’ emissions. One of the sectors of human activities for which the emission of GHGs is formally reported is the ”energy” sector, covering, among others, road transport, described by a systematic code NFR (Nomenclature for Reporting) 1.A.3.b [15,16].
The aim of this paper is to provide the analysis of the inventory of GHGs emitted by road transport in Poland between the years 1990–2017. The cited Poland’s National Inventory Report 2019 [6] contains quantitative data on carbon dioxide, methane and nitrous oxide emissions, as well as the fuel consumption of vehicles in individual years (1988–2017). The report does not contain data analysis, only its brief description. In this paper, an analysis based on data from the report, as well as additional data on vehicle activity in Poland, was conducted. Therefore, the essence of the study is not only to reveal trends in GHGs’ emissions from road transport in Poland over 27 years but also to show this emission from a different perspective, taking into account the number and annual mileage of vehicles. Due to the technical advancement of newer vehicles, despite the apparent increase in vehicle sizes and, consequently, fuel consumption, we observed only a slight increase in the average specific distance emission of carbon dioxide and nitrous oxide and a very large decrease for methane. The detailed quantitative data presented can be a reliable source of information for researchers involved in the investigation of different aspects of GHGs’ emissions, e.g., future trend prediction and environmental impact assessment.
2. Materials and Methods
The inventory of GHGs’ emissions takes into account the following substances–gases and groups of gases [15,16]:
- fossil carbon dioxide–CO2,
- methane–CH4,
- nitrous oxide–N2O,
- hydrofluorocarbons–HFC,
- perfluorocarbons–PFC,
- sulfur hexafluoride–SF6 and
- nitrogen trifluoride–NF3.
Only some of the above compounds were taken into account in this paper due to the high value of their emissions. These are:
- fossil carbon dioxide,
- methane and
- nitrous oxide.
In the analyses, emissions of individual GHGs were converted to the emission of equivalent carbon dioxide, based on the global warming potential (GWP) according to the IPCC Fifth Assessment Report (AR5)—Table 1 [15].

Table 1.
Global warming potential of gases [15].
The national annual emission of GHGs from road transport was estimated according to the requirements of the Intergovernmental Panel on Climate Change (IPCC) [17]. The general rules to be followed while establishing the inventory of pollutant emissions, both harmful to the health of living organisms and GHGs, are outlined in EEA/EMEP Emission Inventory Guidebook 2019 [16] and 2006 IPCC Guidelines for National Greenhouse Gas Inventories [17], as well as presented in papers [17,18,19,20].
To estimate the emission of greenhouse gases, the COPERT 5 (version 5.2.0) was applied [18]. COPERT is an MS Windows software program developed under EEA coordination as a European tool for the calculation of air pollutant emissions from road transport. COPERT is used by many European countries, including Poland, for reporting official emission data. The COPERT methodology is fully consistent with the EMEP/CORINAIR Emission Inventory Guidebook [16].
In this study, all vehicle categories, such as passenger cars, light and heavy-duty vehicles, buses, motorcycles and mopeds, are included. Emission estimates are based on [6]:
- fuel consumption;
- number of vehicles per vehicle category, combustion engine size or vehicle mass and emission control technology;
- the mileage per vehicle class;
- mileage share per road class (i.e., urban, rural and highways);
- the average speed per vehicle type and per road class;
- monthly temperature (min and max) and
- fuel characteristics.
Detailed data used in the COPERT software, which cover, among others, the numbers and intensity of the use of road vehicles as well as the pattern of vehicle traffic in Poland, were presented in publications [19,20,21,22] and in the KOBiZE report [6].
The relative change in the values examined between 1990 and 2017 was chosen to estimate the trend of changes in these values, in line with the formula:
where Xapr (1990)—value of the quantity “X” in 1990, approximated by the linear function and Xapr (2017)—value of the quantity “X” in 2017, approximated by the linear function.
The distance traveled annually by the road fleet is the sum of the products of numbers and annual distances traveled by road vehicles, by respective elementary categories “i".
where Ni—number of road vehicles of elementary category “i", Pi—annual distance traveled by road vehicles of elementary category “i" and K—number of elementary categories of road vehicles.
The energy equivalent to the annual fuel consumption by the road fleet equals the sum of the products of the fuel mass consumption by individual fuels and their calorific value:
where my—mass of fuel “y” consumed by road vehicles throughout a year, Wf y—calorific value of fuel “y”, y = G—gasoline, y = DF—diesel fuel, y = LPG—liquefied petroleum gas, y = NG—natural gas, y = BD—esters of biological oils (as spontaneous fuel and as biocomponents), y = BtOH—bioethanol (as spontaneous fuel and as biocomponents).
3. Results of the Greenhouse Gases Inventory
The results of GHGs’ inventory presented in this section are based on [6]. The national annual emission of the GHGs examined is illustrated in Figure 1, Figure 2 and Figure 3, while the emission of equivalent carbon dioxide for greenhouse gases is shown in Figure 4. Detailed quantitative data on the results presented is provided in the Supplementary Materials.
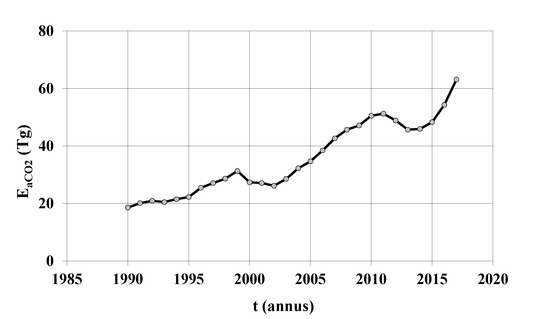
Figure 1.
National annual emission of fossil carbon dioxide—EaCO2 arising from road vehicles in Poland between 1990 and 2017.
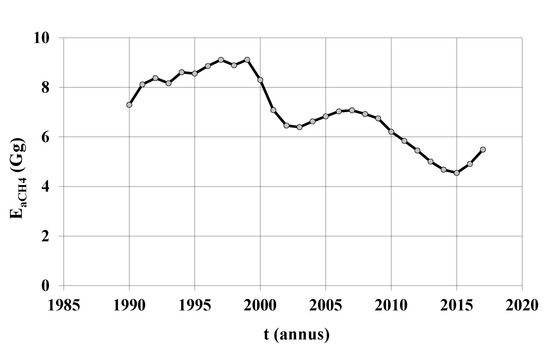
Figure 2.
National annual emission of methane—EaCH4 arising from road vehicles in Poland between 1990 and 2017.
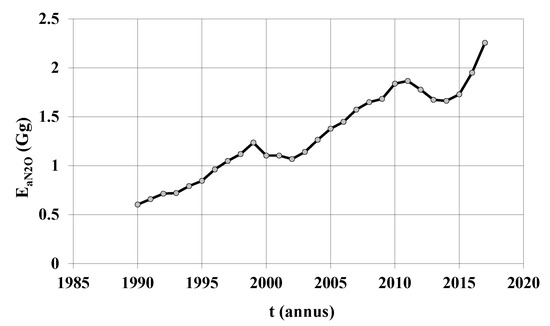
Figure 3.
National annual emission of nitrous oxide—EaN2O arising from road vehicles in Poland between 1990 and 2017.
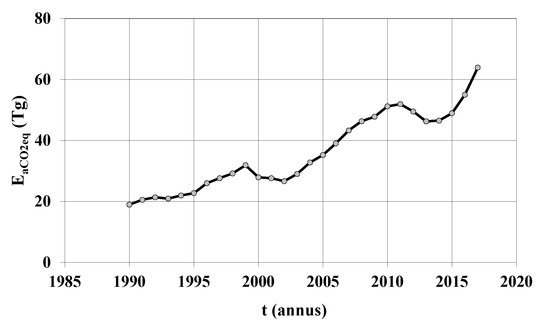
Figure 4.
National annual emission of equivalent carbon dioxide—EaCO2eq arising from road vehicles in Poland between 1990 and 2017.
Analyzing the annual emissions of GHGs from road vehicles in Poland, presented in Figure 1, Figure 2, Figure 3 and Figure 4, two opposite trends can be noticed. The annual pollutant emission has an increasing trend concerning fossil carbon dioxide (from 18.6 Tg in 1990 to 63.2 Tg in 2017) and nitrous oxide (from 0.603 Gg to 2.255 Gg), while for methane, it has a decreasing trend (from 7.295 Gg to 5.491 Gg). As a result, annual emissions of equivalent carbon dioxide also increased (from 18.9 Tg to 63.9 Tg), as it largely reflects the fossil carbon dioxide emission trend.
4. Analysis of the Results of the Greenhouse Gases’ Emissions Inventory
The contribution of national annual emission of equivalent carbon dioxide for methane and nitrous oxide to the aggregated emission of equivalent carbon dioxide for GHGs from road transport in Poland between 1990 and 2017 is illustrated in Figure 5. This contribution, averaged over the emission-balancing years, amounts to only 0.027%; thus, it is largely the emission of fossil carbon dioxide which is responsible for GHGs’ emissions from motorization.
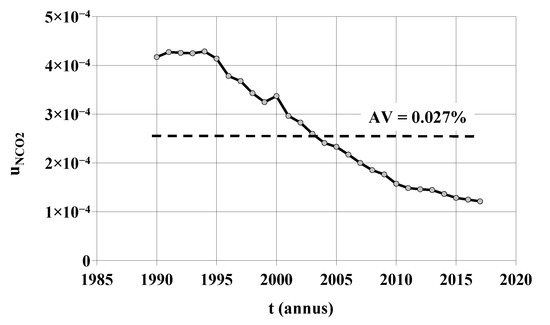
Figure 5.
Contribution of national annual emission of equivalent carbon dioxide for methane and nitrous oxide to the emission of equivalent carbon dioxide for GHGs—uNCO2 from road transport in Poland between 1990 and 2017.
Figure 6 presents the relative change in the national annual emission of GHGs—δEa from road transport in Poland in 2017 compared to the situation in 1990.

Figure 6.
Relative change in the national annual emission of GHGs—δEa from road transport in Poland in 2017 as compared to the situation in 1990.
A relative increase in the national annual emissions by ca. 100% was found for fossil carbon dioxide and nitrous oxide and, evidently, for equivalent carbon dioxide, while a downward trend was observed only in the case of methane. The increase in the national annual emission of fossil carbon dioxide results from the dynamic development of motorization in Poland following the year 1989 (Figure 7 and Figure 8) and the consequential increase in fossil fuel consumption (Figure 9 and Figure 10).

Figure 7.
Number of road vehicles—N in Poland between 1990 and 2017.
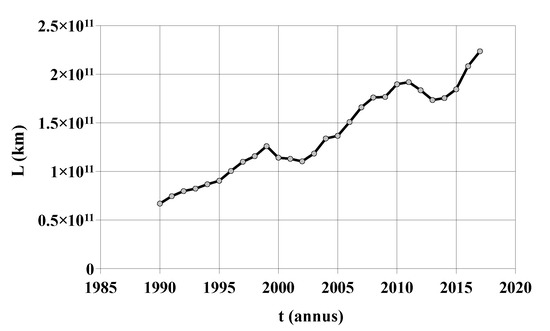
Figure 8.
Distance travelled annually by all road vehicles—L between 1990 and 2017.

Figure 9.
Annual fuel mass consumption by road transport in Poland between 1990 and 2017: G—gasoline, DF—diesel fuel, NG—natural gas, LPG—liquefied petroleum gas, BD—biodiesel and BtOH—bioethanol.

Figure 10.
Energy equivalent—EN to the fuel consumed by road vehicles in Poland between 1990 and 2017.
In Poland, a considerable increase in fuel consumption results from the dynamic development of motorization, which may be characterized by a relative increase in the number of vehicles exceeding 125%, and in the distance traveled by the road fleet, by ca. 100%. Figure 10 presents the energy equivalent to the fuel consumed by road vehicles in Poland between 1990 and 2017.
In Poland, the relative increase in the energy equivalent to the fuel consumed by road vehicles in 2017, as compared to 1990, exceeds 100%. Since the potential for enhancing the efficiency of internal combustion engines is constrained by the laws of nature (above all, by the Second Law of Thermodynamics) [23], the emissions of fossil carbon dioxide must inevitably be growing. In the case of fossil fuels, this means an increase in the carbon dioxide emissions, which intensifies the greenhouse phenomena in the atmosphere. Thus, utilizing fuels produced from renewable energy carriers or changing the vehicle drives to utilize renewable carriers as the primary energy carriers, provide a unique possibility to decrease the emission of fossil carbon dioxide.
The results of GHGs’ emissions inventories were analyzed based on the intensive characteristics of pollutant emissions, i.e., on specific distance emissions, which are a derivative of pollutant emissions with respect to the distance traveled by a vehicle. The average specific distance emissions of greenhouse gases in Poland between 1990 and 2017 are illustrated in Figure 11, Figure 12 and Figure 13, while the average specific distance emissions of equivalent carbon dioxide are shown in Figure 14. Detailed quantitative data on the results presented is provided in the Supplementary Materials.
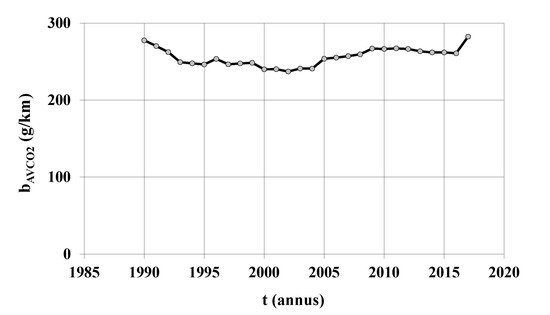
Figure 11.
Average specific distance emission of fossil carbon dioxide—bAVCO2 for the cumulated category of road vehicles in Poland between 1990 and 2017.

Figure 12.
Average specific distance emission of methane—bAVCH4 for the cumulated category of road vehicles in Poland between 1990 and 2017.

Figure 13.
Average specific distance emissions of nitrous oxide—bAVN2O for the cumulated category of road vehicles in Poland between 1990 and 2017.

Figure 14.
Average specific distance emissions of equivalent carbon dioxide—bAVCO2eq for the cumulated category of road vehicles in Poland between 1990 and 2017.
The relative change in the average specific distance emissions of GHGs from road transport in Poland in 2017, as compared to the situation in 1990, is shown in Figure 15.
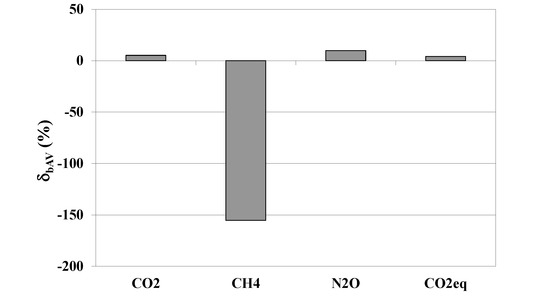
Figure 15.
Relative change in the average specific distance emissions of GHGs—δbAV from road transport in Poland in 2017 as compared to the situation in 1990.
The relative increase in the average specific distance emissions by ca. 5% was found for fossil carbon dioxide and by ca. 10% for nitrous oxide, while only for methane there was a decrease by more than 150%. The increase in the average specific distance emissions for fossil carbon dioxide, which correspond to the increase in operational fuel consumption (in cubic decimeters per 100 km), results primarily from the increase in the conventional size of vehicles mainly due to market actions. The relative change in the average specific distance emissions of carbon dioxide is small, because it is directly related to fuel consumption. As mentioned earlier, fuel consumption is determined by the thermal efficiency of internal combustion engines, which cannot be significantly increased due to physical limitations. The increase in fuel consumption, resulting from the increase in the vehicle conventional size, cannot be compensated for by the improvement in vehicle technical quality—in contrast to the capacity to decrease the emission of substances hazardous to living organisms [24,25]. Methane emission can be reduced to a large extent thanks to the technical improvement of internal combustion engines. The progress in this area is impressive, especially in the field of catalytic exhaust aftertreatment techniques. Methane is relatively low-reactive; hence, initially, the efficiency of its oxidation in catalytic reactors was not as high as it is today, when this efficiency was significantly improved thanks to the technical improvements of exhaust gas treatment systems.
5. Discussion
Emissions of GHGs from combustion engines of road transport depends on the consumption of fossil fuels. At present, all conventional motor fuels, i.e., gasolines and diesel oils, are crude oil-based fuels; thus, they are fossil fuels. Moreover, fossil fuels include also some gaseous nonconventional fuels, such as liquefied petroleum gas and natural gas. From among the renewable fuels, which may now be applied in practice, there should be mentioned some alternative fuels based on biodiesel (esters of biological oils) and bioethanol used as both biocomponents of conventional fuels and spontaneous fuels.
Road transport in Poland has been developing very dynamically, even though being based, as in the majority of countries, on conventional fuel consumptions. Given those circumstances, the possibility of decreasing carbon dioxide emissions by the improvement in vehicle construction is constrained by the laws of nature. Decelerating the pace of motorization development in order to significantly decrease the emissions of fossil carbon dioxide remains a socially unacceptable solution. Therefore, a seemingly unique approach would be to significantly increase the proportion of renewable energy carriers in the primary energy carriers, which are applied for utilizing effective energy to run road vehicles. The above statement is binding both for engine fuels and ways of generating power, which is used to charge electric cars.
The above conclusion undermines the views that there is a potential to decrease the emissions of fossil carbon dioxide due to the development of the so-called electromobility. Without a revolution in the energy sector, this idea is completely missed. The problem of GHGs’ emissions is not road transport but the power sector—the generation of useful energy, in particular, electrical energy. In a situation of a relatively low density of energy supply installations, the turn to nuclear power, among the majority of renewable energy carriers, seems to be inevitable.
Poland participates in efforts at the international level aimed at climate change mitigation; it has been a signatory to the UN Framework Convention on Climate Change since 1994 and the Kyoto Protocol since 2002. As a member of the European Union, Poland is obliged to reach in 2013–2020 average annual GHG emissions equal to 80% of the total GHG emission in the base year, i.e., 1989 for carbon dioxide, methane and nitrous oxide. Accordingly, the European Union law imposes on Poland GHG emission limits, including those covering the transport sector. It seems that the achievement of ambitious targets may be a serious challenge.
The biggest contributors to the GHG emissions in the transport sector in Poland are by far road vehicles with combustion engines. In 2017, they accounted for 96.52% of GHG emissions in this sector, which correspond to 14.78% of the total GHG emissions in the country [6]. In this context, the authorities stress the importance of a shift towards electromobility. The Strategy for Responsible Development [26], adopted in February 2017 by the Polish government, provides for stimulation of the design and the production of Polish electric vehicles, both for public and private transport. One of the main tasks set out in this document is the gradual increase in the share of electric vehicles in road transport in Poland. However, this may not necessarily be the optimal solution, taking into account the current Polish energy mix based mainly on the burning of fossil fuels: hard coal and lignite. On the contrary, Poland has to face the inevitable transition to renewable energy sources, which will reduce the consumption of fossil fuels and, consequently, GHG emissions from road transport.
6. Conclusions
In this study, the emissions of GHGs from road transport in Poland over the period 1990–2017 were analyzed, taking into account the number of road vehicles and the intensity of their use. The key outcomes can be summarized as follows:
- The annual emissions of fossil carbon dioxide and nitrous oxide showed an increasing trend, with a relative increase of ca. 110% and 100%, respectively, while in the case of methane, a downward trend was observed, representing a decrease of over 50%. In consequence, the annual emissions of equivalent carbon dioxide increased by ca. 110%.
- The average specific distance emissions were found to increase by ca. 5% for fossil carbon dioxide and by ca. 10% for nitrous oxide, while for methane, there was a decrease by more than 150%.
- The GHG emissions from road transport in Poland could be significantly lower if more emphasis was placed on the widespread use of renewable energy sources.
Supplementary Materials
The data presented in the graphs is available in tabular form online at https://www.mdpi.com/2073-4433/11/4/387/s1.
Author Contributions
Conceptualization, K.B. and Z.C.; methodology, K.B., Z.C., K.S. and M.Z.-L.; software, K.B. and Z.C.; validation, K.B., Z.C., K.S. and M.Z.-L.; formal analysis, K.B., Z.C. and J.L.; investigation, K.B., Z.C., K.S. and M.Z.-L.; resources, K.B., Z.C., K.S. and M.Z.-L.; data curation, K.B., Z.C., J.L. and M.Z.-L.; writing—original draft preparation, Z.C. and J.L.; writing—review and editing, K.B., Z.C. and J.L.; visualization, Z.C. and J.L.; supervision, Z.C. and K.S.; project administration, K.S. and funding acquisition, K.S. All authors have read and agreed to the published version of the manuscript.
Funding
The APC was funded by the Institute of Environmental Protection—National Research Institute.
Conflicts of Interest
The authors declare no conflict of interest.
References
- National Academy of Sciences. Climate Change: Evidence and Causes; The National Academies Press: Washington, DC, USA, 2014; Available online: https://www.nap.edu/catalog/18730/climate-change-evidence-and-causes (accessed on 10 March 2020).
- The Royal Society. Climate Change: A Summary of the Science; The Royal Society: London, UK, 2010; Available online: https://royalsociety.org/~/media/Royal_Society_Content/policy/publications/2010/4294972962.pdf (accessed on 10 March 2020).
- United Nations Framework Convention on Climate Change. United Nations Framework Convention on Climate Change; UNFCC: New York, NY, USA, 1992; Available online: https://unfccc.int/resource/docs/convkp/conveng.pdf (accessed on 14 April 2020).
- United Nations Framework Convention on Climate Change. Kyoto Protocol to the United Nations Framework Convention on Climate Change; UNFCC: Kyoto, Japan, 2005; Available online: https://unfccc.int/resource/docs/convkp/kpeng.pdf (accessed on 14 April 2020).
- United Nations Framework Convention on Climate Change. Addendum. Part two: Action taken by the Conference of the Parties at its nineteenth session FCCC/CP/2013/10/Add.3. Available online: https://unfccc.int/resource/docs/2013/cop19/eng/10a03.pdf (accessed on 14 April 2020).
- Poland’s National Inventory Report 2019; Greenhouse Gas Inventory for 1988–2017; Institute of Environmental Protection—National Research Institute, National Centre for Emission Management (KOBiZE): Warszawa, Poland, 2019; Available online: https://www.kobize.pl/uploads/materialy/materialy_do_pobrania/krajowa_inwentaryzacja_emisji/NIR_POL_2019_23.05.2019.pdf (accessed on 10 March 2020).
- 1990–2016 Air Pollutant Emission Inventory Report; Environment and Climate Change Canada: Gatineau, Canada, 2018; Available online: https://www.canada.ca/content/dam/eccc/images/apei/apei-2018-en.pdf (accessed on 10 March 2020).
- United States Environmental Protection Agency. Air Emissions Inventories 2017. Available online: https://www.epa.gov/air-emissions-inventories/2017-national-emissions-inventory-nei-data (accessed on 10 March 2020).
- Canada’s Greenhouse Gas Inventory. Environment and Climate Change Canada. 2016. Available online: https://www.canada.ca/en/environment-climate-change/services/climate-change/greenhouse-gas-emissions.html (accessed on 10 March 2020).
- Chłopek, Z.; Olecka, A.; Szczepański, K.; Bebkiewicz, K. Share of road transport in greenhouse gas emissions in Poland in 1988–2015. Environ. Prot. Nat. Resour. Ochrona Środowiska i Zasobów Naturalnych 2018, 29, 13–20. [Google Scholar]
- Chłopek, Z.; Olecka, A.; Szczepański, K. Greenhouse gas emission from motor vehicles in Poland in 2015. Environ. Prot. Nat. Resour. Ochrona Środowiska i Zasobów Naturalnych 2018, 29, 9–13. [Google Scholar]
- Greenhouse Gas Emissions 1990–2016, National Inventory Report; Norwegian Environment Agency, Statistics Norway, Norwegian Institute of Bioeconomy Research: Oslo, Norway, 2018; Available online: https://www.miljodirektoratet.no/globalassets/publikasjoner/M985/M985.pdf (accessed on 10 March 2020).
- National Inventory Report Sweden 2018. In Greenhouse Gas Emission Inventories 1990–2016; Swedish Environmental Protection Agency: Stockholm, Sweden, 2018; Available online: https://www.naturvardsverket.se/upload/miljoarbete-i-samhallet/internationellt-miljoarbete/miljokonventioner/FN/national-inventory-report-2018.pdf (accessed on 10 March 2020).
- Inventory of U.S. Greenhouse Gas Emissions and Sinks: 1990–2017; United States Environmental Protection Agency: Washington, DC, USA, 2019. Available online: https://www.epa.gov/sites/production/files/2019-04/documents/us-ghg-inventory-2019-main-text.pdf (accessed on 10 March 2020).
- Myhre, G.; Shindell, D.; Bréon, F.-M.; Collins, W.; Fuglestvedt, J.; Huang, J.; Koch, D.; Lamarque, J.-F.; Lee, D.; Mendoza, B.; et al. Anthropogenic and Natural Radiative Forcing. In Climate Change 2013: The Physical Science Basis. Contribution of Working Group I to the Fifth Assessment Report of the Intergovernmental Panel on Climate Change; Stocker, T.F., Qin, D., Plattner, G.-K., Tignor, M., Allen, S.K., Boschung, J., Nauels, A., Xia, Y., Bex, V., Midgley, P.M., Eds.; Cambridge University Press: Cambridge, UK; New York, NY, USA, 2013; p. 731. [Google Scholar]
- EMEP/EEA Air Pollutant Emission Inventory Guidebook; Publications Office of the European Union: Brussels, Belgium, 2019; Available online: https://www.eea.europa.eu/publications/emep-eea-guidebook-2019 (accessed on 10 March 2020).
- 2006 IPCC Guidelines for National Greenhouse Gas Inventories. Available online: https://www.ipcc-nggip.iges.or.jp/public/2006gl/ (accessed on 10 March 2020).
- COPERT 5. The Industry Standard Emissions Calculator. Available online: https://www.emisia.com/utilities/copert (accessed on 30 March 2020).
- Bebkiewicz, K.; Chłopek, Z.; Lasocki, J.; Szczepański, K.; Zimakowska-Laskowska, M. Inventory of pollutant emission from motor vehicles in Poland using the COPERT 5 software. Combust. Engines 2019, 178, 150–154. [Google Scholar]
- Chłopek, Z.; Dębski, B.; Szczepański, K. Theory and practice of inventory pollutant emission from civilization-related sources: Share of the emission harmful to health from road transport. Arch. Autom. Eng. Archiwum Motoryzacji 2018, 79, 5–22. [Google Scholar]
- Bebkiewicz, K.; Chłopek, Z.; Szczepański, K.; Zimakowska-Laskowska, M. Issues of modeling the total pollutant emission from vehicles. Proc. Inst. Veh. 2017, 110, 103–118. [Google Scholar]
- Chłopek, Z.; Bebkiewicz, K. Model of the structure of motor vehicles for the criterion of the technical level on account of pollutant emission. Eksploatacja i Niezawodnosc Maint. Reliab. 2017, 19, 501–507. [Google Scholar] [CrossRef]
- Chłopek, Z. Modelowanie Procesów Emisji Spalin w Warunkach Eksploatacji Trakcyjnej Silników Spalinowych; Oficyna Wydawnicza Politechniki Warszawskiej: Warszawa, Poland, 1999. [Google Scholar]
- Worldwide Emissions Standards. On and Off-Highway Commercial Vehicles. 2018–2019. Delphi Technologies. Available online: https://d2ou7ivda5raf2.cloudfront.net/sites/default/files/inline-files/booklet%20emission%20heavy%20duty.pdf (accessed on 10 March 2020).
- Worldwide Emissions Standards. Passenger Cars and Light Duty Vehicles. 2019–2020. Delphi Technologies. Available online: https://d2ou7ivda5raf2.cloudfront.net/sites/default/files/2019-05/2019-2020%20Passenger%20Car%20%26%20Light-Duty%20Vehicles.pdf (accessed on 10 March 2020).
- Strategy for Responsible Development for the Period up to 2020 (including the Perspective up to 2030); The Ministry of Investment and Economic Development of the Republic of Poland: Warsaw, Poland, 2017. Available online: https://www.gov.pl/documents/33377/436740/SOR_2017_streszczenie_en.pdf (accessed on 29 March 2020).
© 2020 by the authors. Licensee MDPI, Basel, Switzerland. This article is an open access article distributed under the terms and conditions of the Creative Commons Attribution (CC BY) license (http://creativecommons.org/licenses/by/4.0/).