Article

Numerical Simulation of Haze-Fog Particle Dispersion in the Typical Urban Community by Using Discrete Phase Model

1
School of Naval Architecture, Ocean and Civil Engineering, Shanghai Jiao Tong University, Shanghai 200240, China
2
Key Laboratory of Hydrodynamics of Ministry of Education, Shanghai 200240, China
3
State Key Laboratory of Ocean Engineering, Shanghai Jiao Tong University, Shanghai 200240, China
*
Authors to whom correspondence should be addressed.
These authors contributed equally to this work.
Atmosphere 2020, 11(4), 381; https://doi.org/10.3390/atmos11040381
Submission received: 16 February 2020 / Revised: 6 April 2020 / Accepted: 8 April 2020 / Published: 14 April 2020
(This article belongs to the Special Issue The Motion of Particles in Turbulence)

Abstract

:
The haze-fog particle dispersion in urban communities will cause serious health and environmental problems, which has aroused society attention. The aim of the present investigation is to reveal the underlying mechanisms of haze-fog particle dispersion via Computational Fluid Dynamics (CFD) method, and then to provide a groundwork for the optimal spatial arrangement of urban architecture. The Delayed Detached-eddy Simulation turbulence model (DDES) and Discrete Phase Model (DPM) are utilized to investigate the wind flow distribution and the particle dispersion around the building group. The numerical results show that the particle dispersion is dominated by the incoming wind flow, the layout of architectural space and the type and distribution of vortex. The ‘single body’ wake pattern and the vortex impingement wake pattern are identified in the wind flow field, which have different effects on the distribution of haze-fog particle. The cavity formed by the layout of the building group induces primary vortex and secondary vortex, which will make it more difficult for the particles entering the square cavity to flow out. Moreover, the concentration of the particle in the rear of the buildings is relatively low due the effect of attached vortices.

1. Introduction

With the rapid development of urban construction, cities have attracted more people to work and live in them. However, the air pollution seriously affects the health and life quality of inhabitants lived in cities [1]. According to the statistical data of World Health Organization (WHO), the air quality of about 97% of cities in low- and middle- income countries exceeds the limits of WHO air quality guidelines [2]. And the fine particles in polluted air could lead to various diseases, including chronic respiratory diseases, heart disease, and even lung cancer. In recent years, with the increasing concern to air quality, haze-fog has attracted more public attentions. Related with a high level of pollutant particles with different aerodynamic diameters, however, the mechanisms of the development and dispersion of haze-fog particle have not been fully understood.
Due to the several sources of pollution in urban areas [3] and the effect of buildings on the dispersion rate of pollutant particles, haze-fog generally occurs in complex structured urban. One of the main physical factors affecting the dispersion of haze-fog particles is the wind flow, which can be easily changed by the complex topography of urban areas. The wind flow filed around buildings in urban canopy layer is influenced by a serious of parameters, including incoming flow conditions [4], and layout of buildings [5]. Compared with the studies of the characteristics of atmospheric boundary layer, the complex, and sometimes distinctive building distribution makes the studied flow patterns not applicable to all situations.
For the motion of fine pollutant particles, experiments (including field measurements and wind tunnel tests), and mathematical methods, have been widely used to evaluate the pollutant dispersion [6,7,8]. Cui et al. [9] conducted the on-site investigation of the effect of U-type street canyon on air pollutants dilution. This type of street canyon was designed as a common building disposition to reduce the impact of cold wind in the past. However, it was found that this configuration was harmful for air quality. The results of the on-site measurements suggested that the air quality index in the street canyon was higher by about 20% than that at open space. While the field experiments can take account for all factors under real conditions, and provide sufficient information on the particle dispersion problem [10], it is very difficult to control the wind condition and evaluate its instantaneous influence. Besides, it is quite time consuming and expensive. Similarly, wind tunnel tests also have the drawbacks in cost and experimental environment simulation [11]. On the other hand, the mathematical models, including the empirical and semi-empirical model, were reported to fail to predict pollutant concentrations in complex structured urban accurately [12,13], though continuous work has been done to improve the prediction accuracy [14,15].
Due to the rapid development in computational technology, the numerical simulation method has played an important role in evaluating the flow filed and the pollutant particle dispersion [16,17]. Taleghani et al. [18] investigated the impact of different green barriers on the pollutant dispersion. The air quality was recorded in Manchester, and an advection-diffusion equation was solved for the dispersion simulation. He et al. [19] combined CFD simulations with intake fraction and daily pollutant exposure index to investigate the effect of street canyon aspect ratios, viaducts, and noise barriers on the flow field and passive pollutant exposure in the street canyons. Besides, two different CFD turbulence model, including Reynolds-averaged Navier Stokes (RANS) model and Large-eddy Simulation (LES) were utilized to evaluate the pollutant dispersion in downtown Montreal by Gousseau et al. [20]. The CFD simulations were validated by wind tunnel tests, and the results indicated that the LES model provided a better performance in solving the dispersion equation. However, it should be acknowledged that the LES model requires much more computing resources during simulating the pollutant dispersion in actual urban environment. Therefore, in recent years, the hybrid model Delayed Detached-eddy Simulation (DDES), combining the advantages of RANS and LES, has been applied to the evaluation of urban environment [21]. On the other hand, the particle dispersion process can be regarded as the development of multiphase flows, in which the Euler-Lagrange approach and the Euler-Euler approach are the main calculation methods [22]. The Lagrangian Discrete Phase Model (DPM) solves the dispersed phase by tracking a large number of particles through the calculated flow field. The momentum, mass, and energy of these particles can be exchanged with the fluid field. And the interaction of a particle with flow field turbulent eddies can be simulated by Random Walk Model (RWM) [23]. In our previous work [24], the particle dispersion in a simple building group (nine identical square columns in 3 × 3 layout mode) under different wind directions was simulated by using the DDES and DPM. We have concluded that this method is a promising approach to simulate the haze-fog particle physical development in the urban environment, and given some results about the characteristics of flow interference and particle dispersion.
Besides, to evaluate the haze-fog particle dispersion and the effect of reducing particulate matter concentrations in real urban areas, some specific sites or buildings were investigated [17,25,26]. Vervoort et al. [25] conducted the CFD simulations to investigate the effect of electrostatic precipitation devices on reducing PM 2.5 in the building at the American Embassy School Campus. It was found that the PM 2.5 was reduced by about 34% under the studied boundary conditions, and that method could effectively improve the local air quality. Buccolieri et al. [17] investigated the effect of different types of trees on pollutant concentrations and ventilation within the Marylebone Rd in London. The influences of wind speed and wind direction were evaluated by numerical model, and the site-specific impact of trees on flow field and pollutant fluxes was discussed.
In the current study, a typical building group in urban area specifically built for graduate students was selected to conduct the investigation of pollutant particle dispersion in the urban environment. The three dimensional DDES turbulence model and DPM were utilized to investigate the wind flow distribution and particle dispersion around the building group.
The structure of this paper is organized as follows: The governing equations of flow field and particle dispersion are presented in Section 2. Section 3 demonstrates the physical model and the boundary conditions, and a mesh independence test is addressed in Section 4. Subsequently, the numerical results of the wake characteristics around the building group and the particle dispersion analysis are presented in Section 5. Finally, Section 6 summarizes the main conclusions.

2. Numerical Method

2.1. Flow Fundamental Governing Equation and Turbulence Model

The DDES realizable k ε model, which has been well verified as an efficient and accurate numerical method in our previous study [24], is employed in this work. The unsteady RANS models are employed in the boundary layer, while the LES treatment is applied to the separated regions. The incompressible RANS equations are written as:
ρ t + ( ρ u i ) x i = 0
( ρ u i ) t + ( ρ u i u j ) x j = p x i + x j μ u i x j + u j x i 3 2 δ i j u l x l + x j ρ u i u j ¯
where u is the velocity field, and p, t, ρ , and μ are the pressure, time, air density and dynamic viscosity of the incoming flow, respectively. By filtering the time-dependent Navier-Stokes equations, the governing equations employed for LES can be written as:
ρ t + ( ρ u i ˜ ) x i = 0
( ρ u i ˜ ) t + ( ρ u i ˜ u j ˜ ) x j = σ i j x j p ˜ x i τ i j x j
where u ˜ and p ˜ are the filtered velocity and pressure, respectively. σ i j is the stress tensor due to molecular viscosity and τ i j is the subgrid-scale stress.
In the DDES realizable k ε model, the transport equations for turbulent kinetic energy k and turbulent dissipation rate ε are written as:
( ρ k ) t + ( ρ k u j ) x j = x j μ + μ t σ k k x j + G k + G b Y k
( ρ ε ) t + ( ρ ε u j ) x j = x j μ + μ t σ ε ε x j + ρ C 1 S ε ρ C 2 ε 2 k + ν ε + C 1 ε ε k C 3 ε G b
where k and ε are the turbulence kinetic energy and the turbulence dissipation rate, respectively. σ k = 1.0 and σ ε = 1.2 are the turbulent Prandtl numbers for k and ε . ν is the kinematic viscosity, ν = μ / ρ . And μ t = ρ C μ k 2 / ε denotes the turbulence visosity. G k and G b are the production terms of turbulence kinetic energy due to the mean velocity gradient and buoyancy. In the current model, G k = μ t S 2 , G b = 0 . And C 1 = m a x 0.43 , η η + 5 , η = S k ϵ , S = 2 S i j S i j , where S i j is the mean strain rate tensor, S i j = 0.5 ( u j / x i + u i / x j ) . Besides, C 2 , C 1 ε and C 3 ε are constants, and the dissipation term Y k can be calculated with the length scale l D D E S , written as:
Y k = ρ k 3 / 2 l D D E S
where
l D D E S = l r k e f d m a x ( 0 , l r k e C d e s Δ m a x )
l r k e = k 3 / 2 ϵ
where C d e s is a constant of 0.61, Δ m a x is the grid spacing, and f d is the defer function. In addition, it is assumed that the whole computational domain is isothermal, so that the energy equation is not involved in the model.

2.2. Motion Equation and Turbulent Dispersion of Particles

Considering that the volume ratio of pollutant particles in the actual atmospheric environment is quite low, the Lagrangian sparse discrete phase model is adopted to describe and track the movement of the particles in wind field. The DPM model generally requires that the volume fraction of the particle phase is less than 10%, but the mass ratio of particle can be greater than 10%. In this case, the interaction between the particles and the particles and the influence of the volume fraction of the particles on the continuous phase can be ignored. A single particle in arbitrary motion is assumed to be a mass point. According to the interaction between fluid and particles, the force acting on the particle can be divided into three classes: (1) Forces that are independent of the relative motion between fluid and particles, including gravity (Eqution (10)) and buoyancy (Eqution (11)); (2) Longitudinal forces produced by the interaction of fluid and particles, including Stokes drag force (Eqution (12)), Basset force, virtual mass force and so on; (3) Transverse forces produced by the interaction of fluid and particles, including Saffman lift force. For the present investigation, the Basset force, the virtual mass force and the Saffman lift force are ignored due to their small impact. The gravity, buoyancy, and Stokes drag force are calculated as:
F g = 1 6 π d p 3 ρ p g
F b = 1 6 π d p 3 ρ a g
F D = 18 μ ρ p d p 2 C c u a u p
where ρ p , ρ a , d p , u p , u a and g are the particles density, air density, particle diameter, particle velocity, air velocity, and gravitational acceleration, respectively. C c denotes the Cunningham correction factor, which is given as [27]:
C c = 1 + 2 λ d p ( 1.257 + 0.43 ( 1.1 d p / 2 λ ) )
here, λ is the mean free path of a particle. According to the law of conservation of momentum, the momentum equation of the particle can be expressed as:
m p d u p d t = F D + F g + F a
where m p is the mass of a single particle, t is the time and F a is the additional forces such as pressure gradient force ( F p = 1 6 π d p 3 d p d x , here p is the pressure acted on the particle, and x represents the x-direction). Besides, a Discrete Random Walk (DRW) model considering the interaction between particles and discrete vortices of the flow, is employed to simulate the particle’s turbulent dispersion [28]. The characteristics of each vortex are represented by the random pulsation velocity of the slow gaussian probability distribution function (15) and the time scale (16).
u p = ζ u a 2 = ζ 2 k 3
τ e = 2 T L
where ζ represents a random number that follows a normal distribution. T L is the Lagrange integral time scale of fluid. For the k ε model, T L = 0.15 k / ε .
In the present study, considering that the volume ratio of pollutant particles in the actual atmospheric environment is quite low, the particle loading rate is also very low. Thus, the Lagrangian sparse DPM is adopted to describe and track the movement of the particles in wind field. For this model, the interaction between particles and flow field is treated as one-way coupling. It means that the fluid can affect the motion of particles, but the particles have no effect on the fluid. Moreover, the motions of each particle are tracked separately after the flow filed computation is converged (turbulence statistical stability). Meanwhile, the positions of each particle at each tracking time step are recorded. Zhao et al. [28] simulated indoor particle dispersion in a ventilated room by DRW model. The simulated results are compared with the published measured data and two Eulerian models’ results. The comparison shows that the Lagrangian DRW model agrees well with the experimental data. Their simulations validated the Lagrangian DRW model is accurate for the indoor particle dispersion. Based on their studies, we applied the DRW model to simulate the particle’s turbulent dispersion in the present investigation.

3. Geometric Model and Boundary Conditions

3.1. Geometric Model

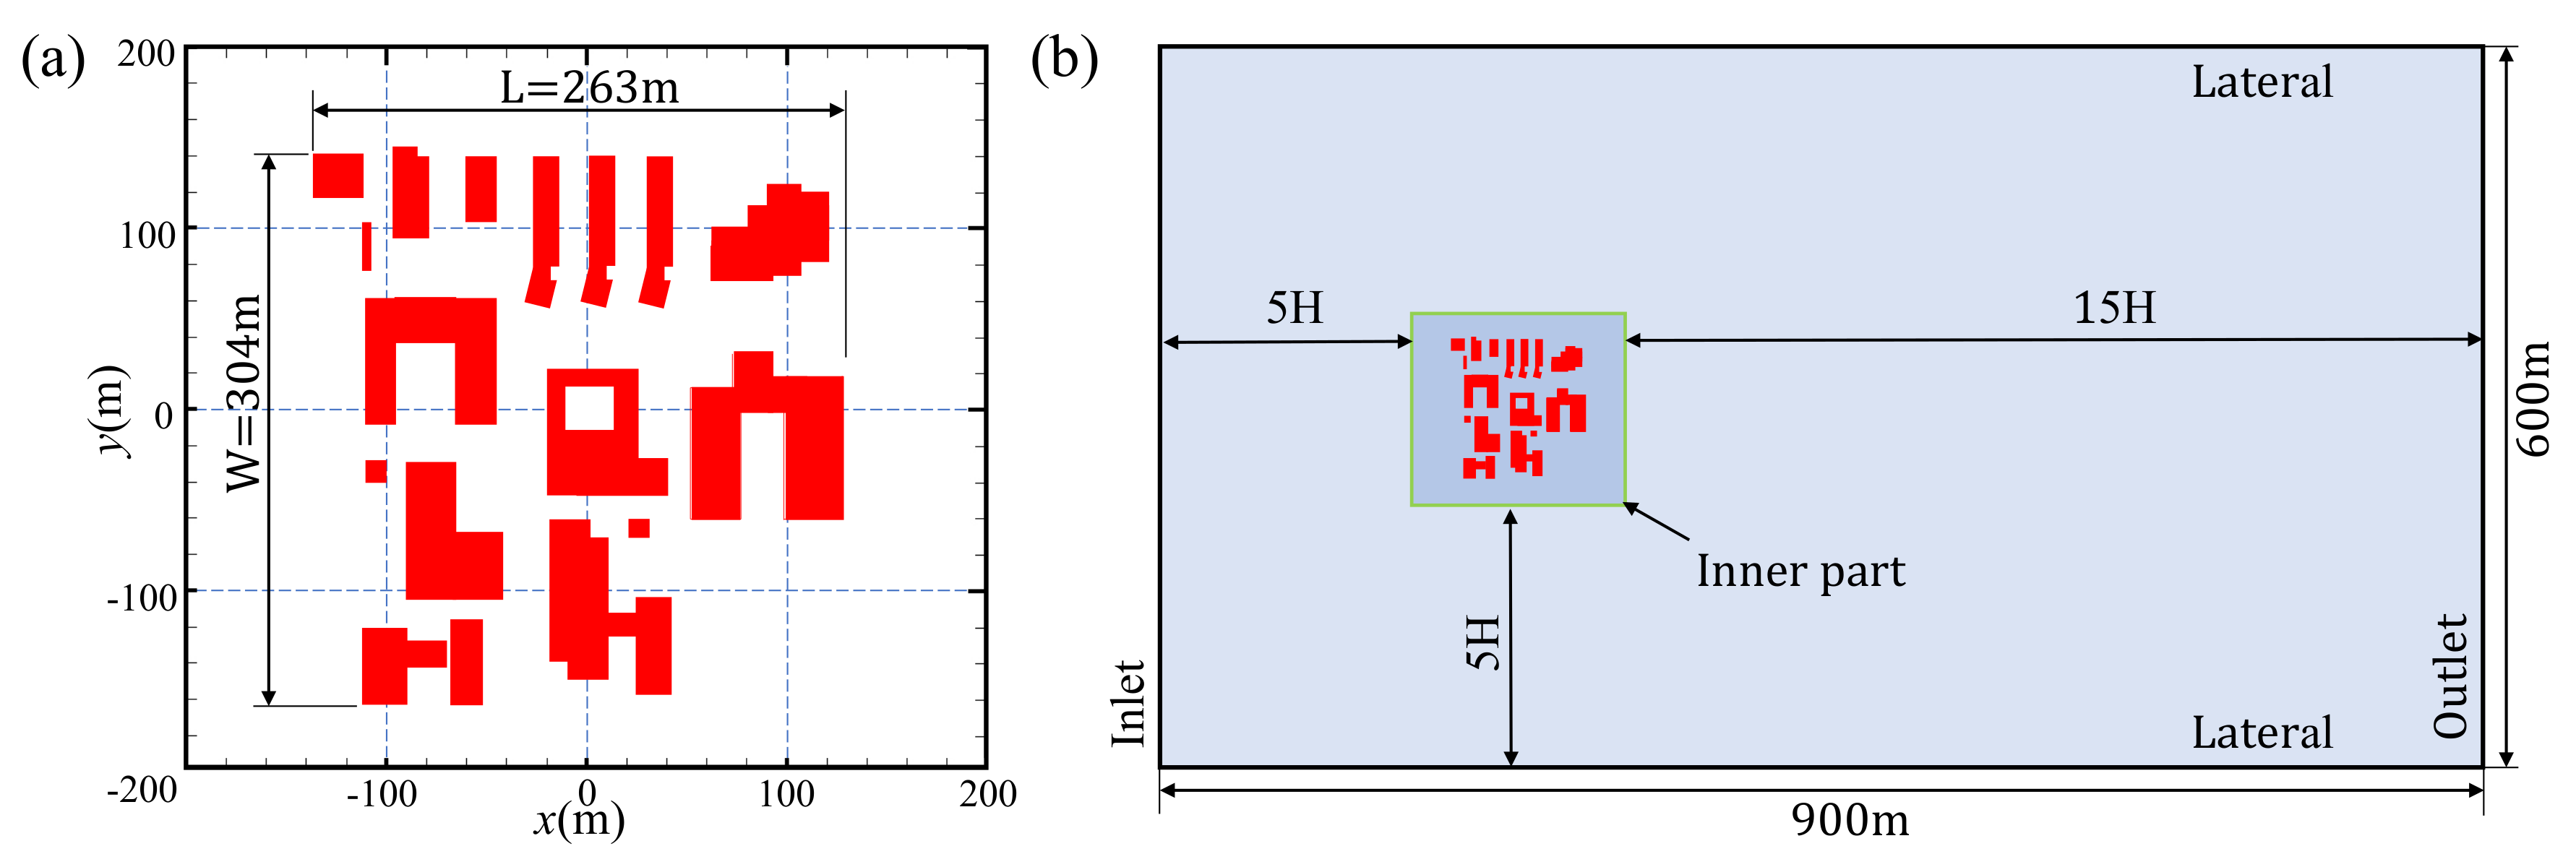
The selected building group, including apartments, office buildings, catering, and commercial centers, are shown in Figure 1a. The full-size model was built, while the edges and corners of the internal buildings in the area were simplified properly without affecting the overall calculation results, as depicted in Figure 1b. The overall plane size of the area is about W × L = 304 m × 263 m ( W = 304 m in the cross-flow direction; L = 263 m in the streamwise direction), and the height of the tallest building is about H = 30 m . The distance between the inlet and building group is 5H, and the outlet is 15H far in downstream of the buildings. In addition, refereed to our previous work [24] and other researchers’ work [17,29,30], the vertical height of the computational domain is set as 10H to ensure that the results are insensitivity to the domain height. Therefore, the total size is 900 m × 600 m × 300 m . The corresponding sketches of model layout and computational domain are illustrated in Figure 2.
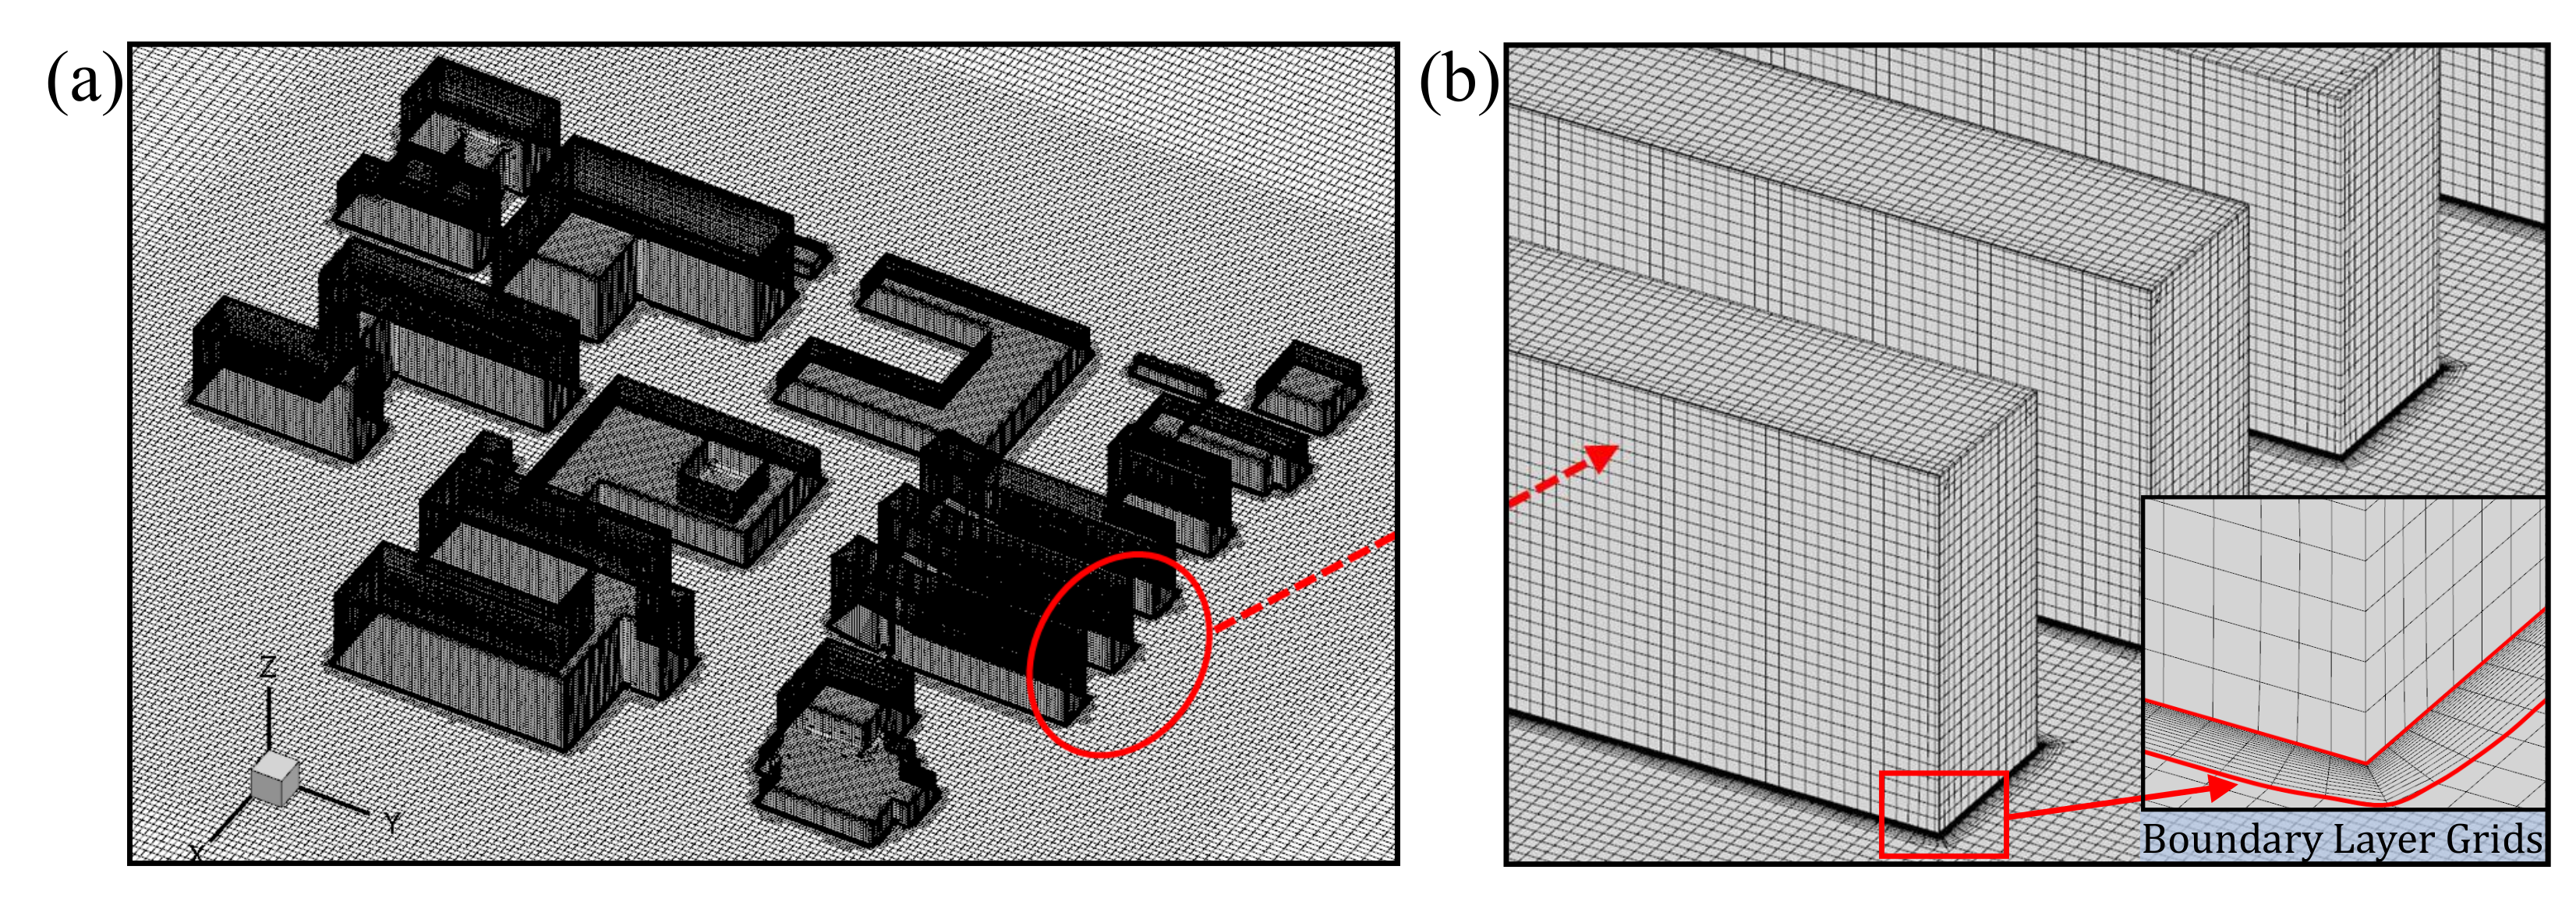
In order to improve the accuracy and efficiency of calculation, the computational domain is divided into two parts: internal region around the buildings and external region. According to Liu and Niu [31], different grids are required for the windward side, lateral sides and the leeward side of the air flow around a bluff body, i.e., y + of 5 approximately for the windward side and y + of 2 for the leeward and lateral sides ( y + is a non-dimensional wall distances for wall-bounded flow, defined as y + = u * y / ν , where u * is the friction velocity at the nearest wall and y is the distance to the nearest wall). In the present work, the boundary layer has 20 grid nodes and a total thickness of 0.11 with the growth ratio of 1.2 to ensure y + less than 2 for all walls. Thus, the basic grid size of the internal region is 2 m , and the grid size of building surface is about 0.5 m . The total thickness of the boundary layer is 1 m . The number of the internal grid is about 4.5 million, and that of the external grid is about 4.5 million. The mesh distribution of the building group and the vicinity boundary layer grids are shown in Figure 3. In addition, a mesh independence test is addressed in Section 4, and a systematic validation test of the numerical method which have been well conducted will not be repeated here.

3.2. Boundary Conditions

The boundary conditions in the numerical simulation are divided into two categories, one is the flow field boundary conditions, the other is the particle phase boundary conditions. The velocity inlet is set to simulate the atmospheric boundary layer flow [32]:
U Z = U r e f Z Z r e f α
where U r e f = 3 m/s is the mean wind speed at standard reference height Z r e f , and α is the power law exponent. In the present study, according to the local building codes (Ministry of Construction [33]), Z r e f and α are equal to 10 and 0.15, respectively. Z represents the vertical height. Turbulent kinetic energy ( k i n ) and turbulent dissipation rate ( ϵ i n ) at the inlet boundary are determined with reference to our previous study [24] and AIJ [34].
k i n = 3 2 ( U Z · I i n ) 2
ϵ i n = C μ 3 / 4 · k i n 3 / 2 / l i n
where C μ 0 . 09 , I i n is the turbulence intensity and l i n is the turbulence length at the inlet boundary, which can be calculated as:
I i n = 0.1 Z Z G α 0 0.05 , Z b < Z Z G 0.1 Z b Z G α 0 0.05 , Z Z b
l i n = 100 Z 30 0.5 , 30 < Z Z G 100 , Z 30
where Z b , Z G , and α 0 are the parameters for different terrains, and in the current study, the values are Z b = 10 , Z G = 450 , and α 0 = 0.2 .
The non-slip condition was applied at the ground and building surfaces. And the pressure outlet with zero gauge pressure boundary condition was set at the outlet. Besides, the symmetry boundary condition was specified at top and lateral sides of the computational domain. For the particle phase boundary conditions, the escape boundary condition that allows particles to pass through was specified to the inlet, outlet, and the lateral and top sides. Assuming that particles are trapped when they strike to the ground surface, the trap boundary condition was applied at the ground [35]. Besides, a reflect boundary condition was adopted to describe the collision between particles and building surfaces [36].
In the current study, the commercial software Fluent 17.0 was utilized to solve the model. The SIMPLE algorithm was used for coupling the pressure-velocity equation and the DDES model. The second-order upwind scheme was set up for the spatial discretization and the bounded second order implicit time integration was chosen for temporal discretization. The time step is 0.1 s, the convergence criterion is set to 10 4 , and the maximum number of iterations for each time step is 20. The total number of time steps were 10,000. Besides, the numerical simulation can be mainly divided into two processes: the flow phase was calculated for about 300 seconds to ensure turbulence statistical stability (corresponds to about 11 convective times), and then the particles ( PM 2.5 ) were injected into the flow field. The mass flow rate released was set according to the inlet area, inlet speed, and PM 2.5 concentration of 250 μ g / m 3 . Besides, the unsteady mode was adopted for injection of particles. The particles were released every 0.5 s and then the motion was tracked in the flow field. The diameter of the particles were set as 2.5 μ m and the density was 2400 kg / m 3 . When the number of particles in the whole computational domain remained basically unchanged, the calculation was finished (about 33 million particles in the present study).

4. Mesh Independence

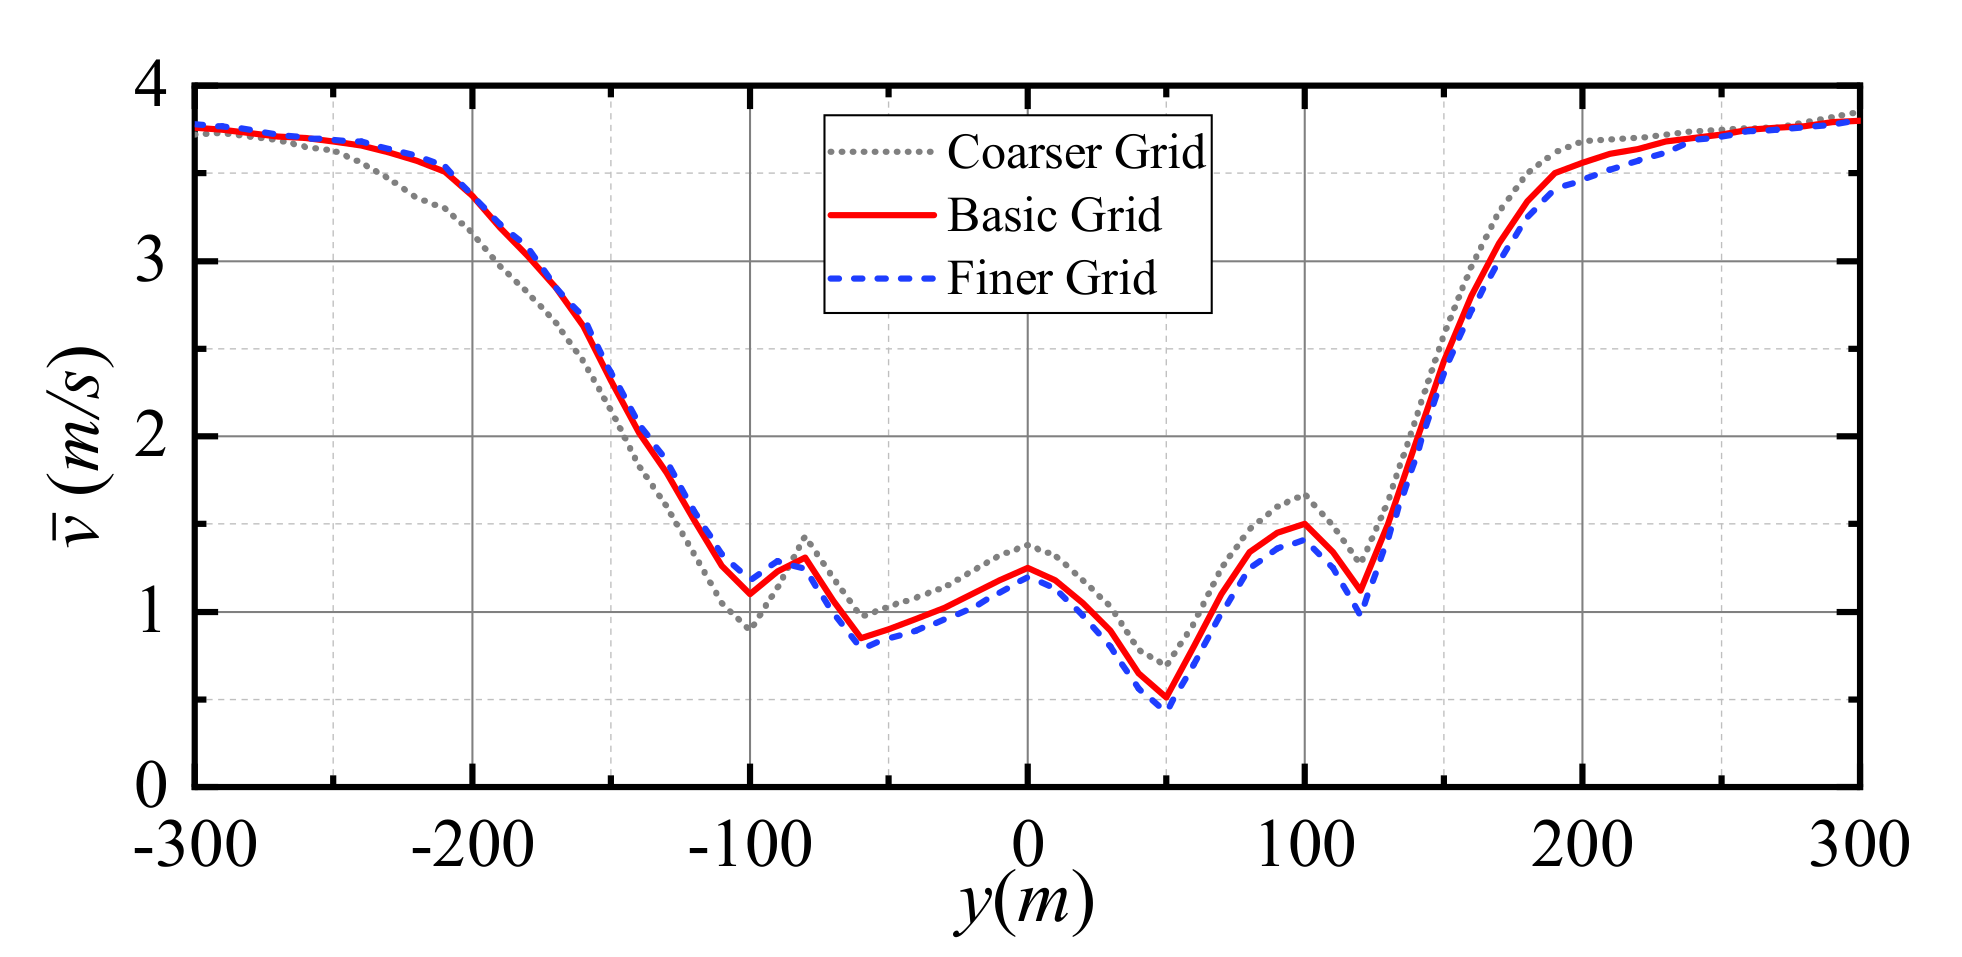
The quality of grid is the key to the accuracy and efficiency of simulation [37]. The grid sensitivity analyses are performed by varying the resolution. Here, a finer mesh topology of 18 million elements (twice the number of basic mesh) and a coarser mesh topology of 4.5 million elements (half the number of basic grid) are employed to predict the wind flow by the DDES model. Figure 4 summarizes the results of the time averaged velocity magnitude distribution in the wake of the building group ( x = 150 m ) at horizontal plane of z = 2 m for the for the three different quality mesh. It is clear that the difference of the velocity distribution between the basic grid and the finer grid is quite small in contrast to the results by the coarser grid. Therefore, it can be concluded that the basic mesh topology employed in the present study is sufficient for the accuracy of the simulation.

5. Results and Discussion

The flow field is the determinant factor affecting the development and dispersion of haze-fog particle. Thus, the wake characteristics behind the buildings are firstly investigated in this section, including velocity distribution and three-dimensional vortex structure, and then the characteristics of particle dispersion are analyzed.

5.1. Wake Characteristics around the Building Group

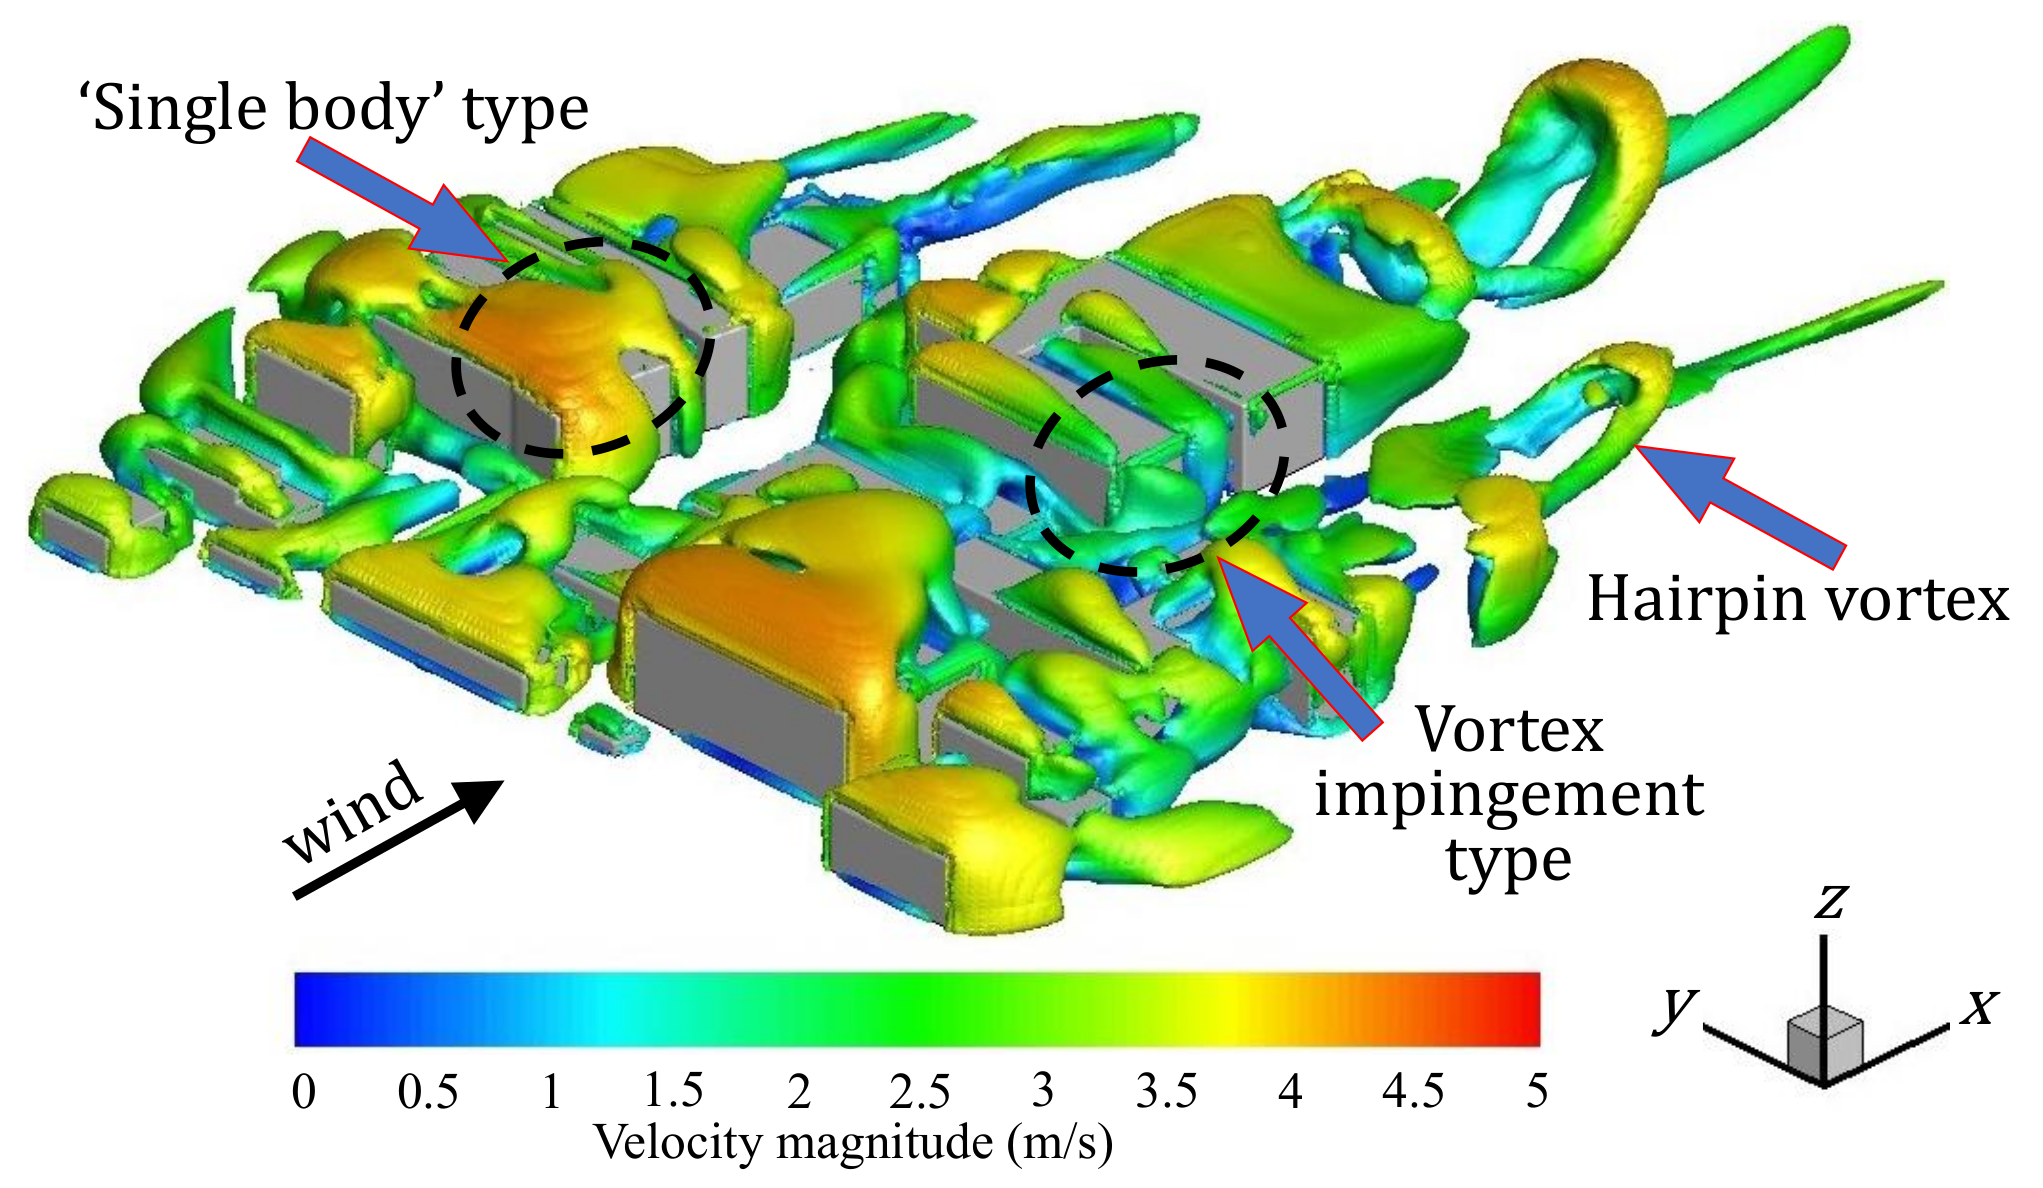
The wake topology of the flow around buildings is visualized by Q-criterion in Figure 5. It can be clearly seen that the vortex pattern is extremely complex due to the complex spatial layout of the buildings including tandem, side-by-side, staggered distribution and so on. The vortex around buildings can be divided into two main categories, as shown in Figure 5: (1) When the gap spacing between buildings is sufficiently large, the vortex will separate from the upstream building, further disturbing the wake oscillation behind the downstream buildings. Referred to Zhu et al. [38], it is named as vortex impingement type; (2) When the gap spacing between buildings is very small, the vortex shed from the front building will attach to the rear one, which is defined as ‘single body’ type. Overall, the airflow hits the front row of the building in the inflow direction, and then accelerates on the top of the building. Large scale vortex structures are formed on the top of the relatively high buildings, and separate from the apex and two sides. Hairpin vortices can be clearly identified in the wake of buildings, and then dissipate in the further downstream wake. The characteristics of wake will be explained in detailed by the contours of velocity and vorticity later. Besides, the swirling vortex would carry particles through the flow field resulting in uneven distribution of particles, which will be further analyzed in the Section 5.2.
The typical vertical planes, y = 0 m, y = −50 m and y = 100 m, are selected to analyze the distribution characteristics of wind field, as shown in Figure 6. On the middle plane y = 0 m, as depicted in Figure 6a, the incoming airflow is blocked by the front buildings in the windward side of the building group, contributing to re-circulation zone behind these buildings with low velocity. Besides, the velocity decreases at the top of the building due to the viscous frictional resistance of the boundary layer. The largest low-speed zone appears at the rear of the building group. In addition, from the second row to the last row, there is an eddy in front of the building similar to an open cavity flow, as shown in Figure 6b. The reason for this phenomenon is that the ground, and the front and rear buildings form a square cavity with three sides closed. Because of the centrifugal instability, the primary vortex and secondary vortex are formed. The formation of such vortex will make it difficult for the particles entering the square cavity to flow out. It can be further verified by the investigation of particle dispersion in the Section 5.2.
Figure 6c–f show the velocity distribution characteristics on the vertical planes of y = −50 m and y = 100 m. Different from that on the plane of y = 0 m, the distance between the front and the rear buildings varies significantly. However, the open cavity flow can be also found on these two planes. As shown in Figure 6c, the flow on this plane is influenced not only by the front and the rear buildings, but also by the buildings outside the plane. It’s also verified in Figure 6d. Therefore, the flow analysis in horizontal plane needs to be conducted.
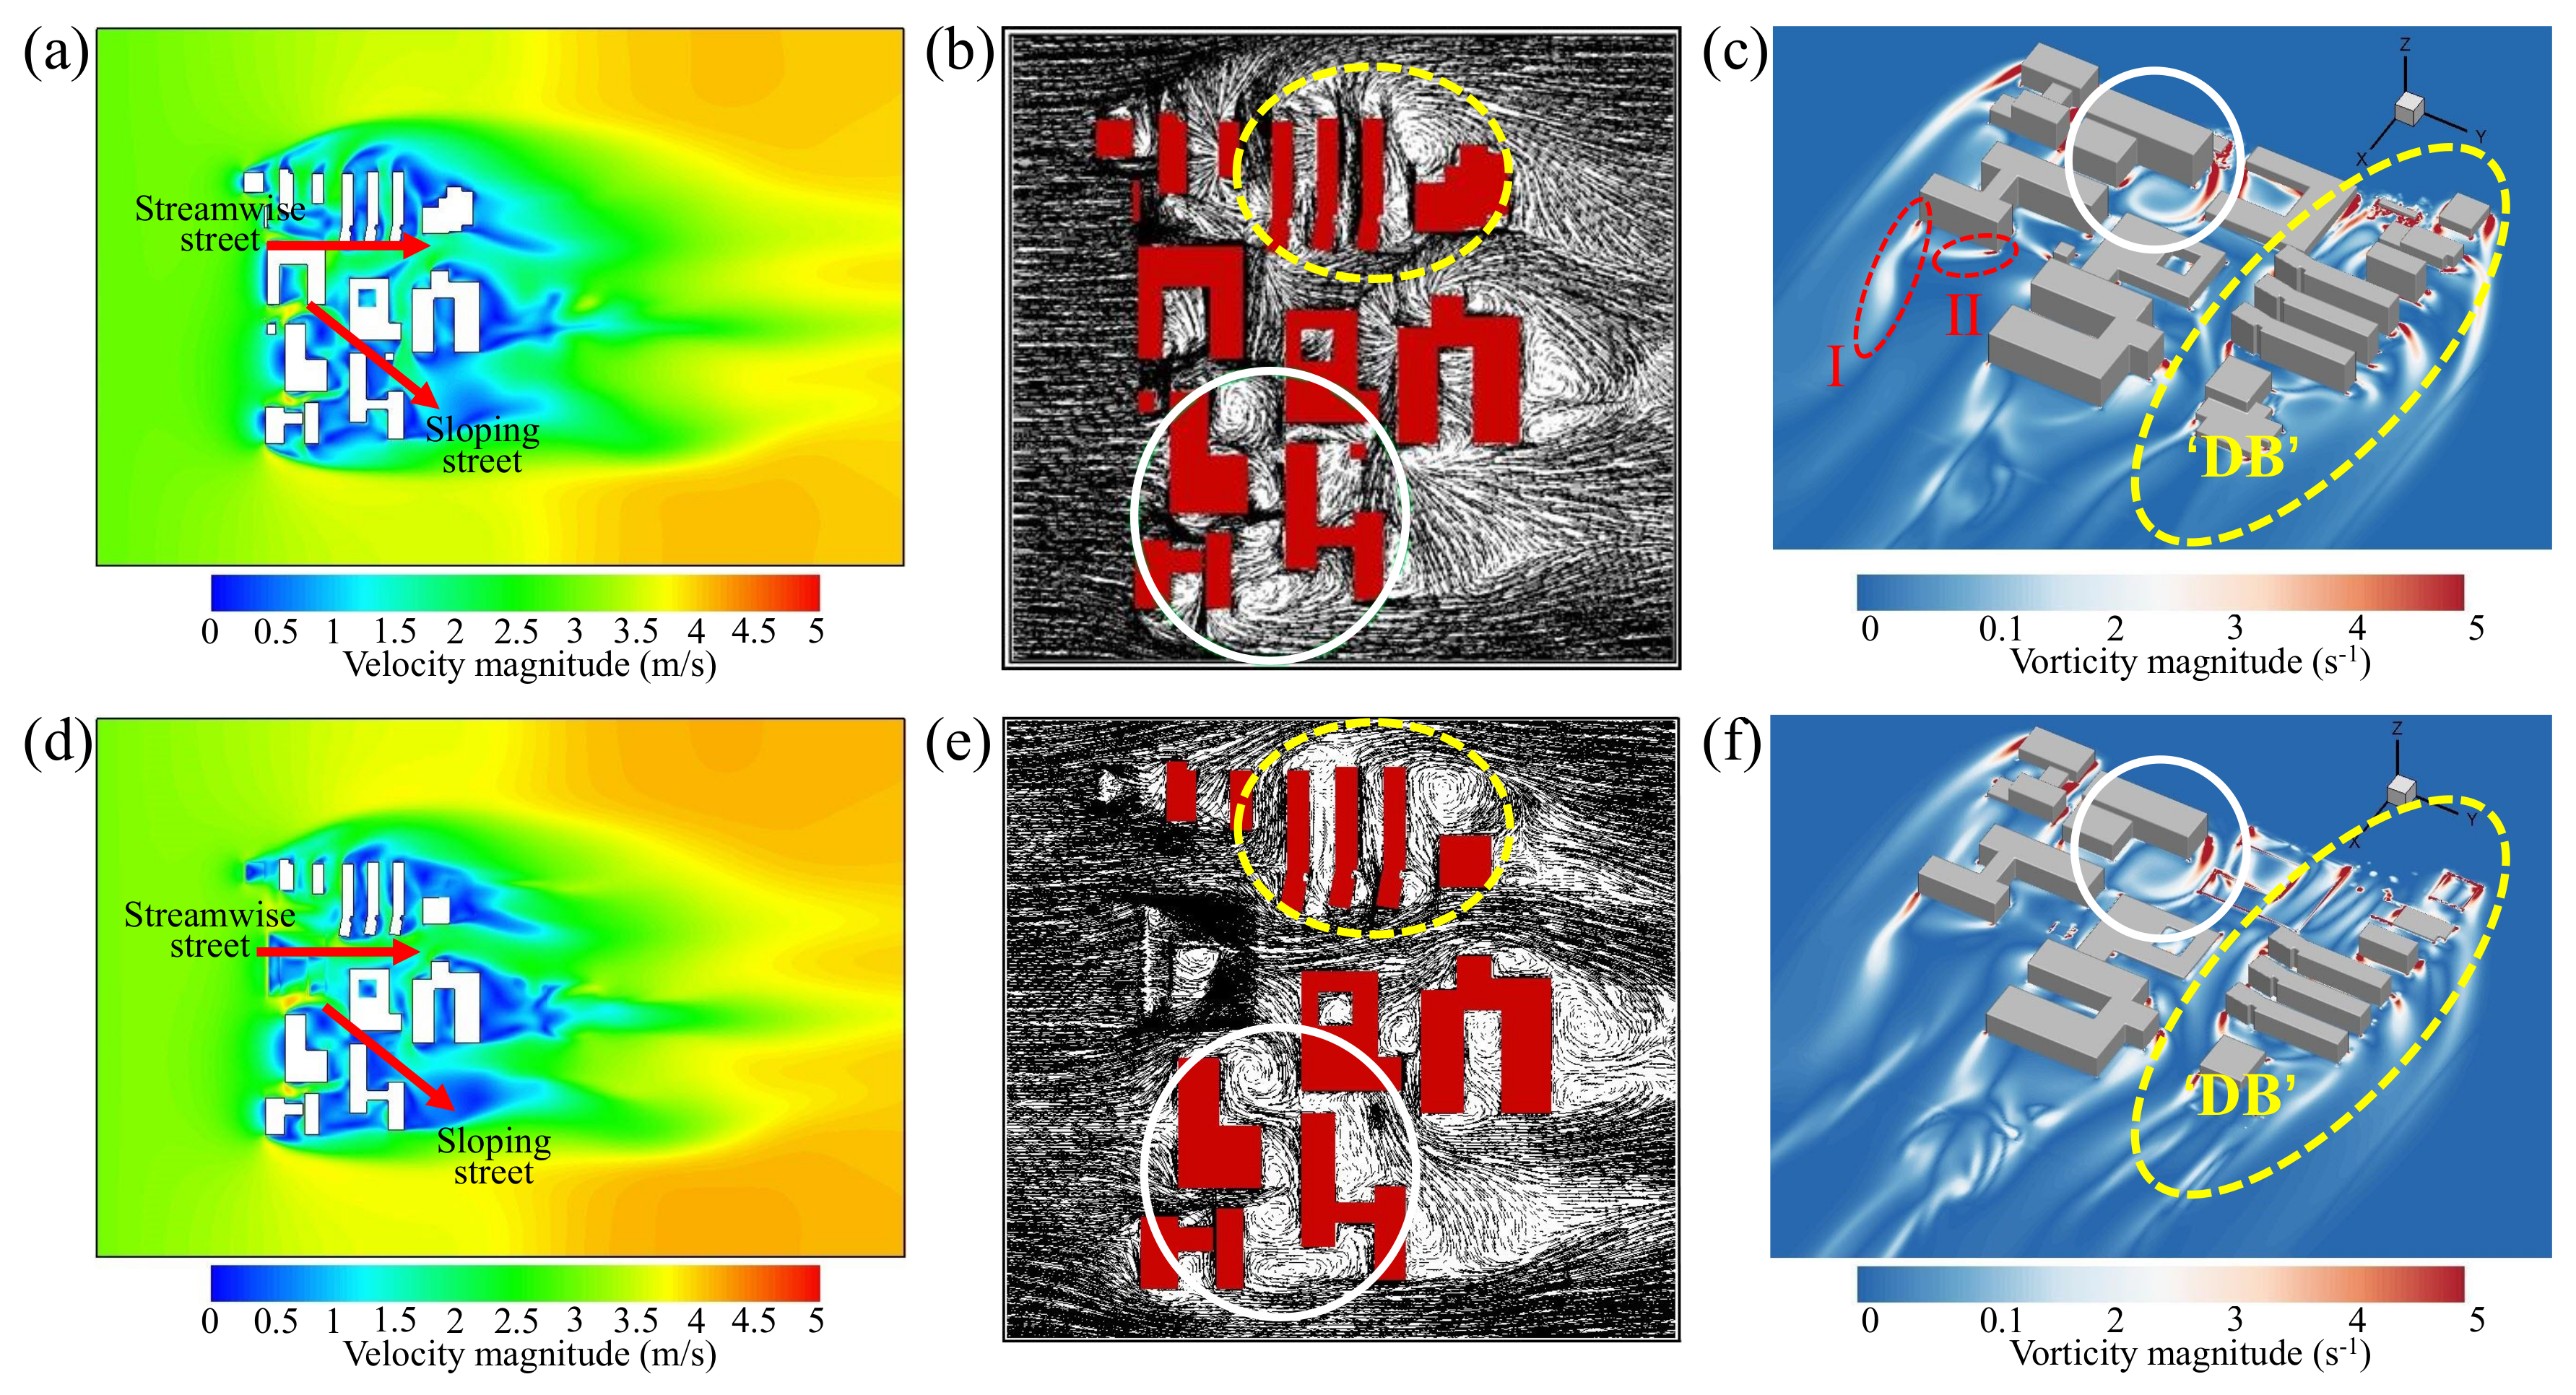
Flow distribution characteristics on horizontal planes of z = 2 m and z =10 m are plotted in Figure 7. Consistent with the results of vertical planes, a large-scale deceleration zone appears behind the rear of the building group. The incoming flow passes through the streamwise street canyons at a relatively high speed, while a relatively low speed in the sloping street, as illustrated in Figure 8a,d. The relatively low speed in the sloping street will cause the distribution characteristics of particles to change significantly, which will be further analyzed in Section 5.2.2. Besides, according the velocity vector diagrams and the vorticity contours, different wake patterns can be identified. The white lines shown in Figure 7b,e represent vortex impingement type wake, and the yellow dash lines mark the ‘single body’ type wake. These types of vortex structures have been been also marked in Figure 5. Figure 7c,f are the vorticity contours on the planes of z = 2 m and z = 10 m. For the vortex impingement type wake, the spacing between the upstream and the downstream buildings is sufficiently large and the vortex are fully developed in this region (white lines shown in Figure 7c,f). For the ‘single body’ type wake, the shear layers emanating from the upstream building roll up behind the downstream building and produce a single wake. However, the downstream building, which is named as building ‘DB’ in Figure 7c,f, disrupts the development of the classical Kármán vortex street, making the downstream flow pattern even more chaotic. Specifically, it can be seen that the transverse scale of the building ‘DB’ is smaller than that of the upstream buildings and is located in the re-circulation zone of the upstream buildings. This small scale building breaks the symmetry of the wake, causing a strong vortex to attach to one side of the rear of the upstream buildings, while vortex on the other side fail to develop adequately, as dipected in Figure 7b,e. This vortex will have an important effect on particle dispersion. Besides, on the other side of the building group, the strength of the outer vortex (‘vortex I ’ shown by red line in Figure 7c) is obviously stronger than that of the inner one (‘vortex I I ’). The strong ‘vortex I ’ will carry the particles to the rear of the structure quickly, which will be further verified by the particle dispersion analysis.
Overall, different flow patterns in different regions lead to different particle transport modes, which would eventually induce uneven distribution of particles. A deeper analysis of particle dispersion in conjunction with flow characteristics is presented below.

5.2. Particle Dispersion Analysis

Combined with the results and discussion demonstrated in Section 5.1, the particle dispersion in vertical and horizontal directions is analyzed to study the particle dispersion within the building group in this section.

5.2.1. Particle Dispersion on the Vertical Plane

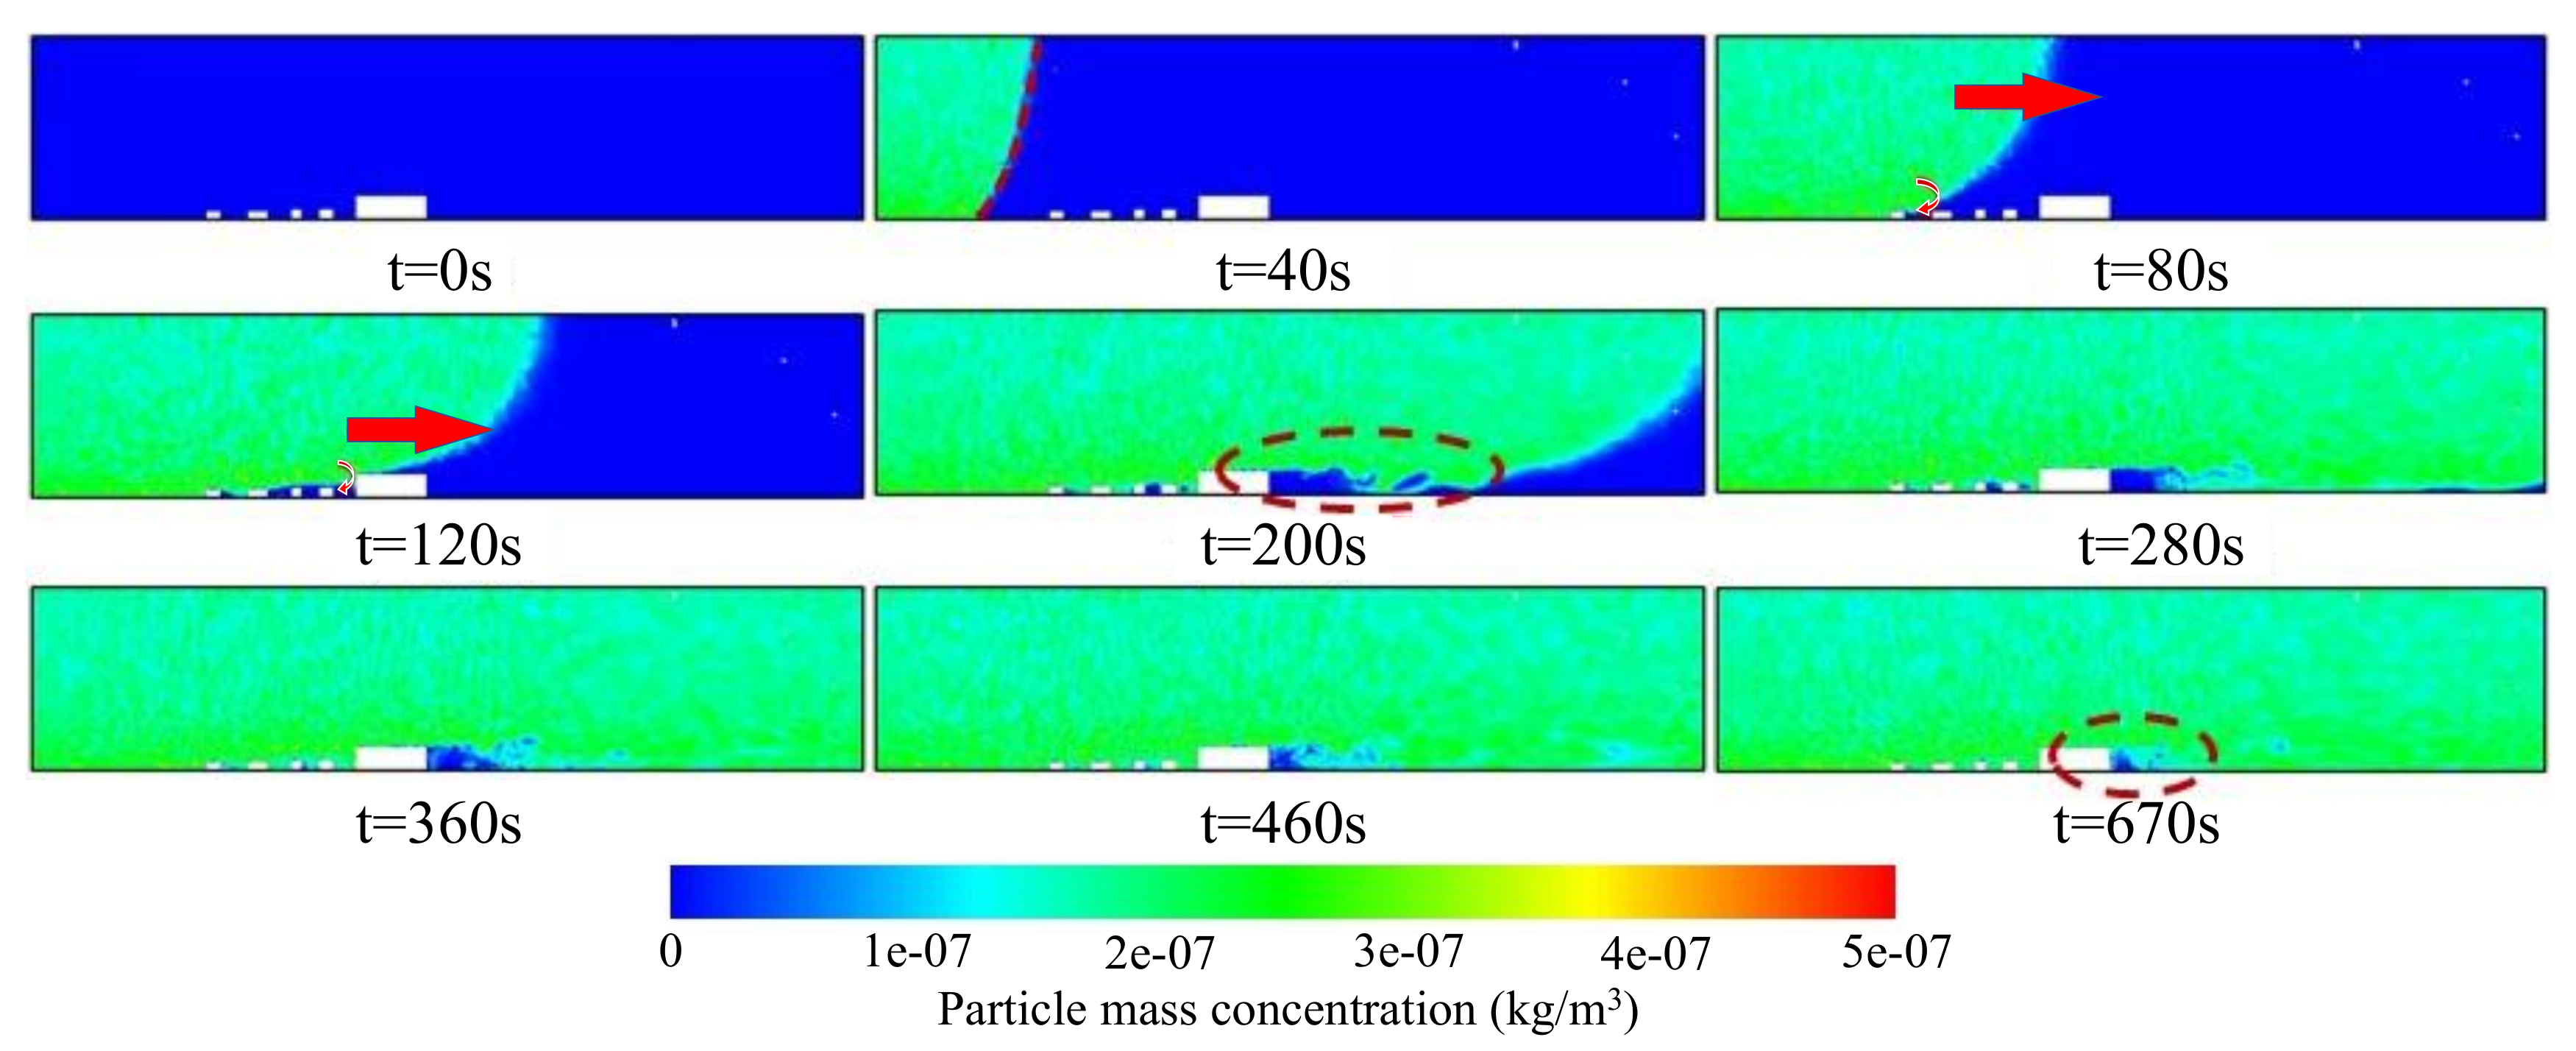
Figure 8 shows the contours of particle mass concentration on the plane of y = 0 m at the dispersion phases from t = 0 s to t = 670 s. Consisting with the wind velocity profile, the gradient profiles of concentration distribution, are presented at t = 40 s. When t = 80 s, the haze-fog particles reach the first row of the building group and then cross over its top, gradually entering the street canyon in front of second row of buildings through the vortex transport. At t = 120 s, the particles at the bottom have spread to the last row of buildings. However, due to the high height of the building, the particles directly spread downward. When t = 200 s, particles fill the entire computational domain and are exported from the outlet. However, a particle-empty region is still found behind the building group that similar to the results of previous study [24]. The size of the empty region decreases with time but always exists. Moreover, there are some small-scale empty regions behind buildings and gradually disappearing from t = 200 s to 670 s, as shown in Figure 8. There are two reasons for this phenomenon: firstly, there is a re-circulation zone at the rear of buildings. Fewer particles are transported directly from the upstream to the re-circulation zone. On the other hand, the particles gradually spread to the region over time, resulting in the decrease of particle-empty region. In addition, the particle concentration near the ground is slightly higher than that in the air due to the gravitational deposition.
Contours of particle mass concentration on different vertical planes at the end of the calculation (t = 670 s) are illustrated in Figure 9. It is obvious that the particle concentration close to the ground is slightly higher than that in high altitude due to the gravitational deposition. Besides, the particle concentration in front of buildings is higher than that in other areas. By comparing the concentration on the three planes, it can be found that the size of particle-empty region is largest on the plane of y = 100 m, which is directly related to the wind flow flied. Influenced by the special configuration of the last row of buildings shown in Figure 9, there is no vortex shedding behind this building, which can be found in the vorticity contour depicted in the Figure 7c,f. Due to no vortex shedding here, there is a steady flow. For a steady flow [39], the flow is stable with a large re-circulation zone which can be further verified by the contours on the horizontal planes shown in Figure 7. Thus, fewer particles are transported directly from the upstream to this area. Generally, considering the influence of building height, the higher buildings in the front would lead to a region with lower particle concentration in the rear, while lower buildings in the front would aggravate the accumulation of haze-fog particles in the downstream.

5.2.2. Particle Dispersion on the Horizontal Plane

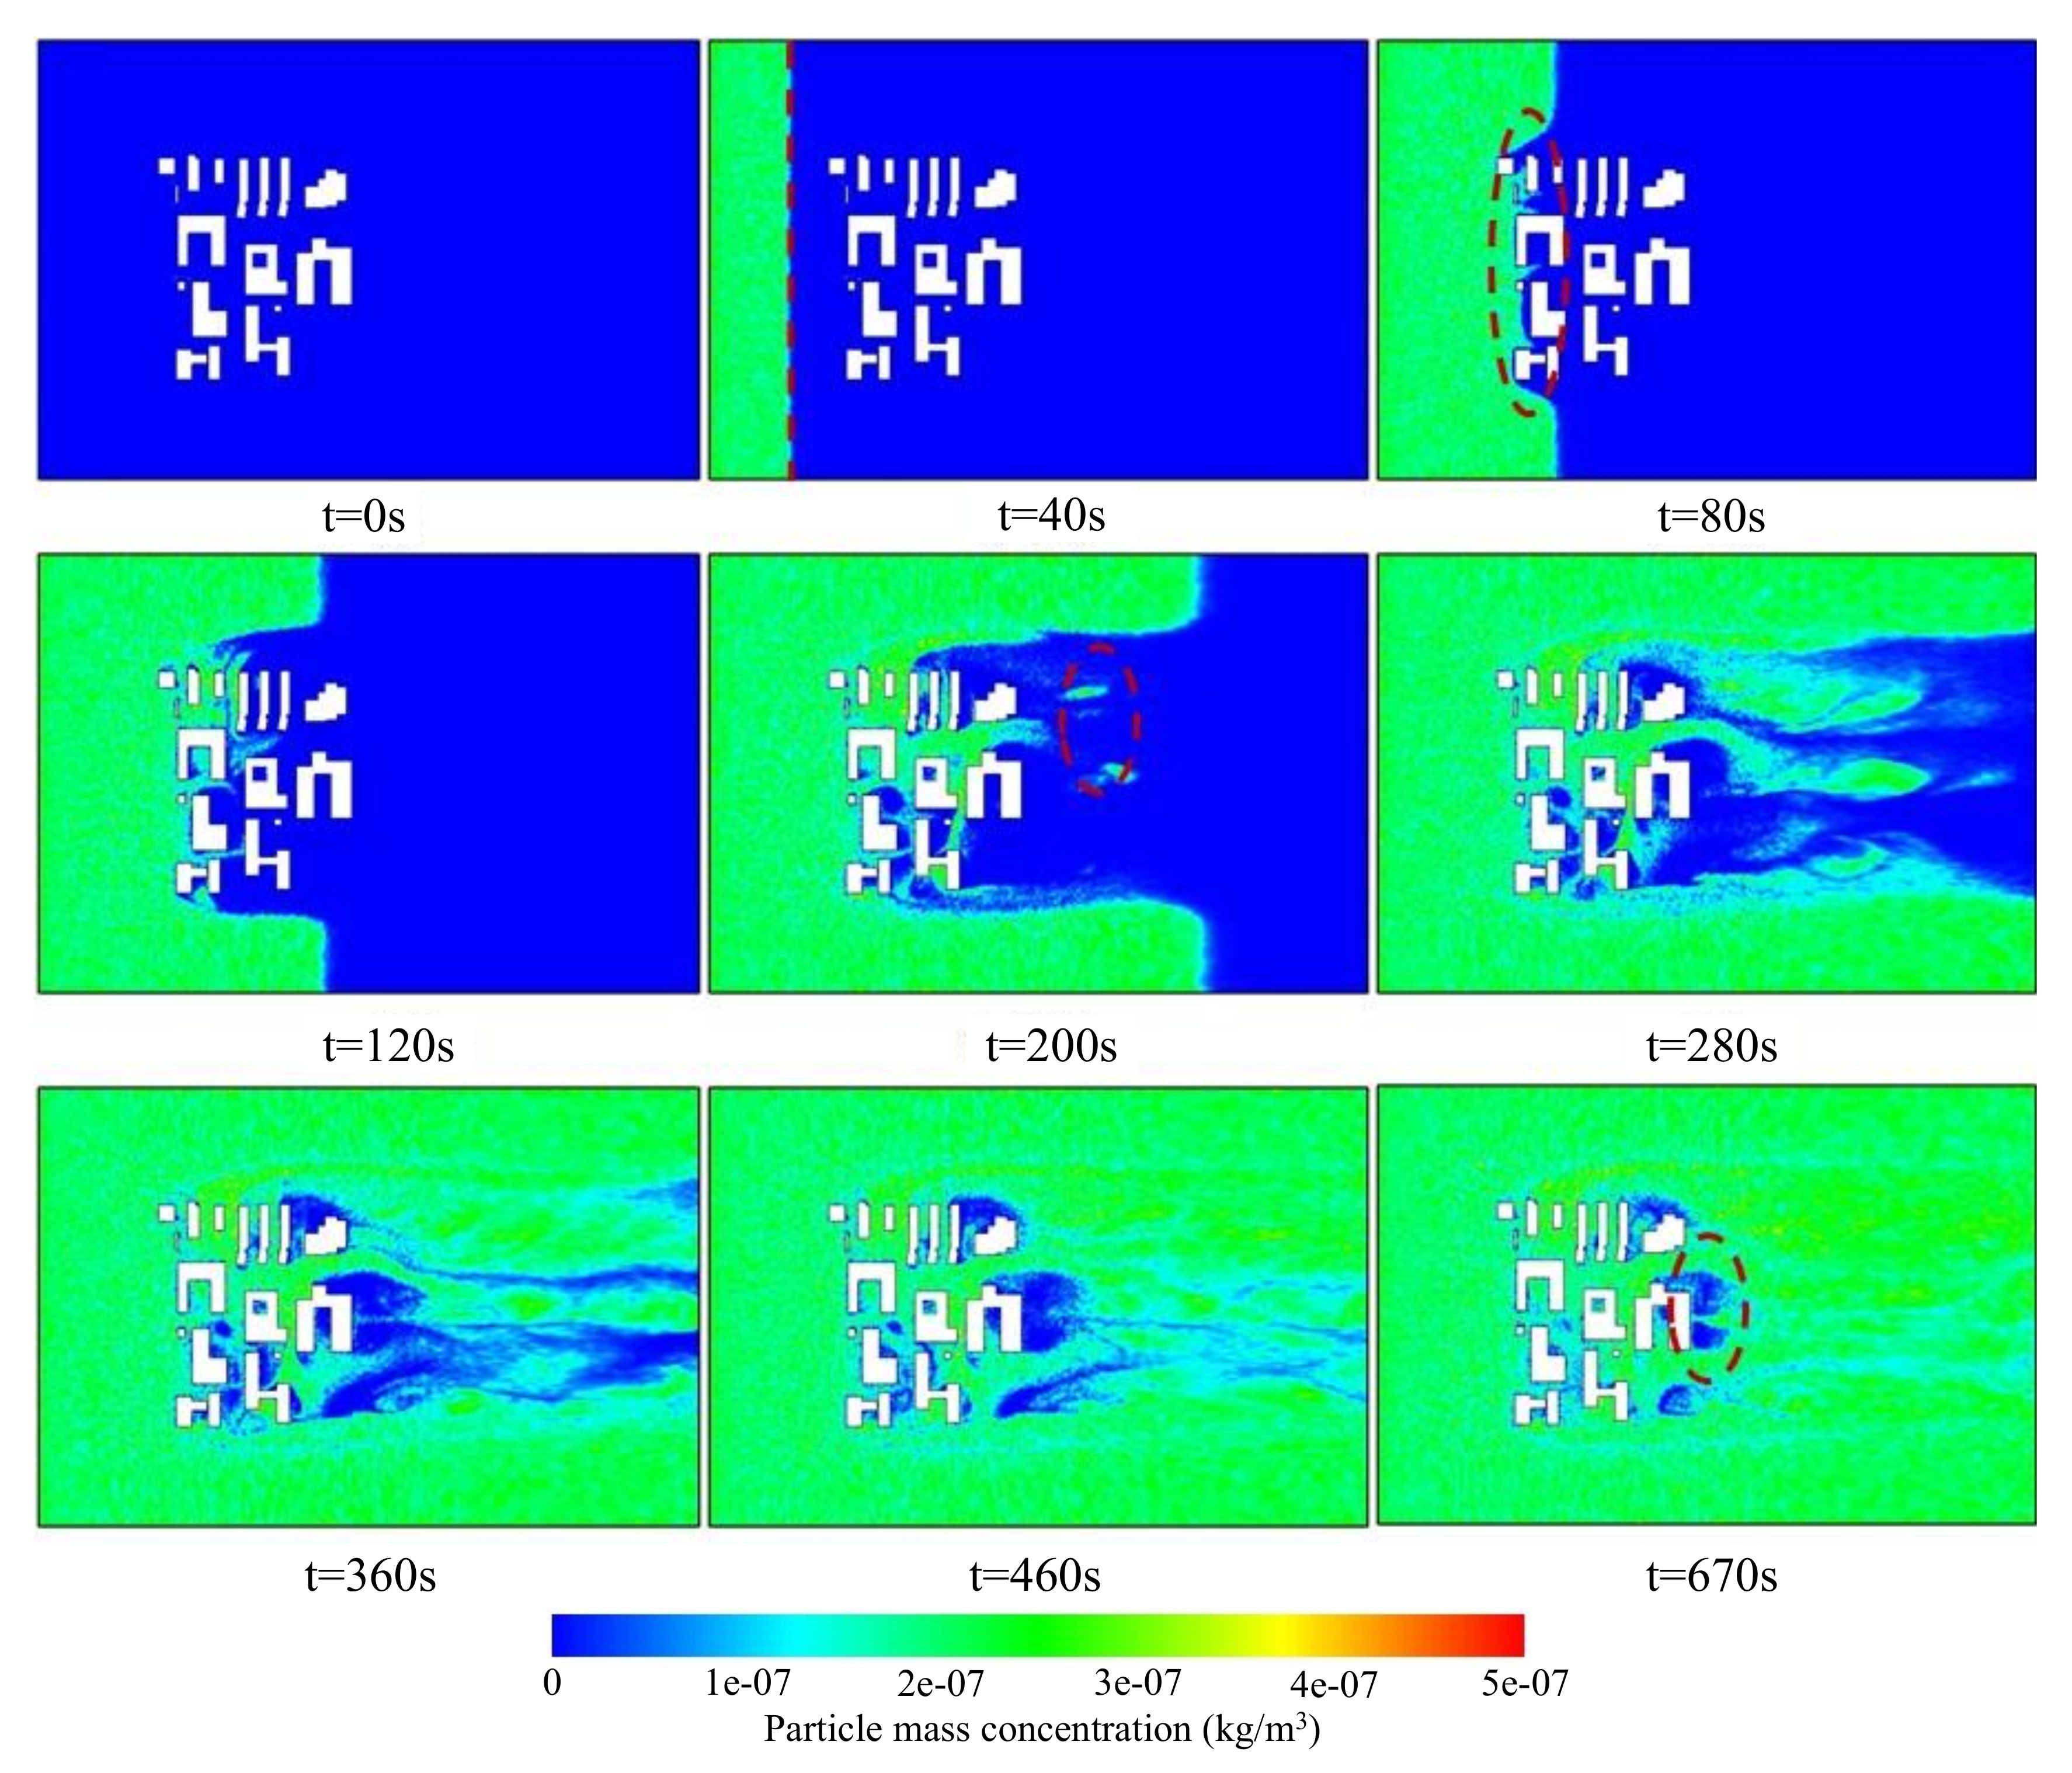
To clearly exhibit the dispersion on the horizontal plane, different instantaneous contours of particle mass concentration on the plane of z = 2 m are illustrated in Figure 10. In the initial stage of diffusion, the particles spread forward synchronously in a straight line. However, the particles are blocked by the building group at t = 80 s, resulting in a low streamwise velocity in the middle area of the domain. At t = 200 s, a separated particle cloud, which is associated with vortex shedding, is found downstream. Besides, it can be observed that a large number of particles pass through the streamwise street canyons at a relatively high speed. Thus, it is concluded that the concentration of haze-fog particles is higher in the streamwise street canyons. At t = 280 s, particles on both sides have diffused through the whole calculation domain, while the interior of the building group continues to fill particle-empty region through vortex action. With the increase of calculation time, the particles gradually spread to the particle-empty region, and the area of this region gradually decreases. More importantly, obvious feather of vortex shedding can be found from t = 280 s. It fully illustrates that the particle dispersion is affected by the vortex structure of the wind field. At t = 670 s, a pair of particle-empty regions attached to last row of the building group (marked by red dash line) can be found, which is consistent with the results shown in Figure 9. In the analysis of steady flow, a pair of vortices is attached to the rear of the cylinder which has less interaction with the external fluid. For the particle dispersion, fewer particles are transported from the upstream to the interior of the vortex. Thus, the concentration of particle in this region is relatively low.
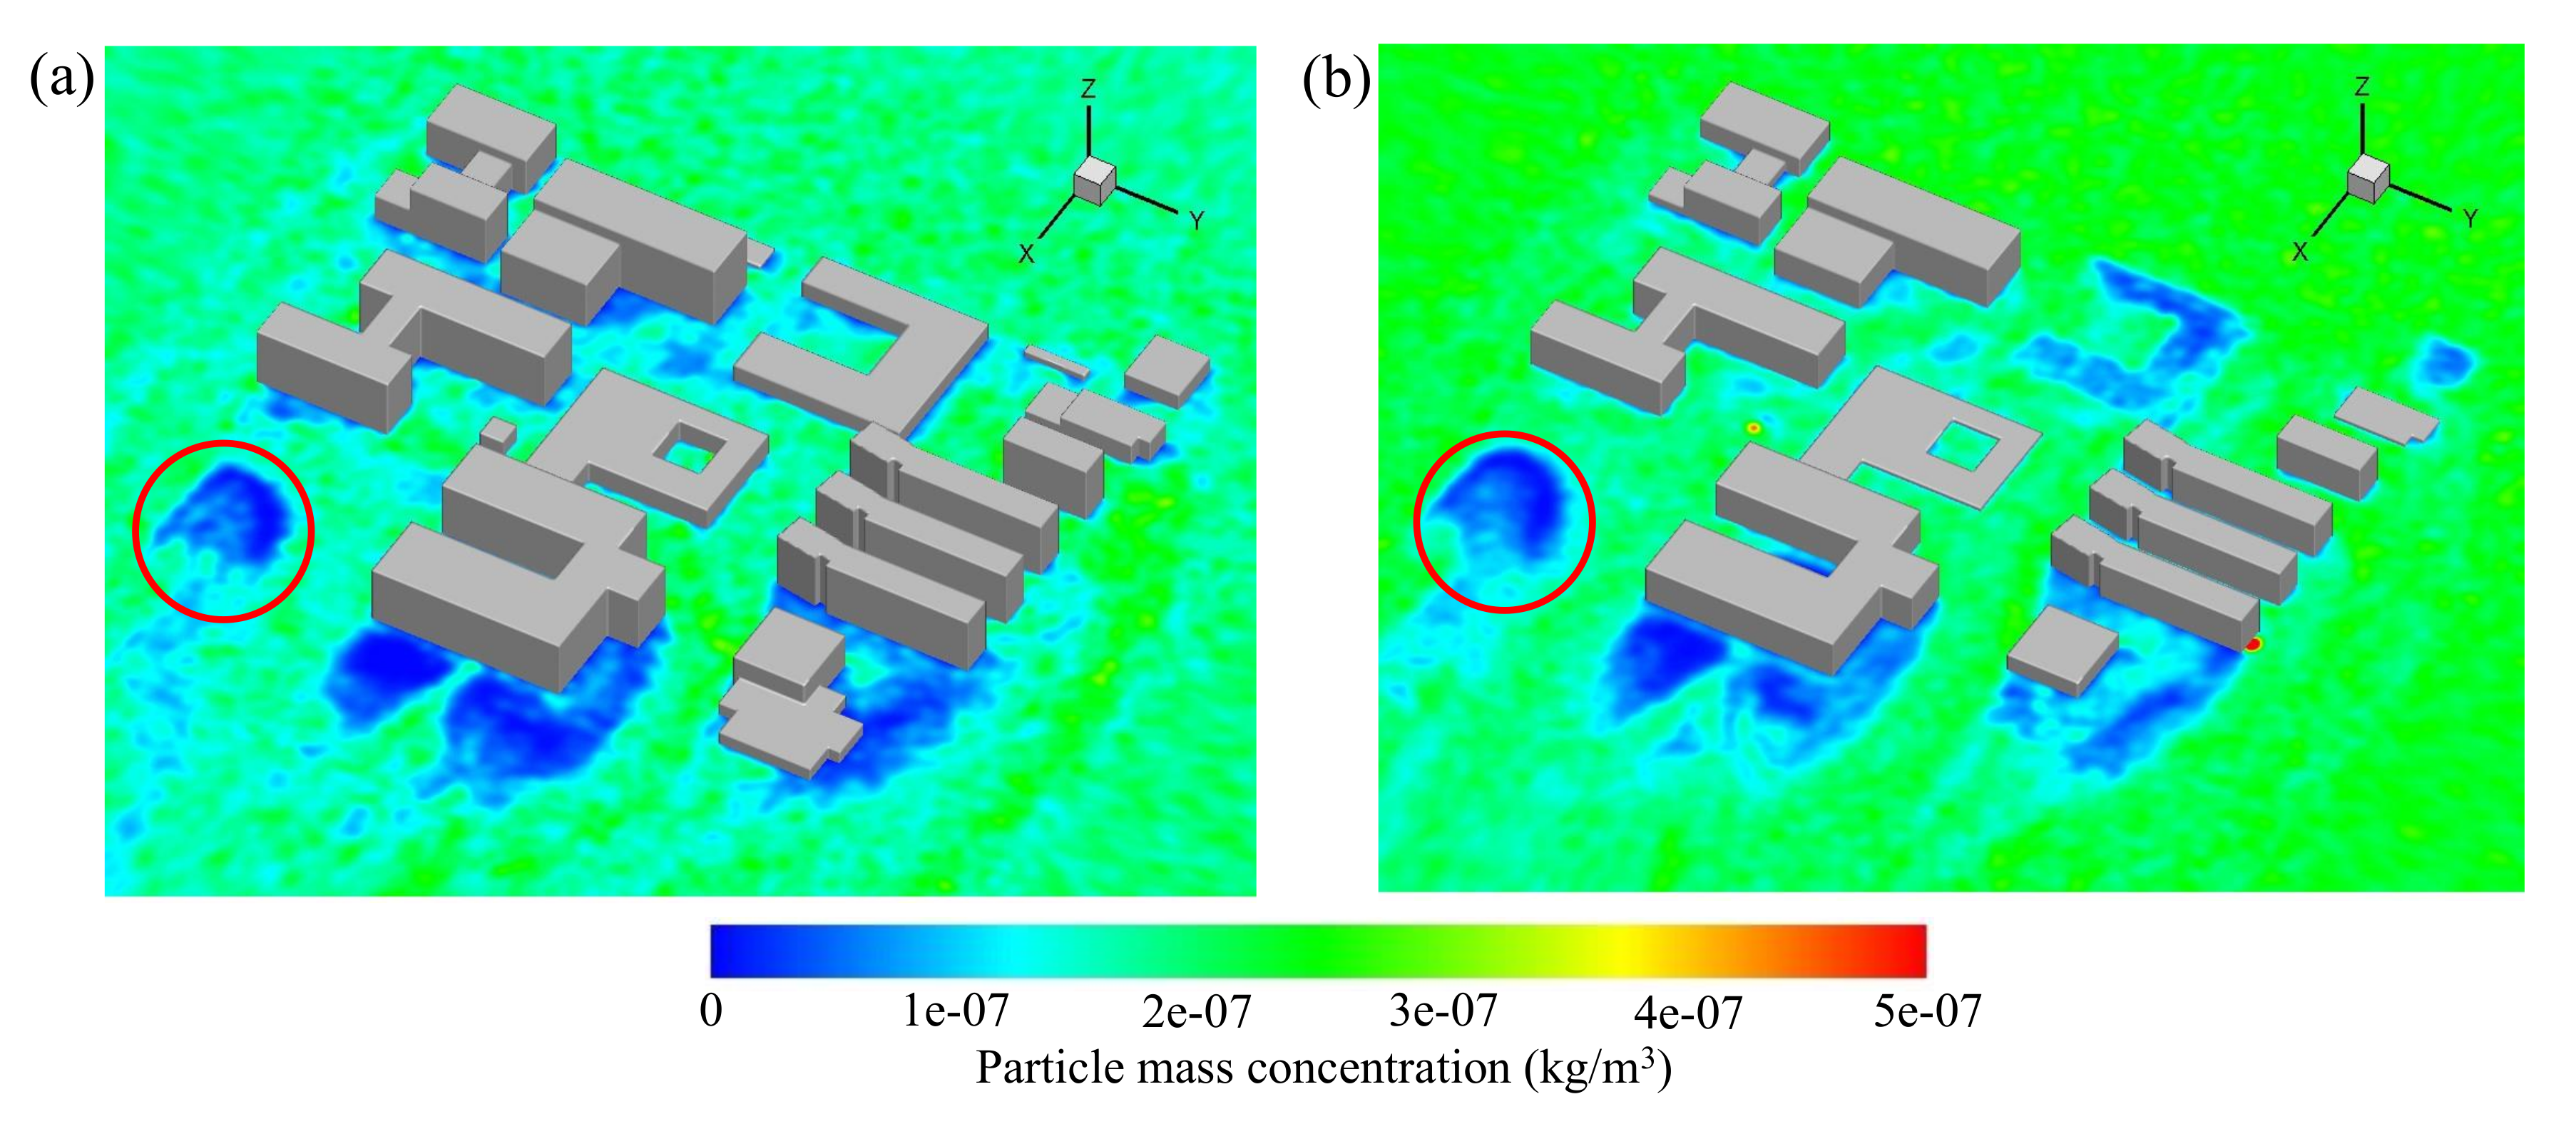
Combined with the instantaneous results shown in Figure 10, to better explore the characteristics of the particle dispersion on different horizontal planes at t = 670 s, contours of particle mass concentration on the planes of z = 2 m and z = 10 m are plotted in Figure 11. It can be found that the concentration on the plane of z = 10 m is higher than that on the plane of z = 2 m, because the concentration of particles at the height of z = 10 m is obtained by direct dispersion from upstream, while the particles in z = 2 m are mainly obtained by vortex structure or re-flux. Generally, blocked by the buildings, the concentration in the rear of the building is relatively low. More significantly, it is found that the sloping street will cause the concentration of particles to change behind the buildings. In the Section 5.1, we have documented that the wind speed in the sloping street is relatively low. The low-speed fluid carries a large number of particles to the re-circulation zone, which causes the low concentration region of the particles to keep away from the building as shown in Figure 11 (red circular lines). However, it is found that the low concentration region of the buildings on both sides of the streamwise street is close to the rear of the buildings. Besides, the low concentration region in the re-circulation zone of the middle buildings is basically symmetrical, while only one of the large areas with low concentrations is found around the build ‘DB’.

6. Conclusions

The three dimensional DDES turbulence model and DPM are employed to investigate the wind flow distribution and particle dispersion around a typical building group. By a series of analyses of wake characteristics around buildings and particle dispersion, the main conclusions are drawn as follows:
(1)
For the wake characteristics around the building group, the Hairpin vortex is clearly identified behind the building group. In the typical vertical planes, open cavity flow is formed by the ground, and the front and rear buildings, and then the primary vortex, secondary vortex are generated in the square cavities. In the horizontal planes, except the steady flow, two main flow types are identified in the present study, including ‘single body’ wake pattern and vortex impingement wake pattern.
(2)
For the haze-fog particle dispersion, it is further verified that the particle dispersion is dominated by the incoming wind flow. The high speed fluid carries a large number of particles rapidly through the streamwise street, while the low speed fluid from the slopping street carries a large number of particles into the re-circulation zone, resulting in the low concentration region of the particles to keep away from the building.
(3)
The distribution of vortex and its motion state play an important role in the distribution of particles. For the vertical planes, the primary vortex, secondary vortex formed in the open cavity make it difficult for the particles entered the square cavity to flow out. In the horizontal planes, vortices attached to the rear of the building have less interaction with the external fluid, resulting in a relatively low concentration of particle in this area.
Overall, the interaction among wind, buildings and vortex makes the particles unevenly distributed in the flow field. In the present investigation, the characteristics of haze-fog particle dispersion in a typical building group are preliminary explored by numerical simulation. The results can provide a groundwork for the optimal spatial arrangement of urban architecture. However, it should be noted that the present study is limited to one wind direction at a certain speed. More cases will be conducted in our further work.

Author Contributions

Methodology, H.Z., J.S., and X.W. (Xun Wang); data curation, Y.B.; writing–original draft preparation, H.Z.; writing–review and editing, J.S., X.W. (Xuesen Wei), Z.H. and D.Z.; supervision, Z.H., D.Z. and Y.B.; project administration, Z.H., D.Z. and Y.B.; All authors have read and agreed to the published version of the manuscript.

Funding

This research was funded by the National Natural Science Foundation of China, grant number 51879160, 51679139, 11772193, the Innovation Program of Shanghai Municipal Education Commission, grant number 2019-01-07-00-02-E00066, the Project of Thousand Youth Talents, grant number BE0100002, the Shanghai Natural Science Foundation, grant number 18ZR1418000, and the Program for Intergovernmental International S&T Cooperation Projects of Shanghai Municipality, grant number 18290710600.

Acknowledgments

The authors would like to thank Anamika, Ramesh and Vijay for improving the language quality of this paper.

Conflicts of Interest

The authors declare no conflict of interest. The funders had no role in the design of the study; in the collection, analyses, or interpretation of data; in the writing of the manuscript, or in the decision to publish the results.

Abbreviations

The following abbreviations are used in this manuscript:
DDESDelayed Detached-eddy Simulation
DPMDiscrete Phase Model
CFDComputational Fluid Dynamics
RANSReynolds-averaged Navier Stokes
LESLarge-eddy Simulation

References

  1. Logue, J.M.; Price, P.N.; Sherman, M.H.; Singer, B.C. A method to estimate the chronic health impact of air pollutants in US residences. Environ. Health Perspect. 2012, 120, 216–222. [Google Scholar] [CrossRef] [PubMed] [Green Version]
  2. World Health Organization. WHO Global Ambient Air Quality Database (Update 2018); World Health Organization: Geneva, Switzerland, 2018. [Google Scholar]
  3. Escobedo, F.J.; Kroeger, T.; Wagner, J.E. Urban forests and pollution mitigation: Analyzing ecosystem services and disservices. Environ. Pollut. 2011, 159, 2078–2087. [Google Scholar] [CrossRef] [PubMed]
  4. Li, X.X.; Leung, D.Y.; Liu, C.H.; Lam, K.M. Physical modeling of flow field inside urban street canyons. J. Appl. Meteorol. Climatol. 2008, 47, 2058–2067. [Google Scholar] [CrossRef]
  5. Gromke, C.; Ruck, B. Influence of trees on the dispersion of pollutants in an urban street canyon–experimental investigation of the flow and concentration field. Atmos. Environ. 2007, 41, 3287–3302. [Google Scholar] [CrossRef] [Green Version]
  6. Di Sabatino, S.; Buccolieri, R.; Pappaccogli, G.; Leo, L.S. The effects of trees on micrometeorology in a real street canyon: Consequences for local air quality. Int. J. Environ. Pollut. 2015, 58, 100–111. [Google Scholar] [CrossRef]
  7. Meroney, R.N.; Derickson, R. Virtual reality in wind engineering: The windy world within the computer. J. Wind Eng. 2014, 11, 11–26. [Google Scholar]
  8. Jeanjean, A.; Monks, P.; Leigh, R. Modelling the effectiveness of urban trees and grass on PM2.5 reduction via dispersion and deposition at a city scale. Atmos. Environ. 2016, 147, 1–10. [Google Scholar] [CrossRef] [Green Version]
  9. Cui, D.; Mak, C.M.; Ai, Z.; Kwok, K.C.; Meng, X.; Niu, J. On-site evaluation of pedestrian-level air quality at a U-type street canyon in an ancient city. J. Wind Eng. Ind. Aerodyn. 2017, 168, 322–333. [Google Scholar] [CrossRef]
  10. Lateb, M.; Meroney, R.N.; Yataghene, M.; Fellouah, H.; Saleh, F.; Boufadel, M. On the use of numerical modelling for near-field pollutant dispersion in urban environments—A review. Environ. Pollut. 2016, 208, 271–283. [Google Scholar] [CrossRef] [Green Version]
  11. Xue, F.; Li, X. The impact of roadside trees on traffic released PM10 in urban street canyon: Aerodynamic and deposition effects. Sustain. Cities Soc. 2017, 30, 195–204. [Google Scholar] [CrossRef]
  12. Schatzmann, M.; Leitl, B. Issues with validation of urban flow and dispersion CFD models. J. Wind Eng. Ind. Aerodyn. 2011, 99, 169–186. [Google Scholar] [CrossRef]
  13. Hajra, B.; Stathopoulos, T.; Bahloul, A. The effect of upstream buildings on near-field pollutant dispersion in the built environment. Atmos. Environ. 2011, 45, 4930–4940. [Google Scholar] [CrossRef]
  14. Hajra, B.; Stathopoulos, T.; Bahloul, A. Performance of ASHRAE models in assessing pollutant dispersion from rooftop emissions. HVAC&R Res. 2014, 20, 72–79. [Google Scholar]
  15. Stathopoulos, T.; Hajra, B. Wind-Induced Dispersion of Pollutants in the Urban Environment. In Advanced Environmental Wind Engineering; Springer: Kanagawa, Japan, 2016; pp. 129–147. [Google Scholar]
  16. Montazeri, H.; Blocken, B. CFD simulation of wind-induced pressure coefficients on buildings with and without balconies: Validation and sensitivity analysis. Build. Environ. 2013, 60, 137–149. [Google Scholar] [CrossRef]
  17. Buccolieri, R.; Jeanjean, A.P.; Gatto, E.; Leigh, R.J. The impact of trees on street ventilation, NOx and PM2.5 concentrations across heights in Marylebone Rd street canyon, central London. Sustain. Cities Soc. 2018, 41, 227–241. [Google Scholar] [CrossRef]
  18. Taleghani, M.; Clark, A.; Swan, W.; Mohegh, A. Air pollution in a microclimate; the impact of different green barriers on the dispersion. Sci. Total Environ. 2020, 711, 134649. [Google Scholar] [CrossRef]
  19. He, L.; Hang, J.; Wang, X.; Lin, B.; Li, X.; Lan, G. Numerical investigations of flow and passive pollutant exposure in high-rise deep street canyons with various street aspect ratios and viaduct settings. Sci. Total Environ. 2017, 584, 189–206. [Google Scholar] [CrossRef]
  20. Gousseau, P.; Blocken, B.; Stathopoulos, T.; Van Heijst, G. CFD simulation of near-field pollutant dispersion on a high-resolution grid: A case study by LES and RANS for a building group in downtown Montreal. Atmos. Environ. 2011, 45, 428–438. [Google Scholar] [CrossRef] [Green Version]
  21. Wang, M.; Lin, C.H.; Chen, Q. Determination of particle deposition in enclosed spaces by Detached Eddy Simulation with the Lagrangian method. Atmos. Environ. 2011, 45, 5376–5384. [Google Scholar] [CrossRef]
  22. Rashidi, S.; Esfahani, J.A.; Ellahi, R. Convective heat transfer and particle motion in an obstructed duct with two side by side obstacles by means of DPM model. Appl. Sci. 2017, 7, 431. [Google Scholar] [CrossRef] [Green Version]
  23. Salamon, P.; Fernàndez-Garcia, D.; Gómez-Hernández, J.J. A review and numerical assessment of the random walk particle tracking method. J. Contam. Hydrol. 2006, 87, 277–305. [Google Scholar] [CrossRef] [PubMed]
  24. Wang, X.; Lei, H.; Han, Z.; Zhou, D.; Shen, Z.; Zhang, H.; Zhu, H.; Bao, Y. Three-dimensional delayed detached-eddy simulation of wind flow and particle dispersion in the urban environment. Atmos. Environ. 2019, 201, 173–189. [Google Scholar] [CrossRef]
  25. Vervoort, R.; Blocken, B.; van Hooff, T. Reduction of particulate matter concentrations by local removal in a building courtyard: Case study for the Delhi American Embassy School. Sci. Total Environ. 2019, 686, 657–680. [Google Scholar] [CrossRef] [PubMed]
  26. Sheng, Q.; Zhang, Y.; Zhu, Z.; Li, W.; Xu, J.; Tang, R. An experimental study to quantify road greenbelts and their association with PM2. 5 concentration along city main roads in Nanjing, China. Sci. Total Environ. 2019, 667, 710–717. [Google Scholar] [CrossRef] [PubMed]
  27. Ounis, H.; Ahmadi, G.; McLaughlin, J.B. Brownian diffusion of submicrometer particles in the viscous sublayer. J. Colloid Interface Sci. 1991, 143, 266–277. [Google Scholar] [CrossRef]
  28. Zhao, B.; Yang, C.; Yang, X.; Liu, S. Particle dispersion and deposition in ventilated rooms: Testing and evaluation of different Eulerian and Lagrangian models. Build. Environ. 2008, 43, 388–397. [Google Scholar] [CrossRef]
  29. Van Hooff, T.; Blocken, B. Coupled urban wind flow and indoor natural ventilation modelling on a high-resolution grid: A case study for the Amsterdam ArenA stadium. Environ. Model. Softw. 2010, 25, 51–65. [Google Scholar] [CrossRef]
  30. Yoshie, R.; Mochida, A.; Tominaga, Y.; Kataoka, H.; Harimoto, K.; Nozu, T.; Shirasawa, T. Cooperative project for CFD prediction of pedestrian wind environment in the Architectural Institute of Japan. J. Wind Eng. Ind. Aerodyn. 2007, 95, 1551–1578. [Google Scholar] [CrossRef]
  31. Liu, J.; Niu, J. CFD simulation of the wind environment around an isolated high-rise building: An evaluation of SRANS, LES and DES models. Build. Environ. 2016, 96, 91–106. [Google Scholar] [CrossRef]
  32. Holmes J., D. Wind Loading of Structure; Spaon Press: London, UK, 2018. [Google Scholar]
  33. Ministry of Construction. Load Code for the Design of Building Structure; China Building Industry Press: Beijing, China, 2012. (In Chinese) [Google Scholar]
  34. Architectural Institute of Japan. Chapter 6 WIND LOADS. In Recommendations for Loading on Buildings; Architectural Institute of Japan: Tokyo, Japan, 2004; pp. 1–56. [Google Scholar]
  35. Bovand, M.; Rashidi, S.; Ahmadi, G.; Esfahani, J.A. Effects of trap and reflect particle boundary conditions on particle transport and convective heat transfer for duct flow-A two-way coupling of Eulerian-Lagrangian model. Appl. Therm. Eng. 2016, 108, 368–377. [Google Scholar] [CrossRef]
  36. Zhang, H.; Wang, F.; Wang, Y.; Wang, H. CFD Simulation of Cooking Particle Distribution and Motion. Procedia Eng. 2017, 205, 1800–1806. [Google Scholar] [CrossRef]
  37. Spalart, P.R.; Streett, C. Young-Person’s Guide to Detached-Eddy Simulation Grids; Technical Report NASA/CR-2001-211032; NASA: Washington, DC, USA, 2001.
  38. Zhu, H.; Wang, R.; Bao, Y.; Zhou, D.; Ping, H.; Han, Z.; Sherwin, S.J. Flow over a symmetrically curved circular cylinder with the free stream parallel to the plane of curvature at low Reynolds number. J. Fluids Struct. 2019, 87, 23–38. [Google Scholar] [CrossRef]
  39. Zhu, H.; Zhou, D.; Bao, Y.; Wang, R.; Lu, J.; Fan, D.; Han, Z. Wake characteristics of stationary catenary risers with different incoming flow directions. Ocean Eng. 2018, 167, 142–155. [Google Scholar] [CrossRef]
Figure 1. (a) Map of the site of the buildings. (b) three-dimensional model of the buildings.
Atmosphere 11 00381 g001
Figure 2. Sketches of (a) Model layout and (b) computational domain.
Atmosphere 11 00381 g002
Figure 3. (a) Mesh distribution of the building group and (b) the vicinity boundary layer grids.
Atmosphere 11 00381 g003
Figure 4. Time averaged velocity magnitude distribution in the wake of the building group ( x = 150 m ) at horizontal plane of z = 2 m for the basic grid, finer grid and coarser grid.
Atmosphere 11 00381 g004
Figure 5. Perspective view of instantaneous iso-surface of the Q-criterion ( Q = 0.001 ) colored by iso-contours of the streamwise velocity.
Atmosphere 11 00381 g005
Figure 6. Velocity distribution characteristics on different vertical planes: (a) velocity contour and (b) velocity vector diagram of y = 0 m; (c) velocity contour and (d) velocity vector diagram of y = −50 m; (e) velocity contour and (f) velocity vector diagram of y = 100 m.
Atmosphere 11 00381 g006
Figure 7. Flow distribution characteristics on horizontal planes of z = 2 m (ac) and z = 10 m (df): (a,d) velocity contour; (b,e) velocity vector diagram; (a,c) vorticity contour.
Atmosphere 11 00381 g007
Figure 8. Contours of particle mass concentration on the plane of y = 0 m at the dispersion phases from t = 0 s to t = 670 s.
Atmosphere 11 00381 g008
Figure 9. Contours of particle mass concentration on the different vertical planes at t = 670 s: (a) y = −50 m, (b) y = 0 m and (c) y = 100 m.
Atmosphere 11 00381 g009
Figure 10. Contours of particle mass concentration on the horizontal plane of z = 2 m at the dispersion phases from t = 0 s to t = 670 s.
Atmosphere 11 00381 g010
Figure 11. Contours of particle mass concentration on the different horizontal planes at t = 670 s: (a) z = 2 m and (b) z = 10 m.
Atmosphere 11 00381 g011