Abstract
The proper characterization of aqueous brown carbon (BrC) species, their formation, and their light absorbance properties is critical to understanding the aggregate effect that they have on overall atmospheric aerosol climate forcing. The contribution of dark chemistry secondary organic aerosol (SOA) products from carbonyl-containing organic compounds (CVOCs) to overall aqueous aerosol optical properties is expected to be significant. However, the multiple, parallel pathways that take place within CVOC reaction systems and the differing chromophoricity of individual products complicates the ability to reliably model the chemical kinetics taking place. Here, we proposed an alternative method of representing UV-visible absorbance spectra as a composite of Gaussian lineshape functions to infer kinetic information. Multiple numbers of curves and different CVOC/ammonium reaction systems were compared. A model using three fitted Gaussian curves with magnitudes following first-order kinetics achieved an accuracy within 65.5% in the 205–300-nm range across multiple organic types and solution aging times. Asymmetrical peaks that occurred in low-200-nm wavelengths were decomposed into two overlapping Gaussian curves, which may have been attributable to different functional groups or families of reaction products. Component curves within overall spectra exhibited different dynamics, implying that the utilization of absorbance at a single reference wavelength to infer reaction rate constants may result in misrepresentative kinetics for these systems.
1. Introduction
Atmospheric aerosols are a major source of uncertainty in current climatological models, contributing both warming and cooling effects to the total energy balance of the planet. The contributing effects of aerosols are dependent on their composition, which contain highly variable concentrations of both inorganic and organic compounds [1,2]. Much of the organic component in aerosols is secondary organic aerosol (SOA) mass, formed indirectly through the partitioning and reaction of gas-phase volatile organic compounds (VOCs). Early literature attempting to elucidate mechanisms of SOA production emphasized the accumulation of SOA in ultrafine particles through gas-phase VOC processing into lower volatility products that uptake into the condensed phase [3,4]. However, additional relevant SOA formation mechanisms have been identified that contribute via reversible VOC uptake followed by irreversible particle-phase processing [5,6].
In aqueous aerosol systems, the composition and reactivity of water-soluble organic species dictate the prevailing aqueous-phase SOA (aqSOA) chemistry. Low-weight (C2 or C3) carbonyl-containing VOCs (CVOCs) have been identified as a relevant and ubiquitous contributor to aqSOA across a wide range of ambient atmospheric conditions [3,7,8]. Arising from the photooxidation of both biogenic and anthropogenic gas-phase emissions [9], CVOCs exhibit high partitioning into the aqueous phase due to their ability to reversibly hydrate, yielding relatively high condensed-phase concentrations compared to similarly sized or structured compounds [10]. The uptake and retention of these compounds is thought to be further enhanced by the subsequent particle-phase chemistry that occurs between other organic and electrolyte species present in the aqueous phase [11,12,13,14,15]. In addition, the activation and subsequent drying of cloud droplets may result in yet higher concentrations of CVOCs and derived products beyond what traditional partitioning theory for these compounds may suggest [13].
Of the CVOCs, glyoxal (G) and its reaction products has been identified to be one of the highest contributors to aqSOA mass [3,16]. Glycolaldehyde (GA) and methylglyoxal (MG), which are similarly structured to glyoxal, appear in similar environments, though in smaller quantities [16,17]. GA and MG have been proposed to undergo analogous chemistry to glyoxal in aqueous conditions [18,19]. In addition, MG has also been identified to generate comparable or greater quantities of light-absorbing dark chemistry products compared to G [20,21] and can alter the bulk-phase physical properties of aerosol systems, even in trace amounts [20,22,23]. As a result, multiple studies have explored G [6,10,16,18,19,24,25,26,27,28,29], GA [16,18,27,30,31], and MG [16,19,21,26,27,29] reaction systems, quantifying and speciating their potential contributions to aqSOA under a variety of laboratory conditions.
In dark conditions, observed higher-mass aqSOA products in G, GA, and MG mimic solutions have been attributed to Maillard-type or aldol condensation reactions between CVOCs, primary amines, and/or ammonium ions present in the aqueous phase [14,17,18,19,21,24,28,29]. Recent work using supercritical fluid chromatography tandem mass spectroscopy (SFC-MS/MS) has unambiguously identified heterocyclic pyrazine and imidazole derived oligomerization products in mimic solutions containing G or GA and ammonium sulfate (AS) [18]. Similar speciation studies using HPLC-MS in MG/AS aerosol mimic solutions also identified m/z peaks consistent with methylated analogues to these heterocyclic products [20,32]. These products have all been observed [20,32] or estimated [18,32] to absorb light in the UV/visible region, classifying these compounds as brown carbon (BrC) species that may contribute to overall aerosol direct forcing effects.
Whereas the existence of these reaction products has been verified, the kinetics of the parallel reactions leading to their formation remain ambiguous and poorly understood. The chromatographic methods implemented in these mass spectroscopy speciation studies necessitate elution times on the order of tens of minutes [20,33] and require additional processing to strip inorganic components from solution before measurement [23]. As a result, the ability to use dynamic m/z signals to infer kinetic information for specific products is limited. To the authors’ knowledge, no rate constant data has been reported for CVOC/AS chemistry using these methods.
Other previous kinetic studies have attempted to quantify CVOC/AS dark chemistry approximate rate constants using the UV/visible absorbance at a single reference wavelength, defining regressed values as representative of the collective dark chemistry for a given reaction system [19,21,25,28]. However, this method cannot necessarily capture the nonuniform changes in UV/visible absorbance peak intensity and location that may occur over time. Laboratory studies measuring chromophoricity in CVOC/AS mimic solutions have observed different [21,23,25,28] or opposing [34] dynamic behavior at different wavelengths under the same experimental conditions. Combined with the explicitly different and parallel dark chemistry mechanisms known to be taking place within these reaction systems, a more robust method is necessary to infer kinetic information from UV/visible absorbance data.
Here, we presented a top-down spectral decomposition approach to the modeling of dynamic UV-visible absorbance properties in CVOC/AS aerosol mimics. The decomposition of a spectrum, i.e., the representation of a spectrum containing overlapping peaks as a series of simpler functions, is a widely used approach to infer additional information in a variety of spectroscopic techniques [35,36]. By representing the overall spectra of a given aged CVOC/AS system as a series of time- and wavelength-dependent empirically fitted lineshapes, a solution’s absorbance spectrum can be modeled as a function of initial chromophoric precursor concentration and solution age. This technique allows for a more holistic approach to modeling absorbance behavior, informed by a spectrum’s relevant geometries, as opposed to discrete sets of absorbance values at specific wavelengths.
The presented data and model parameters specifically focus on the light-absorbing properties of G, GA, and MG in AS environments, selected due to their previously explored chromophoric properties [17,18,20,21] and notable contributions to aqueous SOA mass in aqueous aerosols [16] and cloudwater droplets [7,10].
2. Materials and Methods
2.1. Sample Collection
Aqueous aerosol mimic solutions were prepared in sets of at least eight replicates in flat-bottomed, 320-µL UV-transparent 96-well plates (Corning) by combining fixed quantities of organic-containing and ammonium sulfate stock solutions. Glyoxal and methylglyoxal stock solutions were each prepared from 40 wt% reagent solution (Sigma Aldrich) and Millipore water. Glycolaldehyde stock solutions were prepared from solid dimer (Sigma Aldrich) and Millipore water. Upon initial preparation, organic stock solutions were allowed to equilibrate at room temperature for 1–3 h to allow for reversible hydration and oligomerization phenomena to take place within the solution. AS solutions were prepared from solid crystals (Sigma Aldrich) and Millipore water. The combined mimic solutions contained 3.1 M of AS and either 5 mM (for G and MG) or 5 0mM (for GA) of organic concentrations. The AS concentration was set at 3.1 M to be representative of the high inorganic concentrations typical of ambient atmospheric aerosols while remaining consistent with other work that has used these types of mimics [21,23,37,38]. CVOC concentrations were selected to remain within detectable ranges of absorbance measurement and were kept sufficiently low to reasonably assume excess ammonium concentration relative to CVOCs in solution.
Upon mixing the mimic solutions in each well using a micropipette, the 96-well plates were immediately placed into a Biotek Synergy HT Microplate Reader, where the UV-visible absorbance in each filled well was measured at hourly intervals for six hours. Between measurements, each plate was allowed to age inside the microplate reader in air under darkened, ambient (23 °C) conditions. No additional oxidants or reactants beyond AS were used. Negligible sample mass loss (<5%) was observed over the period of measurement.
Sample absorbance spectra were measured at 1-nm resolution from a range of 200–750 nm. Bulk absorbance properties, , were then recalculated in terms of mass absorbance coefficient (MAC), to normalize for initial organic concentration, with molecular mass and solution pathlength, l:
The nominal pathlength for the 320-µL mimic solution samples in each well was determined to be 7.1 mm, calibrated against a nonreactive crystal violet dye. Well plate absorbance measurements exhibited statistically insignificant dependence on well position (p = 0.4207) across the entire UV-visible region.
2.2. Modeling Approach
The models discussed in this work aimed to decompose a given MAC spectra into a sum of curves that collectively approximate the geometry of observed values, i.e., discrete peaks with nonzero width. Gaussian () lineshape functions, which are commonly employed in spectral decomposition techniques [36] or as a means of estimating absorbance property simulation [39], were applied such that a given spectrum was expressed as a sum of n instances of :
These functions can be represented in terms of a single magnitude-dependent (M), width-dependent (σ), and location-dependent (c) coefficient per lineshape, yielding a total of 3n parameters to be fitted to a single given spectrum.
The fitted Gaussian coefficients (X) may be further expanded to represent time-dependent behavior. The initial mixing and subsequent aging of the observed mimic solutions were assumed to approximate the time-domain, step change response of a first-order system, which starts at some initial value before asymptotically shifting by a steady-state offset value , dictated by an exponential decay with time constant :
Although it is possible to model all three Gaussian coefficients as having time-dependent behavior (resulting in a total of 9n variables), overfitting spectra potentially increases computational load and decreases physically grounded comparability across different modeled systems. From previous literature exploring the chromophoric properties of the CVOC/AS dark chemistry system used in this work, peak spread and approximate locations were found to remain roughly constant [17,20,21,25,28]. Therefore, applying Equation (3) to the magnitude term of Equation (2), a time- and wavelength-dependent function for MAC with 5n fitted coefficients was developed:
Time- and wavelength-resolved MAC values, calculated through observed well plate absorbance measurements, were fitted using MATLAB (2019b) to model equations using two, three, and four Gaussian lineshape equations (i.e., Equation (4), such that n = 2, 3, and 4.) The efficacy of fitted models was quantified through a normalized root-mean-square deviation, NRSMD, defined for a testing set of N observations as:
where refers to values as estimated by each model at a specified time and wavelength and refers to observed measurements of a testing set under the same conditions. Estimated values were compared against the observed MAC values, averaged across replicates for each concentration and time within a 1nm range between 200–400n m, yielding a total of 201 observations per testing set. The root-mean-square (NRMSD) deviation for each set of conditions was then normalized against the range of observed MAC values in its testing set. A lower NRMSD denotes a more generally accurate model.
3. Results
3.1. UV-Visible Absorbance of Aqueous Mimic Solutions
Representative sets of absorbance spectra over six hours of aging, compared against fitted base case model outputs, are shown as points and shaded regions in Figure 1. MG/AS solutions were observed to be the most chromophoric, followed by G/AS and GA/AS solutions. All three solutions exhibited an asymmetrical peak in the 200–220-nm region, with a smaller peak between 260 nm and 290 nm. Generally, solution absorbance increased with solution age, with MG changing the most and GA changing the least over the measured timeframe. The absorbance locations and relative observed magnitudes in this study were shown to be consistent with previous studies that have explored comparable CVOC/AS reaction systems [17,18,19,20,21].
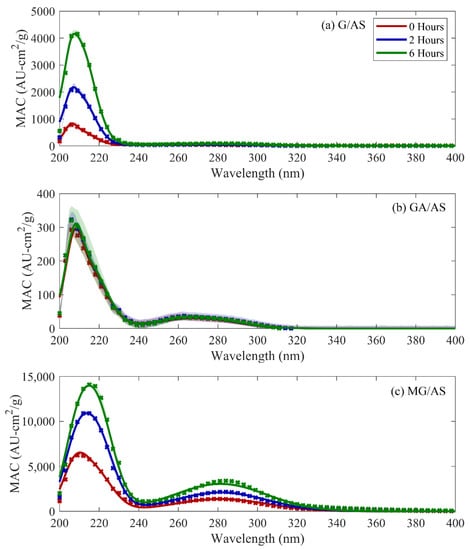
Figure 1.
Observed mass absorbance coefficient (MAC) (points) and three-curve modeling output (lines) for glyoxal (a), glycolaldehyde (b), and methylglyoxal (c). Shaded regions denote one standard deviation ranges for observed values.
3.2. Model Comparisons
The estimated MAC for three-curve models for the three tested reaction solution systems are represented as solid lines in Figure 1. The percentage errors from the measured datasets for these outputs are shown in Figure 2. The percentage error and NRMSD information for selected simulation conditions are summarized in Table 1. Complete NRMSD data and percent error information for all combinations of CVOC/AS reaction systems and tested models can be found in Tables S1 and S2. The agreement between observed and modeled MAC was found to be high in the region between 205–300 nm, with predicted values remaining within 65% for three-curve models of all tested CVOC/AS systems and reaction times. Higher relative error was observed at the upper (>300 nm) and lower (<205 nm) bounds of the modeled range, which was attributed to low absolute measured signal and small model-contributing sample size, respectively.
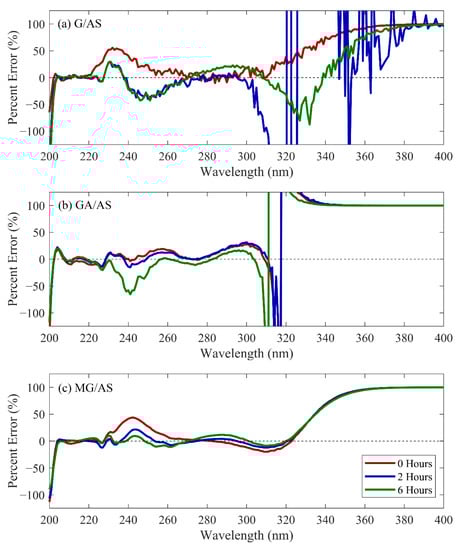
Figure 2.
Percentage error vs. wavelength for the three-curve modeling scenario for glyoxal (a), glycolaldehyde (b), and methylglyoxal (c).

Table 1.
Normalized root mean square deviation and maximum percentage error in the 205–300-nm region for selected three-curve modeling scenarios.
Model accuracy (i.e., NRMSD) demonstrated statistically insignificant (p = 0.9936) dependence with respect to simulation time. NRMSD demonstrated a statistically significant (p < 0.0001) dependence on reaction system, with MG/AS mimics achieving the highest accuracy of the three CVOCs modeled and GA/AS achieving the lowest, trending with their relative levels of chromophoricity.
An analysis of variance (ANOVA) that compared models with different numbers of lineshapes in each CVOC/AS reaction system at each observed time resulted in statistically higher NRMSD for two-curve models, with relative error values higher in the asymmetry of the peaks in the 205–220-nm region. However, the three- and four-curve models shared a separate Tukey grouping, indicating comparable model performance between the two models. NRMSD values and multiple comparison plots from this analysis are summarized in Figure S1. As additional lineshape functions were implemented into a model equation, it was expected that incremental gains in model accuracy would diminish, while computational resources required for evaluation would increase. Therefore, it can be stated that for the CVOC/AS reaction systems examined in this work, the three-curve model provided a broadly applicable balance between fidelity to observed data and model simplicity.
4. Inference of Kinetics from Fitted Time Constants
The fitting of multiple peaks within a given absorbance spectrum suggests the potential to infer the dynamic behavior of multiple species based on the time constants of the decomposed peaks. These peaks may also be attributable to specific chromophoric compounds or functional groups using a combination of literature absorbance information for relevant families of oligomerization products and via Woodward–Fieser rules [40,41,42]. By separating the different inferred active groups within a batch of aqSOA products, additional insight regarding relative rates of formation among different competing formation pathways of CVOC/AS products can be achieved, providing further information to support existing means of aqSOA speciation (e.g., Fourier-transform infared spectroscopy (FTIR), nuclear magnetic resonance spectroscopy (NMR), and mass spectroscopy).
The formation of chromophoric species in CVOC/AS systems, tracked to a single wavelength, has been modeled via first order kinetics with respect to both initial organic concentration and inorganic concentration [19,21]. Of note, Sareen et al. [21] modeled the formation of chromophoric products derived from MG as following first-order kinetics through parallel ammonium- and acid-driven mechaniss. Whereas values for rate constants of both inorganic mechanisms were approximated in the previous study, it was found that the ammonium pathway rate constant exceeded the acid pathway in high-salinity aerosol mimic solutions such that only the ammonium rate constant was necessary to estimate product formation [21]. Furthermore, using an AS concentration in excess in a reaction system enables the simplification of reaction kinetics to overall pseudo-first order. Following this, and applying an analogous approach across the other CVOC/AS systems, a time constant can be connected to rate constants and initial ammonium concentration, i.e.,
Potential product structures or functional groups, based on comparable peak locations observed in previous literature, along with inferred rate constants for these products assuming first order-kinetics (vis. Equation (6) and using an ammonium ion concentration of 6.2M), are summarized in Table 2.
Table 2.
Proposed structures and first-order rate constants for selected models, inferred from fitted peak locations and time constants.
4.1. Glyoxal + AS
Decomposed model spectra for the three-curve model of the G/AS system are shown in Figure 3. Of the two major peaks comprising the G/AS system, only the peak in the low 200-nm region exhibited dynamics outside of observational noise. This curve was represented by the three-curve composition as two overlapping lineshapes at 206 nm and 209 nm. Several chromophoric compounds have been identified in this region. Of note, imidazoles and its derivatives (e.g., imidazole carboxaldehyde) are measurable in ambient systems [45] and have been positively identified to strongly absorb in the low 200-nm range in acidic systems [43,44]. Pyrazines have also been proposed as G/AS dark chemistry products that absorb in this region, though they also contribute to absorbance in the 255–275-nm range [18]. In addition, glyoxal itself has been identified to absorb in this region, owing to its -carbonyl functional groups [25,44]. Whereas the proximity of the two fitted lineshape functions limits the ability to reliably assign specific compounds or functional groups to each wavelength, the decomposition of the spectra clearly identifies two distinct sets of dynamics that may help distinguish between two proposed reaction pathways that contribute chromophores at these wavelengths.
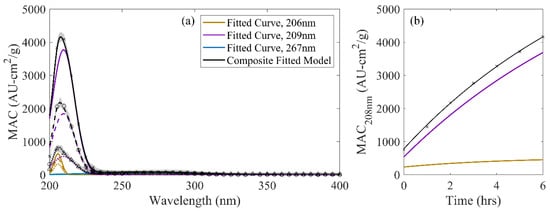
Figure 3.
(a) Decomposed, three-curve G/AS spectrum: (a) Across wavelength at 0 h (dotted), 2 h (dashed), and 6 h (solid) of solution aging compared against observations. (points) Shaded regions denote one standard deviation ranges for observed values. (b) Observed MAC at 208 nm (points) compared against the overall MG/AS three-curve model (black) and contributing lineshape functions.
The overlap in peaks may result in conflation of multiple reaction products contributing to a single value of reaction product MAC. Whereas older studies have used absorbance at a single reference wavelength to model kinetics [19,21,25,46], the resulting inferred rate constants resulted in a weighted average value that did not completely capture the parallel kinetics in play (Figure 3b). In the case of the G/AS solutions modeled in this work, using solely the MAC values at 208 nm yielded a fitted rate constant of 0.020 M−1h−1. This value is comparable to the peak at 208 nm in the two-curve model of the G/AS system (Table 2) and the 209-nm peak in the three-curve model. However, this value also slightly overstated their kinetics in trying to capture the behavior of the faster dynamics occurring in the 206-nm region, which were lost in the integration into this singular rate constant.
4.2. Glycolaldehyde + AS
The three-curve model spectral decomposition for the GA/AS reaction system is shown in Figure 4. This solution demonstrates the smallest absorbance dynamics of the three reaction systems tested, with MAC values increasing by less than 5% over six hours of solution aging in the entire range of wavelengths measured and modeled. Powelson et al. [17] observed similar behavior, with relatively quick but small increases in solution absorbance. Whereas changes were minor compared to those of the G/AS system, it has been demonstrated that several of the same heterocyclic, dark chemistry products that absorb in the low 200-nm range from the G/AS system are capable of forming in GA/AS solutions [18]. Although the heterocyclic species identified were ascertained from dried mimic solutions rather than aged samples, the inferred locations from aged solutions were expected to be largely consistent with these similarities to the G/AS system. The regressed locations of lineshape functions, summarized in Table 2, align with this assertion. However, different rate constants were estimated compared to the G/AS system, with negligible kinetics occurring from its 207-nm curve and nonnegligible kinetics in the 269-nm region. The similarities in contributing species with differing kinetics implies that, while comparable chromophores and contributing species are possible in the GA/AS system compared to G/AS, prevailing chemistry may vary between them.
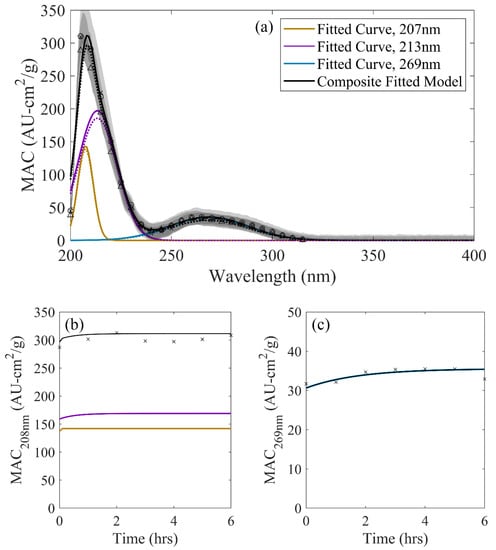
Figure 4.
(a) Decomposed, three-curve GA/AS spectrum: (a) Across wavelength at 0 h (dotted), 2 h (dashed), and 6 h (solid) of solution aging compared against observations (points). Shaded regions denote one standard deviation ranges for observed values. (b) Observed MAC at 208 nm (points) compared against the overall GA/AS three-curve model (black) and contributing lin eshape functions. (c) Observed MAC at 269 nm (points) compared against the overall GA/AS three-curve model (black) and contributing lineshape functions.
As with G/AS, the two overlapping peaks in the low 200-nm region presented a potential misrepresentation of kinetics due to multiple contributing sources. The two contributing lineshape functions, while representative of distinctly different kinetics, had more comparable magnitudes than those in the G/AS system (Figure 4b). The local maximum in this region shifted from 207–209 nm over the observed timeframe. Using MAC values at 208 nm to infer kinetics, an effective rate constant of 0.3537 M−1h−1 was attained, which is more representative of the shifting relative contribution of the two lineshape functions rather than their actual kinetics.
The smaller signal-to-noise ratio present in the GA/AS system presents additional challenges in the inference of kinetics, as GA/AS dark chemistry products are significantly less chromophoric than G/AS or MG/AS under similar concentrations and reaction conditions. Inferred rate constants using single-wavelength, time-resolved MAC were necessarily higher in variance, yielding effective rate constants ranging from 0.076–0.430 M−1h−1 for MAC values between 205–215 nm. As a spectral decomposition method can regress values using the data from an entire spectrum, a properly constructed set of lineshape functions may be used to infer kinetic information in a more broadly informed fashion for a given set of time-resolved data.
4.3. Methylglyoxal + AS
Decomposed spectra for the MG/AS system are shown in Figure 5. The larger of the two peaks in the MG/AS reaction system exhibited a local maximum shifting from 210 nm to 215 nm over the observed period and was decomposed into two Gaussian lineshapes at 207 nm and 217 nm. Previous observations for this region are limited due to signal saturation of absorbance measurements in earlier studies [17,19,21]. However, the -carbonyl groups, such as those from MG itself, and methylated analogues to the heterocyclic reaction products of the G/AS and GA/AS reaction systems have been identified in the MG/AS system [18,32], and are likely to absorb at these respective wavelengths [18]. The fitted 207-nm peak exhibited negligible dynamics as in GA/AS solutions (Figure 5b), suggesting that the chromophores contributing to the measurable increase in MAC in the G/AS system were formed via mechanisms unique to its reaction system. The modeled 207-nm peak was estimated to be relatively noncontributory to absorbance at 215 nm, the local maximum of this peak. Inferred rate constants using MAC values at 215 nm only yielded comparable (0.068 M−1h−1) inferred kinetics to those regressed via spectral decomposition (Table 2).
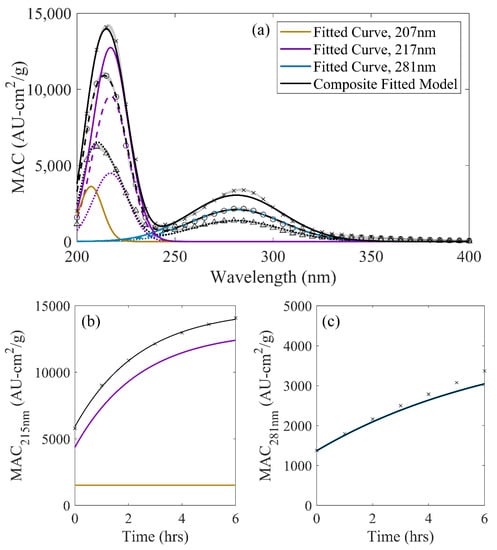
Figure 5.
(a) Decomposed, three-curve MG/AS spectrum: (a) Across wavelength at 0 h (dotted), 2 h (dashed), and 6 h (solid) of solution aging compared against observations (points). Shaded regions denote one standard deviation ranges for observed values. (b) Observed MAC at 215 nm (points) compared against the overall MG/AS three-curve model (black) and contributing lineshape functions. (c) Observed MAC at 281 nm (points) compared against the overall MG/AS three curve model (black) and contributing lineshape functions.
The smaller peak in the 281-nm region has been observed in multiple studies examining the MG/AS system [17,19,20,21,34,47,48] and has been largely attributed to oligomerization products containing imidazole carbonyl variants and methylglyoxal [20,34]. Methylpyrazine products have also been identified in MG/AS solution mimics, and are consistent with HPLC-MS measurements that observed m/z values for specific chromophoric MG/AS dark chemistry products [20,32]. The single Gaussian lineshape that represents the 281-nm region exhibits fairly good agreement with observation, remaining within 11% of observed values for the three-curve model (vis. Figure 1c and Figure 5c), though estimates slightly faster kinetics than rate constants regressed using absorbance at 281 nm (0.0131 M−1h−1). Notably, these estimates are higher than previously reported rate constants for the MG/AS system, though literature rate constants inferred from references using absorbance information at this wavelength has yielded widely varying values, spanning multiple orders of magnitude [21,47,48]. It is likely that additional features to the MG/AS system which were not constrained in these studies, such as surfactant behavior [21,23] or the tendency to “salt out” of solution [21,27], may reduce the comparability of these values in bulk systems.
Additional literature exploring the chromophoric properties of the MG/AS system have also noted a shoulder in the 350-nm region at higher organic concentrations or duration of solution aging, which were attributable to further oligomerized aldol condensation products [19,30]. Whereas the implementation of an additional lineshape function in this region led to statistically insignificant improvement to model accuracy, a rate constant may still be inferred, as reported in Table 2. The relatively small magnitude of solution MAC at these wavelengths imply that, as observed, their overall contribution to overall solution light-absorbing properties may not be significant until sufficiently high concentrations of these products have accumulated.
Whereas the three- and four-curve Gaussian models were able to achieve good agreement with measured MAC, some studies that have measured absorbance properties of MG/AS mimic solutions aged on the order of days [20,21] have noted an asymmetry in this peak at longer reaction times. As additional features become more visible in this overall UV/visible spectrum, it is likely that the implementation of additional lineshapes into its decomposition will yield higher accuracy at long simulation times, potentially elucidating additional kinetics that occur outside the time frame utilized in this work.
5. Atmospheric Implications
The dynamic measurement of UV-visible absorbance of CVOC/AS systems yields spectra that change in relative peak heights and maximum absorbance wavelengths over their lifetimes, providing an impetus to create modeling approaches that capture these changes more accurately than via the scaling of an individual reference spectrum. The decomposition of these spectra into a series of Gaussian curves presents a flexible and powerful means of representing a range of dynamic behaviors into a relatively small number of fitted parameters. In addition, this method also presents a potential method to infer information about structure or chemical kinetics in CVOC/AS systems where multiple competing phenomena contribute to a single absorbance reading in the UV-visible region. Using this type of analysis, the entire UV/visible spectra can inform kinetic modeling rather than discrete values, enabling the identification of additional potential products and parallel reaction pathways from underlying peaks that may not be immediately apparent upon first inspection.
The spectral decomposition approach used in this study can be applied to other BrC reaction systems to better understand contributing chromophores and their respective dynamics. The number of Gaussian curves required to accurately represent light-absorbing properties is likely to differ from system to system. For products that have varied or complex spectra, such as those observed in terpene-derived aqSOA products [34], additional lineshape functions will necessarily be required to capture their dynamics. Compared to the model equations used in this work, the resultant functions will require larger amounts of training data to reliably and unambiguously infer coefficients. Data sampling rates and resolution should therefore be considered when assessing the viability of a decomposition approach to model solution kinetics.
UV/visible absorbance data is an easily collected and relatively noninvasive method of measuring bulk solution properties and is therefore a useful proxy for inferring concentration-dependent phenomena such as chemical kinetics. Whereas the derived coefficients using the approach described in this work could theoretically be used to explicitly predict the dynamic absorbance behavior of CVOC aerosol mimic reaction systems, the direct applicability of these results to the absorbance of atmospheric aerosols is limited. Without high surface-volume ratios, heterogeneous chemistry and cross-reactions of surfactant species [23] will not be accurately captured in mimic solutions, resulting in potential differences in prevailing chromophore formation. In addition, the changes to the condensed phase itself due to shifts in the temperature, pressure, and humidity surrounding an aerosol in its lifetime would result in partitioning and phase change phenomena that were not factored into these studies. To this end, when using this decomposition technique to infer information about the light absorbing properties of brown carbon in aqueous systems, it should be emphasized that the primary purpose of this modeling technique is to model rate information of a reaction system, rather than the chromophoricities of the products themselves.
Supplementary Materials
The following are available online at https://www.mdpi.com/2073-4433/11/4/358/s1, Table S1: Normalized Root Mean Square Deviation (NRMSD) values for simulations performed at varying times, numbers of Gaussian lineshapes, and CVOC/AS reaction systems, Table S2: Maximum percentage error in the 205–300nm region for simulations performed at varying times, numbers of Gaussian lineshapes, and CVOC/AS reaction systems, Figure S1: Multiple comparison test of population marginal means for the NRMSD of different CVOC/AS reaction systems and number of Gaussian curves used in model regression, across all times (0–6 h).
Author Contributions
Formal analysis, M.F., S.M. and J.L.W.; Investigation, J.L.W.; Methodology, M.F., S.M., N.F. and Z.D.; Writing—original draft, J.L.W.; Writing—review & editing, J.L.W. All authors have read and agreed to the published version of the manuscript.
Funding
This research received no external funding.
Acknowledgments
The authors thank Melissa Galloway and Aseel Bala for useful and constructive discussion in model development and chemistry relevant to the observed systems.
Conflicts of Interest
The authors declare no conflict of interest.
References
- McNeill, V.F. Aqueous organic chemistry in the atmosphere: Sources and chemical processing of organic aerosols. Environ. Sci. Technol. 2015, 49, 1237–1244. [Google Scholar] [CrossRef] [PubMed]
- Herrmann, H.; Schaefer, T.; Tilgner, A.; Styler, S.A.; Weller, C.; Teich, M.; Otto, T. Tropospheric Aqueous-Phase Chemistry: Kinetics, Mechanisms, and Its Coupling to a Changing Gas Phase. Chem. Rev. 2015, 115, 4259–4334. [Google Scholar] [CrossRef] [PubMed]
- Ervens, B.; Turpin, B.J.; Weber, R.J. Secondary organic aerosol formation in cloud droplets and aqueous particles (aqSOA): A review of laboratory, field and model studies. Atmos. Chem. Phys. 2011, 11, 11069–11102. [Google Scholar] [CrossRef]
- Faust, J.A.; Wong, J.P.S.; Lee, A.K.Y.; Abbatt, J.P.D. Role of Aerosol Liquid Water in Secondary Organic Aerosol Formation from Volatile Organic Compounds. Environ. Sci. Technol. 2017, 51, 1405–1413. [Google Scholar] [CrossRef]
- Carlton, A.G.; Turpin, B.J. Particle partitioning potential of organic compounds is highest in the Eastern US and driven by anthropogenic water. Atmos. Chem. Phys. 2013, 13, 10203–10214. [Google Scholar] [CrossRef]
- Volkamer, R.; San Martini, F.; Molina, L.T.; Salcedo, D.; Jimenez, J.L.; Molina, M.J. A missing sink for gas-phase glyoxal in Mexico City: Formation of secondary organic aerosol. Geophys. Res. Lett. 2007, 34, L19807. [Google Scholar] [CrossRef]
- Ervens, B.; Carlton, A.G.; Turpin, B.J.; Altieri, K.E.; Kreidenweis, S.M.; Feingold, G. Secondary organic aerosol yields from cloud-processing of isoprene oxidation products. Geophys. Res. Lett. 2008, 35, L02816. [Google Scholar] [CrossRef]
- Hecobian, A.; Zhang, X.; Zheng, M.; Frank, N.; Edgerton, E.S.; Weber, R.J. Water-Soluble Organic Aerosol material and the light-absorption characteristics of aqueous extracts measured over the Southeastern United States. Atmos. Chem. Phys. 2010, 10, 5965–5977. [Google Scholar] [CrossRef]
- Fu, T.-M.; Jacob, D.J.; Wittrock, F.; Burrows, J.P.; Vrekoussis, M.; Henze, D.K. Global budgets of atmospheric glyoxal and methylglyoxal, and implications for formation of secondary organic aerosols. J. Geophys. Res. 2008, 113, D15303. [Google Scholar] [CrossRef]
- Ervens, B.; Volkamer, R. Glyoxal processing by aerosol multiphase chemistry: Towards a kinetic modeling framework of secondary organic aerosol formation in aqueous particles. Atmos. Chem. Phys. 2010, 10, 8219–8244. [Google Scholar] [CrossRef]
- Liggio, J.; Li, S.; McLaren, R. Reactive uptake of glyoxal by particulate matter. J. Geophys. Res. 2005, 110, D10304. [Google Scholar] [CrossRef]
- Galloway, M.M.; Chhabra, P.S.; Chan, A.W.H.; Surratt, J.D.; Flagan, R.C.; Seinfeld, J.H.; Keutsch, F.N. Glyoxal uptake on ammonium sulphate seed aerosol: Reaction products and reversibility of uptake under dark and irradiated conditions. Atmos. Chem. Phys. 2009, 9, 3331–3345. [Google Scholar] [CrossRef]
- De Haan, D.O.; Corrigan, A.L.; Tolbert, M.A.; Jimenez, J.L.; Wood, S.E.; Turley, J.J. Secondary Organic Aerosol Formation by Self-Reactions of Methylglyoxal and Glyoxal in Evaporating Droplets. Environ. Sci. Technol. 2009, 43, 8184–8190. [Google Scholar] [CrossRef] [PubMed]
- De Haan, D.O.; Hawkins, L.N.; Kononenko, J.A.; Turley, J.J.; Corrigan, A.L.; Tolbert, M.A.; Jimenez, J.L. Formation of Nitrogen-Containing Oligomers by Methylglyoxal and Amines in Simulated Evaporating Cloud Droplets. Environ. Sci. Technol. 2011, 45, 984–991. [Google Scholar] [CrossRef]
- Galloway, M.M.; Loza, C.L.; Chhabra, P.S.; Chan, A.W.H.; Yee, L.D.; Seinfeld, J.H.; Keutsch, F.N. Analysis of photochemical and dark glyoxal uptake: Implications for SOA formation. Geophys. Res. Lett. 2011, 38. [Google Scholar] [CrossRef]
- McNeill, V.F.; Woo, J.L.; Kim, D.D.; Schwier, A.N.; Wannell, N.J.; Sumner, A.J.; Barakat, J.M. Aqueous-Phase Secondary Organic Aerosol and Organosulfate Formation in Atmospheric Aerosols: A Modeling Study. Environ. Sci. Technol. 2012, 46, 8075–8081. [Google Scholar] [CrossRef]
- Powelson, M.H.; Espelien, B.M.; Hawkins, L.N.; Galloway, M.M.; De Haan, D.O. Brown Carbon Formation by Aqueous-Phase Carbonyl Compound Reactions with Amines and Ammonium Sulfate. Environ. Sci. Technol. 2014, 48, 985–993. [Google Scholar] [CrossRef]
- Grace, D.N.; Sharp, J.R.; Holappa, R.E.; Lugos, E.N.; Sebold, M.B.; Griffith, D.R.; Hendrickson, H.P.; Galloway, M.M. Heterocyclic Product Formation in Aqueous Brown Carbon Systems. ACS Earth Space Chem. 2019, 3, 2472–2481. [Google Scholar] [CrossRef]
- Schwier, A.N.; Sareen, N.; Mitroo, D.; Shapiro, E.L.; McNeill, V.F. Glyoxal-Methylglyoxal Cross-Reactions in Secondary Organic Aerosol Formation. Environ. Sci. Technol. 2010, 44, 6174–6182. [Google Scholar] [CrossRef]
- Lin, P.; Laskin, J.; Nizkorodov, S.A.; Laskin, A. Revealing Brown Carbon Chromophores Produced in Reactions of Methylglyoxal with Ammonium Sulfate. Environ. Sci. Technol. 2015, 49, 14257–14266. [Google Scholar] [CrossRef]
- Sareen, N.; Schwier, A.N.; Shapiro, E.L.; Mitroo, D.; McNeill, V.F. Secondary organic material formed by methylglyoxal in aqueous aerosol mimics. Atmos. Chem. Phys. 2010, 10, 997–1016. [Google Scholar] [CrossRef]
- Sareen, N.; Schwier, A.N.; Lathem, T.L.; Nenes, A.; McNeill, V.F. Surfactants from the gas phase may promote cloud droplet formation. Proc. Natl. Acad. Sci. USA 2013, 110, 2723–2728. [Google Scholar] [CrossRef] [PubMed]
- Beier, T.; Cotter, E.R.; Galloway, M.M.; Woo, J.L. In Situ Surface Tension Measurements of Hanging Droplet Methylglyoxal/Ammonium Sulfate Aerosol Mimics under Photooxidative Conditions. ACS Earth Space Chem. 2019, 3, 1208–1215. [Google Scholar] [CrossRef]
- Galloway, M.M.; Powelson, M.H.; Sedehi, N.; Wood, S.E.; Millage, K.D.; Kononenko, J.A.; Rynaski, A.D.; De Haan, D.O. Secondary Organic Aerosol Formation during Evaporation of Droplets Containing Atmospheric Aldehydes, Amines, and Ammonium Sulfate. Environ. Sci. Technol. 2014, 48, 14417–14425. [Google Scholar] [CrossRef]
- Nozière, B.; Dziedzic, P.; Córdova, A. Products and Kinetics of the Liquid-Phase Reaction of Glyoxal Catalyzed by Ammonium Ions (NH4+ ). J. Phys. Chem. A 2009, 113, 231–237. [Google Scholar] [CrossRef] [PubMed]
- Loeffler, K.W.; Koehler, C.A.; Paul, N.M.; De Haan, D.O. Oligomer Formation in Evaporating Aqueous Glyoxal and Methyl Glyoxal Solutions. Environ. Sci. Technol. 2006, 40, 6318–6323. [Google Scholar] [CrossRef]
- Stangl, C.M.; Johnston, M.V. Aqueous Reaction of Dicarbonyls with Ammonia as a Potential Source of Organic Nitrogen in Airborne Nanoparticles. J. Phys. Chem. A 2017, 121, 3720–3727. [Google Scholar] [CrossRef]
- Shapiro, E.L.; Szprengiel, J.; Sareen, N.; Jen, C.N.; Giordano, M.R.; McNeill, V.F. Light-absorbing secondary organic material formed by glyoxal in aqueous aerosol mimics. Atmos. Chem. Phys. Discuss. 2009, 9, 59–80. [Google Scholar] [CrossRef]
- Woo, J.L.; Kim, D.D.; Schwier, A.N.; Li, R.; McNeill, V.F. Aqueous aerosol SOA formation: Impact on aerosol physical properties. Faraday Discuss. 2013, 165, 357–367. [Google Scholar] [CrossRef]
- Hawkins, L.N.; Lemire, A.N.; Galloway, M.M.; Corrigan, A.L.; Turley, J.J.; Espelien, B.M.; De Haan, D.O. Maillard Chemistry in Clouds and Aqueous Aerosol As a Source of Atmospheric Humic-Like Substances. Environ. Sci. Technol. 2016, 50, 7443–7452. [Google Scholar] [CrossRef]
- Yi, Y.; Cao, Z.; Zhou, X.; Xue, L.; Wang, W. Formation of aqueous-phase secondary organic aerosols from glycolaldehyde and ammonium sulfate/amines: A kinetic and mechanistic study. Atmos. Environ. 2018, 181, 117–125. [Google Scholar] [CrossRef]
- Hawkins, L.N.; Welsh, H.G.; Alexander, M.V. Evidence for pyrazine-based chromophores in cloud water mimics containing methylglyoxal and ammonium sulfate. Atmos. Chem. Phys. 2018, 18, 12413–12431. [Google Scholar] [CrossRef]
- Grace, D.N.; Sebold, M.B.; Galloway, M.M. Separation and detection of aqueous atmospheric aerosol mimics using supercritical fluid chromatography-mass spectrometry. Atmos. Meas. Tech 2019, 12, 3841–3851. [Google Scholar] [CrossRef]
- Aiona, P.K.; Lee, H.J.; Leslie, R.; Lin, P.; Laskin, A.; Laskin, J.; Nizkorodov, S.A. Photochemistry of Products of the Aqueous Reaction of Methylglyoxal with Ammonium Sulfate. ACS Earth Space Chem. 2017, 1, 522–532. [Google Scholar] [CrossRef]
- de Levie, R. On deconvolving spectra. Am. J. Phys. 2004, 72, 910–915. [Google Scholar] [CrossRef]
- Barker, B.E.; Fox, M.F. Computer resolution of overlapping electronic absorption bands. Chem. Soc. Rev. 1980, 9, 143–184. [Google Scholar] [CrossRef]
- Tang, M.; Alexander, J.M.; Kwon, D.; Estillore, A.D.; Laskina, O.; Young, M.A.; Kleiber, P.D.; Grassian, V.H. Optical and Physicochemical Properties of Brown Carbon Aerosol: Light Scattering, FTIR Extinction Spectroscopy, and Hygroscopic Growth. J. Phys. Chem. A 2016, 120, 4155–4166. [Google Scholar] [CrossRef]
- Li, Z.; Schwier, A.N.; Sareen, N.; McNeill, V.F. Reactive processing of formaldehyde and acetaldehyde in aqueous aerosol mimics: Surface tension depression and secondary organic products. Atmos. Chem. Phys. 2011, 11, 11617–11629. [Google Scholar] [CrossRef]
- Frisch, M.J.; Trucks, G.W.; Schlegel, H.B.; Scuseria, G.E.; Robb, M.A.; Cheeseman, J.R.; Scalmani, G.; Barone, V.; Petersson, G.A.; Nakatsuji, H.; et al. Gaussian 16; Gaussian, Inc.: Wallingford, CT, USA, 2016. [Google Scholar]
- Woodward, R.B. Structure and the Absorption Spectra of α,β-Unsaturated Ketones. J. Am. Chem. Soc. 1941, 63, 1123–1126. [Google Scholar] [CrossRef]
- Liljefors, T.; Allinger, N.L. Conformational analysis. 128. The Woodward-Fieser rules and α,β-unsaturated ketones. J. Am. Chem. Soc. 1978, 100, 1068–1073. [Google Scholar] [CrossRef]
- Fieser, L.F.; Fieser, M.; Rajagopalan, S. Absorption Spectroscopy And The Structures Of The Diosterols. J. Org. Chem. 1948, 13, 800–806. [Google Scholar] [CrossRef]
- Ackendorf, J.M.; Ippolito, M.G.; Galloway, M.M. pH Dependence of the Imidazole-2-carboxaldehyde Hydration Equilibrium: Implications for Atmospheric Light Absorbance. Environ. Sci. Technol. Lett. 2017, 4, 551–555. [Google Scholar] [CrossRef]
- Maxut, A.; Nozière, B.; Fenet, B.; Mechakra, H. Formation mechanisms and yields of small imidazoles from reactions of glyoxal with NH4(+) in water at neutral pH. Phys. Chem. Chem. Phys. 2015, 17, 20416–20424. [Google Scholar] [CrossRef]
- Teich, M.; Van Pinxteren, D.; Kecorius, S.; Wang, Z.; Herrmann, H. First Quantification of Imidazoles in Ambient Aerosol Particles: Potential Photosensitizers, Brown Carbon Constituents, and Hazardous Components. Environ. Sci. Technol. 2016, 50, 1166–1173. [Google Scholar] [CrossRef]
- Sareen, N.; Moussa, S.G.; McNeill, V.F. Photochemical Aging of Light-Absorbing Secondary Organic Aerosol Material. J. Phys. Chem. A 2013, 117, 2987–2996. [Google Scholar] [CrossRef]
- Sedehi, N.; Takano, H.; Blasic, V.A.; Sullivan, K.A.; De Haan, D.O. Temperature- and pH-dependent aqueous-phase kinetics of the reactions of glyoxal and methylglyoxal with atmospheric amines and ammonium sulfate. Atmos. Environ. 2013, 77, 656–663. [Google Scholar] [CrossRef]
- Gao, Y.; Zhang, Y. Optical properties investigation of the reactions between methylglyoxal and glycine/ammonium sulfate. Spectrochim. Acta Part A Mol. Biomol. Spectrosc. 2019, 215, 112–121. [Google Scholar] [CrossRef]
© 2020 by the authors. Licensee MDPI, Basel, Switzerland. This article is an open access article distributed under the terms and conditions of the Creative Commons Attribution (CC BY) license (http://creativecommons.org/licenses/by/4.0/).