Article

Late 21st Century Projected Changes in the Relationship between Precipitation, African Easterly Jet, and African Easterly Waves

by
Ibourahima Kebe
1,2,*,
Ismaila Diallo
3,*,
Mouhamadou Bamba Sylla
4,
Fernando De Sales
5 and
Arona Diedhiou
6,7
1
West African Science Service Center on Climate Change and Adapted Landuse (WASCAL) Graduate Research Program on West African Climate System, Federal University of Technology, P.M.B. 704 Akure, Nigeria
2
WASCAL Competence Center, Boulevard Mouammar Kadafi, Patte d’oie, 06 B.P 9507 Ouagadougou, Burkina Faso
3
Department of Geography, University of California—Los Angeles, Los Angeles, CA 90095, USA
4
African Institute for Mathematical Sciences (AIMS), AIMS Rwanda Center, KN 3, P.O. Box 71 50 Kigali, Rwanda
5
Department of Geography, San Diego State University, San Diego, CA 92182, USA
6
Institute of Research for Development IRD, CNRS, Grenoble INP, IGE, University Grenoble Alpes, F-38000 Grenoble, France
7
African Centre of Excellence on Climate Change, Biodiversity and Sustainable Agriculture (ACE CCBAD), University Félix Houphouët Boigny, 22 BP 582 Abidjan 22, Cote d’Ivoire
*
Authors to whom correspondence should be addressed.
Atmosphere 2020, 11(4), 353; https://doi.org/10.3390/atmos11040353
Submission received: 10 March 2020 / Revised: 31 March 2020 / Accepted: 2 April 2020 / Published: 4 April 2020
(This article belongs to the Special Issue Trends in Hydrological and Climate Extremes in Africa)

Abstract

:
The present study utilizes three high-resolution simulations from the Regional Climate Model version 4 (RegCM4) to examine the late 21st century changes (2080–2099) in the West African Monsoon (WAM) features. A set of three Earth System Models are utilized to provide initial and lateral boundary conditions to the RegCM4 experiments. Our analysis focuses on seasonal mean changes in WAM large-scale dynamical features, along with their connections with the summer monsoon precipitation. In the historical period, the simulation ensemble means mimic reasonably well the intensity and spatial distribution of the WAM rainfall as well as the WAM circulation patterns at different scales. The future projection of the WAM climate exhibits warming over the whole West Africa leading to precipitation reduction over the Sahel region, and a slight increase over some areas of the Guinea Coast. The position of the African Easterly Jet (AEJ) is shifted southward and the African Easterly Waves (AEWs) activities are reduced, which affect in turn the WAM rainbelt characteristics in terms of position and strength. Overall the changes in simulated AEJ and AEWs contribute substantially to reduce the seasonal summer mean precipitation in West Africa by the late 21st century, with prevailing negative changes in the Savanna-Sahel region. To further explore the robustness of the relationships revealed in this paper, future studies using different high-resolution regional climate models with large ensemble are recommended.

1. Introduction

In the tropical West Africa, climate is dictated by the West African Monsoon (WAM) system, which is strongly influenced by climate change and climate variability. The WAM is extremely important for the agricultural system due to its role in providing a large amount of summer precipitation to the local population whose livelihoods primarily rely on rain-fed agriculture. The WAM system exerts high inter-annual and intra-seasonal variability driven by complex interactions between different large-scale dynamical features, which include the African Easterly Jet (AEJ) and the African Easterly Waves (AEWs). Any variability of these features could influence both the position and intensity of the WAM [1]. Therefore, changes in the summer monsoon precipitation regime are very critical because it is one of the weather elements whose future changes will adversely impact the economy of the West Africa where agriculture depends significantly on rainfall.
The AEJ is a mid-tropospheric jet with a strong zonal wind structure (up to ≈10 m/s) located between 600 and 700 hPa. The AEJ develops over the northern hemisphere. This dynamical feature is linked to the meridional surface moisture and temperature gradients between the Sahara and equatorial Africa tied to the deep convective heating [2,3]. The AEJ is maintained by the juxtaposition of dry convection to the north and moist convection to the south [4,5,6,7]. The instabilities around this circulation pattern generate a perturbation called the AEWs, which have been identified as the main mechanism controlling convection and rainfall patterns [8,9,10]. AEWs are generated upstream of the Sudanese high lands and propagate across West Africa around the mid-tropospheric AEJ through a combination of baroclinic and barotropic conversion [3,11,12]. Previous studies have discussed the relation between the AEWs formation and the instability associated with the meridional gradient of reversed isentropic potential vorticity (IPV). For instance, Leroux and Hall [13] showed that the AEWs are maintained by combined baroclinic and barotropic conversions, whereas Thorncroft and Blackburn [4] found that the wave generation is related to the existence of the AEJ.
Overall, both AEWs and AEJ dynamical features (their intensity and latitudinal position) have a great influence on the WAM precipitation regime, indicating complex interactions between monsoon dynamical features and convection [3,14,15]. For instance, the seasonal migration of the AEJ towards the equator corresponds to a dry year in the Sahel characterized by weaker low-level southwesterly monsoon flow, a stronger AEJ and weaker shear in the 700-hPa easterly jet south of the equator as well as a reduced southward extension of upper-level easterlies over West Africa [16,17,18,19,20,21]. Nicholson et al. [21] and Sylla et al. [22] showed that the north–south displacement of the AEJ core during the monsoon season strongly affects the intra-seasonal fluctuation in the position of the main summer monsoon rainbelt. Likewise, the AEWs exert a greater influence on high-frequency rainfall variability [23,24,25]; through the initiation and organization of mesoscale convective systems (MCSs) and squall lines [9,26,27].
More recently, there have been remarkable efforts to improve our understanding of the West African climate system using a regional climate modeling approach [28,29,30,31,32,33,34,35]. For instance, a number of projects have been developed to advance the understanding of the WAM system [31,32,33,34,35] and to comparatively assess the modeling of the WAM mean climatology and its projected changes [29,36,37]. Such studies are based on the physical understanding of the monsoon system, along with its variability and rely mostly on the ability of regional climate models to accurately represent large-scale circulation features [3,16,17,19,38,39,40]. However, despite the critical influence of the WAM characteristics on the summer precipitation, there are still unresolved questions on how various levels of increases in radiative forcing could affect the monsoon dynamical features and rainfall at the late 21st century (2080–2099).
In fact, a limited number of studies have attempted to investigate the relationship between changes in WAM features and precipitation changes [16,17,19,22,36,38,40,41,42,43]. In this study, we utilize an unprecedented high-resolution regional climate model RegCM4 simulations over the West Africa domain under two Representative Concentration Pathways (RCP4.5 and RCP8.5) in the late 21st century to investigate the relationship between the AEJ, the AEWs, the convection, and summer monsoon precipitation changes. Since the overall evaluation of the RegCM4 historical simulations has been previously performed by Sylla et al. [44] and Kebe et al. [45], in this paper we primarily focused our analysis on the changes (future projections) in the summer seasonal 2m-temperature (T2m), precipitation, and WAM large-scale characteristics based on the two scenarios. Additionally, a series of statistical covariance analysis are carried out in order to establish the coupling between precipitation and AEJ, as well as precipitation and AEWs.
The article is organized as follows: Section 2 describes the model physics, experimental design, and analysis method. Results and discussion are presented in Section 3, while in Section 4 we present the summary and main conclusions.

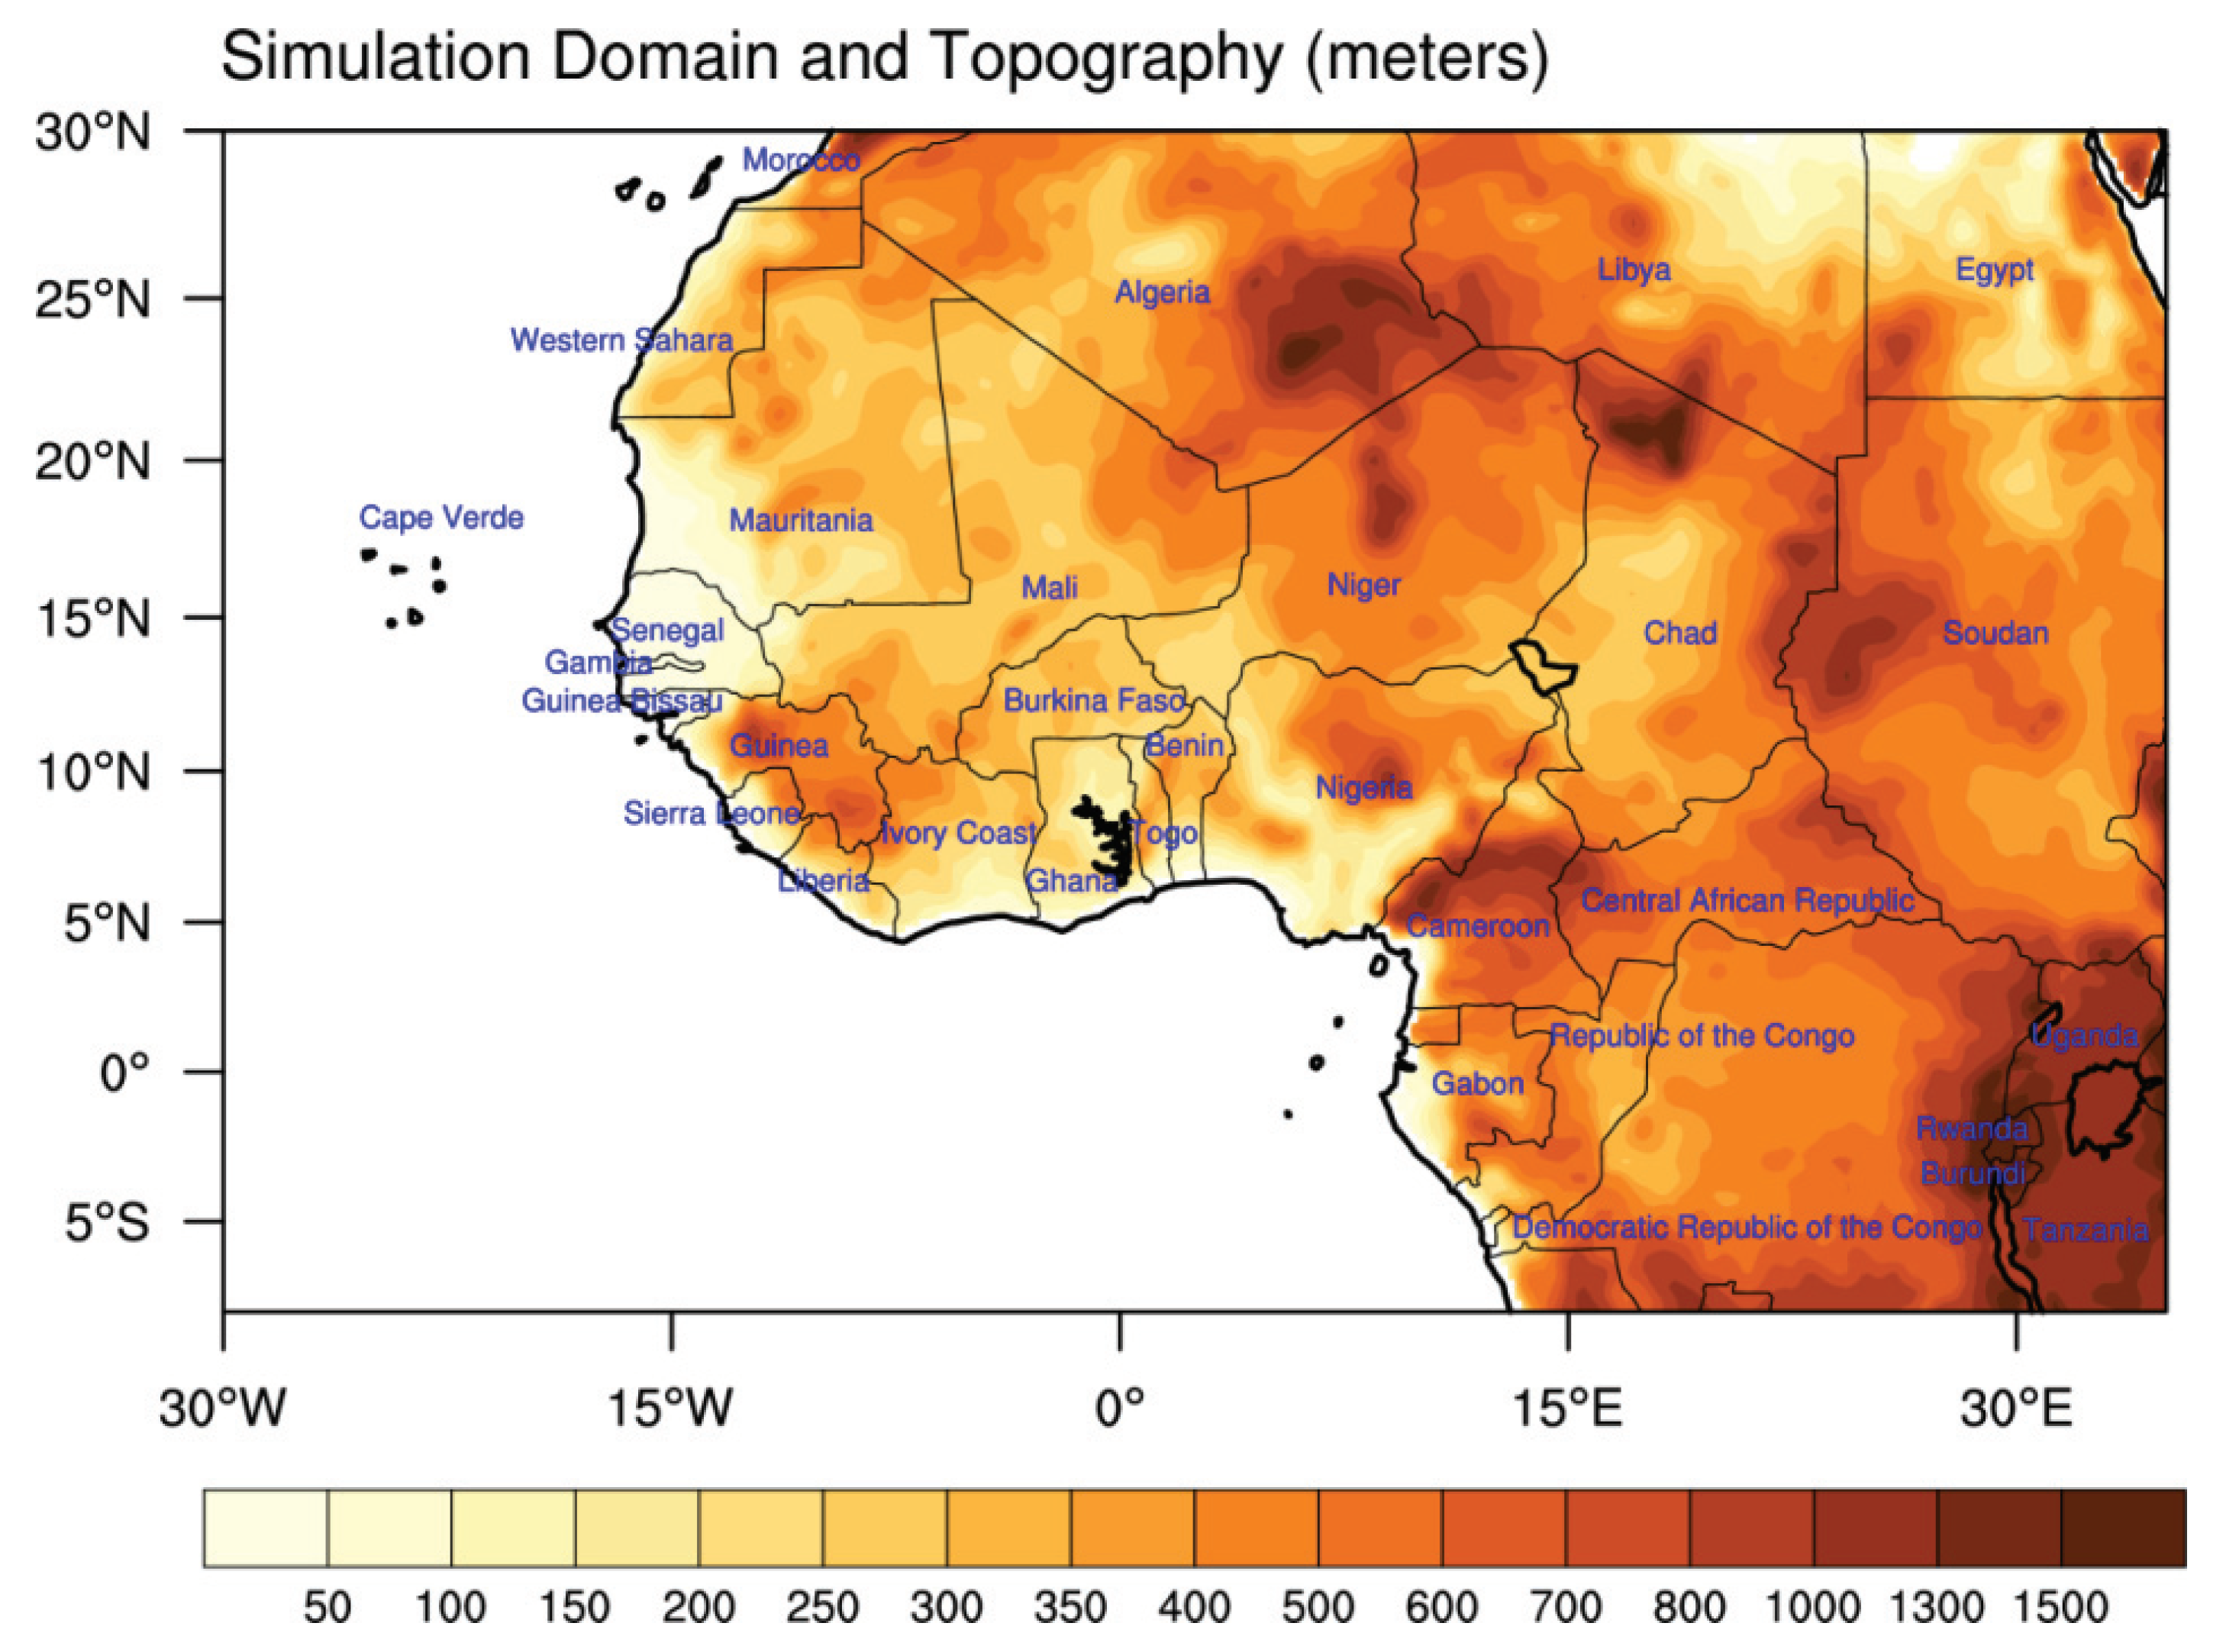
2. Model Descriptions, Experiments Configurations, and Methods

We utilized a large ensemble of high-resolution regional climate model (RCM) simulation over a West African domain (Figure 1) using the Regional Climate Model version 4 (RegCM4; [46]). In this study, we utilized the RegCM model version 4.3 (RegCM4.3, hereafter RegCM4).The RegCM4 modeling system offers various physics scheme options, which are described and summarized in [46]. For our experiments, the selected physics options are (i) the scheme of Kiehl et al. [47] for the radiation, (ii) the Community Land Model version 4.5 (CLM4.5) [48] for the representation of the interactions between land-surface processes and the atmosphere, (iii) The Massachusetts Institute of technology cumulus convection scheme of Emanuel [49,50], (iv) the scheme of Zeng et al. [51] to represent the fluxes from the ocean, and (v) the SUBgrid EXplicit (SUBEX) moisture resolvable scale precipitation scheme of Pal et al. [52]. The aforementioned setup for the RegCM4 model setting is similar to those described and used in Sylla et al. [44], Kebe et al. [45], and Tall et al. [53]. For more details regarding the RegCM4 configuration, for brevity the reader is directed to both Sylla et al. [44] and Kebe et al. [45].
RegCM4 experiments were performed using a horizontal grid spacing of 25 km with 18 vertical levels. A set of three Earth System Models (ESMs) (GFDL-ESM2M, HadGEM2-ES, and MPI-ESM; see Table 1) participating in the fifth phase of the Coupled Model Inter-comparison Project (CIMIP5) [54] were utilized to provide initial and lateral boundary conditions to the RegCM4 experiments. Table 1 provides the ESMs information, while Table 2 summarizes the simulation periods (two 20-year time periods): (i) 1985–2004 for the historical (reference) period, and (ii) 2080–2099 for the late 21st century under two Radiative Concentration Pathways (RCP4.5 and RCP8.5), the experiment acronyms, and the driving ESMs for each experiment. Note that the three ESMs were selected due to their availability at the time of completion of these simulations, but also have exhibited adequate skills over West Africa. A previous study by Kebe et al. [45] focused on analyzing the historical simulations, which they compared/evaluated against various observations and reanalysis. They highlighted the added value of the RegCM4 over the different driving ESMs in simulating the WAM mean seasonal climatology and its associated large scale circulation features.
In this paper we primarily focused on future projections based on two scenarios. Indeed, we utilized the 1985–2004 period as historical (reference) period for the calculation of changes in the late 21st century (change = (2080–2099) minus (1985–2004)). We examined and inter-compared the model simulations with their ensemble mean to account for the progressive change of the West African climate system. We investigated to what extent anthropogenic climate change affects the WAM large-scale dynamical features. Specifically, we focused on examining how convection, AEJ, AEWs, and their relationship with precipitation are changing in the late 21st century. In terms of change, the growth and propagation of these features along with their dynamics and interactions with precipitation patterns were also investigated. Finally, a series of statistical covariance analyses were carried out in order to establish the coupling between precipitation and AEJ, as well as precipitation and AEWs. These approaches identify where both climate variable relationships have strengthened or weakened under global warming in the late 21st century.

3. Results and Discussion

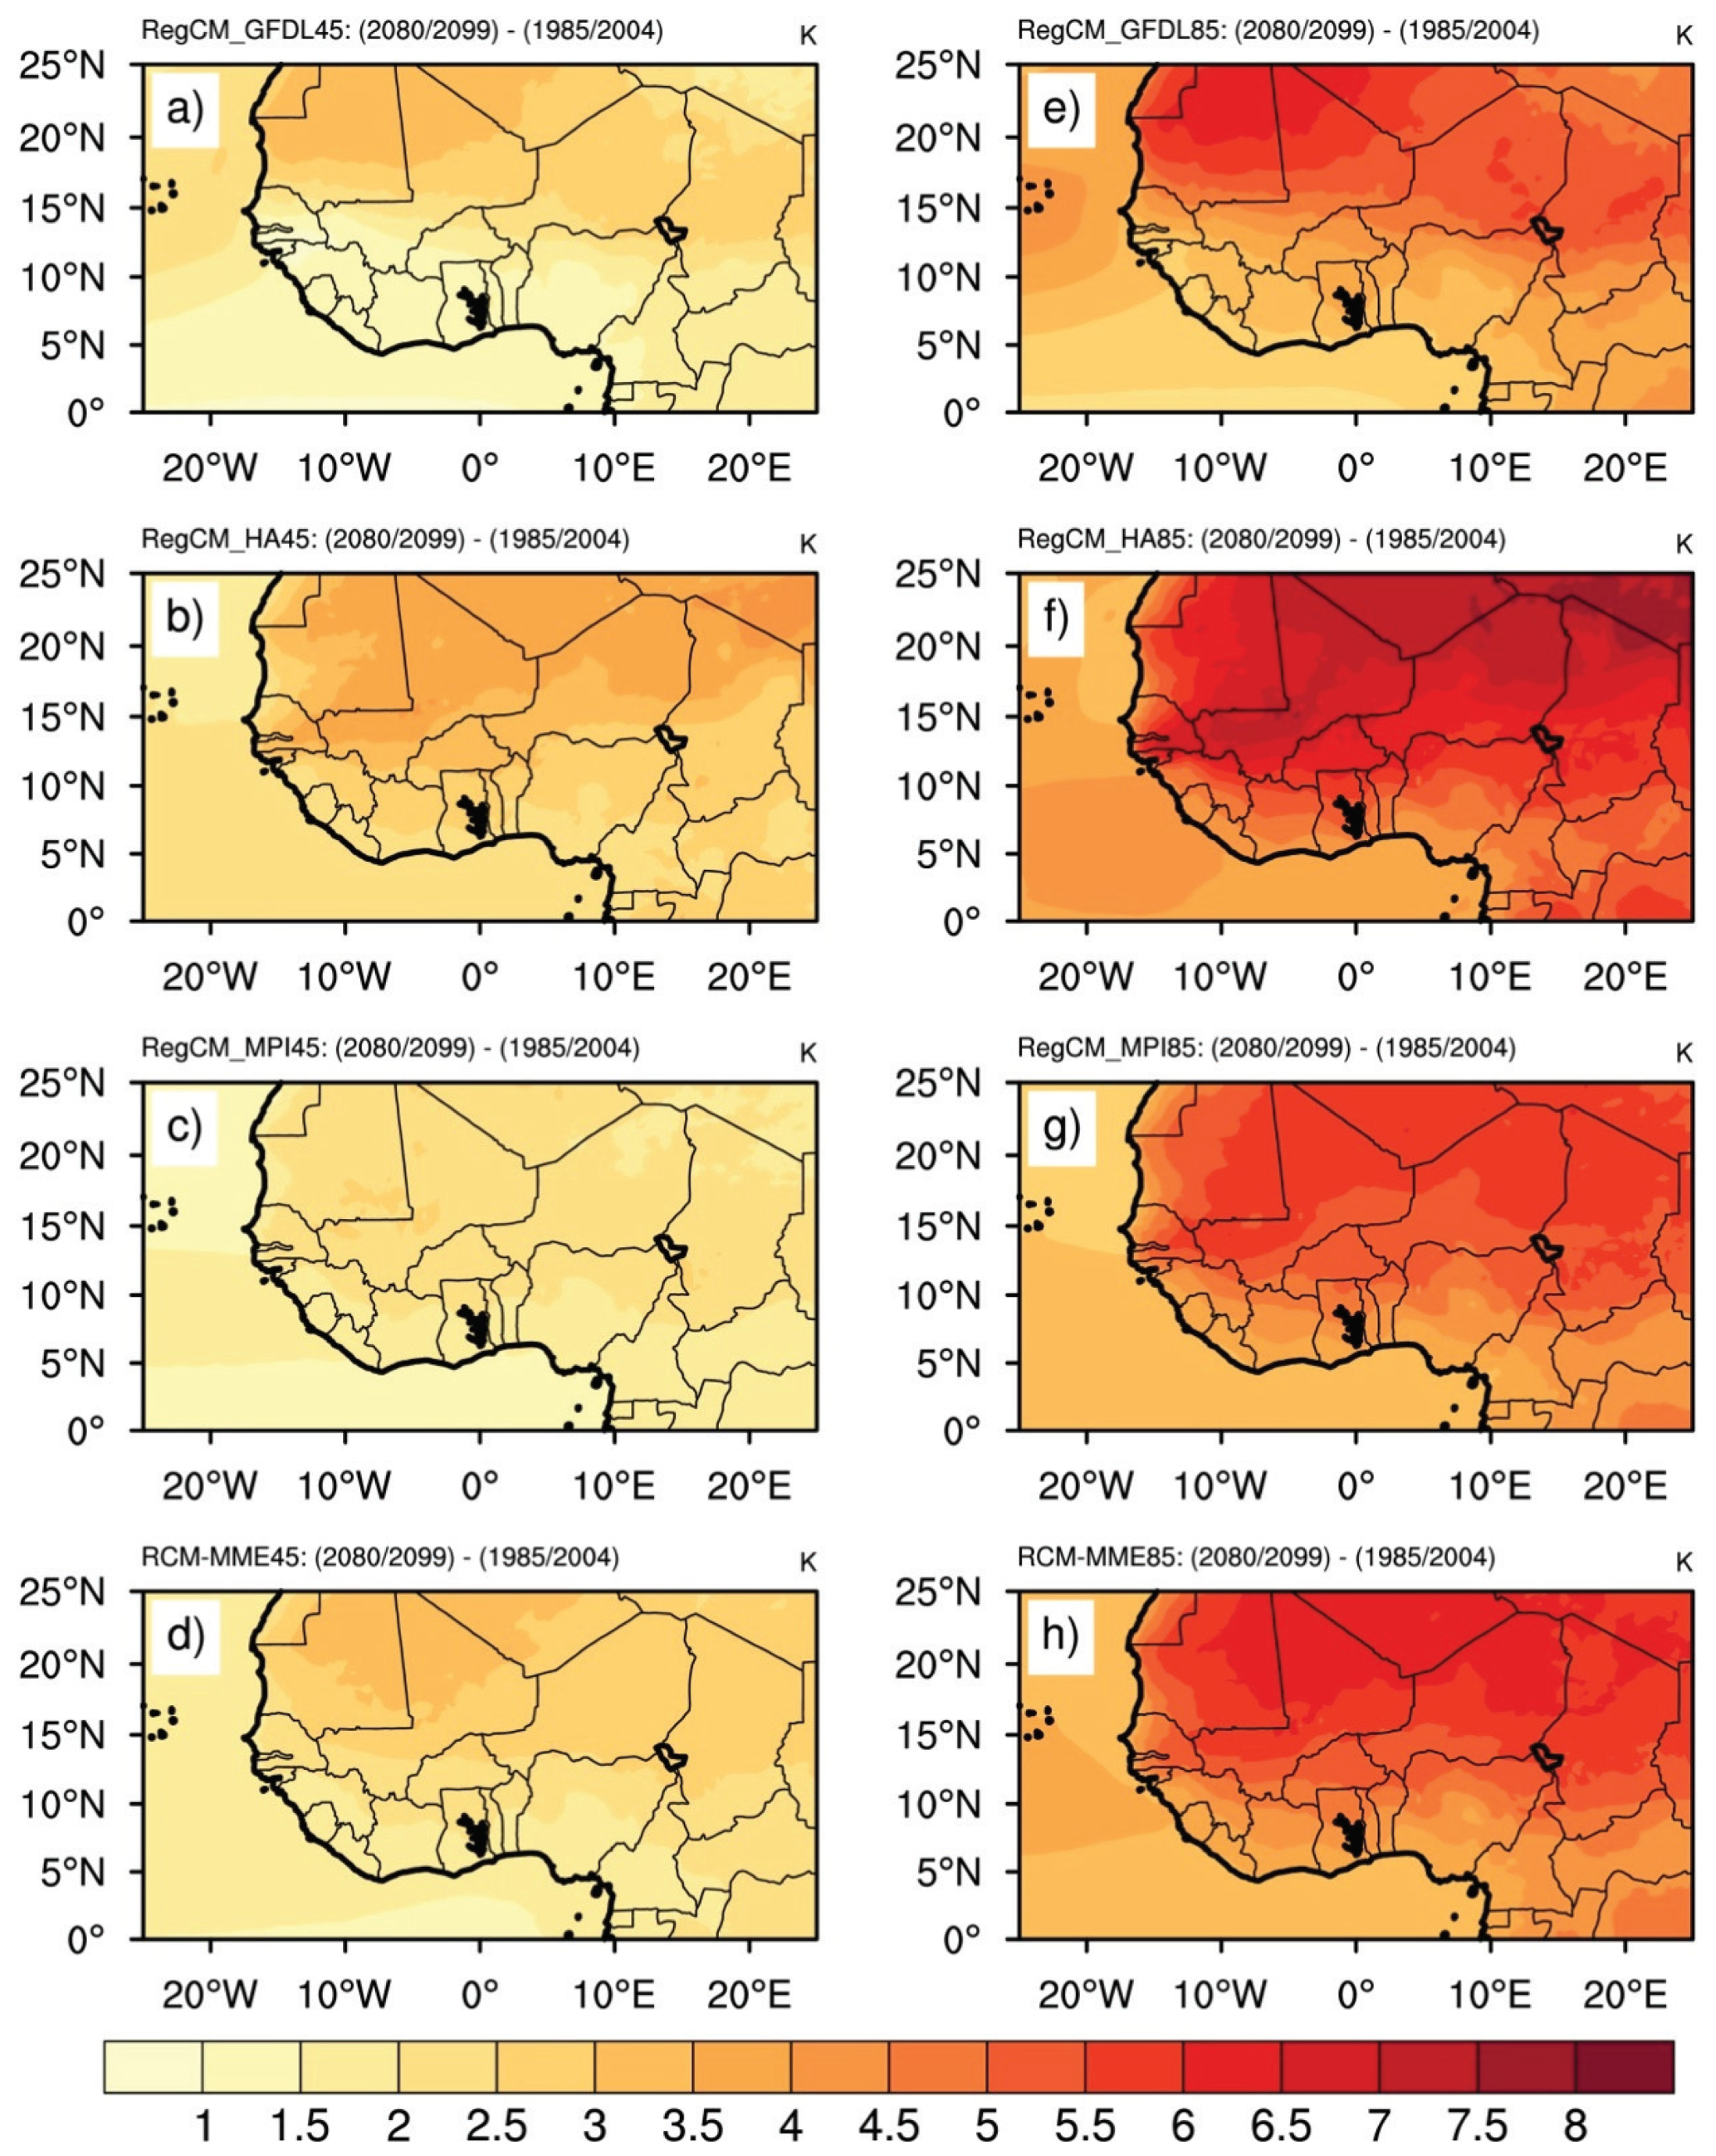
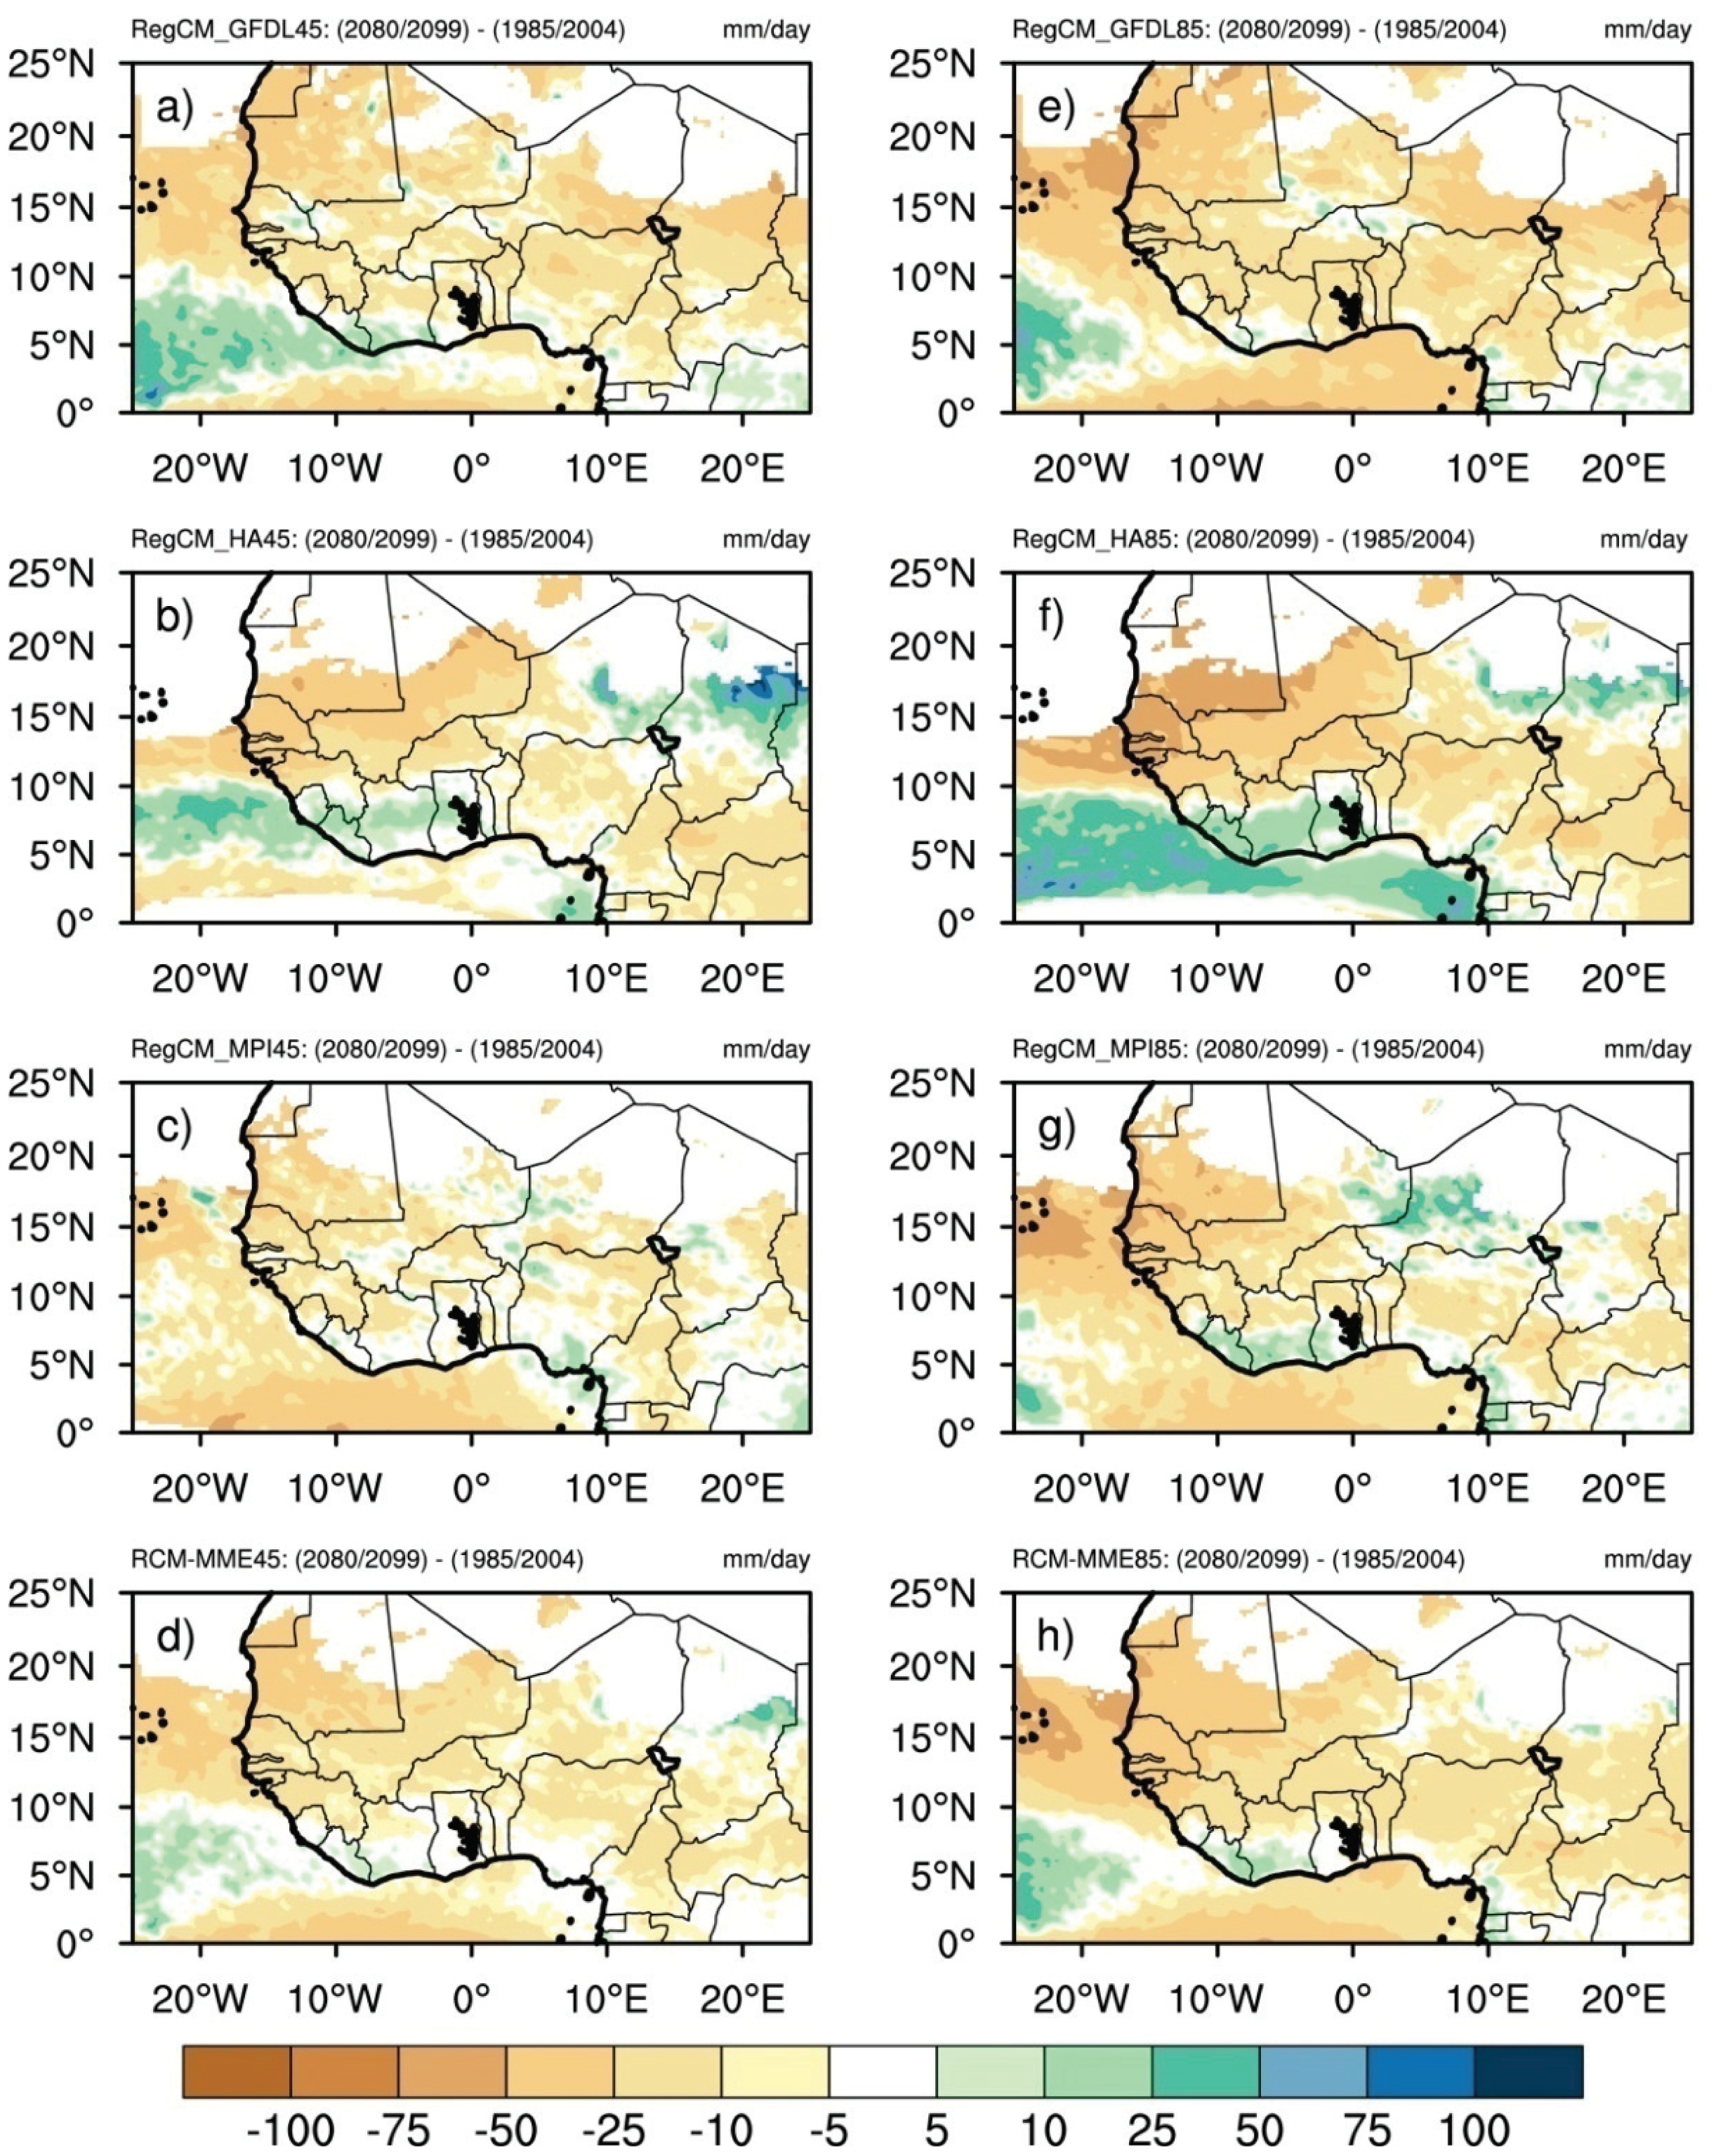
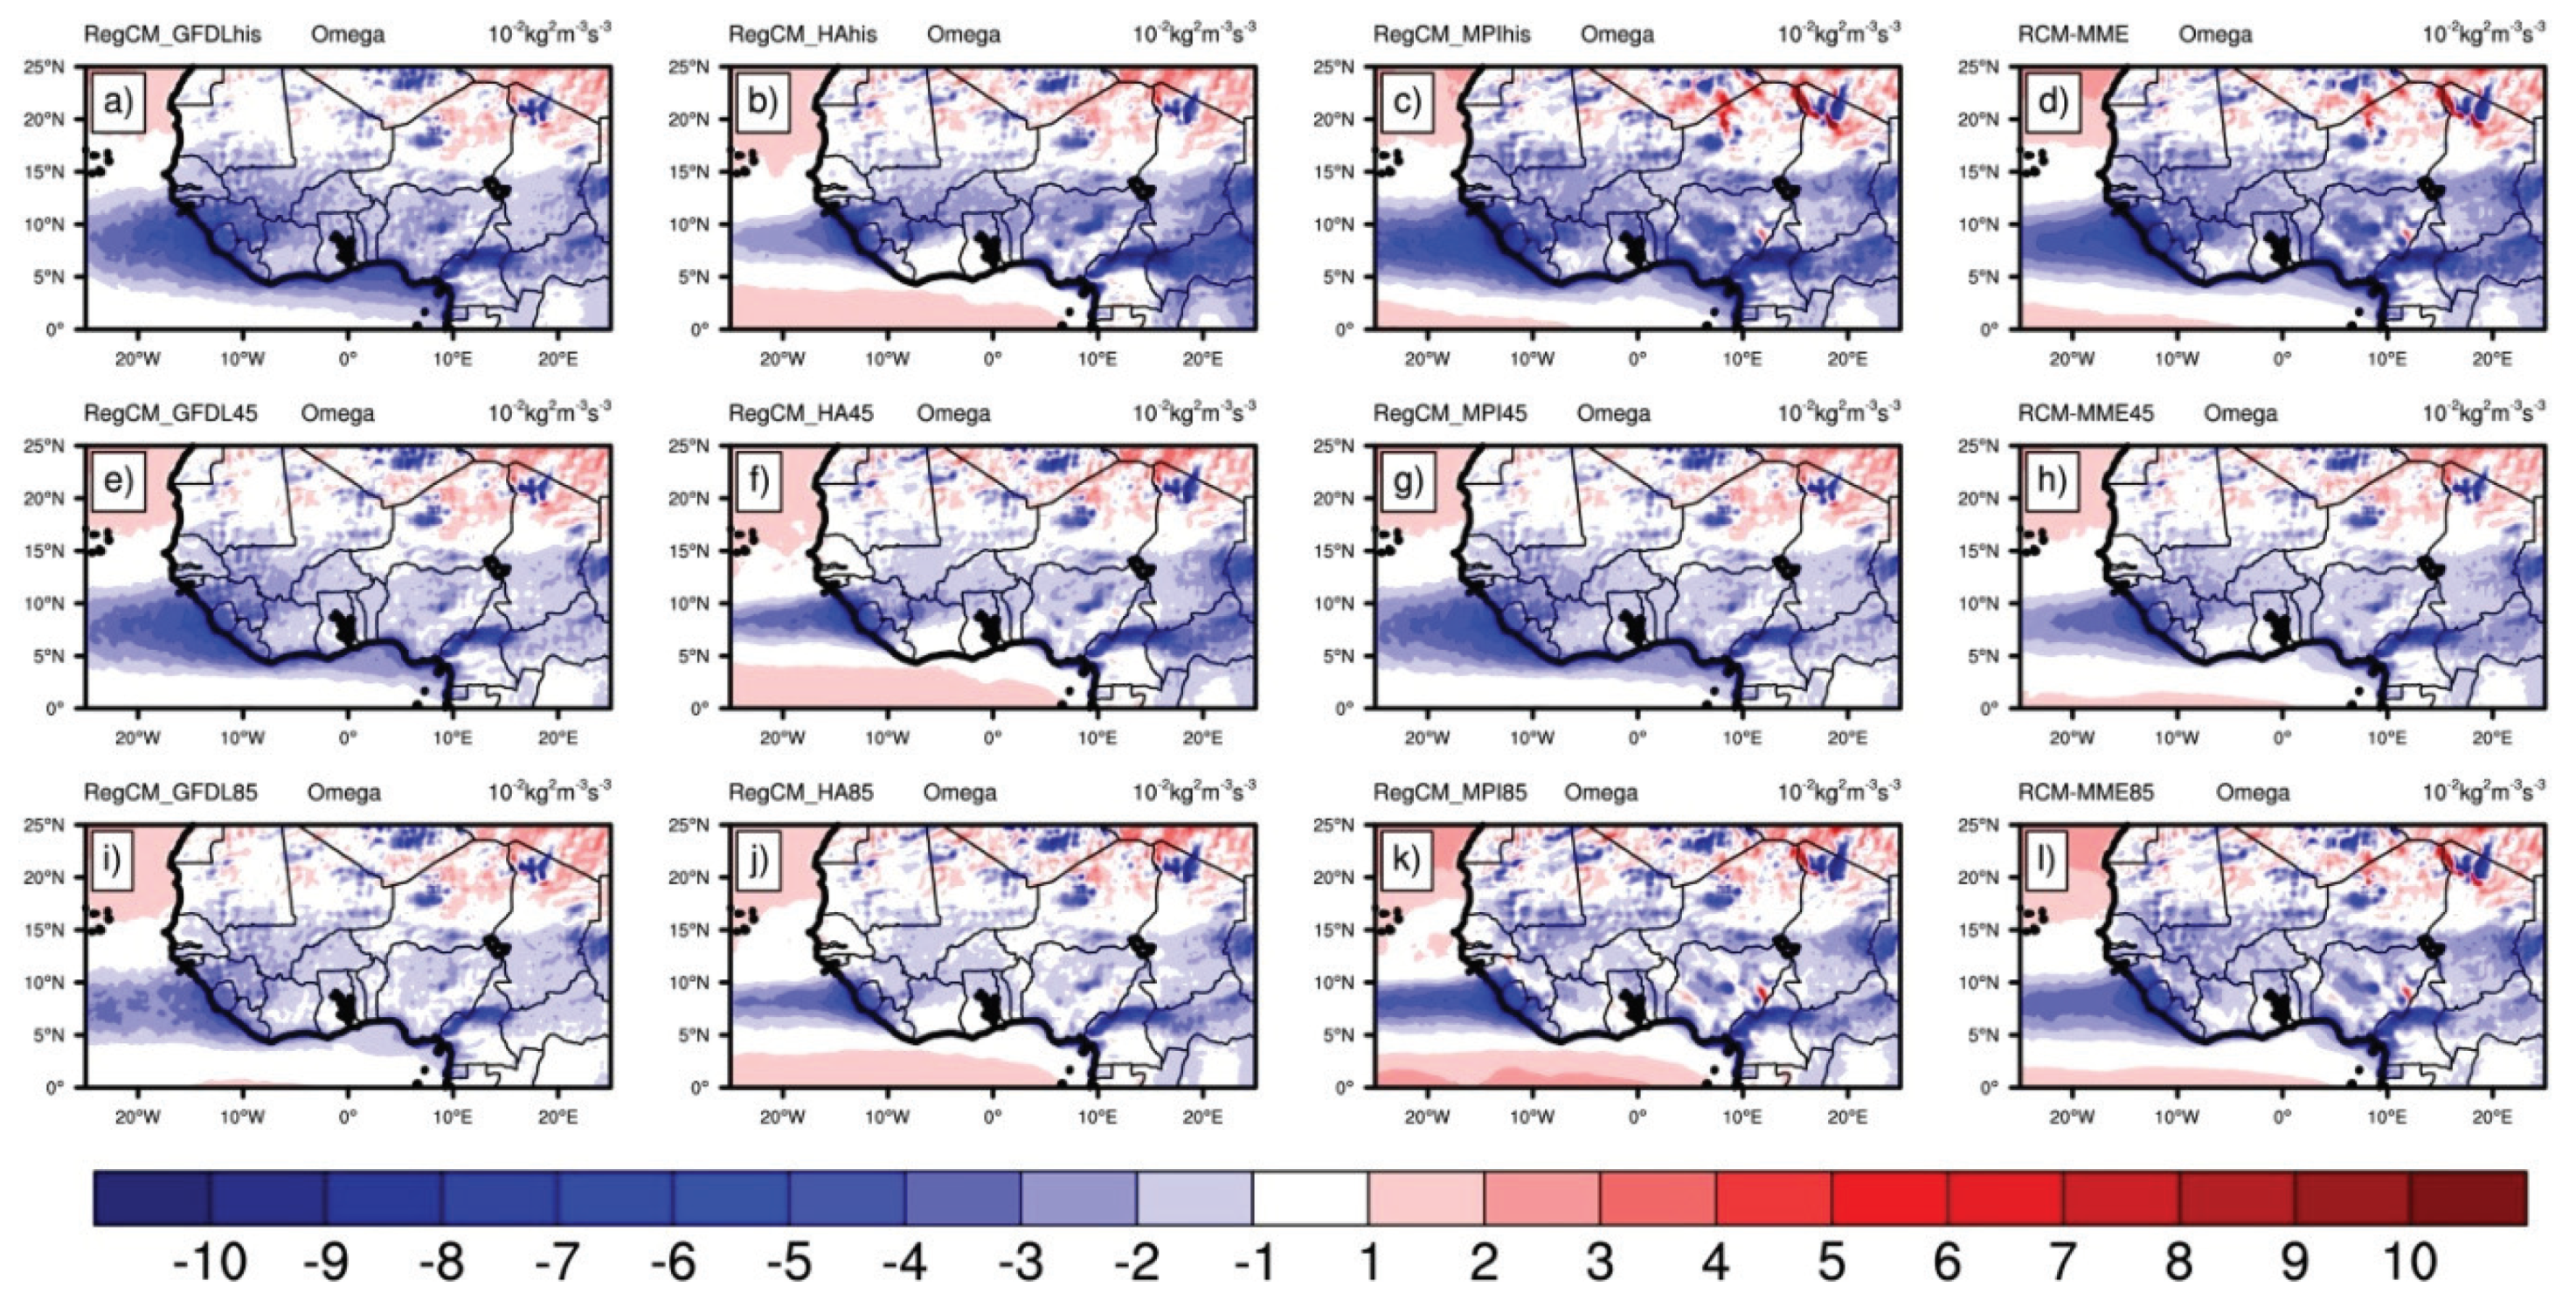
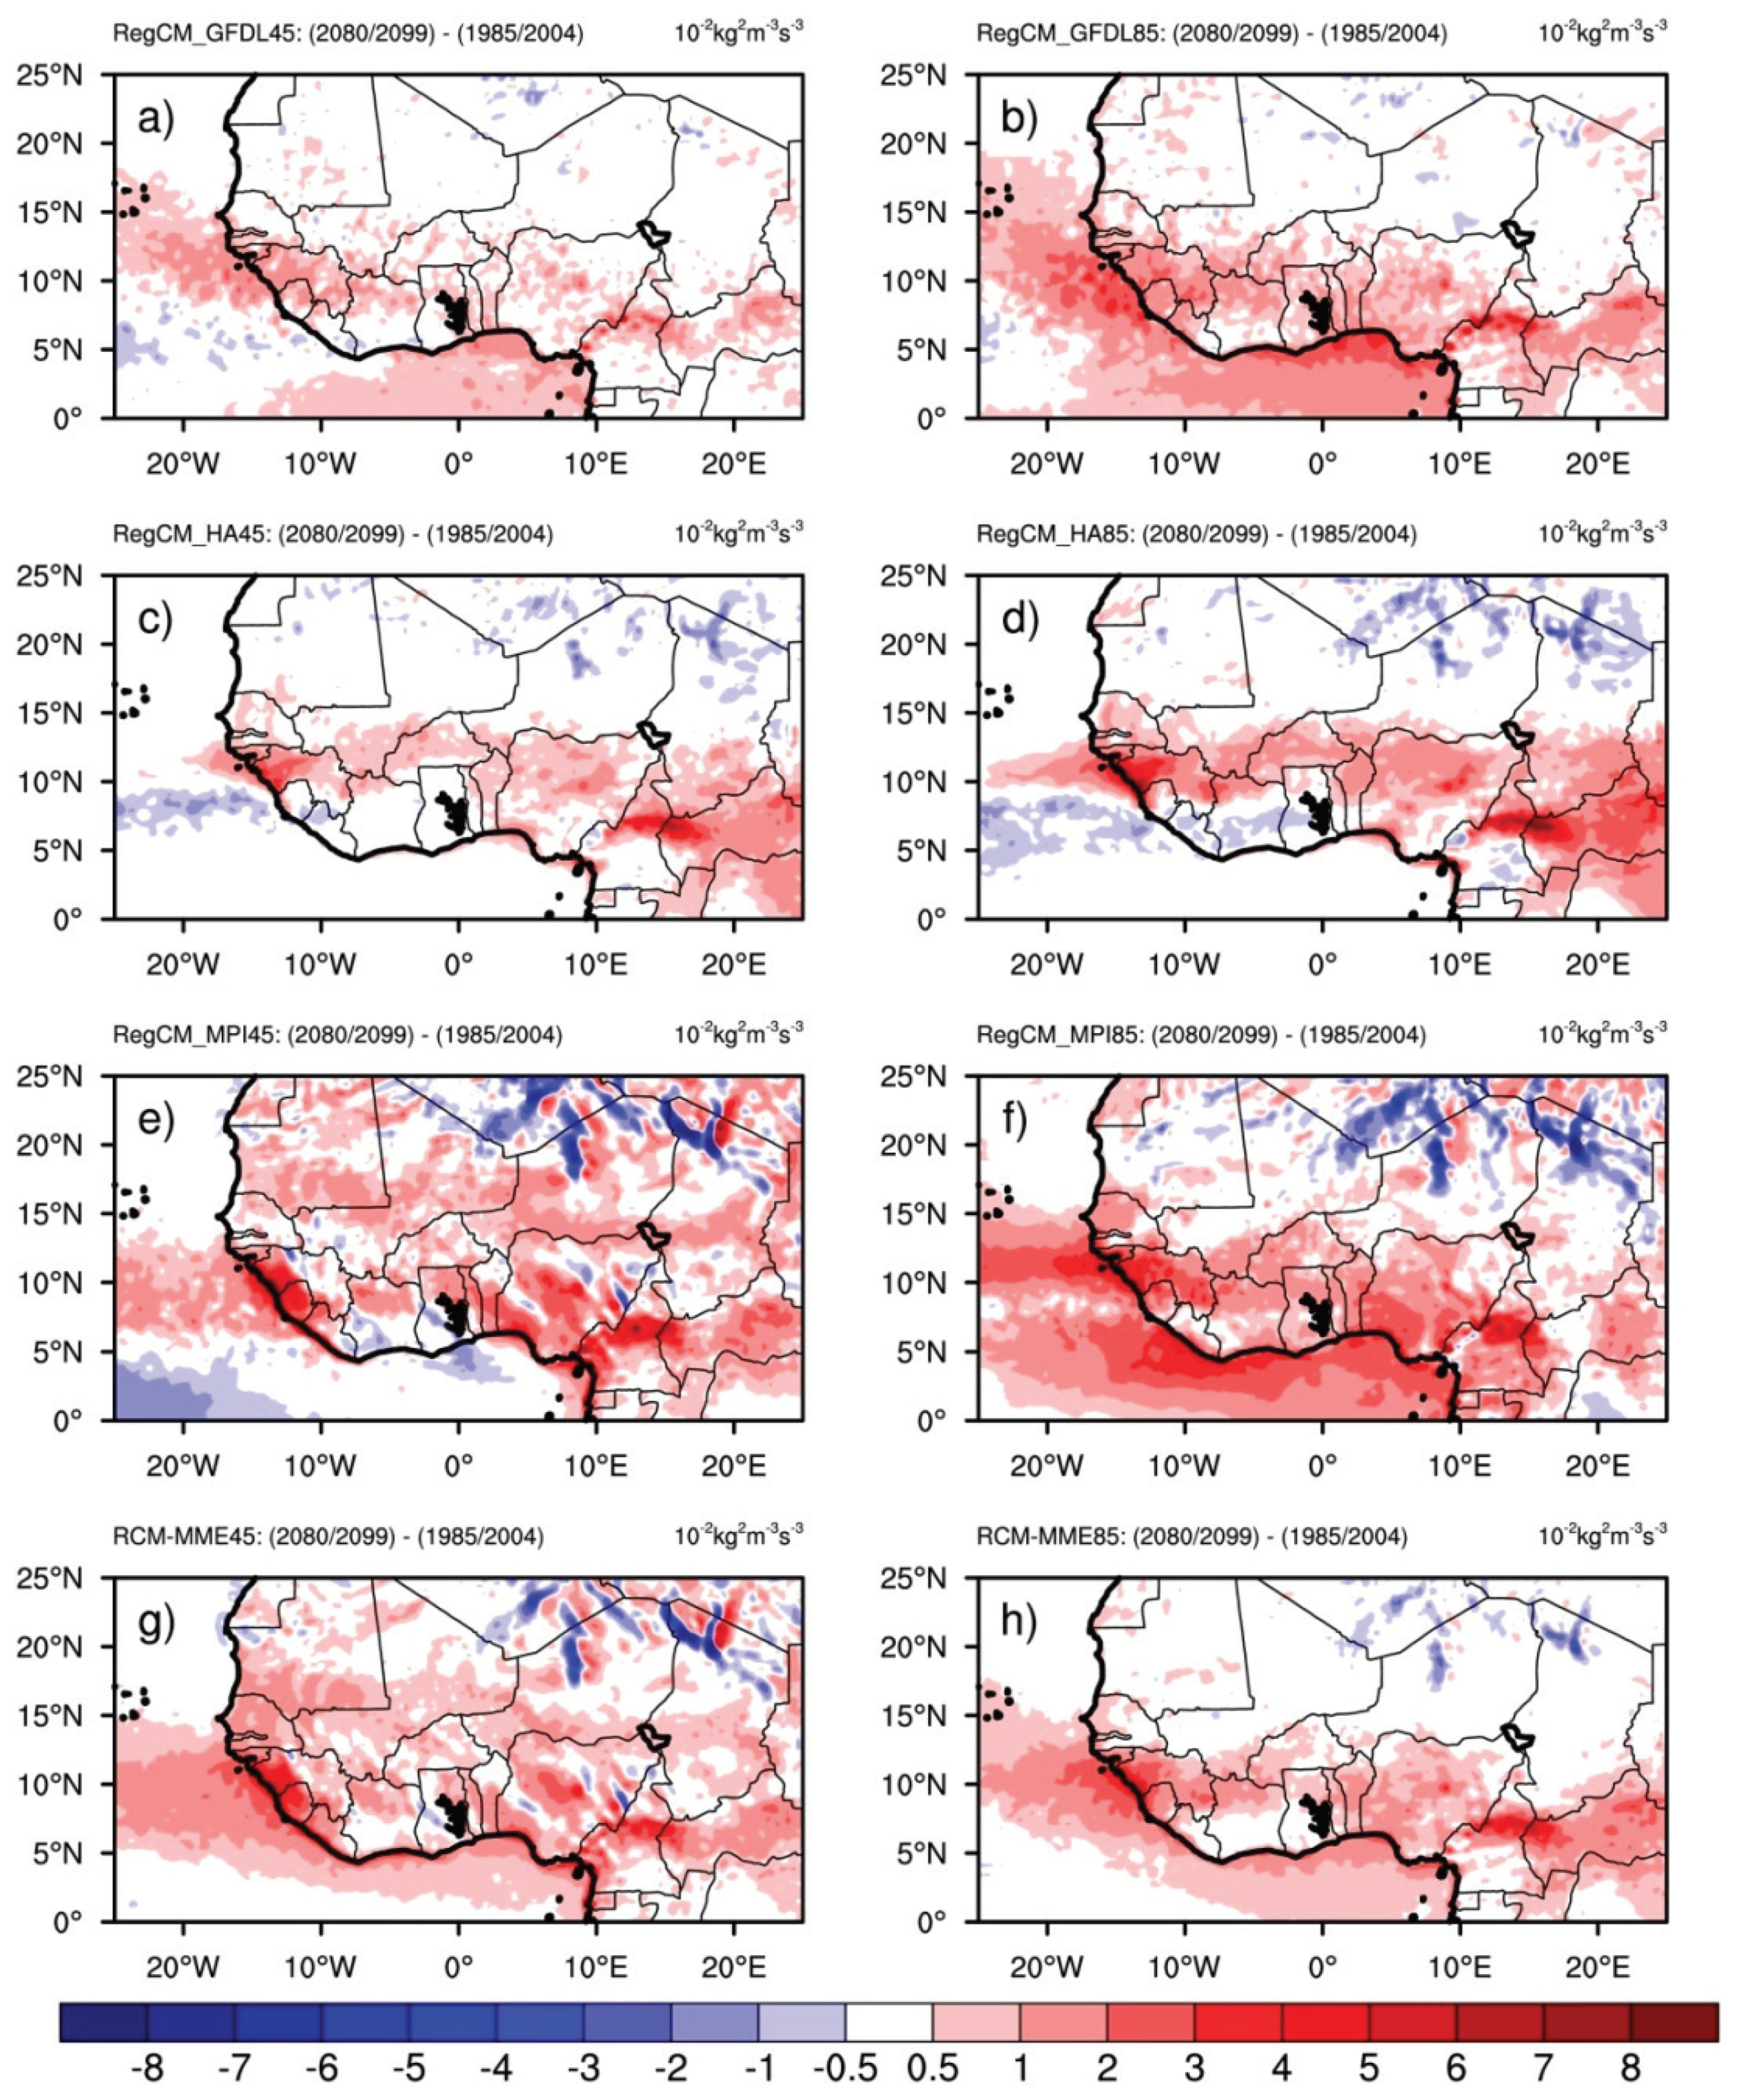
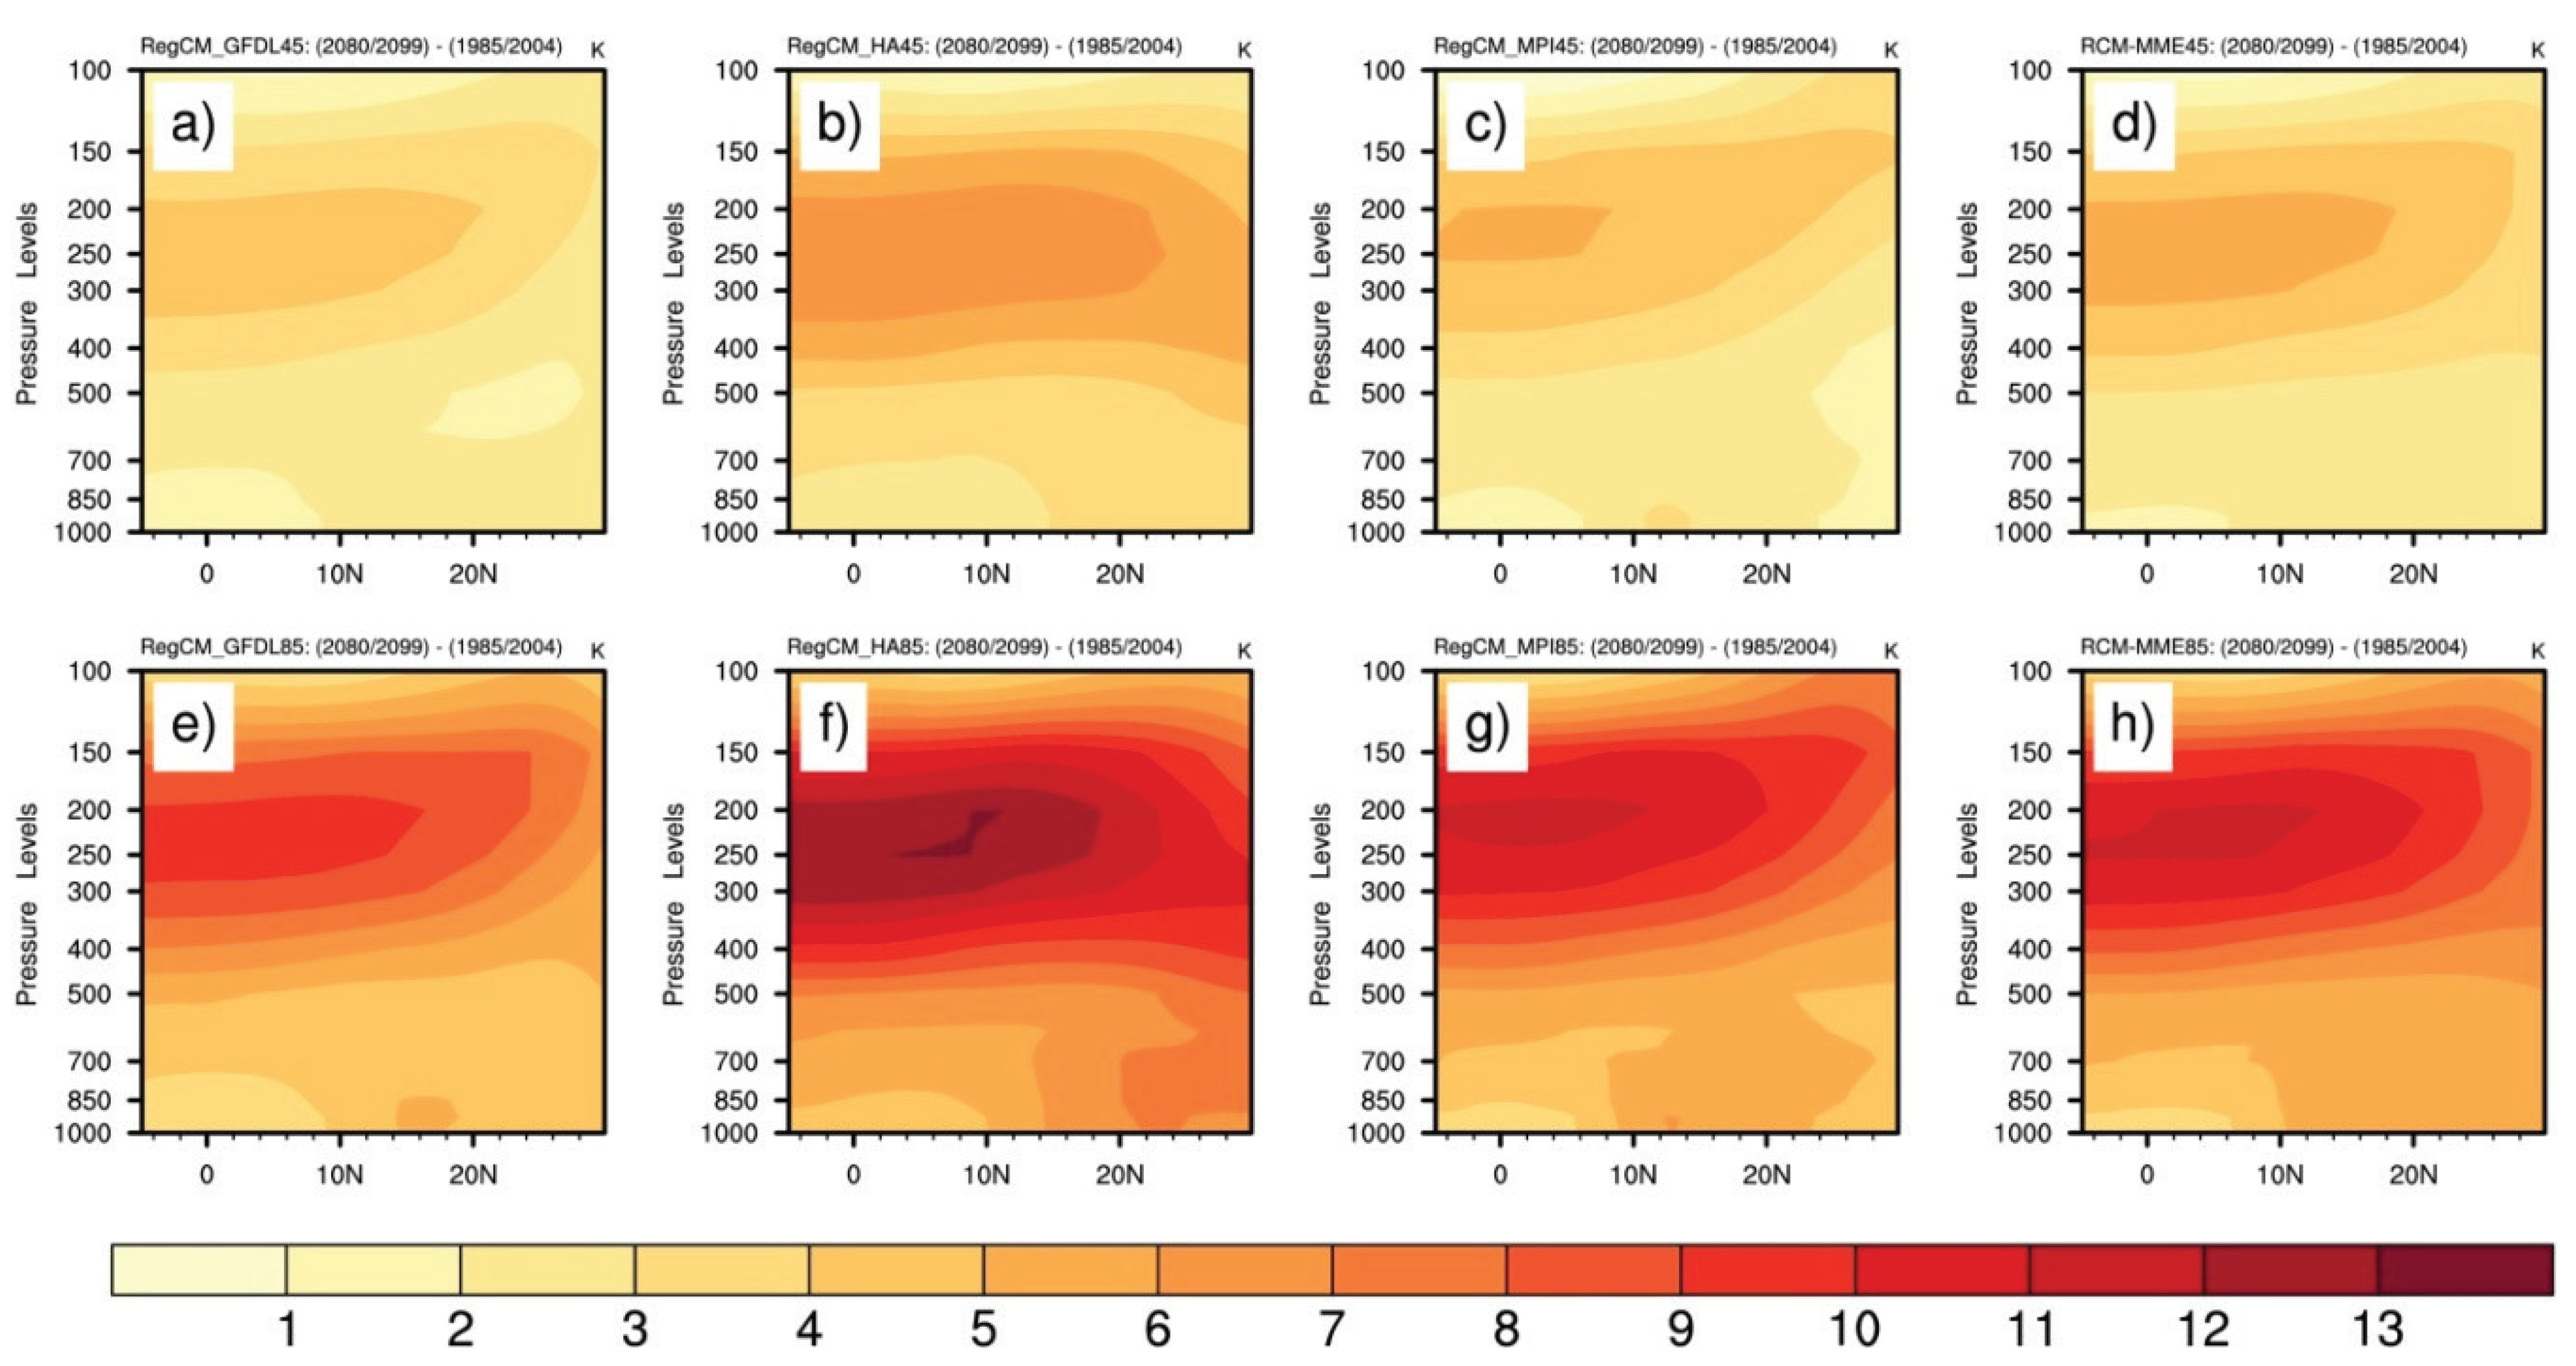
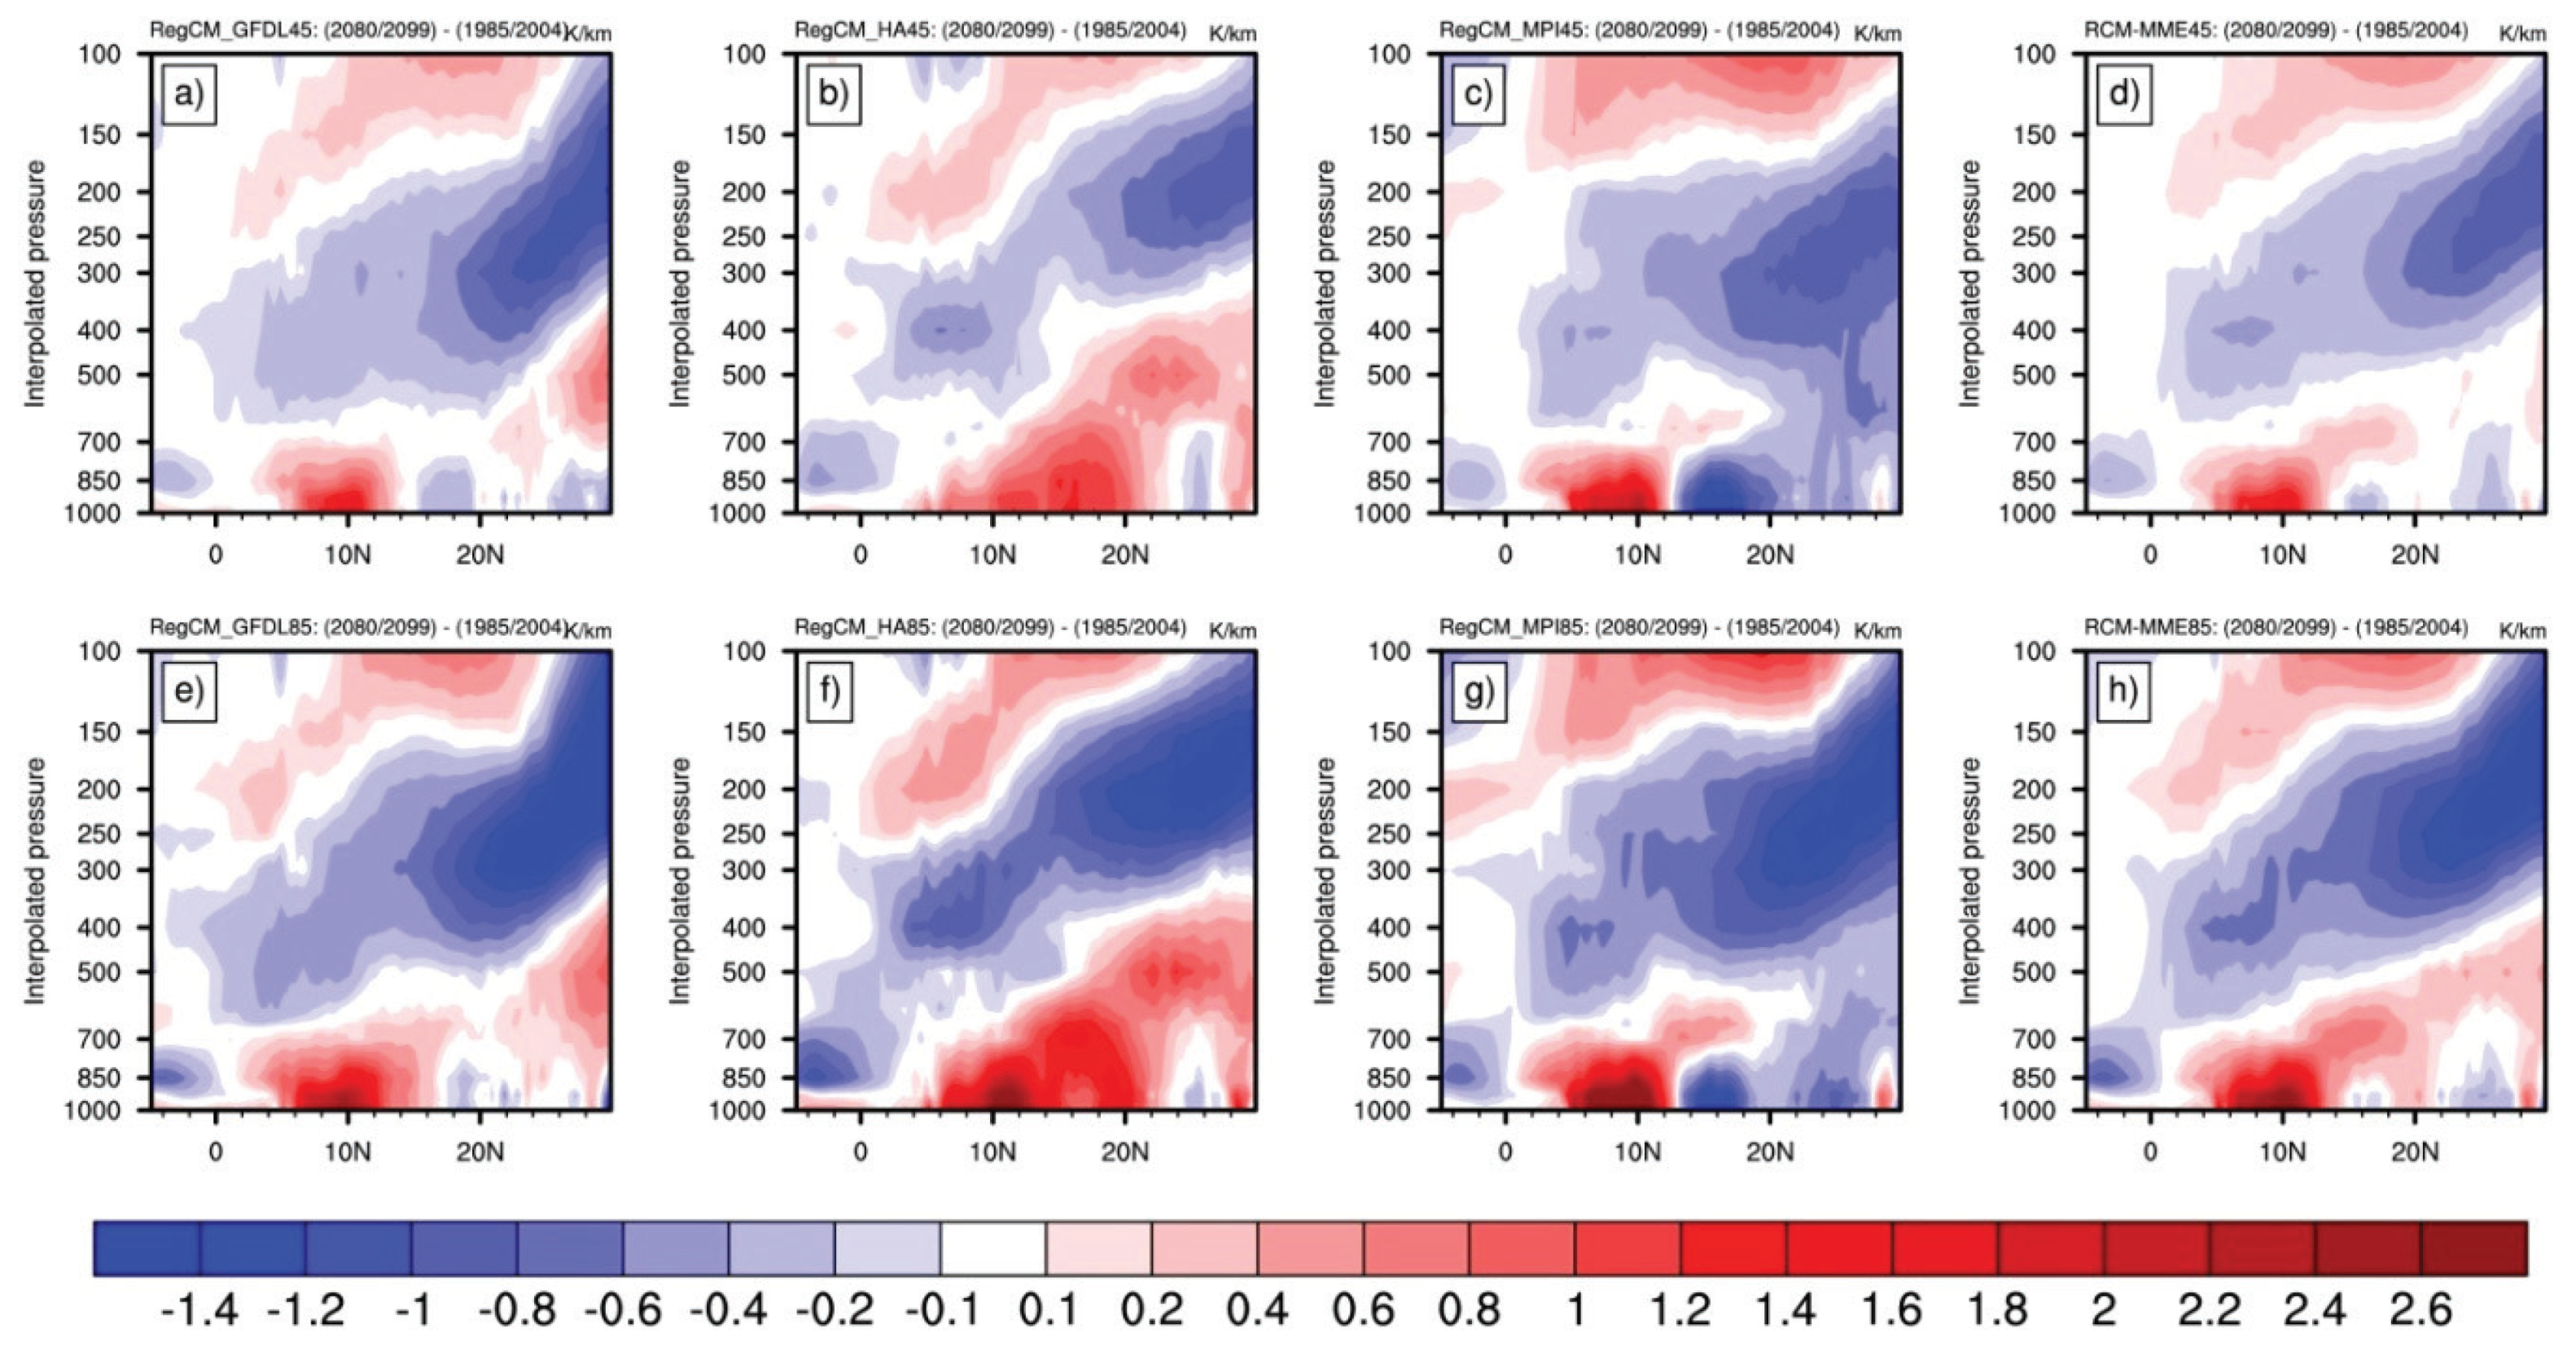
3.1. Mean Changes in Summer Monsoon Climatology of 2m-Temperature, Precipitation, and Vertical Tendency

Figure 2 shows the mean June-July-August-September (JJAS) 2m-temperature (T2m) changes under the RCP4.5 and RCP8.5 scenarios over West Africa from each RegCM4 experiment and their multi-model ensemble mean. All experiments are in good agreement and exhibit large T2m warming (increases) over West Africa. The RegCM4 ensemble means (RCM-MME45 and RCM-MME85) predict more extended surface warming, but with more pronounced increases projected under the RCP8.5 scenario (Figure 2e–h). For example, the warming ranges from 4 to 7°C in RegCM_HA85 (Figure 2f) while in RegCM_HA45 (Figure 2b) the changes are in the range of 2–4°C in the Sahara Desert. Overall under RCP4.5 scenario the T2m changes do not exceed 3 °C in both Sahel and Sahara, while under RCP8.5 the warming could reach 5 °C over the Sahara Desert (see Figure 2f–h). These amplitudes of temperature change are in line with previous studies [58,59,60,61,62], with most intense warming occurring over the Sahel and Sahara, i.e., above 10° N. Increased air temperatures have several consequences for the West African climate over some specific region, particularly in the Sahel-Sahara region. All experiments have in common that T2m increases more in land (continental) areas than in the ocean. These thermal changes therefore alter the basic energy conditions, which in turn will affect large-scale monsoon characteristics in the future.
Figure 3 displays the corresponding precipitation change from different simulations along with their multi-model ensemble mean under the RCP4.5 and RCP8.5 emission scenarios. The projected changes in rainfall distributions over northern Africa indicate high uncertainty compared to the consistent projected T2m warming. The RCP8.5 provides the most substantial changes in precipitation over West Africa. A reduction of precipitation develops during the summer months, i.e., JJAS and extends into most of the West African regions particularly over the West Sahel and Savanna region. All simulations agreed that there is more than a 25% decrease in precipitation, with stronger drier conditions over the Western Sahel (Senegal and neighboring areas) in the late future. This may likely be due to the extended surface warming projected in this region, which leads to drier soils (lower evaporative cooling and cloudiness) [38,61]. RegCM_MPI45 and RCM-MME45 show no significant changes over the Guinea Coast under RCP4.5 (Figure 3b,d). However under RCP8.5 (Figure 3e–h) both RegCM_HA85 and RegCM_MPI85 project a modest precipitation increase in the range of 10% over the Guinea coast (between 5°–10° N, 12° W–Equator) and 20% in East Sahel (between 15°–20° N, 10°–25° E). The results of the projected changes under RCP8.5 in JJAS summer monsoon rainfall are in agreement with the studies of Hulme et al. [63], Monerie et al. [64], Akinsanola et al. [65], and Diedhiou et al. [66], who also individually have reported that the WAM region will experience a slight increase in mean precipitation in the future over the Guinea coast, while the western Sahel, particularly Senegal and Mali, is likely to experience drier conditions.
To explain why most of West Africa undergoes a negative rainfall change in future climate, we show in Figure 4 the mean vertical velocity designating vertical motion in the atmosphere integrated between 850 and 300 hPa for the historical period (upper), the late 21st century under RCP4.5 (middle) and RCP85 (bottom) from both the individual members and their ensemble mean. Note negative (positive) values of vertical velocity correspond to upward (downward) motion. Nearly, all models simulate accurately a zonal band of upward vertical motion associated with the Inter-Tropical Convergence Zone (ITCZ) near 10° N, where most of the convective systems occur. In all experiments, RegCM4 simulated a stronger core above the mountainous regions such as Guinea Highlands, Jos Plateau, and Cameroon. Likewise, despite using different driving ESM, in all simulations the RegCM4 simulates largest deep convection over the top of mountains where higher precipitation amount and lower T2m are simulated. This proves again the skill of RegCM4 to simulate accurately the fine scale features over regions with complex topography.
The atmospheric vertical motion mostly decreases under the RCP4.5 and RCP8.5 scenarios leading to a reduction in the late future over most of West African regions (Figure 5). Figure 5 shows that the descending motion prevails between the Sahara and the equator, with the largest downward motion projected over complex terrain, where the maximum values were found. Overall, the future changes in vertical velocity indicate a possible alteration and weakening in the overall convection, which are consistent with the projected summer monsoon precipitation weakening over the region, specifically west of Sahel and Savanna region.
Figure 6 displays the latitude–height cross sections of projected changes in potential temperature averaged between 10°E and 20°W under the RCP4.5 (Figure 6a–d) and the RCP8.5 (Figure 6e–h). All simulations display a similar and clear increase in potential temperature with height. These changes are more pronounced under the RCP8.5 than RCP4.5, which may likely be a result of the T2m distribution discussed earlier. Note, the near surface maximum ranging from 4 to 5 °C is located around 10° N, while over the Sahel region; it exceeds 6 °C, especially under the RCP8.5 (Figure 6e–h). However, under the RCP4.5 scenario, the warming is ranging between 1–2 °C, and 2–3 °C, over the Guinea Coast, and north of 10° N, respectively (Figure 6a–d). All experiments exhibit the largest increase in potential temperature in the upper levels of the troposphere (≈200–300hPa). Indeed, such warming considerably decreases the instabilities and in turn induces a weakened vertical motion as previously shown in Figure 5. Consequently, the upper level warming can likely enhance the mid-tropospheric anticyclonic circulation and large-scale subsidence, thus resulting in reduction of precipitation in the late 21st century. Overall, all these changes are consistent with the projected dry conditions over West Africa, particularity over the Sahel. To investigate the relationship between this negative change in precipitation regime and the large-scale WAM features, we next explore changes in AEJ and AEWs dynamics and their interaction with precipitation.

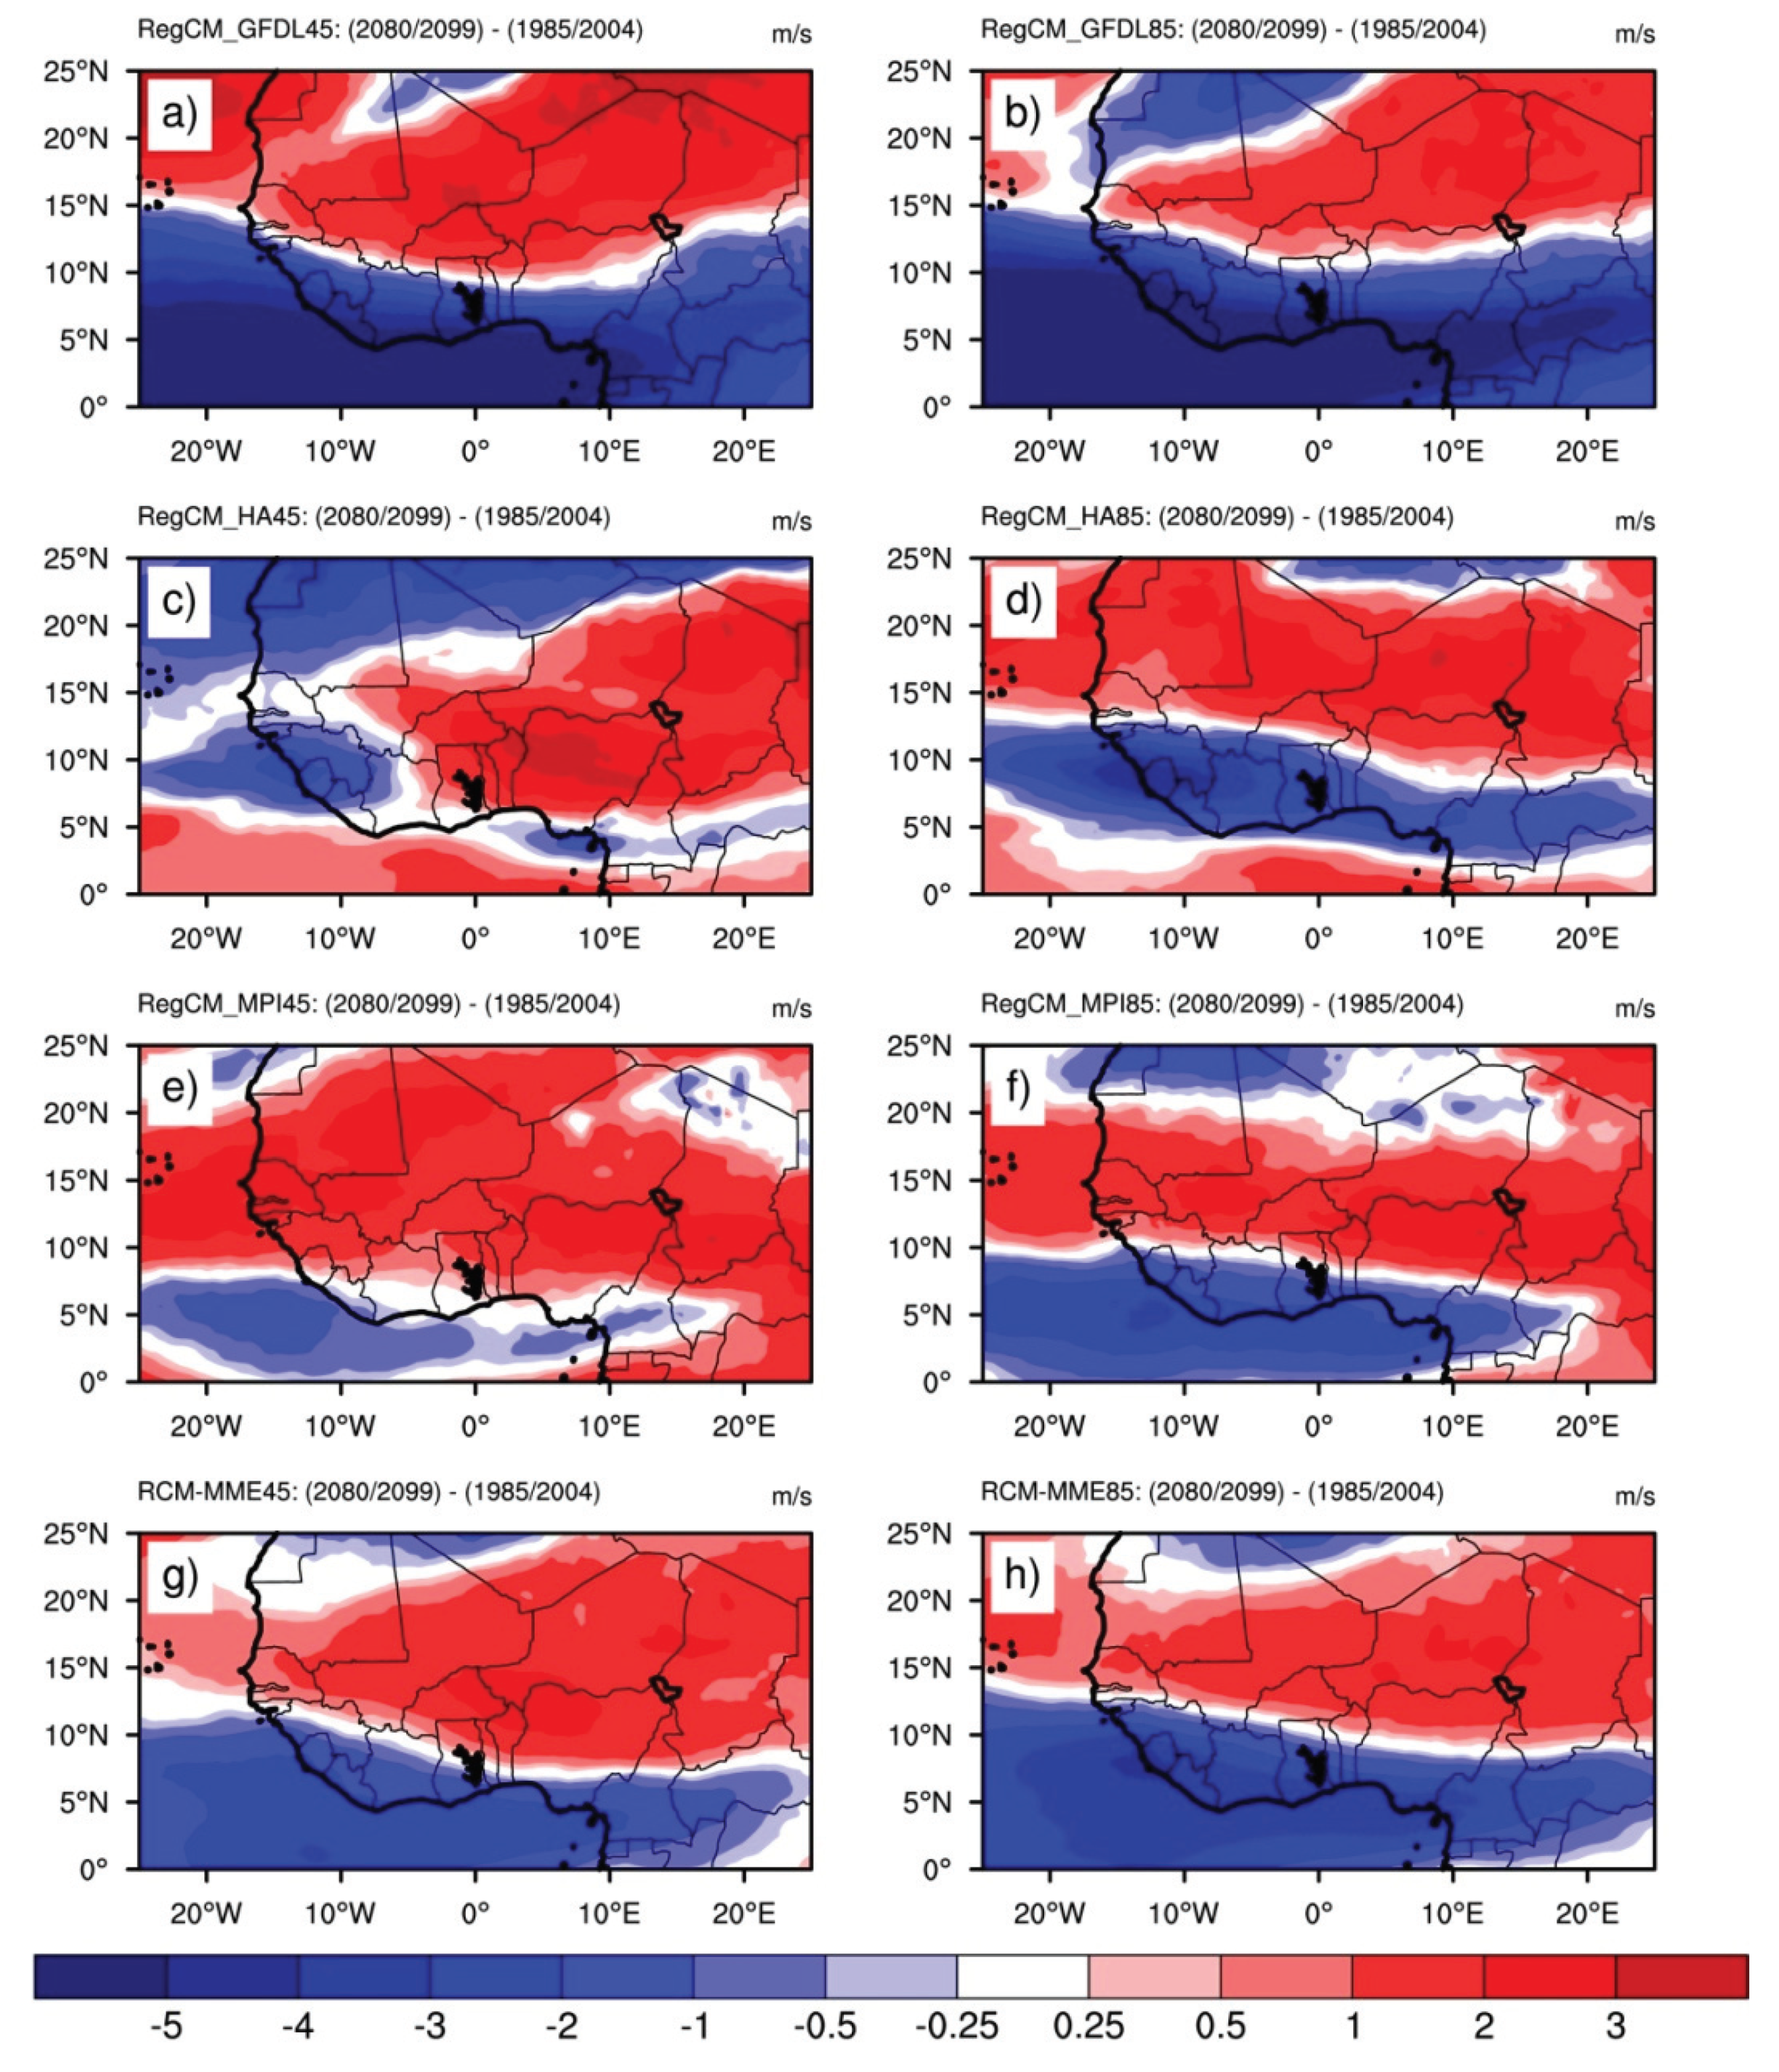
3.2. Projected Changes in Atmospheric Circulation Features

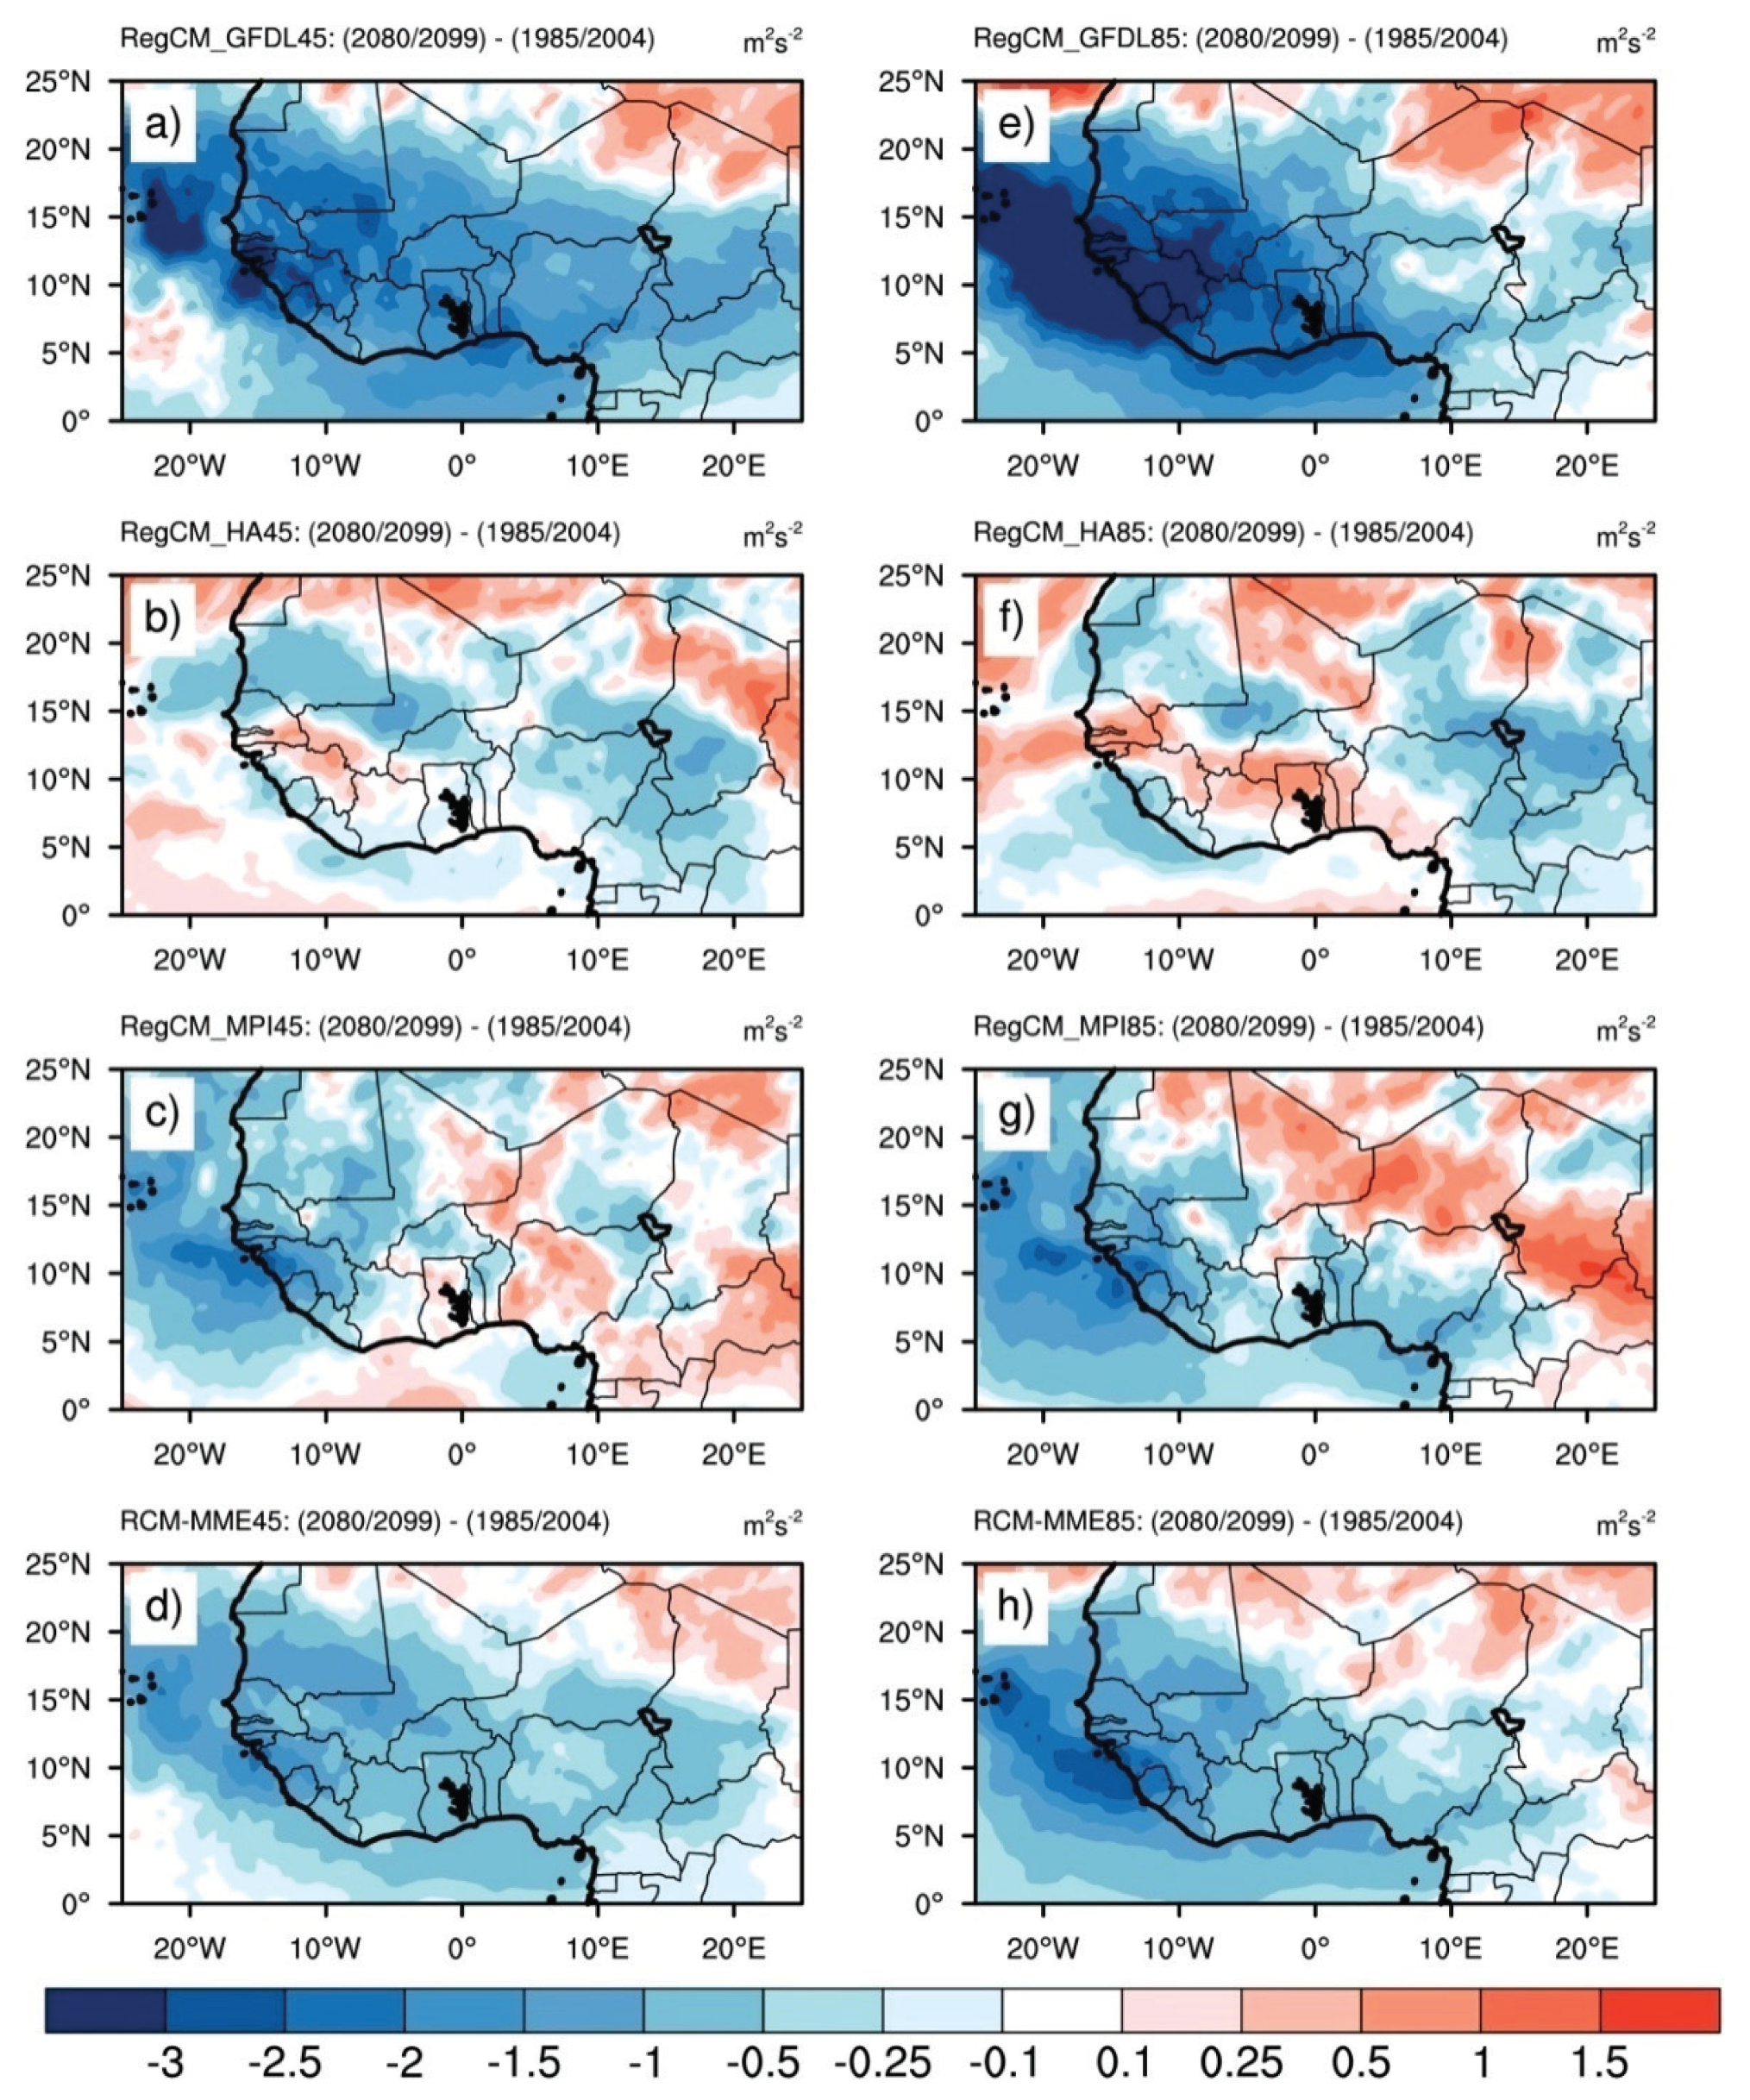
3.2.1. Mean Changes in African Easterly Jet

In this section, we focus on the projected changes of the AEJ in terms of position and strength through the simulation of meridional temperature gradients. The surface temperature gradient plays a major role in the genesis and maintenance of the AEJ in the lower and middle troposphere. For instance, the strength of the AEJ depends strongly on the position and intensity of meridional temperature gradient [2,4,67,68]. As seen previously, the weakening of the vertical motion and the increase of potential temperature in the upper level induce a redistribution of heat, which likely affects the AEJ structure. Figure 7 displays the latitude–height cross sections of projected changes in meridional temperature gradient averaged between 10°E and 20°W under theRCP4.5 (Figure 7a–d) and the RCP8.5 (Figure 7e–h) scenarios.
In general, the RegCM4 simulations and their ensemble means show a core of maximum positive meridional temperature gradient below 700 hPa and centered toward 10° N. The temperature gradient decreases with height from the surface into the free atmosphere while negative temperature gradients are located above 300hPa. The RCP8.5 simulations exhibit a positive meridional temperature gradient from the surface to the mid troposphere (650 hPa) with the maximum centered below 10° N in some model simulations. However, we note a negative temperature gradient over the Sahara, extending from the surface to the upper tropospheric levels. For example, the RegCM_HA85 located the maximum between 10° N and 12° N, while this maximum is located below 10° N in RegCM_GFDL85, RegCM_MPI85, and RCM-MME. Under the RCP4.5, the experiments show a similar spatial pattern distribution, but the maximum meridional temperature gradient core is much weaker. The observed changes in meridional temperature gradient are likely going to affect the zonal atmospheric circulation pattern through the thermal wind relationship [2,8,67,68], which in turn impacts both the position and strength of the AEJ.
The easterly anomaly may be due to the change in positive meridional temperature gradient resulting from the low-level warming and surface baroclinicity. Overall, the different model experiments produce substantially different projections of the AEJ core strength and location (Figure 8). However, all projections show a quite consistent structure with negative values below 10°N and positive values above it. In the RCP4.5 experiment, the contrast is more pronounced than the RCP8.5 simulation which leads to a southward shift of the AEJ core. This shift is sharper in the RCP8.5 than in the RCP4.5. We therefore concluded that when the warming is stronger, the AEJ core tends to move southward. For instance, in both scenarios, the RegCM4 driven by GFDL exhibits a stronger AEJ. On the other hand, when driven either by HadGEM or MPI, a much better AEJ shift is projected. Therefore, the results indicate that in the late 21st century the AEJ exhibits a possible strengthening and a southward shift toward the Guinea coast under both the RCP4.5 and the RCP8.5 scenarios. This is consistent with their simulations of near surface temperature gradient and baroclinicity as discussed above. It is worth mentioning that the RCM-MME (Figure 8h) positions the AEJ core around 8°N over the ocean while the RegCM_MPI45 (Figure 8e) locates the Jet position below 7°N. These are probably due to the position of the meridional temperature gradient and the weak baroclinicity. The observed AEJ induces cyclonic shear to its south [68], while the southward migration of AEJ displaces the rainbelt toward south, thus reducing the rainfall over the Sahel. We conclude that the rainfall decreases under warmer climate found over West Africa, especially, Sahel is a consequence of projected positive temperature gradient in the lower level, which induces a strengthening and a southward shift of the AEJ.
To examine how strong the coupling between the precipitation and the AEJ is, we show in Figure 9 the covariance between the zonal wind at 650hPa and precipitation for the historical period and both RCP4.5 and RCP8.5 scenarios. For the present climate, we first notice that negative covariance coefficients prevail in almost all the West African domain. Since the zonal wind at 650 hPa is negative, this indicates that the AEJ and the precipitation are strongly connected. In fact, the presence of small areas with positive covariance coefficients suggests that the AEJ is not the only large-scale feature controlling precipitation over West Africa. In future climate, the relationship between AEJ and precipitation has decreased (but not suppressed) probably because of the southward displacement of its core to the lower latitudes. Therefore, the warming weakens the interactions between the AEJ and the precipitation over West Africa. This is a clear indication that other monsoon features such as the AEWs play a key role in the WAM precipitation variability and its potential change under global warming.

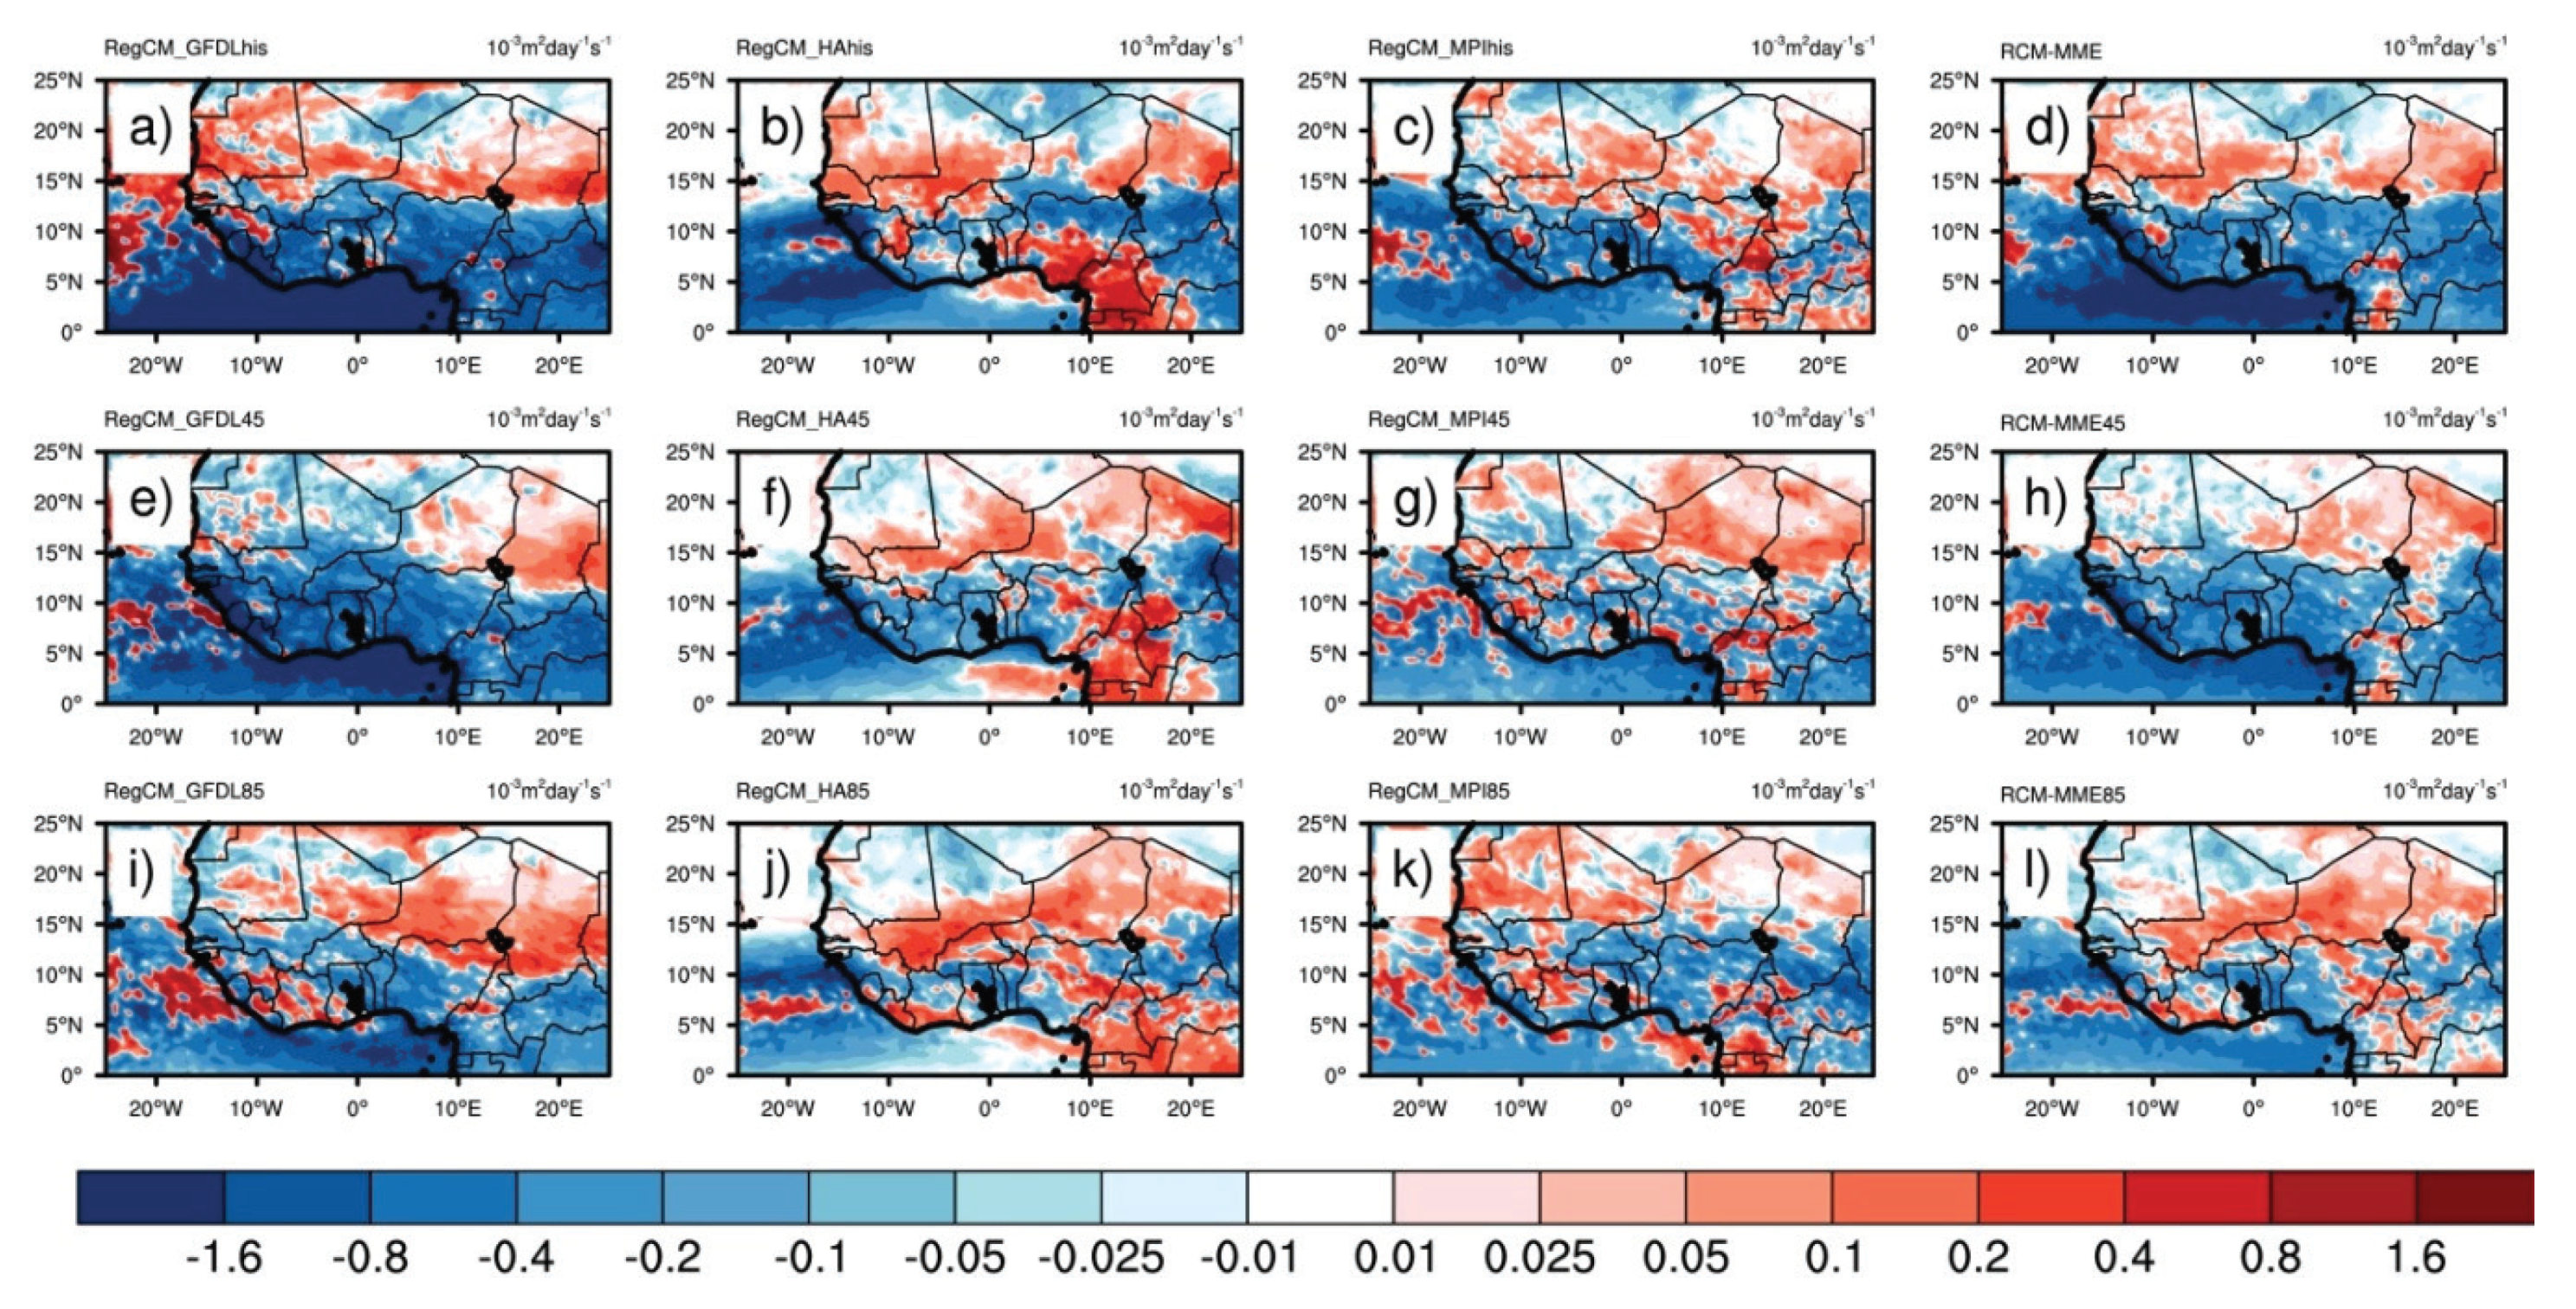
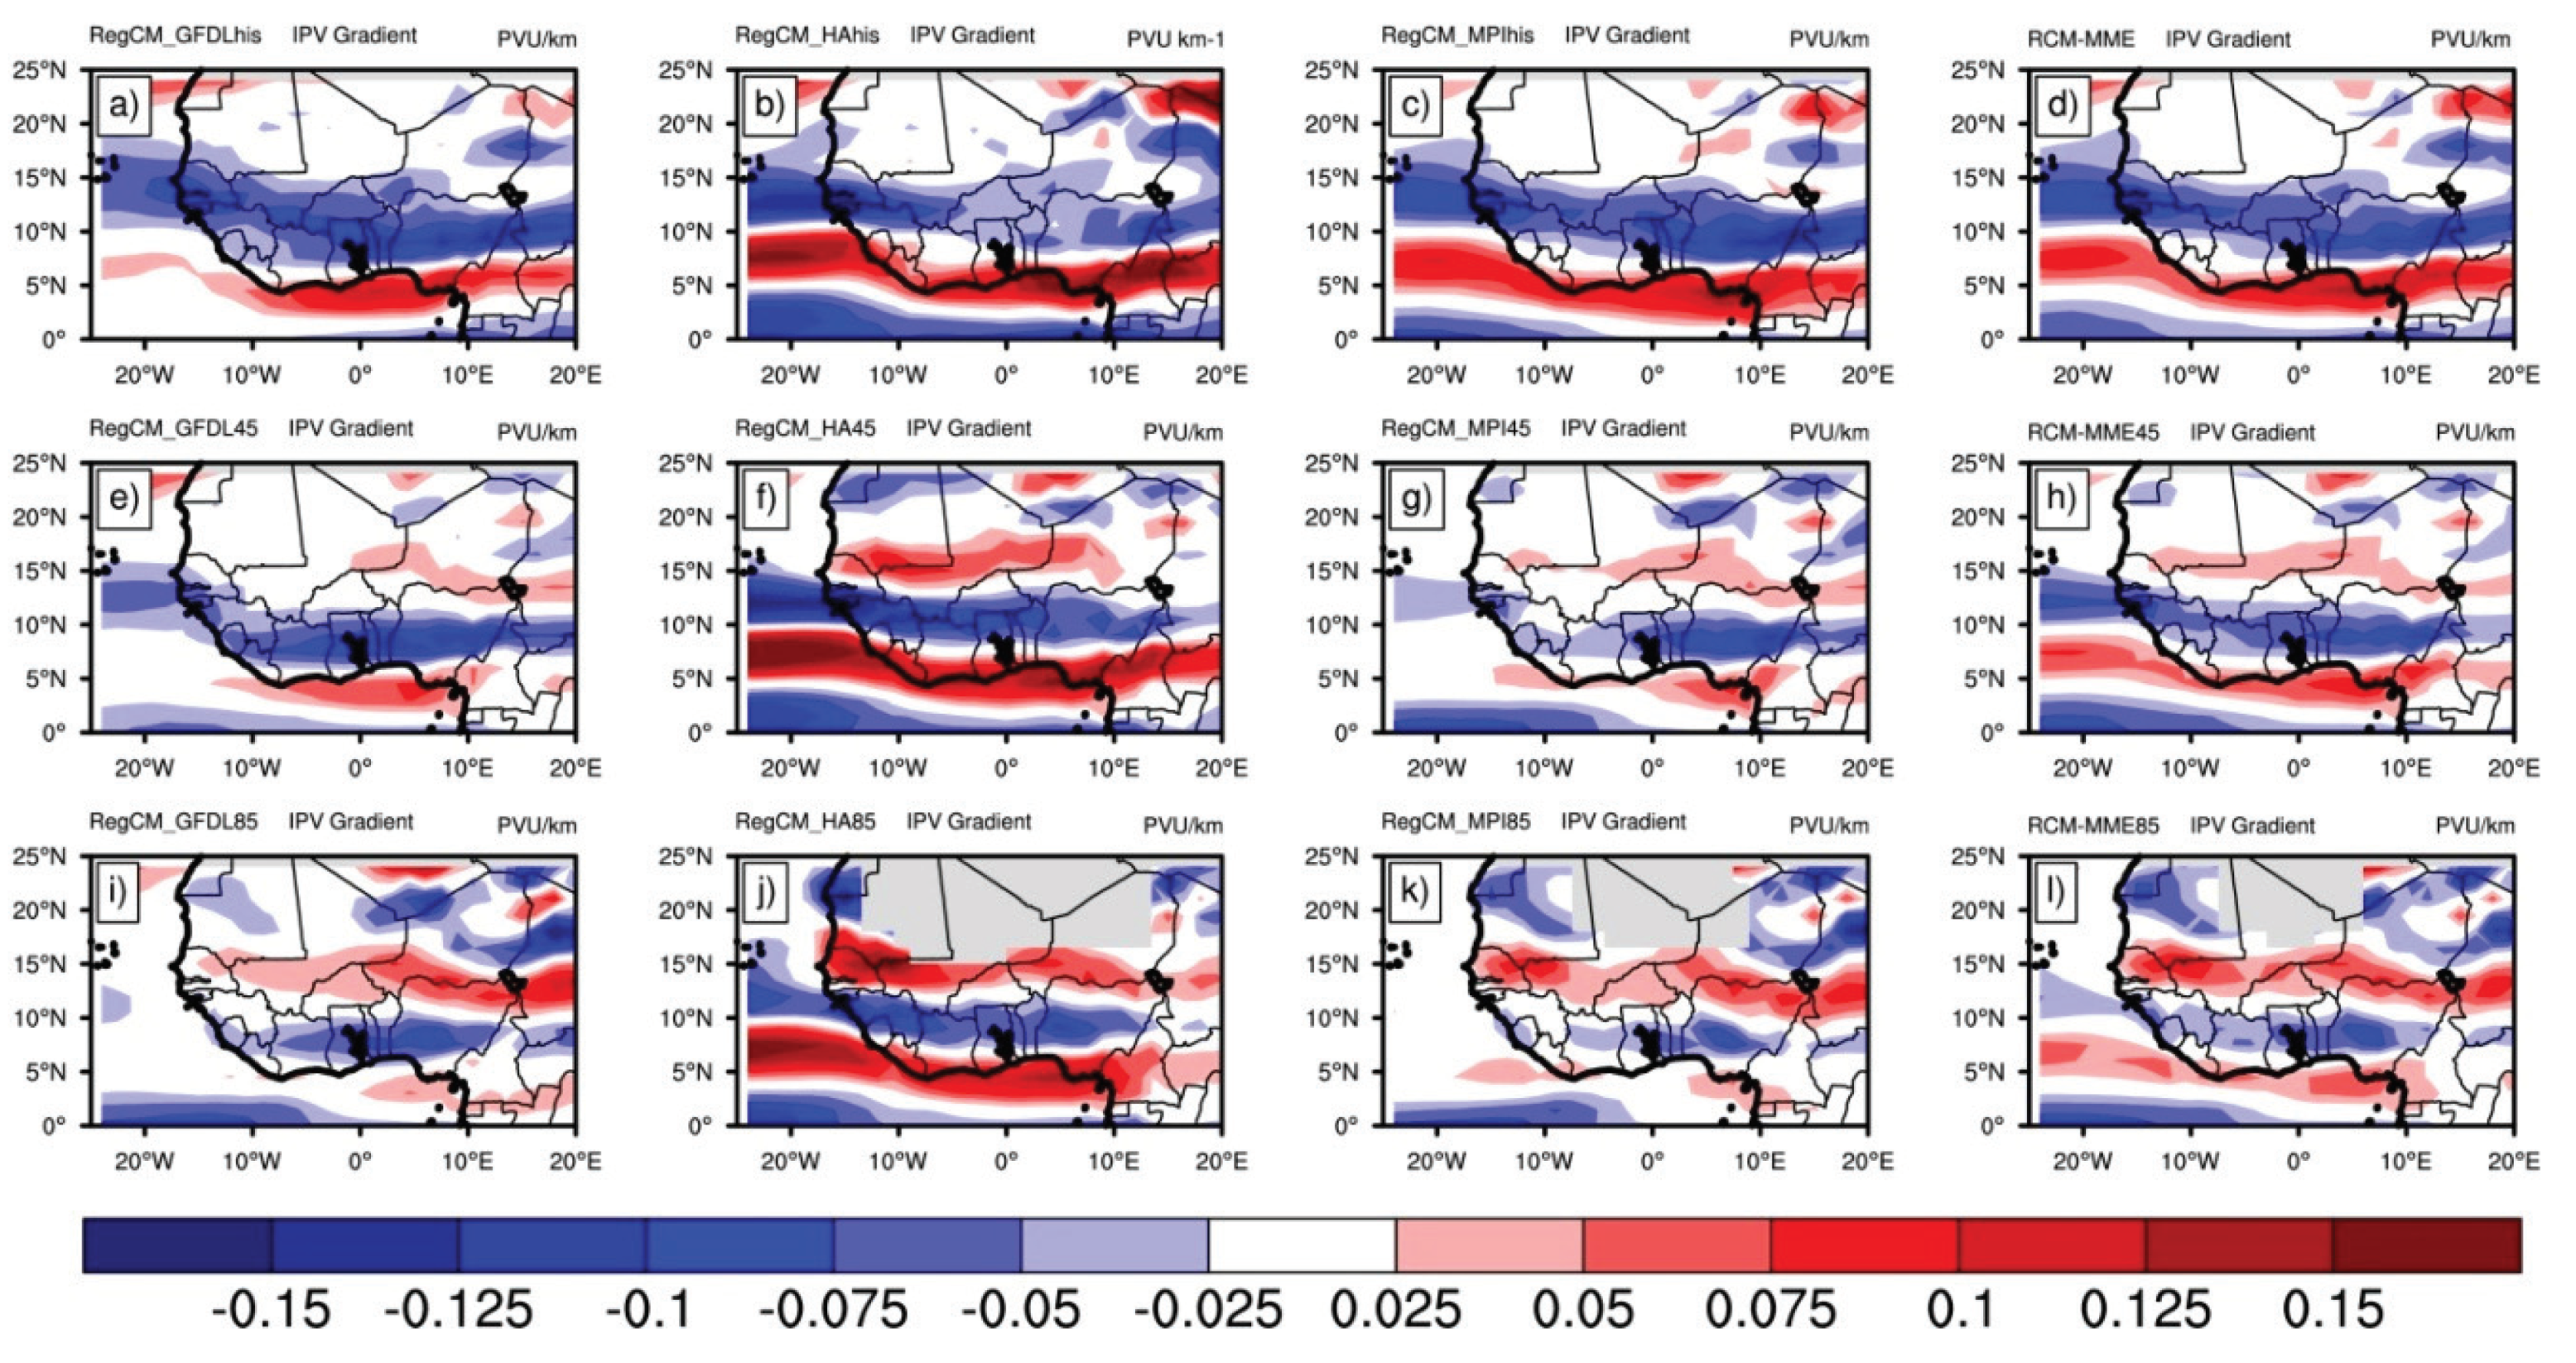
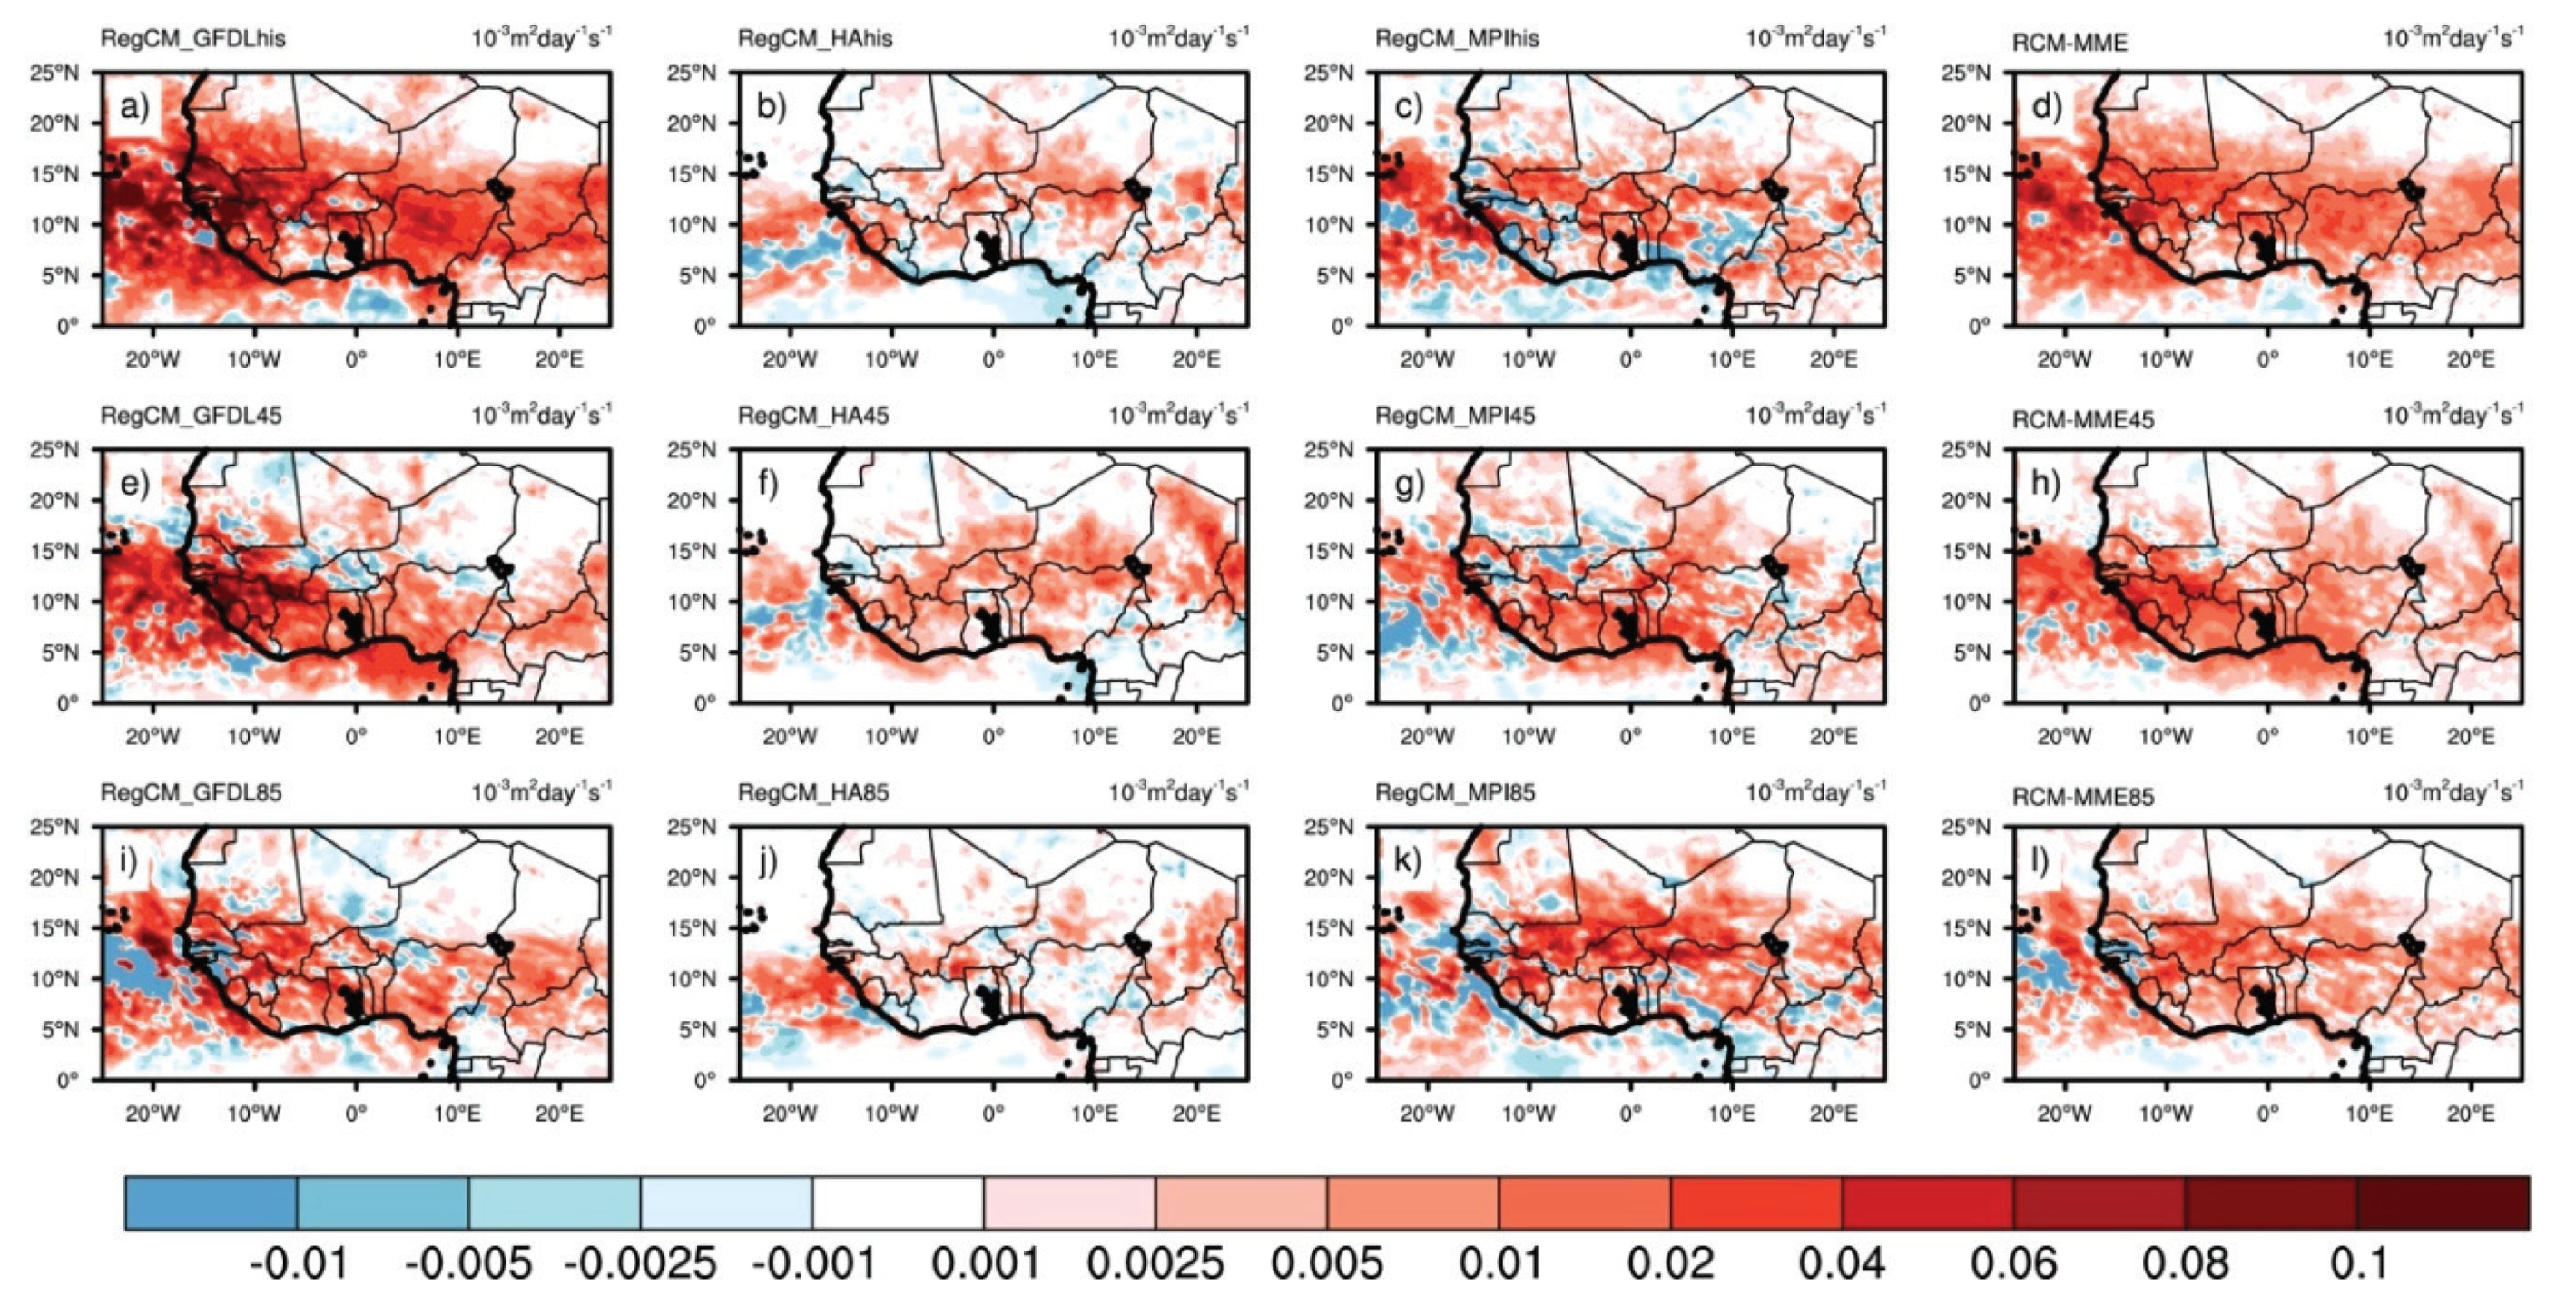
3.2.2. Mean Changes in African Easterly Waves

Figure 10 shows the JJAS meridional gradients of isentropic potential vorticity (IPV) on the 315-K isentropic surface (around 650-hPa pressure surface) for the current climate and both the RCP4.5 and the RCP8.5 scenarios. Most of the multi-model simulations show a region of reversed IPV gradient between 12° N and 15° N. This gradient decreases with the increase of greenhouse gases (GHG)concentration in the late future over West Africa. This negative gradient differs in the position and magnitude over land. For example, for the current climate, the individual RCMs and the multi-model ensembles locate this negative band around 10° N with different magnitudes of the gradients. In both scenarios, most of the models and their multi-model ensembles locate this reversal below 10° N over land except for RegCM_HA45 and RegCM_HA85 (Figure 10f,j) where it is initiated at 10° N. In any case, the existence of the negative IPV gradients along the AEJ cores satisfies both the Charney–Stern and Fjortoff criteria for instability and it occurs along the axis where AEJ is stronger after it has migrated southward in the future. The spatial coverage of the negative IPV gradient is larger in the present day than in the late 21st century. However, the main cores are larger and stronger in the RCP4.5 than in the RCP8.5. This is consistent with the reduced convective activities (see Figure 4) and implies that the background environment of West Africa is less favorable for the growth and development of AEWs perturbations during the future climate compared to the present day.
As a result, we expect the model experiments to generate different AEWs characteristics with lower activity at the end of the 21st century. Indeed, all models project lower AEWs activity due to lesser baroclinic and barotropic instabilities (Figure 11). Experiments such as RegCM_GFDLhis and RegCM_MPIhis where the zonal strips of negative IPV were thinner and their magnitudes smaller exhibit the largest decrease of AEWs activities for the future under the RCP8.5 scenarios (see Figure 11e,g). This implies that the westward traveling convective systems embedded in the AEWs and responsible for most of precipitation over West Africa will likely occur less by the end of the 21st century. This, in fact, is consistent with the projected changes in precipitation.
To investigate whether global warming strengthens or weakens their relationship, we computed the covariance coefficients between monsoon precipitation and AEWs activities in the current and future climate (Figure 12). During the present day all model experiments and their ensemble means agree that the rainfall association with AEWs shows a positive covariance over the Sahel region and Guinea Coast during the WAM summer season, but with different magnitude. This is in line with previous studies, which have found a positive relationship between precipitation and AEWs. For example, Chen and Wang [69] have estimated that about 50% of the mean June-July-August-September summer rainfall in West Africa occurs under the influence of AEWs. Additionally, about 90% of the region’s seasonal rainfall is generated by organized convective systems [70,71]. Such convective systems are frequently initiated by AEWs along and to the south of the AEJ [10]. Furthermore, in the region between 5° N and 12° N (prevailing region for AEWs), increasing GHG concentration (i.e., going from historical to RCP4.5 and RCP8.5) equal to the increases of covariance coefficients. However, under the RCP4.5 and the RCP8.5, the simulations exhibit different patterns. In fact, increases in the former are more confined along the Gulf of Guinea while increases in the latter are widespread over the area of the AEWs occurrences. This indicates that global warming strengthens the interactions between precipitation changes and AEWs occurrences.

4. Summary and Conclusions

In this paper, we utilized a set of three high-resolution (25 km) simulations from RegCM4 to investigate the late 21st century changes in the WAM large-scale circulation characteristics under the RCP4.5 and RCP8.5 aerosols and greenhouse gas concentration. A set of three Earth System Models (GFDL, HadGEM2-ES, and MPI-ESM) participating in the fifth phase of the Coupled Model Inter-comparison Project (CMIP5) were selected to provide initial and lateral boundary conditions to the RegCM4. Of particular interest in this study, we specifically investigate the summer (June-July-August-September; JJAS) seasonal mean changes in 2m-temperature, rainfall, and different WAM features, along with the relationship between the changes in African Easterly Jet (AEJ), African Easterly Waves (AEWs), convection and precipitation changes.
By the end of the 21st century and under both scenarios, all RegCM4 experiments predict a clear increase in 2m-temperature but with different magnitudes over West Africa. The RCP8.5 scenario exhibits larger warming, in the range of 3–8 °C, over most parts of the West African region. These results are in line with previous findings [42,43,44] and indicate an increase of latent heating, which induces a weakening of inland moisture convergence. We found that the moisture convergence lowering is more pronounced over the Savanna-Sahel region, albeit with a different magnitude/sign and impact on the precipitation changes over West Africa. For instance, both scenarios show a considerable reduction of monsoon precipitation (more than 25%) with more extended drying conditions in the western Sahel region, while parts of the Guinea Coast experience about 10% of positive precipitation change.
The analysis of large-scale changes in WAM circulation features reveals that the AEJ exhibits a possible southward shift and strengthening, with the shift being more pronounced under the RCP8.5 than the RCP4.5. This is in response to the positive temperature gradient shift due to the low-level warming and surface baroclinicity. Additionally, all experiments project decreases of AEWs activities, which are likely due to lesser baroclinic and barotropic instabilities. The decreased easterly wave activities are mostly driven by a decrease of reversed IPV gradient (consistent with the reduced convective activities) between 12° N and 15° N, which is consistent in all regional model projections, although with different spatial magnitudes and details. Indeed, such conditions combined with the reduced convective activities suggest that the background environment of West Africa will be less favorable for the growth and development of AEWs perturbations in the late 21st century. These changes in large-scale WAM dynamics can explain the widespread and the pronounced precipitation reduction throughout the entire Savanna and Sahel regions. However, further analysis is required to elucidate the potential mechanism underlying the future enhancement of rainfall over the eastern Sahel projected by certain models (see Figure 2; e.g., RegCM_HA45, RegCM_HA85, and RegCM_MPI_85).
Previous modeling studies have shown that the weakening of the summer monsoon precipitation over the Sahel is associated with a decrease of the easterly wave activities [40,41,72] and to the shrinking of the monsoon season (late onset and early cessation) as discussed by Diallo et al. [59] and Mariotti et al. [41]. Here, in addition to a weakening of the AEWs activities, we found a possible strengthening and a southward shift of the AEJ (i.e., northward disappearance). The results presented in this paper advance understanding of the relationship between AEJ, AEWs, and precipitation changes at various levels of increase in radiative forcing in the late 21st century. However, to further explore the robustness of the relationships revealed in this paper; future studies using different high-resolution regional models with large ensemble are recommended.

Author Contributions

Conceptualization, I.K., M.B.S., and I.D.; methodology, I.K., I.D., and M.B.S.; writing—original draft preparation, I.K., I.D., and M.B.S.; writing—review and editing, I.K., I.D., M.B.S., F.D.S., and A.D.; supervision, M.B.S., I.D., and A.D. All authors have read and agreed to the published version of the manuscript.

Funding

The research leading to this publication is co-funded by the NERC/DFID “Future Climate for Africa” programme under the AMMA-2050 project; grant number NE/M019969/1 and by IRD (Institut de Recherche pour le Développement; France) grant number UMR IGE Imputation 252RA5.

Acknowledgments

The authors thank the three anonymous reviewers and the editor for their constructive comments/suggestions, which helped to improve the quality of the manuscript. The computation for this study was done at the Abdus Salam International Centre for Theoretical Physics (ICTP). Therefore, we thank the Earth System Physics section for their support. Ismaila Diallo is supported by the National Science Foundation grant AGS- AGS-1419526.

Conflicts of Interest

The authors declare no conflict of interest.

References

  1. Nicholson, S.E.; Webster, P.J. A physical basis for the interannual variability of rainfall in the Sahel. Q. J. R. Meteorol. Soc. 2007, 133, 2065–2084. [Google Scholar] [CrossRef]
  2. Cook, K.H. Generation of the African easterly jet and its role in determining West African precipitation. J. Clim. 1999, 12, 1165–1184. [Google Scholar] [CrossRef]
  3. Sylla, M.B.; Giorgi, F.; Ruti, P.M.; Calmanti, S.; Dell’Aquila, A. The impact of deep convection on the West African summer monsoon climate: A regional climate model sensitivity study. Q. J. R. Meteorol. Soc. 2011, 137, 1417–1430. [Google Scholar] [CrossRef]
  4. Thorncroft, C.D.; Blackburn, M. Maintenance of the African easterly jet. Q. J. R. Meteor. Soc. 1999, 125, 763–786. [Google Scholar] [CrossRef]
  5. Nicholson, S. The West African Sahel: A review of recent studies on the rainfall regime and its interannual variability. ISRN Meteorol. 2013, 2013, 453521. [Google Scholar] [CrossRef]
  6. Nolan, D.S.; Zhang, C.; Chen, S.H. Dynamics of the shallow meridional circulation around intertropical convergence zones. J. Atmos. Sci. 2007, 64, 2262–2285. [Google Scholar] [CrossRef] [Green Version]
  7. Zhang, C.; Nolan, D.S.; Thorncroft, C.D.; Nguyen, H. Shallow meridional circulations in the tropical atmosphere. J. Clim. 2008, 21, 3453–3470. [Google Scholar] [CrossRef] [Green Version]
  8. Burpee, R. The Origin and Structure of Easterly Waves in the Lower Troposphere of North Africa. J. Atmos. Sci. 1972, 29, 77–90. [Google Scholar] [CrossRef] [Green Version]
  9. Diedhiou, A.; Janicot, S.; Viltard, A.; DeFelice, P.; Laurent, H. Easterly wave regimes and associated convection over West Africa and tropical Atlantic: Results from NCEP/NCAR and ECMWF reanalyses. Clim. Dyn. 1999, 15, 795–822. [Google Scholar] [CrossRef]
  10. Reed, R.J.; Klinker, E.; Hollingsworth, A. The structure and characteristics of African easterly wave disturbances as determined from the ECMWF operational analysis/forecast system. Meteorol. Atmos. Phys. 1988, 38, 22–33. [Google Scholar] [CrossRef]
  11. Charney, J.G. Dynamics of deserts and drought in the Sahel. Q. J. R. Meteorol. Soc. 1975, 101, 193–202. [Google Scholar] [CrossRef]
  12. Hsieh, J.S.; Cook, K.H. A study of the energetics of African easterly waves. J. Atmos. Sci. 2007, 64, 421–440. [Google Scholar] [CrossRef]
  13. Leroux, S.; Hall, N. On the relationship between African easterly waves and the African easterly jet. J. Atmos. Sci. 2009, 66, 2303–2316. [Google Scholar] [CrossRef]
  14. Redelsperger, J.L.; Diongue, A.; Diedhiou, A.; Ceron, J.P.; Diop, M.; Gueremy, J.F.; Lafore, J.P. Multi-scale description of a Sahelian synoptic weather system representative of the West African monsoon. Q. J. R. Meteorol. Soc. 2002, 128, 1229–1257. [Google Scholar] [CrossRef]
  15. Mohr, K.I.; Thorncroft, C.D. Intense convective systems in West Africa and their relationship to the African easterly jet. Q. J. R. Meteorol. Soc. 2006, 132, 163–176. [Google Scholar] [CrossRef] [Green Version]
  16. Diallo, I.; Sylla, M.B.; Camara, M.; Gaye, A.T. Interannual variability of rainfall over the Sahel based on multiple regional climate models simulations. Theor. Appl. Clim. 2013, 113, 351–362. [Google Scholar] [CrossRef]
  17. Sylla, M.B.; Diallo, I.; Pal, J.S. West African monsoon in state-of the-art regional climate models. In Climate Variability—Regional and Thematic Patterns; Tarhule, A., Ed.; Books on Demand: Norderstedt, Germany, 2013; ISBN 980-953-307-816-3. [Google Scholar]
  18. Folland, C.K.; Palmer, T.N.; Parker, D.E. Sahel rainfall and worldwide sea temperatures, 1901–1985. Lett. Nat. 1986, 320, 602–607. [Google Scholar] [CrossRef]
  19. Jenkins, G.S.; Gaye, A.T.; Sylla, M.B. Late 20th century attribution of drying trends in the Sahel from the Regional Climate Model (RegCM3). Geophys. Res. Lett. 2005, 32. [Google Scholar] [CrossRef]
  20. Nicholson, S.E.; Some, B.; Kone, B. An analysis of recent rainfall conditions in West Africa, including the rainy seasons of the 1997 E1 Nino and the 1998 La Nina years. J. Clim. 2000, 13, 2628–2640. [Google Scholar] [CrossRef]
  21. Nicholson, S.E. The intensity, location and structure of the tropical rainbelt over West Africa as factors in interannual variability. Int. J. Climatol. 2008, 28, 1775–1785. [Google Scholar] [CrossRef]
  22. Sylla, M.B.; Dell’Aquila, A.; Ruti, P.M.; Giorgi, F. Simulation of the Intraseasonal and the Interannual Variability of Rainfall over West Africa with a Regional Climate Model (RegCM3) during the Monsoon Period. Int. J. Climatol. 2010, 30, 1865–1883. [Google Scholar]
  23. Thorncroft, C.; Hodges, K. African easterly wave variability and its relationship to Atlantic tropical cyclone activity. J. Climate 2001, 14, 1166–1179. [Google Scholar] [CrossRef]
  24. Nicholson, S.E. On the factor modulating the intensity of the tropical rainbelt over West Africa. Int. J. Climatol. 2008, 29, 763–789. [Google Scholar] [CrossRef]
  25. Fink, A.H.; Reiner, P.M. Spatiotemporal variability of the relation between African easterly waves and West African squall lines in 1998 and 1999. J. Geophys. Res. 2003, 108, 4332. [Google Scholar] [CrossRef]
  26. Carlson, T.N. Synoptic histories of three Africa disturbances that developed into Atlantic hurricanes. Mon. Weather Rev. 1969, 97, 256–276. [Google Scholar] [CrossRef]
  27. Mekonnen, A.; Thorncroft, C.D.; Aiyyer, A. Analysis of convection and its association with African easterly waves. J. Climate 2006, 19, 5405–5421. [Google Scholar] [CrossRef] [Green Version]
  28. Bamba, A.; Diallo, I.; Touré, N.E.; Kouadio, K.; Konaré, A.; Dramé, M.S.; Diedhiou, A.; Silué, S.; Doumbia, M.; Tall, M. Effect of the African greenbelt position on West African summer climate: A regional climate modeling study. Theor. Appl. Climatol. 2019, 133, 663–679. [Google Scholar] [CrossRef]
  29. Diallo, I.; Bain, C.L.; Gaye, A.T.; Moufouma-Okia, W.; Niang, C.; Dieng, M.D.B.; Graham, R. Simulation of the West African monsoon onset using the HadGEM3-RA regional climate model. Clim. Dyn. 2014, 43, 575–594. [Google Scholar] [CrossRef] [Green Version]
  30. Saley, I.A.; Salack, S.; Sanda, I.S.; Mounkaila, S.M.; Bonkaney, A.L.; Ly, M.; Fodé, M. The possible role of the Sahel Greenbelt on the occurrence of climate extremes over the West African Sahel. Atmos. Sci. Lett. 2019, 20, e927. [Google Scholar] [CrossRef]
  31. Druyan, L.M.; Feng, J.; Cook, K.H.; Xue, Y.; Fulakeza, M.; Hagos, S.M.; Ibrah, S.S. The WAMME regional model Intercomparison study. Clim. Dyn. 2010, 35, 175–192. [Google Scholar] [CrossRef] [Green Version]
  32. Xue, Y.; De Sales, F.; Lau, K.M.W.; Bonne, A.; Feng, J.; Dirmeyer, P.; Guo, Z.; Kim, K.M.; Kitoh, A.; Kumar, V.; et al. Intercomparison of West African Monsoon and its variability in the West African Monsoon Modelling Evaluation Project (WAMME) first model Intercomparison experiment. Clim. Dyn. 2010. [Google Scholar] [CrossRef] [Green Version]
  33. Paeth, H.; Hall, N.M.; Gaertner, M.A.; Alonso, M.D.; Moumouni, S.; Polcher, J.; Ruti, P.M.; Fink, A.H.; Gosset, M.; Lebel, T.; et al. Progress in regional downscaling of West African precipitation. Atmos. Sci. Lett. 2011, 12, 75–82. [Google Scholar] [CrossRef]
  34. Nikulin, G.; Jones, C.; Giorgi, F.; Asrar, G.; Büchner, M.; Cerezo-Mota, R.; van Meijgaard, E. Precipitation climatology in an ensemble of CORDEX-Africa regional climate simulations. J. Clim. 2012, 25, 6057–6078. [Google Scholar] [CrossRef] [Green Version]
  35. Gbobaniyi, E.; Sarr, A.; Sylla, M.B.; DIallo, I.; Lennard, C.; Dosio, A.; Diedhiou, A.; Kamga, A.; Klutse, N.A.B.; Hewitson, B.; et al. Climatology, annual cycle and interannual variability of precipitation and temperature in CORDEX simulations over West Africa. Int. J. Clim. 2014, 34, 2241–2257. [Google Scholar] [CrossRef]
  36. Diba, I.; Camara, M.; Diedhiou, A. Investigating West African Monsoon Features in Warm Years Using the Regional Climate Model RegCM4. Atmosphere 2019, 10, 23. [Google Scholar] [CrossRef] [Green Version]
  37. Druyan, L.M.; Fulakeza, M. Downscaling atmosphere-ocean global climate model precipitation simulations over Africa using bias corrected lateral and lower boundary conditions. Atmosphere 2018, 9, 493. [Google Scholar] [CrossRef] [Green Version]
  38. Diallo, I.; Giorgi, F.; Deme, A.; Tall, M.; Mariotti, L.; Gaye, A.T. Projected changes of summer monsoon extremes and hydroclimatic regimes over West Africa for the twenty-first century. Clim. Dyn. 2016, 47, 3931–3954. [Google Scholar] [CrossRef]
  39. Diasso, U.; Abiodun, B. Future impacts of global warming and reforestation on drought patterns over West Africa. Theor. Appl. Climatol. 2017, 133, 647–662. [Google Scholar] [CrossRef]
  40. Skinner, C.B.; Diffenbaugh, N.S. Projected changes in African easterly wave intensity and tracking response to greenhouse forcing. Proc. Natl. Acad. Sci. USA 2014, 9, 6882–6887. [Google Scholar] [CrossRef] [Green Version]
  41. Mariotti, L.; Diallo, I.; Coppola, E.; Giorgi, F. Seasonal and intraseasonal changes of African monsoon climates in 21st century CORDEX projections. Clim. Chang. 2014, 125, 53–65. [Google Scholar] [CrossRef]
  42. Bercos-Hickey, E.; Nathan, T.R.; Chen, S.H. On the relationship between the African Easterly Jet, Saharan mineral dust aerosols, and West African precipitation. J. Clim. 2020. [Google Scholar] [CrossRef]
  43. N’Datchoh, E.T.; Diallo, I.; Konaré, A.; Silué, S.; Ogunjobi, K.O.; Diedhiou, A.; Doumbia, M. Dust induced changes on the West African summer monsoon features. Int. J. Climatol. 2018, 38, 452–466. [Google Scholar]
  44. Sylla, M.B.; Giorgi, F.; Pal, J.S.; Gibba, P.; Kebe, I.; Nikiema, M. Projected changes in the annual cycle of high-intensity precipitation events over West Africa for the late twenty-first century. J. Clim. 2015, 28, 6475–6488. [Google Scholar] [CrossRef]
  45. Kebe, I.; Sylla, M.B.; Omotosho, J.A.; Nikiema, P.M.; Gibba, P.; Giorgi, F. Impact of GCM boundary forcing on regional climate modeling of West African summer monsoon precipitation and circulation features. Clim. Dyn. 2017, 48, 1503–1516. [Google Scholar] [CrossRef]
  46. Giorgi, F.; Coppola, E.; Solmon, F.; Mariotti, L.; Sylla, M.B.; Bi, X.; Elguindi, N.; Diro, G.T.; Nair, V.; Giuliani, G.; et al. RegCM4: Model description and preliminary tests over multiple CORDEX domains. Clim. Res. 2012, 52, 7–29. [Google Scholar] [CrossRef] [Green Version]
  47. Kiehl, J.T.; Hack, J.J.; Bonan, G.B.; Boville, B.A.; Briegleb, B.P.; Williamson, D.L.; Rasch, P.J. Description of the NCAR Community Climate Model (CCM3). NCAR Tech. Note 1996, 152. [Google Scholar] [CrossRef]
  48. Oleson, K.; Niu, G.Y.; Yang, Z.L.; Lawrence, D.M.; Thornton, P.E.; Lawrence, P.J.; Stöckli, R.; Dickinson, R.E.; Bonan, G.B.; Levis, S.; et al. Improvements to the community land model and their impact on the hydrological cycle. J. Geophys. Res. 2008, 113. [Google Scholar] [CrossRef]
  49. Emanuel, K.A. A scheme for representing cumulus convection in large-scale models. J. Atmos. Sci. 1991, 48, 2313–2335. [Google Scholar] [CrossRef]
  50. Emanuel, K.A.; Zivkovic-Rothman, M. Development and evaluation of a convection scheme for use in climate models. J. Atmos. Sci. 1999, 56, 1766–1782. [Google Scholar] [CrossRef] [Green Version]
  51. Zeng, X.; Zhao, M.; Dickinson, R.E. Intercomparison of bulk aerodynamic algorithms for the computation of sea surface fluxes using TOGACOARE and TAO data. J. Clim. 1998, 11, 2628–2644. [Google Scholar] [CrossRef]
  52. Pal, J.S.; Small, E.; Eltahir, E.A.B. Simulation of regional-scale water and energy budgets: Representation of subgrid cloud and precipitation processes within RegCM. J. Geophys. Res. 2000, 105, 29579–29594. [Google Scholar] [CrossRef]
  53. Tall, M.; Sylla, M.B.; Diallo, I.; Pal, J.S.; Faye, A.; Mbaye, M.L.; Gaye, A.T. Projected impact of climate change in the hydroclimatology of Senegal with a focus over the Lake Guiers for the twenty-first century. Theor. Appl. Climatol. 2016, 129, 655–665. [Google Scholar] [CrossRef]
  54. Taylor, K.E.; Stouffer, R.J.; Meehl, G.A. An Overview of CMIP5 and the Experiment Design. Bull. Am. Meteorol. Soc. 2012, 93, 485–498. [Google Scholar] [CrossRef] [Green Version]
  55. Dunne, J.P.; Jasmin, G.J.; Shevliakova, E.; Stouffer, R.J.; Krasting, J.P.; Malyshev, S.L.; Milly, P.C.D.; Sentman, L.T.; Adcroft, A.J.; Cooke, W.; et al. GFDL’s ESM2 global coupled climate-carbon earth system models. Part II: Carbon system formulation and baseline simulation characteristics. J. Clim. 2013, 26, 2247–2267. [Google Scholar] [CrossRef] [Green Version]
  56. Collins, W.J.; Bellouin, N.; Doutriaux-Boucher, M.; Gedney, N.; Halloran, P.; Hinton, T.; Martin, G. 2011: Development and evaluation of an Earth-system model HadGEM2. Geosci. Model Dev. Discuss. 2011, 4, 997–1062. [Google Scholar] [CrossRef]
  57. Giorgetta, M.; Jungclaus, J.; Reick, C.; Legutke, S.; Brovkin, V.; Crueger, T.; Esch, M.; Fieg, K.; Glushak, K.; Gayler, V.; et al. CMIP5 simulations of the Max Planck Institute for Meteorology (MPI-M) based on the MPI-ESM-LR model: The piControl experiment, served by ESGF. World Data Center Clim. 2012. [Google Scholar] [CrossRef]
  58. James, R.; Washington, R. Changes in African temperature and precipitation associated with degrees of global warming. Clim. Chang. 2013, 117, 859–872. [Google Scholar] [CrossRef]
  59. Diallo, I.; Sylla, M.B.; Giorgi, F.; Gaye, A.T.; Camara, M. Multimodel GCM-RCM ensemble based projections of temperature and precipitation over West Africa for the early 21st century. Int. J. Geophys. 2012, 12, 972896. [Google Scholar] [CrossRef] [Green Version]
  60. Dosio, A. Projection of temperature and heat waves for Africa with an ensemble of CORDEX Regional Climate Models. Clim. Dyn. 2017, 49, 493–519. [Google Scholar] [CrossRef]
  61. Sylla, M.B.; Faye, A.; Giorgi, F.; Diedhiou, A.; Kunstmann, H. Projected heat stress under 1.5 °C and 2 °C global warming scenarios creates unprecedented discomfort for humans in West Africa. Earth Fut. 2018, 6, 1029–1044. [Google Scholar] [CrossRef]
  62. Patricola, C.M.; Cook, K.H. Atmosphere/vegetation feedbacks: A mechanism for abrupt climate change over northern Africa. J. Geophys. Res. 2008, 113. [Google Scholar] [CrossRef]
  63. Hulme, M.; Doherty, R.; Ngara, T.; New, M.; Lister, D. African climate change: 1900–2100. Clim. Res. 2001, 17, 145–168. [Google Scholar] [CrossRef] [Green Version]
  64. Monerie, P.A.; Fontaine, B.; Roucou, P. Expected future changes in the African monsoon between 2030 and 2070 using some CMIP3 and CMIP5 models under a medium-low RCP scenario. J. Geophys. Res. Atmos. 2012, 117. [Google Scholar] [CrossRef] [Green Version]
  65. Akinsanola, A.A.; Zhou, W. Dynamic and thermodynamic factors controlling increasing summer monsoon rainfall over the West African Sahel. Clim. Dyn. 2019, 52, 4501–4514. [Google Scholar] [CrossRef]
  66. Diedhiou, A.; Bichet, A.; Wartenburger, R.; Seneviratne, S.I.; Rowell, D.P.; Sylla, M.B.; Diallo, I.; Todzo, S.; Touré, N.D.E.; Camara, M.; et al. Changes in climate extremes over West and Central Africa at 1.5 °C and 2 °C global warming. Environ. Res. Lett. 2018, 13. [Google Scholar] [CrossRef]
  67. Maynard, K.; Royer, J.F.; Chauvin, F. Impact of greenhouse warming on the West African summer monsoon. Clim. Dyn. 2002, 19, 499–514. [Google Scholar]
  68. Grist, J.P.; Nicholson, S.A. A study of the dynamic factors influencing the rainfall variability in the West African Sahel. J. Clim. 2001, 14, 1337–1359. [Google Scholar] [CrossRef]
  69. Chen, S.-H.; Wang, S.-H.; Waylonis, M. Modification of Saharan air layer and environmental shear over the eastern Atlantic Ocean by dust-radiation effects. J. Geophys. Res. Atmos. 2010, 115. [Google Scholar] [CrossRef]
  70. Mathon, V.; Laurent, H.; Lebel, T. Mesoscale convective system rainfall in the Sahel. J. Appl. Meteorol. 2002, 41, 1081–1092. [Google Scholar] [CrossRef]
  71. Gaye, A.T.; Viltard, A.; De Felice, P. Lignes de grains et pluies en Afrique de l’Ouest: Part des lignes de grains à la pluie totale des étés 1986 et 1987. Science et Changements Planétaires/Sécheresse 2005, 16, 269–273. [Google Scholar]
  72. Sylla, M.B.; Gaye, A.T.; Jenkins, G.S.; Pal, J.S.; Giorgi, F. Consistency of projected drought over the Sahel with changes in the monsoon circulation and extremes in a regional climate model projections. J. Geophys. Res. 2010, 115. [Google Scholar] [CrossRef]
Figure 1. Domain and topography (in meter).
Atmosphere 11 00353 g001
Figure 2. Projected changes in mean June-July-August-September (JJAS) 2m-temperature (in °C) under RCP4.5 (left column) and RCP8.5 (right column) scenarios for (a) RegCM_GFDL45, (b) RegCM_HA45, (c) RegCM_MPI45, (d) RCM-MME45, (e) RegCM_GFDL85, (f) RegCM_HA85, (g) RegCM_MPI85, and (h) RCM-MME85.
Atmosphere 11 00353 g002
Figure 3. Projected changes in mean JJAS precipitation (in % with respect to the present days) under RCP4.5 (left column) and RCP8.5 (right column) scenarios for (a) RegCM_GFDL45, (b) RegCM_HA45, (c) RegCM_MPI45, (d) RCM-MME45, (e) RegCM_GFDL85, (f) RegCM_HA85, (g) RegCM_MPI85, and (h) RCM-MME85.
Atmosphere 11 00353 g003
Figure 4. Seasonal mean of vertical velocity (unit: Pa/s) for JJAS from (a) RegCM_GFDLhis, (b) RegCM_HAhis, (c) RegCM_MPIhis, (d) RCM-MME, (e) RegCM_GFDL45, (f) RegCM_HA45, (g) RegCM_MPI45, (h) RCM-MME45, (i) RegCM_GFDL85, (j) RegCM_HA85, (k) RegCM_MPI85, (l) and RCM-MME85.
Atmosphere 11 00353 g004
Figure 5. Projected changes in mean JJAS vertical velocity (in 10−3 Pa/s) under RCP4.5 (left column) and RCP8.5 (right column) scenarios for (a) RegCM_GFDL45, (b) RegCM_HA45, (c) RegCM_MPI45, (d) RCM-MME45, (e) RegCM_GFDL85, (f) RegCM_HA85, (g) RegCM_MPI85, and (h) RCM-MME85.
Atmosphere 11 00353 g005
Figure 6. Projected changes in mean JJAS potential temperature (in °C) averaged between 10° W and 20° E under RCP4.5 (top panels) and RCP8.5 (bottom panels) scenarios for (a) RegCM_GFDL45, (b) RegCM_HA45, (c) RegCM_MPI45, (d) RCM-MME45, (e) RegCM_GFDL85, (f) RegCM_HA85, (g) RegCM_MPI85, and (h) RCM-MME85.
Atmosphere 11 00353 g006
Figure 7. Projected changes in mean JJAS meridional temperature gradient (°C/km) averaged between 10°W and 20°E under RCP4.5 (top panels) and RCP8.5 (bottom panels) scenarios for (a) RegCM_GFDL45, (b) RegCM_HA45, (c) RegCM_MPI45, (d) RCM-MME45, (e) RegCM_GFDL85, (f) RegCM_HA85, (g) RegCM_MPI85, and (h) RCM-MME85.
Atmosphere 11 00353 g007
Figure 8. Projected changes in mean JJAS zonal wind (in m/s) at 650 hPa under RCP4.5 (left column) and RCP8.5 (right column) scenarios for (a) RegCM_GFDL45, (b) RegCM_HA45, (c) RegCM_MPI45, (d) RCM-MME45, (e) RegCM_GFDL85, (f) RegCM_HA85, (g) RegCM_MPI85, and (h) RCM-MME85.
Atmosphere 11 00353 g008
Figure 9. Seasonal mean of covariance between mean precipitation (in mm/day) and zonal wind (in m/s) at 650 hPa for JJAS from (a) RegCM_GFDLhis, (b) RegCM_HAhis, (c) RegCM_MPIhis, (d) RCM-MME, (e) RegCM_GFDL45, (f) RegCM_HA45, (g) RegCM_MPI45, (h) RCM-MME45, (i) RegCM_GFDL85, (j) RegCM_HA85, (k) RegCM_MPI85, and (l) RCM-MME85.
Atmosphere 11 00353 g009
Figure 10. Seasonal mean of meridional isentropic potential vorticity (IPV) gradient (PVU/km) for JJAS from (a) RegCM_GFDLhis, (b) RegCM_HAhis, (c) RegCM_MPIhis, (d) RCM-MME, (e) RegCM_GFDL45, (f) RegCM_HA45, (g) RegCM_MPI45, (h) RCM-MME45, (i) RegCM_GFDL85,(j) RegCM_HA85, (k) RegCM_MPI85, and (l) RCM-MME85.
Atmosphere 11 00353 g010
Figure 11. Projected changes in mean JJAS 2- to 10-day filtered meridional wind at 650 hPa (in m2/s2) under RCP4.5 (left column) and RCP8.5 (right column) scenarios from (a) RegCM_GFDL45, (b) RegCM_HA45, (c) RegCM_MPI45, (d) RCM-MME45, (e) RegCM_GFDL85, (f) RegCM_HA85, (g) RegCM_MPI85, and (h) RCM-MME85.
Atmosphere 11 00353 g011
Figure 12. Seasonal mean of covariance between mean precipitation (in mm/day) and the 2–10 days filtered Meridional Wind (m/s) at 650 hPa for JJAS from (a) RegCM_GFDLhis, (b) RegCM_HAhis, (c) RegCM_MPIhis, (d) RCM-MME, (e) RegCM_GFDL45, (f) RegCM_HA45, (g) RegCM_MPI45, (h) RCM-MME45, (i) RegCM_GFDL85, (j) RegCM_HA85,(k) RegCM_MPI85, and (l) RCM-MME85.
Atmosphere 11 00353 g012
Table 1. List of CMIP5 Global Climate Models (GCMs) used to initialize and drive the different RegCM4 simulations.
CMIP5 GCMs Used to Drive the RegCM4
NameGFDL-ESM2MHadGEM2-ESMPI-ESM-MR
Short Name Used in the PaperGFDLHAMPI
InstitutionNational Oceanic Atmospheric Administration—Geophysical Fluid Dynamic Laboratory, USAMet Office Hadley Centre, United KingdomMax Planck Institute for Meteorology, Germany
Grid Resolution2.0225° × 2.5°1.25° × 1.875°1.8653° × 1.875°
Reference[55][56][57]
Table 2. List of RegCM4 experiments for historical (reference) and late 21st century under both scenarios.
Type of Experiment ScenariosExperiment PeriodDriving GCMsExperiment Names
GCMRegCM4
Reference (Historical)1985–2004GFDL-ESM2MGFDLRegCM_GFDLhis
HadGEM2-ESHARegCM_HAhis
MPI-ESM-MRMPIRegCM_MPIhis
RCP4.52080–2099GFDL-ESM2MGFDL45RegCM_GFDL45
HadGEM2-ESHA45RegCM_HA45
MPI-ESM-MRMPI45RegCM_MPI45
RCP8.52080–2099GFDL-ESM2MGFDL85RegCM_GFDL85
HadGEM2-ESHA85RegCM_HA85
MPI-ESM-MRMPI85RegCM_MPI85

