Abstract
Local strong sandstorms (LSSs) in northwestern China often occur suddenly in tens of minutes during the late afternoon and by dusk. Observations and theoretical studies have shown the trigger role of cold-air pools over desert areas for the occurrence of LSS. In this study, a numerical heat convection model was established to simulate an LSS that was induced by a single cold pool with vertical helicity to study the evolution process. The Reynolds averaged Navier–Stokes (RANS) method was used for the numerical calculation to illustrate different stages of the evolution process of an LSS. Results show that after the intrusion of a cold pool into the upper region of the surface convective mixing layer, descending of the cold air would lead to the downward transport of vorticity, enabling thermal convection cells in the mixing layer to become swirling convection cells. After LSS is fully developed, there occurs many subvortices (secondary vortices) in the convection field. The velocity at different altitudes over selected positions in the calculation domain is consistent with the "lobe" shape of an LSS. The secondary vortices cause quick and huge energy dissipation and the decay of the LSS. These results are consistent with observations and indicate the crucial effect of convection cells structure in the mixing layer and the cold pool in the upper layer on the formation of LSS.
1. Introduction
Local strong sandstorms (LSSs) in China, similar to haboobs in Sudan and America, usually with a maximum instantaneous wind speed > 25 m/s and visibility < 50 m, are generally characteristic of a sudden disastrous weather in arid and semiarid regions [1]. In China, this intense sandstorm is previously called a black storm. A black storm is a frequent occurrence in several deserts in northwestern China, such as Taklimakan Desert, Badain Jaran Desert and Tengger Desert [2,3]. Haboobs often occur in or near the desert regions of the western United States and Africa [4,5,6]. In fact, a Sudan haboob or American haboob appears mostly in the rainy season, followed by thunderstorms, while local strong sandstorms in China, with no seasonality, are rarely followed by precipitation, which is related to the relative humidity of the squall line formed by the intrusion of cold air [2,3]. The interaction of dust radiation heating and the local atmosphere instability in the growth process of the dry squall line could trigger the occurrence of LSS. However, a Sudan haboob or American haboob is always influenced by the wet squall line, which would result in a strong thunderstorm and precipitation process. The developing impetus of the dry squall line is mainly from sensible heat under an unstable dry air adiabatic condition, while the developing impetus of the wet squall line is from the condensation latent heating [2]. Both LSS and haboob are a complicated weather process, which is generally associated with the strong wind. Their front edge is the gust front, where a dust wall would be formed, named as the dust storm front. A density current of relatively cold air entraining the near-surface warm air appears to be the principal cause for such events. Observations showed that convectively generated cold pools acting as density currents have typical depths approximately 1 km [7,8]. The leading edge of the density current consists of several “lobes” and “clefts” that are unsteady and shifting, causing largely dust uplift [9,10]. Figure 1 shows an LSS event recently occurred in Alar City, Xinjiang Province, China. The dust wall is up to hundreds of meters, and several “lobes” of lifting dust are formed at the leading edge [11].
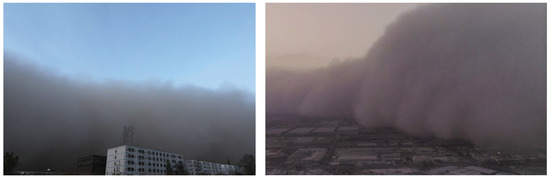
Figure 1.
The front of a local strong sandstorm (LSS) occurred in Alar City, China on 6 April 2019 [11].
At present, many researchers have conducted in-depth research and analyses on the climatic causes for dust storms and haboobs [12,13,14,15,16,17,18,19]. The strong wind caused by the intrusion of severe cold air mass has been widely accepted as the primary factor for the occurrence of sandstorms. The deep and intense downdraughts could be generated by the evaporation of convective precipitation in the deep and dry subcloud layer over deserts regions. A large cool pool could be formed at the surface with a sinking of the cold air [20]. When the cold air mass is strong enough, a strong pressure gradient would be formed to promote the atmospheric circulation [21]. The subsequent unstable surface thermal stratification would then promote the motion of the updraught, which would enhance the disturbance of airflow to the ground [22,23]. However, in arid regions of northwestern China, strong wind is a common occurrence in spring and winter, but not every strong wind could result in the occurrence of dust storm [24]. Statistical results showed that dust storm’s frequency might not match the strong wind’s frequency completely in some arid regions [25]. Therefore, strong cold air mass is not a sufficient condition for a severe sandstorm. Due to the unpredictability and destructiveness of dust storms, their observations are still difficult, leading to a lack of accurate observation data. Through satellite retrievals, a series of pictures of key processes in the atmosphere associated with dust storm have been observed [26]. These cover cold pools of mesoscale convective systems, which show pronounced diurnal and seasonal characteristics. Numerical simulation is certainly the best method to explore the formation mechanism of an LSS [27].
The convective storms are the source of LSS and are characterized by their mesoscale nature [28]. Many researchers have used mesoscale models to simulate the development of an LSS/haboob [28,29,30,31]. Solomos et al. [30] used an integrated atmospheric-air quality RAMS/ICLAMS model to study the formation of a convective pool and the associated dust movement. The model results showed that the increased turbulence near the surface could enhance the dust productivity. The area of maximum dust production was associated with the area of reverse flow behind the leading edge. Besides, the results showed a large portion of particles could be transferred along the mesoscale flow structures, leading to their long range transport [30]. Roberts et al. [28] used a forecasting model (WRF) to analyze the multiscale dynamics to produce a usually large LSS/haboob in their weather research. A regional coupled atmospheric-dust model NMME-DREAM [29,32] was used to simulate the American haboobs. This model could produce an accurate shape, duration and magnitude of the dust storm. However, the small-scale processes in LSS/haboobs were also suggested for further investigation to ascertain the influence of the convective cold pool on the dust uplift behavior.
To further investigate the development of dust storms, high-resolution numerical models are required for the accurate simulation of small-scale processes in haboobs. Recently, the effect of small-scale turbulence and surface heat flux on the evolution of cold pools and dust uplift was presented for the first time [33], using computational fluid dynamic (CFD) analysis based on large eddy simulation (LES). Huang et al. [33] simulated the cold pool outflow in a desert region by adding an idealized cooling in a two-dimension model, considering the local features of haboobs. Their simulation by considering dust as a passive tracer in their shorten duration of simulation runs, illustrated the dust uplift would largely occur at the “head” of the density current, and this was consistent with some existing observations reported in the literature [34]. The increase in the surface heat flux and the increased mixing, similar to those occur in a desert region could slow the density current. Thus, the dust uplift rate would be increased by an increase in the downward transport of momentum to the surface [33]. However, the Huang et al. simulation do not explain clearly the frontier of the density current that is composed of so-called unsteady and shifting lobes and clefts [9,10].
In fact, in addition to the full development of the convection cell structure in the ground mixed layer, the cold pool with a vertical helicity appearing in the upper region of the surface convective mixing layer would be the key factor that triggers LSS. When the movement of the cold pool reaches a certain value, the convective cell structure would be transformed from a common cell to a swirling convective cell [35,36]. The meteorological characteristics during sandstorm processes was illustrated by modeling calculations and analyses of atmospheric dynamics and thermal parameters based on observation in the variation of surface meteorological factors and near-surface dust concentrations in a severe sandstorm that occurred in Minqin County, China on 24 April 2010 [37]. The study found that the intensity of LSS had a good correlation with the helicity of the dust storm. Besides, the report of the 5 July 2011 dust storm by the US National Weather Service (NWS) forecast office [38] described a solenoidal circulation that occurred within a cool pool. The solenoidal circulation is a horizontal vortex and could be visible from the simulated streamlines [31]. The centre of rotation was at about 1 km height. Therefore, the effect of the rotation characteristic in the cooling should be considered in the high-resolution numerical simulation of severe local dust storms.
This study, a high-resolution numerical model for the accurate simulation of small-scale processes in the evolution of LSS was established by considering a cold pool with a vertical helicity (the vorticity), that could be formed due to the interaction of a mesoscale cold pool with small-scale thermal convective cells. The relationship between the vorticity of the low-speed cold pool and the turbulence intensity of the surface of dust sources and their influence on the occurrence of haboobs were analyzed. From our modeling results, a description of the meso- and small-scale coupling evolution process of LSS has been introduced to strengthen our understanding of the formation of LSS.
2. Numerical Simulation Model Setup and Algorithms
2.1. Physical Modeling
The three-dimensional cylindrical numerical model that was established to simulate the formation of LSS is shown in Figure 2a. Due to the complexity of the flow and heat transfer inside the LSS, some simplifications in the simulation about the actual flow of the LSS were made.
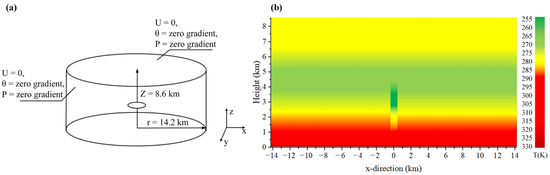
Figure 2.
Initial and boundary conditions in a three-dimensional cylindrical model. (a) A simulated cold pool with vertical vortex was initially located at the model centre; (b) The initial temperature field of the cylindrical computational model in its radial direction.
A cold pool, initially located at the centre, was introduced in the simulation. The cold pool was assumed to not move horizontally, that is, there is no horizontal wind to promote the movement of the cold vortex. According to the dwelling characteristics of the cold pool, the cold pool was elaborately set as an axisymmetric vertical vortex, this was used as a power source to induce the occurrence of an LSS.
Based upon some field observations of LSS and simulations in convective boundary layer scale (CBL) [39], a cylinder domain with radius r = 14.2 km and height z = 8.6 km was used to simulate the development of an LSS in this study. The whole calculation domain was divided into two functional parts: the part of r > 6.5 km and z > 4.5 km was set as the peripheral buffer domain, to numerically prevent the interference from the outer to the inner flow field. The part of r ≤ 6.5 km and z ≤ 4.5 km, was the main domain of the concerned numerical dust storm.
As shown in Figure 2a, the ground and top boundary surfaces were all set as non-slip boundary conditions. The velocity of the airflow (U) at the boundary surfaces of the computational domain was set as zero. The temperature (T) and pressure (P) of airflow were taken to be zero-gradient at the boundary.
Except in the ground layer, there was no heat flux interaction between the calculation domain and the surrounding environment. In hot deserts the surface temperature could exceed 60 °C in the early afternoon [40]. A constant heat source of 333 K on the ground was set in our simulation, with a reference to the average temperature of the ground heat flux that was observed at noon during spring–summer seasons [34,39]. The initial near-surface layer of an LSS, therefore, could be regarded as a natural thermal convection.
Figure 2b shows the initial temperature distribution of the calculation domain. In the viewpoint of CFD, the temperature distribution of the peripheral buffer domain needs to be set as follows: for the buffer layer at the height from 4500 to 6500 m, a temperature inversion layer was set with a temperature increment of 1 K km−1 and for the buffer layer at a height from 6500 to 8600 m, the air temperature was set constant, 274 K. Besides, for the radial peripheral region of 6.5 km ≤ r ≤ 14.2 km, the radial grid length was set with a 1.2 fold geometric sequence.
Huang et al. [33] used an idealized cooling in their modeling to generate the cold pool, as they found their model never reached wet saturation and switching off moist processes. In this simulation, all moist processes were not considered as well. The cold pool with a diameter of 1000 m was located in the layer at a height of 2600–3500 m at the centre of the domain [2,41]. The cold pool has a temperature of 253 K and a vorticity of 0.02 rad s−1. The vertical temperature distribution below the cold pool from the ground surface to 1000 m was set in our study at 290 K. The simulation included a temperature decline rate of 5 K km−1 from 1000 to 2600 m, and 5.33 K/100 m from 2000 to 2600 m. The vertical temperature distribution above the cold pool was set with a temperature increment of 2.0 K/100 m from 3500 to 4500 m. At the outside of the cold pool, the temperature was set to 290 K in the layer 1000 m above the ground level. A temperature decline at a rate of 4.86 K km−1 was set for the 1000–4500 m height layer. The ground heat flux of 250 W m−2 was evaluated, which corresponds with the given ground temperature. A disturbance of the ground temperature was set to induce the heat convection of the near-surface mixing layer.
2.2. Governing Equations
There are two CFD methods for high-resolution numerical simulation of turbulence: Large eddy simulation (LES) and Reynolds average Navier–Stokes (RANS). The RANS simulation adopts mean flow equations to determine averaged solutions to the Navier–Stokes equations, which can be approximated using computational techniques [42]. Although LES could better capture the fluctuation of the flow field in comparison to RANS, it is computationally more expensive [42]. In fact the RANS method is sufficient for most high-resolution numerical simulations of turbulence, because it can supply adequate information about the turbulent process [43]. In our study, a standard k–ε model in RANS was used to enhance the calculation speed and the reliability of the simulation, due to our requirement to consider a large scale region for our simulation. The governing Equations (1)–(5) are as follows.
Equations (1) and (2) are continuity and momentum equations, respectively. Here, Ui and are the mean and fluctuating velocity in the xi-direction; ρ is the fluid density; ν is the kinematic viscosity; β is the thermal expansion coefficient; g is gravitational acceleration; Tc is the fluid temperature and T0 is the buoyancy reference temperature. P is the mean pressure.
Equations (3) and (4) are the transport equations for the turbulent kinetic energy k and the turbulence dissipation rate ε. Equation (5) is the equation of state. R is the gas constant, 287.06 J kg−1 K−1. The turbulent diffusion of k and ε in Equations (3) and (4), respectively, are represented using a gradient diffusion hypothesis with the Prandtl numbers σk and σk to connect the eddy diffusivities of k and ε to the eddy viscosity νT.
The Boussinesq type of eddy viscosity approximation of Equation (6) was applied as a turbulence closure model, which assumes a linear relationship between turbulent stresses and mean velocity gradients [44]:
where δij is the Kronecker delta.
The kinematic energy k is defined by Equation (7), as,
The kinematic eddy viscosity νT is determined by Equation (8) as,
The constant values of the k–ε turbulence model used are shown as below:
Based on the open-source CFD toolbox, OpenFOAM, a PIMPLE algorithm [45] was used to solve these governing equations. The standard k–ε model in RANS was used to calculate the turbulence. The convection term was analyzed using the first-order upwind difference scheme. The non-uniform grid was adopted with a grid number of about 2,600,000. The grids near the ground in the LSS were refined to capture flow details in the simulation.
The Boussinesq postulation was adopted to formulate the buoyancy effect due to the temperature difference. For the boundary air flows, non-slip wall conditions were set in simulation.
3. Results and Discussion
A cold pool is generally produced by downdraughts of convective storms. Surface heat fluxes could impact cold pool dissipation by enhancing turbulence and entrainment of environmental air into the cold pool. A meso- and small-scale coupling evolution process of LSS was developed in our previous study [46] by considering the surface radiation in the dust source region, the movement of thermal convection cells and formation conditions of the swirling thermal convection cells. The evolution process is associated with the interaction between a mesoscale cold pool and small-scale convective cells and the microscopic mechanism of wind–sand movement in swirling wind fields. Generally, due to differences in the surface albedo in the desert area, the near-surface mixing atmosphere layer is unevenly heated. Thus, there occurs local thermal circulation with small-scale thermal convection cells structure in the near-surface mixing layer.
The vorticity of the cold pool would spread downwards as a mesoscale cold pool has penetrated into the upper region of the surface convective mixing layer, causing a vertical instability in the thermal convection cells and an onset of swirling convection cells. A strong wind shear on the ground surface was formed with the swirling convection cells, to cause saltation of dust particles to move along the ground surface [47]. Extensive research has been done based on atmosphere boundary layer wind tunnels on the lifting effect of the wind shear [48,49]. The larger sand-sized particles would be lifted by the horizontal wind initially [50]. However, these particles would return to the surface after dispersion and the cascade effect would impart a kinetic energy to smaller lighter particles, which would become suspended in the atmosphere due to the imparted momentum. The swirling convection cells would act as an important transporting media to raise the dust grains up to high levels [47]. Besides, a stronger LSS would occur due to the larger temperature difference between the cold pool and thermal convection cells.
The formation mechanism [46] provides a description of the evolution process of LSS. In this study, a numerical simulation was used to describe different stages of the evolution process of the atmospheric wind field under conditions of an LSS generation.
The evolution process of LSS was divided into three stages. The initial stage of LSS is characterized by a decline of the cold pool and the transfer of the thermal convection cell in the ground mixed layer to swirling convection cells. The developed stage of LSS is characterized by the occurrence of the secondary vortices generated by the interaction of the downdraught of the central cold vortex with the severe annular shear flow in the periphery. In the decaying stage of LSS, the energy dissipation of the secondary vortices is enhanced owing to the moving dust particle, mixing and colliding with the air flows as the LSS tends to dissipate to extinction.
A numerical simulation of the flow field evolution of LSS was carried out in this study. The whole calculation time took 2500 s (41 min and 40 s). The simulation results show that the wind velocity in the whole field would gradually increase with the development of an LSS. The cold pool at the centre would sink close to the ground, and the sinking velocity of the cold pool would be rapid, with a maximum vertical descending velocity of up to 34 m s−1. In fact, after the strong descending motion appeared, LSS was found to become initialized [51]. After 1500 s (25 min), the kinetic energy of the whole wind field reaches a peak value, thereafter, the kinetic energy would dissipate and the LSS would enter into the decay stage.
3.1. The Initial Stage of LSS Development
Figure 3 shows the air temperature field and streamlines in the vertical section of the calculation domain at different times of the initial stage of LSS development. The downdraught of the cold pool and the subsequent outflows near the ground surface was shown to play an important role in the structure of local dust storms on all scales.
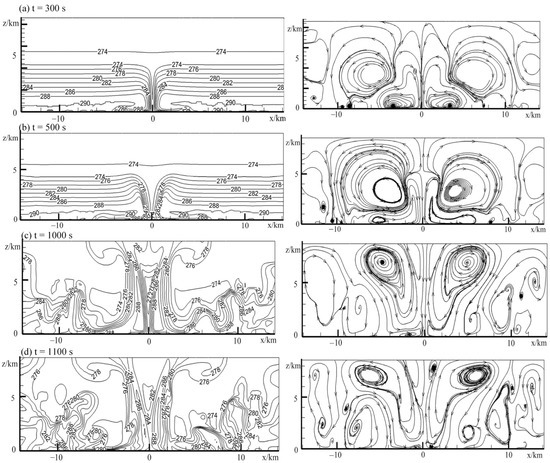
Figure 3.
The air temperature and streamlines in the central vertical plane z–x at different times of the initial stage of LSS development. (a) t = 300 s; (b) t = 500 s; (c) t = 1000 s and (d) t = 1100 s.
After t = 300 s (Figure 3a), the cold pool would sink to the ground. The cold air mass of the cold pool would descend and push away the hot air in the near-surface mixing layer and spreads on the ground surface once it hits the ground surface. Two near-surface main cold vortices would occur at the centre with a radius of about 2000 m, while two hot vortices in the upper region would occur due to the divergence of the cold air mass on the ground, which induce the hot air at the cold/hot air junction to be lifted by the cold air.
After t = 500 s (Figure 3b), the divergence of the cold mass would further expand up to the region with a radius of about 6000 m. Characteristically, the cold pool is a horizontal spread of a flat layer of a cold air mass to fully reach the ground, while the upper opposite vortices would become larger. The entrainment of upper vortices would cause more lateral downdraught. The current cold pool and the outflows would become unstable and the air in the entire flow field would become convective.
After t = 1000 s (Figure 3c), the cold pool would be split up, and thermal convection cells would be formed in the field. Among the thermal convection cells, the upper opposite vortices would descend to the ground as the alternative convection cells.
After t = 1100 s (Figure 3d), the thermal convection cells would enhance the heat transfer, the entrainment of convection cells would cause more downdraught of cold air arriving to the ground surface. The air temperature in the flow field below 3000 m would be lower than the air temperature after 1000 s.
3.2. Fully Developed Stage
Figure 4 shows the entire airflow field at the full development stage of an LSS (t = 1500 s), illustrating the characteristics of an LSS at the full development stage. As shown in Figure 4a, the initial stratified distribution of temperature would be fully destroyed as a result of the thermal convection cells. This deep convection is crucial to the formation of LSS [1]. The near-surface temperature would decline by more than 10 K, which is consistent with previous observations [1,3,30,52,53,54].
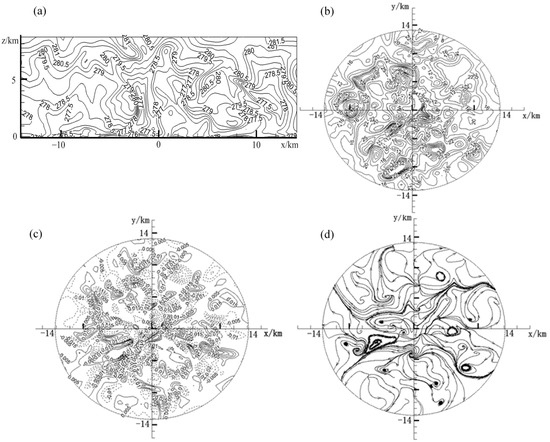
Figure 4.
Air flows field at t = 1500 s. (a) Air temperature in the central vertical plane z–x; (b) horizontal velocity contours in the x–y plane, z = 1000 m; (c) vertical vorticities in the x–y plane, z = 1000 m and (d) streamlines in the x–y plane, z = 1500 m.
Figure 4b shows the horizontal velocity contours at a height of 1000 m at a wind speed of about 10–30 m s−1. According to observation data of an LSS, the instantaneous maximum wind speed would be more than 25 m s−1 and the visibility would be less than 50 m [2], therefore, indicating that our numerical LSS was in the full development stage.
Figure 4c shows the vorticity contours at the height of 1000 m. The vorticity was determined by Equation (10):
The vorticity contours feature lots of vortices with different sizes, and the vortices near the centre of the calculation domain are dense. The formations of these dense vortices are still closely related to the initial cold vortex.
The streamlines at a height of 1500 m in Figure 4d show that there are many vortices with different diameters. However, the number of vortices at a height of 1500 m is less than those at 1000 m height. In particular, subvortices (secondary vortex) can be observed in the main vortex. The appearance of these subvortices is caused by the motion of the central cold vortex. This inevitable phenomenon is generated by a common action of the cyclonic cold pool downdraught in the core of the calculation domain and the severe annular shear flow in the periphery. The entire domain is dominated by the centrally swirling downdraught and the peripherally swirling updraught, a stronger shear would thus occur in the air flow field, which is the principal cause of turbulence. The occurrence of periodic vortices in the horizontal mixing layer is due to the tangential shearing motion in the annular shear flow region. When the shearing motion is very strong, the originally stable shear flow would become very turbulent, and the laminar flow would then transition to become the turbulent flow, producing secondary vortices, i.e., subvortices. Compared Figure 4b,d, more vortices would appear at a height of 1000 m, indicating that subvortices would mainly concentrate in the near-surface mixing layer.
In fact, the existence of these subvortices is closely related to the decay of an LSS. When an LSS occurs, many “waves” appear at the front end, and these "waves" would be originated from numerous subvortices. The LSS vortices in a different intensity are consistent with reported observations [5,55,56].
According to the observation of an LSS event in Baiyin City, Gansu Province, China on 5 May 1993 [57], the dense dust wall of the LSS was about 300 m high and a diameter of about 700–800 m. Prior to the arrival of the LSS, the air in the near-surface layer was extremely unstable. In an LSS, the cascade fall of dust from the dust wall would indicate the occurrence of a strong convective air current [58]. From the observation of an LSS in Alar City, Xinjiang Province, China on 6 April 2019 [11], the front edge of the sandstorm would have “lobes” pattern.
Usually, the sinking of a cold pool is called a downburst. Sometimes the downburst would cause a devastating storm on the earth surface. The dust storm could be created by high surface winds generated from strong downbursts of cold air. A high wind velocity over the bare and dry land would create favorable conditions for intense dust uptake and transport [31]. The generation of the strong wind is not due to the large vorticity, but due to the flow of a negative buoyant air, which would commence decay after it has travelled a few hundred meters away from the earth surface. The vertical acceleration of a typical microburst is about 0.01 g (g is gravitational acceleration). This acceleration is generated because the temperature of the downburst is lower than the temperature of the surrounding air [59]. The lower temperature and higher density of cold air would fall to the ground and would be replaced by the hot air at a higher temperature and then expand on the ground. The fall of cold air tends to concentrate on the gust front as the cold front advances, forming a density current head, as shown in Figure 5a [60].
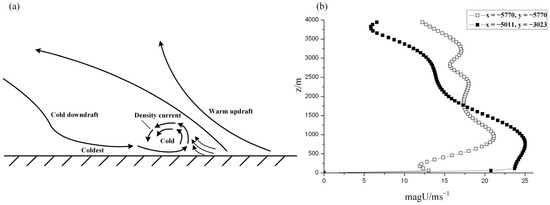
Figure 5.
(a) Schematic diagram of the front lobe of a dust storm. A downdraft of cold air that spreads out along the ground and moves forward to form a density current, which could pick up loose dust and sand from the surface. The dense cold air pushes up warmer air, which it meets, thereby reinforcing the warm updraft (modified after Idso, S.B. 1976, Sci. Am. 235, 108–114). (b) The resultant wind velocity profiles at different altitude over two positions (x = −5770 m, y = −5770 m; and x = −5011 m, y= −3023 m) at t = 1500 s in the RANS simulation of LSS.
However, in our simulation, characteristically, the initial stage of an LSS is the dissipation of a cold pool and a transfer of the thermal convection cell in the surface mixing layer to swirling convection cells. The developed stage of an LSS is characterized by the occurrence of secondary vortices generated by the interaction of the severe annular shear flow with the downdraught of the central cold vortex at the periphery. Figure 5b shows the resultant wind velocity profiles at different altitudes over two positions at t = 1500 s. Two vertical line positions (x = −5770 m, y = −5770 m; and x = −5011 m, y= −3023 m) around the cold pool centre were picked up. The remarkable feature of these velocity profiles is their "lobes" shape and their frontal pressure are very large, that conforms to the shape of the density current head shown in Figure 5a. The circulation velocity of the airflow would exceed the forward speed of the front lobes. An uplift of a significant amount of dust would be formed as the cold air at the lobe of the frontal area meets the warm air to generate a horizontal vortex [31]. This heating uplift is consistent with the observation [34] and the convection-permitting model reported [61]. The spread of the dust ejected in an LSS corresponds with wind velocity, therefore, the higher the resultant wind the farther away the gust of dust would be carried.
The environmental conditions would have an impact on the flow direction of the dense dust current. As the down pouring of the cold air gathering the dust mass around in a cyclical shape, the propagating front is lobe-shaped rather than linear. The characteristics of resultant velocities at different altitudes over two positions are in good agreement with the morphological characteristics of the leading edge of the “93.5” and “18.11” mega-dust storms [11,57].
3.3. The Decay Stage
Figure 6 shows the horizontal velocity field at a height of 1000 m after t = 2500 s. When t = 2500 s, the entire near-surface wind was below 10 m s−1, that is, the wind was between 2 and 5 levels. Subsequently, the entire energy of a numerical LSS was exhausted and went into the decay and extinction stage.
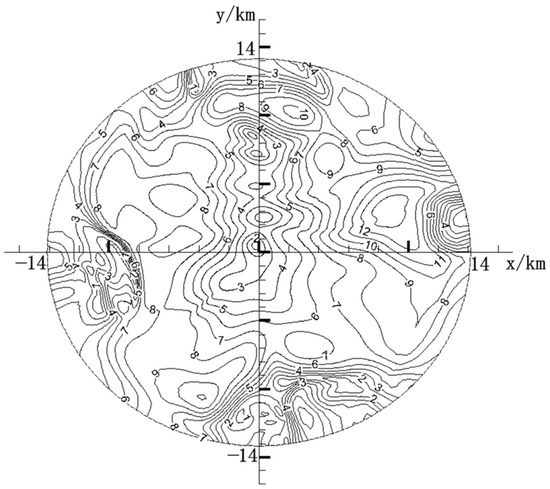
Figure 6.
Horizontal velocity contours in the x–y plane, z = 1000 m, at t = 2500 s.
The energy dissipation mechanism of an LSS can be reasonably explained by the development of many subvortices as shown in Figure 4. The energy of an LSS could be exhausted by the gas–solid two-phase interaction and the evolution of numerous secondary vortices in different sizes in the flow field.
4. Effects of Cold Pool with a Different Temperature Inversion Layer
The evolution of a numerical LSS under a cold pool with a diameter of 2000 m was also simulated. The physical conditions and boundary conditions were the same as those for the numerical simulation of an LSS under the action of a cold pool with a diameter of 1000 m. The differences in the initial condition were as follows: for the buffer layer at the height from 4500 to 6500 m, a temperature inversion layer was set with a temperature increment of 5 K km−1; and for the buffer layer at a height of 6500–8600 m, the air temperature was set constant, at 280 K. In this case, t = 1000 s, the kinetic energy of the whole wind field would reach a peak value, thereafter, the kinetic energy would dissipate and the LSS would advance into the decay stage.
Figure 7 shows the entire airflow field at the full development stage of a numerical LSS (t = 1000 s). From the temperature distribution (Figure 7a), there is an obvious temperature difference between the central region and surrounding atmosphere. Compared with the simulation result under the action of a cold pool with a diameter of 1000 m, the flow in the wide central region would be more intense. Figure 7b shows the horizontal velocity contours at a height of 1000 m and the maximum wind speed is greater than 25 m s−1. The vorticity contours (Figure 7c) show different size dense vortices at the centre of the calculation domain. These dense vortex formations were closely related to the initial swirling of the cold pool. The streamlines in Figure 7d illustrate that there were many vortices of unequal diameter at 1500 m height. Compared with the numerical simulation of an LSS caused by the cold pool with a diameter of 1000 m, the vorticity intensity was stronger and many more subvortices would be generated in this case.
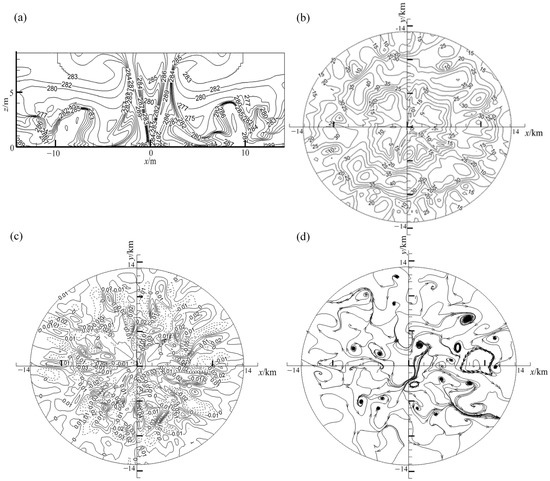
Figure 7.
The air flows field at t = 1000 s under the action of a cold pool with a diameter of 2000 m. (a) Air temperature in the central vertical plane z–x; (b) horizontal velocity contours in the x–y plane, z = 1000 m; (c) vorticity contours in the x–y plane, z = 1000 m and (d) streamlines in the x–y plane, z = 1500 m.
Figure 8 shows the resultant wind velocity profiles at a different altitude over two positions at t = 1000 s. Two vertical line positions (x = 657 m, y = 3688 m, and x = −5398 m, y = 751 m) around the cold pool centre were picked up. The maximum wind velocity and locations at a height were both greater than the action of the cold pool with a diameter of 1000 m. The velocity profiles were also similar to the shape of the density current head shown in Figure 5a, which contributes to dust uplift from the surface.
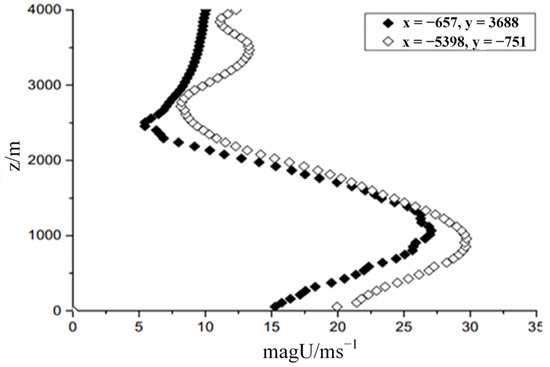
Figure 8.
The resultant wind velocity profiles at different altitude over two positions (x = 657 m, y = 3688 m, and x = −5398 m, y = 751 m) at t = 1000 s.
5. Summary and Conclusions
This study used the RANS method to simulate the small-scale process of an LSS, and explained the formation of “lobes” at the leading edge of an LSS. The microscopic mechanism of wind–sand movement in swirling wind fields is responsible for the evolution process of an LSS, which is formed by the interaction of a mesoscale cold pool with small-scale convective cells. The differences in the surface albedo in the desert area would cause an unevenly heating in the near-surface mixing atmosphere layer. Once a mesoscale cold pool enters into the upper region at the surface of the convective mixing layer, the vorticity of the cold pool would spread downwards and cause thermal convection cells to become vertically unstable, leading to an onset of swirling convection cells. For the swirling convection cells, there is a strong wind shear on the ground surface to cause a saltation of dust particles and spread along the ground surface. These smaller particles would then enter into suspension due to the imparted momentum. The evolution process of LSS was investigated in this study using the RANS method. The simulation of a numerical LSS, having a cold pool with a diameter of 1000 m and 2000 m, respectively, were carried out to analyze numerically the evolution process in three stages during an LSS.
During the initial stage of an LSS, the cold pool would first sink close to the ground. The downdraught of the cold pool and the outflow near the ground surface would have an important role in the structure of a local dust storm in all scales. After the cold pool fully reaches the ground, the flat layer of the cold air mass would spread horizontally, while the upper opposite vortices would become larger, and more lateral downdraught would be formed by the entrainment. The cold pool current and the outflows would become unstable and the air in the entire flow field would become convective. In the end of the initial stage of an LSS, the cold pool would be split up, and thermal convection cells would occur in the field. Among the thermal convection cells, the upper opposite vortices would descend to the ground as alternative convection cells. The initial stratified distribution of temperature would become fully destroyed due to these thermal convection cells.
The fully developed stage of an LSS was characteristically linked to the occurrence of numerous subvortices (secondary vortices). These subvortices would be generated by the sinking airflow of the cold pool and the violent annular shear flow in the periphery. These numerous subvortices would cause occurrence of many “lobes” that propagate at the front of an LSS.
During the decay stage of an LSS, the quick dissipation of LSS energy would occur due to interactions of dust-air two-phase flows with the action of secondary vortices. The vorticity that is transmitted through the thermal convection cell, would cause the thermal convection cell in the near-surface mixing layer to transform into swirling convective cells.
For a further understanding of the evolution of an LSS, further numerical simulations would be needed with a presence of multiple cold pools, with a variation in the intensity and height of a cold pool. The relationship between the movement of the cold pool with the occurrence of an LSS should also be analyzed. In addition, further simulations would be needed to investigate the effect of larger volume more dust particles in the simulation model to predict the occurrence of LSS according to dust quantities.
Author Contributions
Formal analysis, W.L. and R.Z.; investigation, Z.G.; methodology, Q.S.; software, Y.H.; supervision, D.Z.; validation, B.L.; writing—original draft, Y.H.; writing—review and editing, C.W.Y. All authors have read and agreed to the published version of the manuscript.
Funding
This study was financially supported by Central Asian Research Fund for Atmospheric Science (CAAS201702, Numerical simulation of the triggering mechanism and evolution of black storms), and the National Natural Science Foundation of China (No. 11872295).
Conflicts of Interest
The authors declare no conflict of interest.
References
- Takemi, T. Structure and Evolution of a Severe Squall Line over the Arid Region in Northwest China. Mon. Weather Rev. 1998, 127, 1301–1309. [Google Scholar] [CrossRef]
- Hu, Y.; Mitsuta, Y. Micrometeorological characteristics and local triggering mechanism of strong dust storm. Sci. Atmos. Sin. 1997, 21, 581–589. (In Chinese) [Google Scholar]
- Hu, Y.; Mitsuta, Y. Development of the strong dust storm and dry soluall line—a mechanism analysis on generating black storm. Plateau Meteorol. 1996, 15, 178–185. (In Chinese) [Google Scholar]
- Lawson, T.J. Haboob structure at khartoum. Weather 2012, 26, 105–112. [Google Scholar] [CrossRef]
- Lorenz, R.D.; Balme, M.R.; Gu, Z.; Kahanpää, H.; Klose, M.; Kurgansky, M.V.; Patel, M.R.; Reiss, D.; Rossi, A.P.; Spiga, A.; et al. History and Applications of Dust Devil Studies. Space Sci. Rev. 2016, 203, 5–37. [Google Scholar] [CrossRef]
- Prospero, J.M.; Ginoux, P.; Torres, O.; Nicholson, S.E. Environmental Characterization of Global sources of atmospheric soil dust derived from the NIMBUS-7 TOMS absorbing aerosol product. Rev. Geophys. 2002, 40, 2-1-2-31. [Google Scholar] [CrossRef]
- Sutton, L.J. Haboobs. Q. J. R. Meteorol. Soc. 1925, 51, 25–30. [Google Scholar] [CrossRef]
- Idso, S.B.; Ingram, R.S.; Pritchard, J.M. An American Haboob. Bull. Am. Meteorol. Soc. 1972, 53, 930–935. [Google Scholar] [CrossRef]
- Härtel, C.; Carlsson, F.; Thunblom, M. Analysis and direct numerical simulation of the flow at a gravity-current head. Part 2. The lobe-and-cleft instability. J. Fluid Mech. 2000, 418, 213–229. [Google Scholar] [CrossRef]
- Simpson, J.E. The effect of the lower boundary on the head of a gravity current. J. Fluid Mech. 1972, 53, 759–768. [Google Scholar] [CrossRef]
- Overwhelming! A Sandstorm Quickly Engulfed Zhangye City, Gansu Province. Available online: http://news.163.com/18/1126/12/E1HNLG8L0001875P.html#p=E1HIN9KM00AP0001NOS (accessed on 26 November 2018).
- Yang, M.; Cai, Y.; Wang, S.; Li, W.; Shang, K.; Dong, G. Synoptic and climatological analysis of sandstorms in the spring of 2000 over northern China. J. Desert Res. 2001, 21, 6–11. (In Chinese) [Google Scholar]
- Zhang, R.; Han, Z.; Wang, M.; Zhang, X. Dust storm weather in China: New characteristics and origins. Quat. Sci. 2002, 22, 374–380. (In Chinese) [Google Scholar]
- Liu, J.; Zhengm, M. Climate characteristics of strong and very strong sandstorms in the middle and west parts of inner Mongolia. Plateau Meteorol. 2003, 22, 51–64. (In Chinese) [Google Scholar]
- Lin, Z.; Chen, H.; Zhang, S.; Xu, X. Climatic and environmental background for the anomalous spring sandstorms over the northern China during 2003. Clim. Environ. Res. 2004, 9, 191–202. (In Chinese) [Google Scholar]
- Li, Y.; Zhao, G.; Hu, W.; Li, Y. Characteristic of main meteorological element changes and cause analyses during sand dust storm process in middle and northern parts of Ningxia. Plateau Meteorol. 2005, 24, 86–91. (In Chinese) [Google Scholar]
- Brazel, A.J.; Nickling, W.G. The relationship of weather types to dust storm generation in Arizona (1965–1980). J. Climatol. 2010, 6, 255–275. [Google Scholar] [CrossRef]
- Knippertz, P. Meteorological Aspects of Dust Storms; Springer: Dordrecht, The Netherlands, 2014. [Google Scholar]
- Wang, R.; Liu, B.; Li, H.; Zou, X.; Wang, J.; Liu, W.; Cheng, H.; Kang, L.; Zhang, C. Variation of strong dust storm events in Northern China during 1978–2007. Atmos. Res. 2017, 183, 166–172. [Google Scholar] [CrossRef]
- Knippertz, P.; Trentmann, J.; Seifert, A. High-resolution simulations of convective cold pools over the northwestern Sahara. J. Geophys. Res. Atmos. 2009, 114. [Google Scholar] [CrossRef]
- Simpson, J.E. Gravity currents. In The Environment and The Laboratory, 2nd ed.; Cambridge University Press: Cambridge, UK, 1997; p. 244. [Google Scholar]
- Ma, X.; Dang, Y. Diagnostic analyses on gale and dust Storm processes in Qinghai province on 19 March 2010. Qinghai Sci. Technol. 2011, 18, 20–23. (In Chinese) [Google Scholar]
- Cowie, S.M.; Marsham, J.H.; Knippertz, P. The importance of rare, high-wind events for dust uplift in northern Africa. Geophys. Res. Lett. 2015, 42, 8208–8215. [Google Scholar] [CrossRef]
- Xia, S.; Yang, G. Sandstorm Disaster and Prevention in Northwest China; China Environmental Science Press: Beijing, China, 1996; pp. 5–11. (In Chinese) [Google Scholar]
- Ding, R.; Zhang, D.Y.; Liang, J.N.; Zhou, Y.L. Weather Background Analysis of Gale and Duststorms in Recent 45 Years and Short-term Forecast Method in Central Hexi Corridor of Gansu Province. J. Desert Res. 2006, 26, 792–796. [Google Scholar]
- Knippertz, P.; Todd, M.C. Mineral dust aerosols over the Sahara: Processes of emission and transport, and implications for modeling. Rev. Geophys. 2012, 50. [Google Scholar] [CrossRef]
- Beegum, S.N.; Gherboudj, I.; Chaouch, N.; Temimi, M.; Ghedira, H. Simulation and analysis of synoptic scale dust storms over the Arabian Peninsula. Atmos. Res. 2018, 199, 62–81. [Google Scholar] [CrossRef]
- Roberts, A.J.; Knippertz, P. The formation of a large summertime Saharan dust plume: Convective and synoptic-scale analysis. J. Geophys. Res. Atmos. 2014, 119, 1766–1785. [Google Scholar] [CrossRef] [PubMed]
- Janjic, Z.I.; Gerrity, J.P., Jr.; Nickovic, S. An Alternative Approach to Nonhydrostatic Modeling. Mon. Weather Rev. 2001, 129, 1164–1178. [Google Scholar] [CrossRef]
- Solomos, S.; Kallos, G.; Mavromatidis, E.; Kushta, J. Density currents as a desert dust mobilization mechanism. Atmos. Chem. Phys. 2012, 12, 11199–11211. [Google Scholar] [CrossRef]
- Vukovic, A.; Vujadinovic, M.; Pejanovic, G.; Andric, J.; Kumjian, M.R.; Djurdjevic, V.; Dacic, M.; Prasad, A.K.; El-Askary, H.M.; Paris, B.C.; et al. Numerical simulation of “an American haboob”. Atmos. Chem. Phys. 2014, 14, 26175–26215. [Google Scholar] [CrossRef]
- Pérez, C.; Nickovic, S.; Baldasano, J.M.; Sicard, M.; Rocadenbosch, F.; Cachorro, V.E. A long Saharan dust event over the western Mediterranean: Lidar, Sun photometer observations, and regional dust modeling. J. Geophys. Res. Atmos. 2006, 111, D15214. [Google Scholar] [CrossRef]
- Huang, Q.; Marsham, J.; Tian, W.; Parker, D.; Garcia-Carreras, L. Large eddy simulation of dust-uplift by haboob density currents. Atmos. Environ. 2018, 179, 31–39. [Google Scholar] [CrossRef]
- Allen, C.J.T.; Washington, R.; Engelstaedter, S. Dust emission and transport mechanisms in the central Sahara: Fennec ground-based observations from Bordj Badji Mokhtar, June 2011. J. Geophys. Res. Atmos. 2013, 118, 6212–6232. [Google Scholar] [CrossRef]
- Yun, J.B.; Jiang, X.G.; Meng, X.F.; Xue-Hong, W.U.; Ying, C. Comparative Analyses on Some Statistic Characteristics between Cold Front and Mongolia Cyclone Duststorm Processes. Plateau Meteorol. 2013, 32, 423–434. [Google Scholar]
- Takemi, T.; Seino, N. Dust storms and cyclone tracks over the arid regions in east Asia in spring. J. Geophys. Res. Atmos. 2005, 110. [Google Scholar] [CrossRef]
- Zhao, X.; Li, Y.; Kang, F.; Yi, H. Analysis on the strong sandstorm in minqin on April 24, 2010. J. Arid Land Resour. Environ. 2012, 26, 40–46. (In Chinese) [Google Scholar]
- NWS. 2011. Available online: http://www.wrh.noaa.gov/psr/pns/2011/July/DustStorm.php (accessed on 7 July 2011).
- Li, J. Desert Climate; China Meteorological Press: Beijing, China, 2002. (In Chinese) [Google Scholar]
- Pye, K. Aeolian Dust and Dust Deposits; Academic Press: London, UK, 1987. [Google Scholar]
- Kanak, K.M.; Lilly, D.K.; Snow, J.T. The formation of vertical vortices in the convective boundary layer. Q. J. R. Meteorol. Soc. 2000, 126, 2789–2810. [Google Scholar] [CrossRef]
- Salim, S.M.; Buccolieri, R.; Chan, A.; Sabatino, S.D. Numerical simulation of atmospheric pollutant dispersion in an urban street canyon: Comparison between RANS and LES. J. Wind Eng. Ind. Aerodyn. 2011, 99, 103–113. [Google Scholar] [CrossRef]
- Versteeg, H.K.; Malalasekera, W. An Introduction to Computational Fluid Dynamics: The Finite Volume Method; Pearson Education: New York, NY, USA, 2007. [Google Scholar]
- Cindori, M.; Juretić, F.; Kozmar, H.; Džijan, I. Steady RANS model of the homogeneous atmospheric boundary layer. J. Wind Eng. Ind. Aerodyn. 2018, 173, 289–301. [Google Scholar] [CrossRef]
- Mohammadi, M.A.; Jafarian, A. CFD simulation to investigate hydrodynamics of oscillating flow in a Beta-type Stirling engine. Energy 2018, 153, 287–300. [Google Scholar] [CrossRef]
- Gu, Z. Wind-Blown Sand: Near-Surface Turbulence and Gas-Solid Two-Phase Flow; Science Press: Beijing, China, 2010. (In Chinese) [Google Scholar]
- Gu, Z.; Zhao, Y.; Yun, L.; Yu, Y.; Xiao, F. Numerical Simulation of Dust Lifting within Dust Devils—Simulation of an Intense Vortex. J. Atmos. Sci. 2006, 63, 2630–2641. [Google Scholar] [CrossRef]
- Dong, Z.; Liu, X.; Wang, H.; Zhao, A.; Wang, X. The flux profile of a blowing sand cloud: A wind tunnel investigation. Geomorphology 2003, 49, 219–230. [Google Scholar] [CrossRef]
- Ni, J.R.; Li, Z.S.; Mendoza, C. Vertical profiles of aeolian sand mass flux. Geomorphology 2003, 49, 205–218. [Google Scholar] [CrossRef]
- Greeley, R.; Lancaster, N.; Lee, S.; Thomas, P. Martian aeolian processes, sediments, and features. In Mars; Kieffer, H.H., Ed.; The Univ. of Arizona Press: Tucson, AZ, USA, 1992; pp. 730–766. [Google Scholar]
- Jiang, X.G.; Shen, J.G.; Liu, J.T.; Chung, Y.S. Numerical Simulation of Synoptic Condition on a Severe Sand Dust Storm. Water Air Soil Pollut. Focus 2003, 3, 191–212. [Google Scholar] [CrossRef]
- Zhang, X.L.; Cheng, L.; Chung, Y.S. Development of a Severe Sand-dust Storm Model and its Application to Northwest China. Water Air Soil Pollut. Focus 2003, 3, 173–190. [Google Scholar] [CrossRef]
- Mcquaid, J.; Ryder, C.; Sodemann, H.; Garcia-Carreras, L.; Rosenberg, P.; Banks, J.; Brindley, H.; Todd, M.; Engelstaedter, S.; Flamant, C.; et al. Overview and Insights gained by Airborne Observations over the Sahara during Fennec. In European Geosciences Union General Assembly; European Geosciences: Vienna, Austria, 2013; p. 10301. [Google Scholar]
- The Temperature in Jinchang City, Gansu Province has Dropped 10–15 Degrees Celsius after a Strong Sandstorm. Available online: https://weather.mipang.com/shaoxing/news-1809468.html (accessed on 2 November 2012).
- Metzger, S.M.; Balme, M.; Farrell, W.M.; Fuerstenau, S.; Greeley, R.; Merrison, J.; Patel, M.; Ringrose, T.; Towner, M.; Zarnecki, J. Resolving Codependent Processes Within Natural Dust Devil Vortices; American Geophysical Union: Washington, DC, USA, 2004. [Google Scholar]
- Marsham, J.H.; Hobby, M.; Allen, C.J.T.; Banks, J.R.; Bart, M.; Brooks, B.J.; Cavazos-Guerra, C.; Engelstaedter, S.; Gascoyne, M.; Lima, A.R.; et al. Meteorology and dust in the central Sahara: Observations from Fennec supersite-1 during the June 2011 Intensive Observation Period. J. Geophys. Res. Atmos. 2013, 118, 4069–4089. [Google Scholar] [CrossRef]
- Lu, Q.; Yang, Y.; Ci, L. Strong sandstorm disaster and expansion trend of desertification in China. In Alert of Global Sandstorm; China Environmental Science Press: Beijing, China, 2001. (In Chinese) [Google Scholar]
- Lesieur, M. Turbulence in Fluids; Kluwer Academic Publishers: Dordrecht, The Netherlands, 1990. [Google Scholar]
- Parsons, D.B.; Weisman, M.L. A Numerical Study of a Rotating Downburst. J. Atmos. Sci. 1993, 50, 2369–2385. [Google Scholar] [CrossRef][Green Version]
- Idso, S.B. Dust Storms. Sci. Am. 1976, 235, 108–115. [Google Scholar] [CrossRef]
- Heinold, B.; Knippertz, P.; Marsham, J.H.; Fiedler, S.; Dixon, N.S.; Schepanski, K.; Laurent, B.; Tegen, I. The role of deep convection and nocturnal low-level jets for dust emission in summertime West Africa: Estimates from convection-permitting simulations. J. Geophys. Res. Atmos. 2013, 118, 4385–4400. [Google Scholar] [CrossRef]
© 2020 by the authors. Licensee MDPI, Basel, Switzerland. This article is an open access article distributed under the terms and conditions of the Creative Commons Attribution (CC BY) license (http://creativecommons.org/licenses/by/4.0/).