Article

Selected Metals in Urban Road Dust: Upper and Lower Silesia Case Study

by
Justyna Rybak
1,*,
Magdalena Wróbel
1,
Jan Stefan Bihałowicz
2 and
Wioletta Rogula-Kozłowska
2
1
Faculty of Environmental Engineering, Wrocław University of Science and Technology, Wybrzeże Wyspiańskiego 27, 50370 Wrocław, Poland
2
Institute of Safety Engineering, The Main School of Fire Service, 52/54, Słowackiego St., 01629 Warsaw, Poland
*
Author to whom correspondence should be addressed.
Atmosphere 2020, 11(3), 290; https://doi.org/10.3390/atmos11030290
Submission received: 2 February 2020 / Revised: 6 March 2020 / Accepted: 13 March 2020 / Published: 16 March 2020
(This article belongs to the Special Issue Particulate Matters Emission in Poland)

Abstract

:
In this study, urban road dust (URD) samples were collected in two populated agglomerations of Wrocław and Katowice (Lower and Upper Silesia) in Poland. Both the total concentrations of URD-bound Mn, Ni, Cu, Zn, As, Rb, Ba, Cr, Mg, and Al and concentrations of their water-soluble fraction were determined. The contamination characteristics and health risk related to these elements were assessed. Contamination level assessment was done by Pollution Load Index (PLI), which indicated much higher pollution of Katowice agglomeration than Wrocław. The enrichment factor values (EF) showed that the most elements in both Katowice and Wrocław orginated from anthropogenic sources. The calculations of geo-accumulation index (Igeo) showed that Zn and As are the key pollutants in Katowice; and in the Wrocław region, Cu, Zn, Cr, and Ni are. The principle component analysis (PCA) and correlation analysis provide information about the potential sources of metals. Additionally, a positive matrix factorization (PMF) was performed and four factors in PMF analysis were found and then interpreted by comparing to the source profiles. Three contamination sources were revealed: fossil fuel combustion, road traffic and industrial emissions. Although the main source of studied metals in Lower Silesia is road traffic, in Upper Silesia, domestic heating with the use of hard and brawn coal and industrial activity predominates. Human exposure to individual toxic metals through road dust was assessed for both children and adults. By calculating the average daily dose (ADD) via ingestion, inhalation, and dermal contact, it was found that ingestion and then dermal contact were the greatest exposure pathways for humans in Katowice and Wrocław. Children had greater health risks than adults. According to the health risk assessment, the overall non-carcinogenic risks in both urban areas was rather low. The only exception was As bound to urban road dust in Katowice agglomeration, which indicates risk for children when ingested. The total excess cancer risk (ECR) was also lower than the acceptable level (10−6–10−4) for both adults and children, although ECR for Katowice was closer to this limit.

1. Introduction

Poland is one of the three countries with the worst air quality in Europe [1]. Thirty-three of the 50 most polluted European cities of fine particulate matter (PM2.5) are in Poland [2]. Most of them are located in the south of the country.
Many previous scientific papers focused on the chemical composition and origin of PM in various cities in Poland [3,4,5,6,7,8,9,10]. It has been proved that the problem with exceeding the limits of air concentrations, including carcinogenic, potentially carcinogenic or toxic compounds results mainly from burning of fossil fuels. This problem is present all year round and applies to the whole of Poland. Although, the strongest impact is observed in the cold season (late autumn, winter and early spring) when energy consumption is the highest. In some regions of the country with the beginning of the heating season we can observe almost an immediate increase of PM concentrations and other priority pollutants in the air [7,11,12,13], which is a result of local emissions. In other regions, this effect is somewhat delayed as it is associated with direct impacts of local emission sources and with inflow of air masses from other parts of the country or agglomeration [14,15]. The impact of these emissions on the chemical composition of urban road dust (URD) in Poland has not been studied so far. Only a few Polish papers have focused on this issue in Poland [16,17,18,19,20].
Although URD studies have been widely conducted in many countries around the world [21,22,23,24,25], their purpose is mainly to assess the environmental and health impact of URD in densely populated urban areas. There is no doubt, that in the urban environment in Europe, the chemical composition of URD is determined by road traffic emissions [26,27,28]. Coarse dust from non-exhaust road traffic sources (e.g., abrasion of car components, brake pads, tires) on roads and streets is constantly mixed with elements of soil and mineral dust from the road abrasion and surrounding building elements. Then, URD could indicate metal pollution from atmospheric deposition [29]. At the same time, these particles are in constant contact with a mixture of volatile, semi-volatile, liquid and solid fine particles emitted along with gases from the exhaust pipes of cars. For this reason, the chemical properties of URD, although strongly variable in time and space, allow, under certain conditions and using specific models and/or properties of URD components (including correlations and/or relationships between specific compounds/elements), to assess basic sources of elements and persistent organic compounds in URD and, what is more important, identifying the main sources of air pollution in a specific area [30,31,32,33]. It was found that in some urbanized areas, the impact of other emission sources is so strong to overweight road traffic emissions, although the chemical composition of URD is dominated by road traffic emission [27,34,35,36,37]. This can be assessed by the observation of mutual relationships and registration of concentrations of those dust compounds and elements that are stable in the atmosphere.
The aim of this study was to evaluate the URD elemental composition in two regions of southern Poland—Upper and Lower Silesia. The sampling sites were selected in the urban agglomerations of Katowice and Wrocław, respectively. Both regions differ in hierarchy and participation of emission sources contributing to particulate matter in the air [7,9,38]. In Wrocław, traffic-related emissions are more important; in Katowice, municipal and industrial emissions predominate. The properties of URD in these agglomerations have not been studied so far. The changes in the hierarchy and participation of various emission sources influence the elemental composition and the environmental and health impact of URD. In addition, the participation of the mobile fraction of studied metals in URD was assessed as this is the fraction of studied elements which is easily extracted in water. The summer season was chosen for studies in order not to interfere with the winter season anomalies occurring for most of the year associated with the occurrence, especially in this part of Poland, of smog episodes [11]. It should be underlined that the URD we collected is not the same as ambient aerosol. Although, the metal sources associated with the ambient aerosol are the same as the metal sources in road dust. Generally, the contribution of specific sources of air pollution is more or less fixed and does not change dynamically over time. Therefore, the chemical composition of PM and URD is also more or less fixed and similar over longer periods of time. This allows to assess the environmental and health impact of URD. Such an approach can be also found in other papers e.g., Shi et al. [29], Han et al. [39], Li et al. [40] etc. In other case, many years of PM and road dust studies are recommended. Therefore, there is no difference if the data from short period of time or e.g., a year could be used since the conclusions will be related to the entire lifetime, etc. Within a 70-year period of average lifetime could happen 1 year or even several years where the physicochemical parameters of PM or road dust will differ from average results coming from many years of studies.
On the other hand, it is also assumed that in urban areas, the metal sources in PM and road dust are the same, and it can be said that PM is a metal source for road dust and vice versa [41]. Moreover, the analysis of carcinogenic exposure to metals in URD was done on water-soluble fraction of metals as it is known that this fraction comes mainly from the deposition of PM-bound metals [42].

2. Experiments

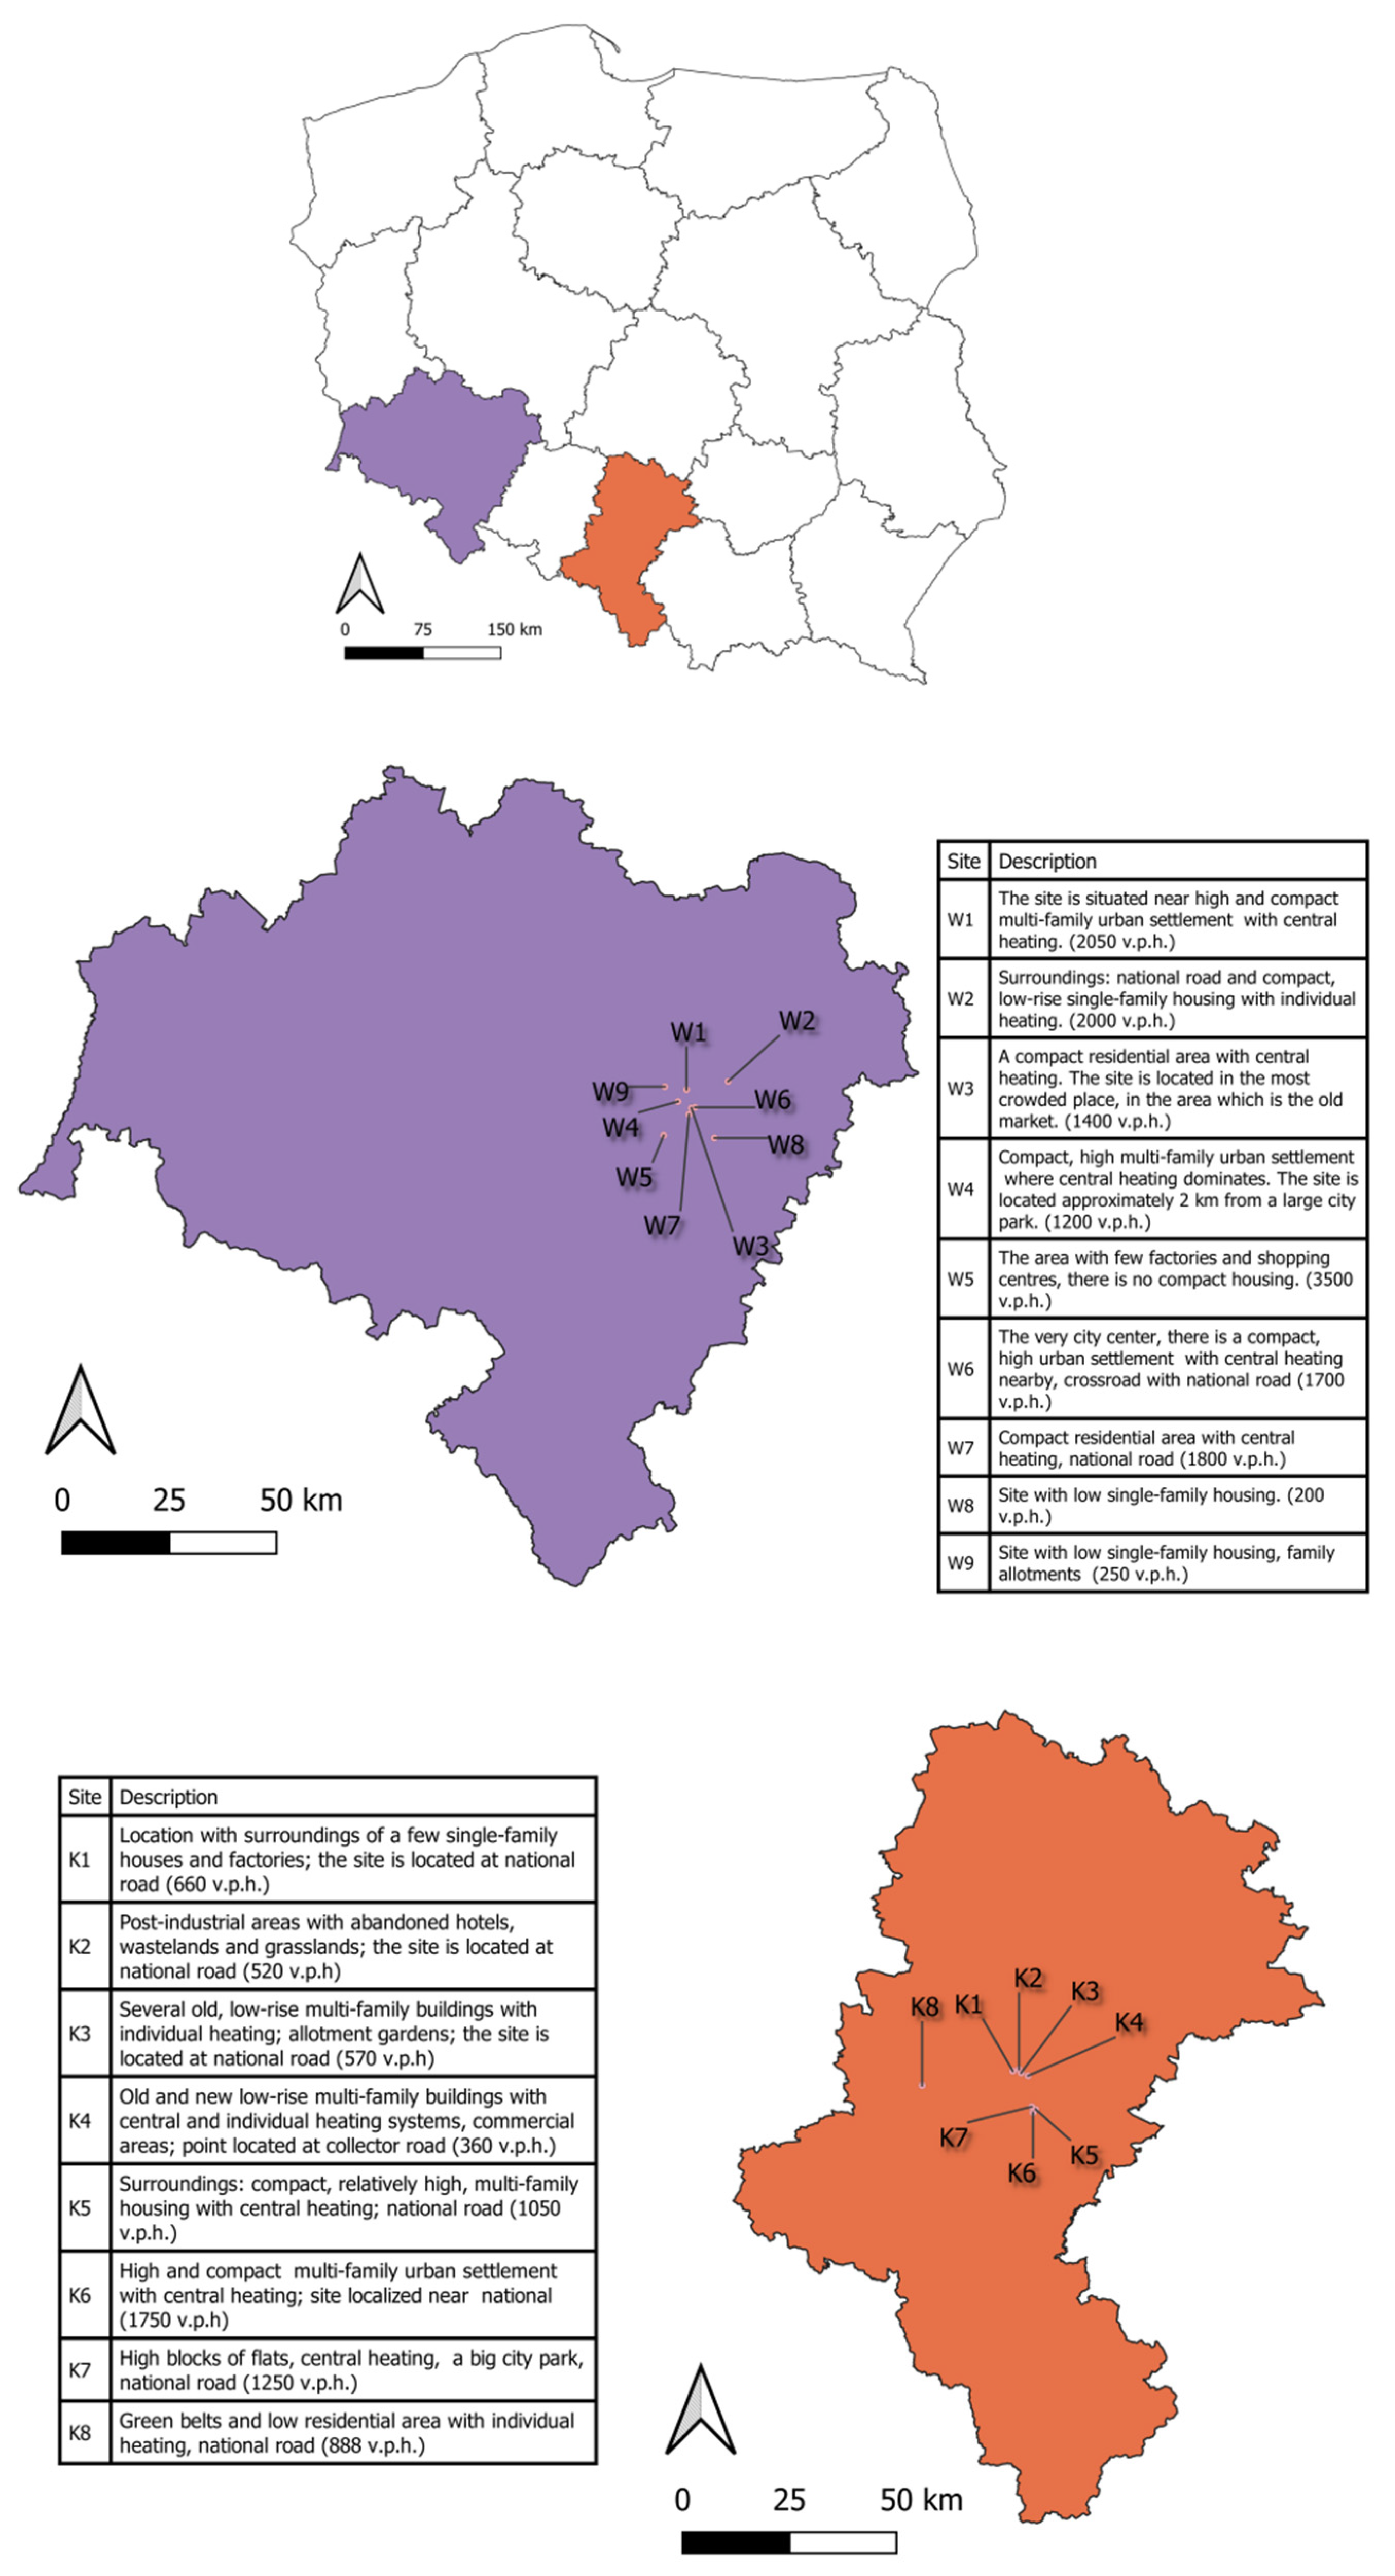
2.1. Sampling Organization

Sampling of URD was carried out in two large Polish urban agglomerations, in Katowice agglomeration (Upper Silesia) and Wrocław (Lower Silesia). A portable vacuum cleaner, fitted with the empty pre-weighed filter bag, was used to collect RD from road surfaces. In Katowice, we have chosen eight sites (K1-K8), and in Wrocław we selected nine sites (W1-W9); Figure 1. Each site was a separate research area, characteristic in terms of the environment and particularly in terms of the nearest type of neighbourhood with its separate PM sources. To exclude that URD sample was a random sample and to assure that it is representative for a larger area than the sampling point only, the collection of samples from one site consisted of six sub-samplings. In the case of sites located near roads, we took three samples on one side and another three samples on the opposite side of the road. The distance between points was about 20 m. In the case of sites located at intersections, we also took six samples: four located in the corners of the intersection, and the other two samples near the middle point. Additionally, sampling sites have been chosen in areas where PM emissions are determined by the burning of fossil fuels (of course this is also a certain simplification)—solid (and biomass)—Katowice, liquid—Wrocław. This has already been established in previous studies [43,44]. Moreover, the problem of insufficient intensity and frequency of cleaning roads and streets with dust has already been well known in Poland for years. In Wroclaw, the largest streets are wet cleaned in summer and rainless periods once a week; in Katowice it is done less often. Thus, the material collected is more or less averaged over a longer period of time than the sampling period. In addition, the areas were selected where the intensity of road traffic is stable throughout the year, the density of land development and land use are also known. This means that large differences are not expected in the elemental composition of road dust throughout most of the year. The short periods after wet road cleaning and the winter season, when the roads are defrosted with special agents or sprinkled with sand are the exception. In these periods, an increased content of toxic or potentially carcinogenic metals in road dust due to road traffic is not expected. On the other hand, in the winter-heating season, the increased metal emissions associated with individual heating of houses in both locations can be observed. Thus, the optimal variant was chosen—the sampling period took place when road dust was relatively abundant (rainless, warm period), its composition was averaged over time (longer period without cleaning the road), but excluding time when it was heavily polluted by municipal emissions or when its composition was “diluted” by the addition of road salt or sand (winter, black ice).
The samples were taken on August 2018, on sunny days without rainfall. Altogether, 102 samples were taken from two areas of studies. The sampling was repeated at the same sites. Samples of URD, after being transported to the laboratory, were weighed then homogenized and dried and sieved through a 2 mm sieve. The samples were sieved through a 2 mm mesh in order to remove larger particles and debris. The whole mass of each of the 17 samples was weighed and 20 g of each sample was divided into two parts. Ten grams was mineralized, then digested solutions were used to determine the total metal content; the second part was used to prepare water extracts to assess the content of the water-soluble fraction of metals.

2.2. Extraction and Chemical Analysis

The water extraction of URD was as follows: Samples were mixed with synthetic fresh water in a 1:2 (v/v) ratio, kept in the dark for 1 h 25 min and finally centrifuged for 30 min at 300 rpm (SIGMA 2K15).
For determination of the total content of metals spectral purity, HCl, HNO3 and HF were used (Suprapur; Merck Milipore). Prepared samples were digested in an Anton Paar Microwave 3000 oven (1200 W, 35 min). Along with water extracts and digests of URD, a suitable blank sample was prepared. Blank samples were subjected to metal content analysis together with other samples. Metal concentrations in blank samples were subtracted from the concentrations obtained for studied samples.
The content of Mn, Ni, Cu, Zn, As, Rb, Ba, Cr, Mg, and Al in water extracts and digests were determined with ICP-MS (Elan 6100 DRC-e Perkin Elmer).
The operating conditions were as follows: ICP RF power: 1125 W; nebulizer gas flow rate: 0.78–0.83 L/min; auxiliary gasflow: 1.15 L/min; plasma gasflow: 15 L/min; and sample flow rate: 1 mL/min. We measured all of the samples in triplicate. Certified multi-element standard stock solutions, Periodic table mix 1 and Transition metal mix 2 (Fluka), were used as calibration solutions.
The method was validated with two certified reference materials SRM 1643e (recovery in the range 95(Ni)–116%(Cr)) and SRM 1648a (recovery in the range 75(As)–127%(Cr)) both obtained from the National Institute of Standard and Technology (NIST). Detection limits: 0.151 μg/l for Al, Mg and Zn; 0.019 μg/L for As; 0.013 μg/L for Cr; 0.022 μg/L; 0.017 μg/L for Ni; 0.048 μg/L for Cu; and 0.003 μg/L for Rb; 0.010 μg/L for Ba.
To calculate the water solubility of each element, we defined the solubility of element x as follows:
S = x WS x T × 100 %
where:
  • S —solubility (%),
  • x —corresponding element,
  • x WS —concentration of water soluble fraction of element x (mg/kg),
  • x T —total concentration of element x (mg/kg).

2.3. Exposure Dose

Health risk assessment for the inhabitants of the agglomerations was carried out using the US EPA method [45]. The assessment includes exposure to the following elements: Cu, Ni, Zn, Cr, As, Mn, and Mg throughout the life of the average child as well as the average adult. It was assumed that the penetration of the above-mentioned elements can take place via the oral, inhalation and dermal routes. The formula assumes the exposure period of an adult as 70 years, and a child as 6 years. The environmental exposure was estimated on the basis of calculating the amount of harmful substance in which the organism comes in contact per day, calculated per 1 kg of body weight [46,47]. The exposure dose was determined according to the following formulas:
ADD ing = C   × IngR   ×   EF   ×   ED BW   ×   AT
ADD inh = C   × InhR   ×   EF   ×   ED PEF   ×   BW   ×   AT × 10 6
ADD derm = C   × SL SA   ×   ABS   ×   EF   ×   ED BW   ×   AT
where:
  • C—average metal concentration in road dust (mg/kg);
  • IngR—value of daily accidental dust intake (mg/d);
  • InhR—daily lung ventilation (m3/d);
  • EF—contact frequency (d/year);
  • ED—duration of contact (year);
  • BW—average body weight (kg);
  • AT—averaging period (d);
  • PEF—particle emission factor (m3/kg);
  • SL—coefficient of dust adherence to the skin (mg/cm2 × d);
  • SA—skin surface exposed to dust (cm2);
  • ABS—percutaneous absorption coefficient, unnamed quantity.
These parameters are shown in Table 1.

2.4. Non-Cancerogenic Health Risk

In order to assess non-carcinogenic health risk, hazard quotient (HQ) and hazard index (HI) were applied. The equations for HQ and HI are as follows:
HQ = ADD RfD
HI =   HQ
where,
ADD—ingestion, inhalation or dermal dose;
RfD—reference dose that is given in the Integrated Information Risk System (IRIS) [49,50] (Table 2). Exposure indicators have not been calculated for two elements: Rb and Al, because there is no data in the literature on the RfD value that is key to calculating the health risk hazard quotient.
If HQ has values higher than 1, it suggests that adverse effects on human health can occur, if value HQ is <1, there is no health risk. A similar rule is applied to HI values, if HI <1 there is no risk of health hazards [48].

2.5. The Assessment of Cancer Risk

In order to calculate the excessive risk of cancer development (ECR), the parameters for the penetration of substances by inhalation only were applied, this parameter cannot be calculated for all studied metals, because all are not carcinogenic. ECR has been calculated for the following metals: Cr, Ni and As. ECR can be calculated with the formula listed below [51]:
ECR = C   ×   ET   ×   EF   ×   ED   ×   IUR BW   ×   AT
where:
  • C—average metal concentration in road dust (water soluble) (mg/kg);
  • ET—exposure time (h/d);
  • EF—contact frequency (d/year);
  • ED—duration of contact (year);
  • IUR—slope factor (µg/m3);
  • BW—average body weight (kg);
  • AT—averaging period (d);
The IUR values of Cr, Ni and As are 0.012, 0.00024 and 0.0043, respectively [48]. The other parameters remained the same like for calculation of risk hazard quotient (HQ) and hazard index (HI). If the ECR ranges between 10−6–10−4, there is a low risk of cancer. According to IRIS, the carcinogenic risk was calculated for Cr, Ni and As. As chromium occurs in two persisting forms (Cr III and Cr VI), only Cr VI was considered to be carcinogenic, and based on IRIS recommendations it was assumed that it constitutes one-seventh of the total mass of chromium in road dust, since the ratio of Cr VI to Cr III is about 1:6 [52]. Water-soluble metal concentrations were used to calculate the carcinogenicity coefficients. The cancer risk was calculated for water soluble fraction only according to the assumption that this fraction is the most available in URD.

2.6. Statistical Methods

The data were analyzed using statistical methods. The calculations were performed using Python 3.7, with the following packages: Pandas [53], Matplotlib [54] and Seaborn [55], Orange Data Mining Toolbox [56], and using EPA Positive Matrix Factorization 5.0 [57].
Firstly, the relations between the measured values of the concentration of metals in RD were determined. Pearson’s coefficient of correlation was applied. The significance of the correlation was checked using t test for Pearson’s coefficient r with null hypothesis r = 0 and alternative hypothesis r 0 .
Principal Component Analysis (PCA) was performed. This method helps to identify the main component explaining the variance in the sample. PCA is usually used in multivariate analysis of metal contamination of RD and soils [50,58,59,60,61]. To simplify the interpretation of the results, 10 parameters (total concentration of metals) were reduced to four components.
Besides PCA analysis, we also performed positive matrix factorization (PMF) [62] of sampling sites. The key difference between PCA and PMF is the assumption of the non-negativity of loadings in PMF. The factors found in PMF analysis can be interpreted by comparing them to the source profiles [59,63]. As a method of comparing PMF results with source profiles, we chose a cosine similarity, a measure of the cosine of the angle between two vectors representing profiles.
Then, pollution level at all sites was assessed using Pollution Load Index-PLI [64]. The PLI is defined as a geometric mean of contamination factors:
PLI site = n = 1 k CF n k
CF n = C n B n ,
where C n is the concentration of metal in RD, and B n is the concentration in the background.
Contamination factors for all 10 studied metals were calculated. As a background concentration, the upper-crust concentration values were taken into account [65]. If the PLI site > 1 , the site can be treated as polluted [66].
Pollution Load Index for Katowice and Wrocław (which is also defined as a geometric mean) was also defined but this time the PLI was calculated for sites located in Katowice and Wrocław according to the following formula:
PLI city = n = 1 k PLI site , n k
Similarly, the criterion of pollution load for an area, like a whole city, is PLI city > 1 .
The Enrichment Factor (EF) in metals and Geoaccumulation Index (Igeo) are indicators used to assess the presence and intensity of anthropogenic contaminant deposition on surface soil or URD. We determined Enrichment Factors (EF) [67] for metals. EF is defined as a ratio of CF for given metal n and C F for reference metal.
EF n = CF n CF b
One of the widely and successfully used reference elements is aluminum [68,69], thus, we also used aluminum. The value of EF can be ranked in five classes [61]. The description of the classes is provided in the Table 3.
Afterwards, we evaluated the Index of geoaccumulation I g e o [70]. The index for the element n is defined as:
I geo , n = log 2 ( C n 1.5 B n )
The analysis of the formula above shows that I g e o is, in fact, a logarithm base 2 of C F , thus, the rates of change of I g e o , n with C n are lower than that for C F n . The value of I g e o correspond to seven I g e o classes [71]. The classes are presented in Table 4.

3. Results and Discussion

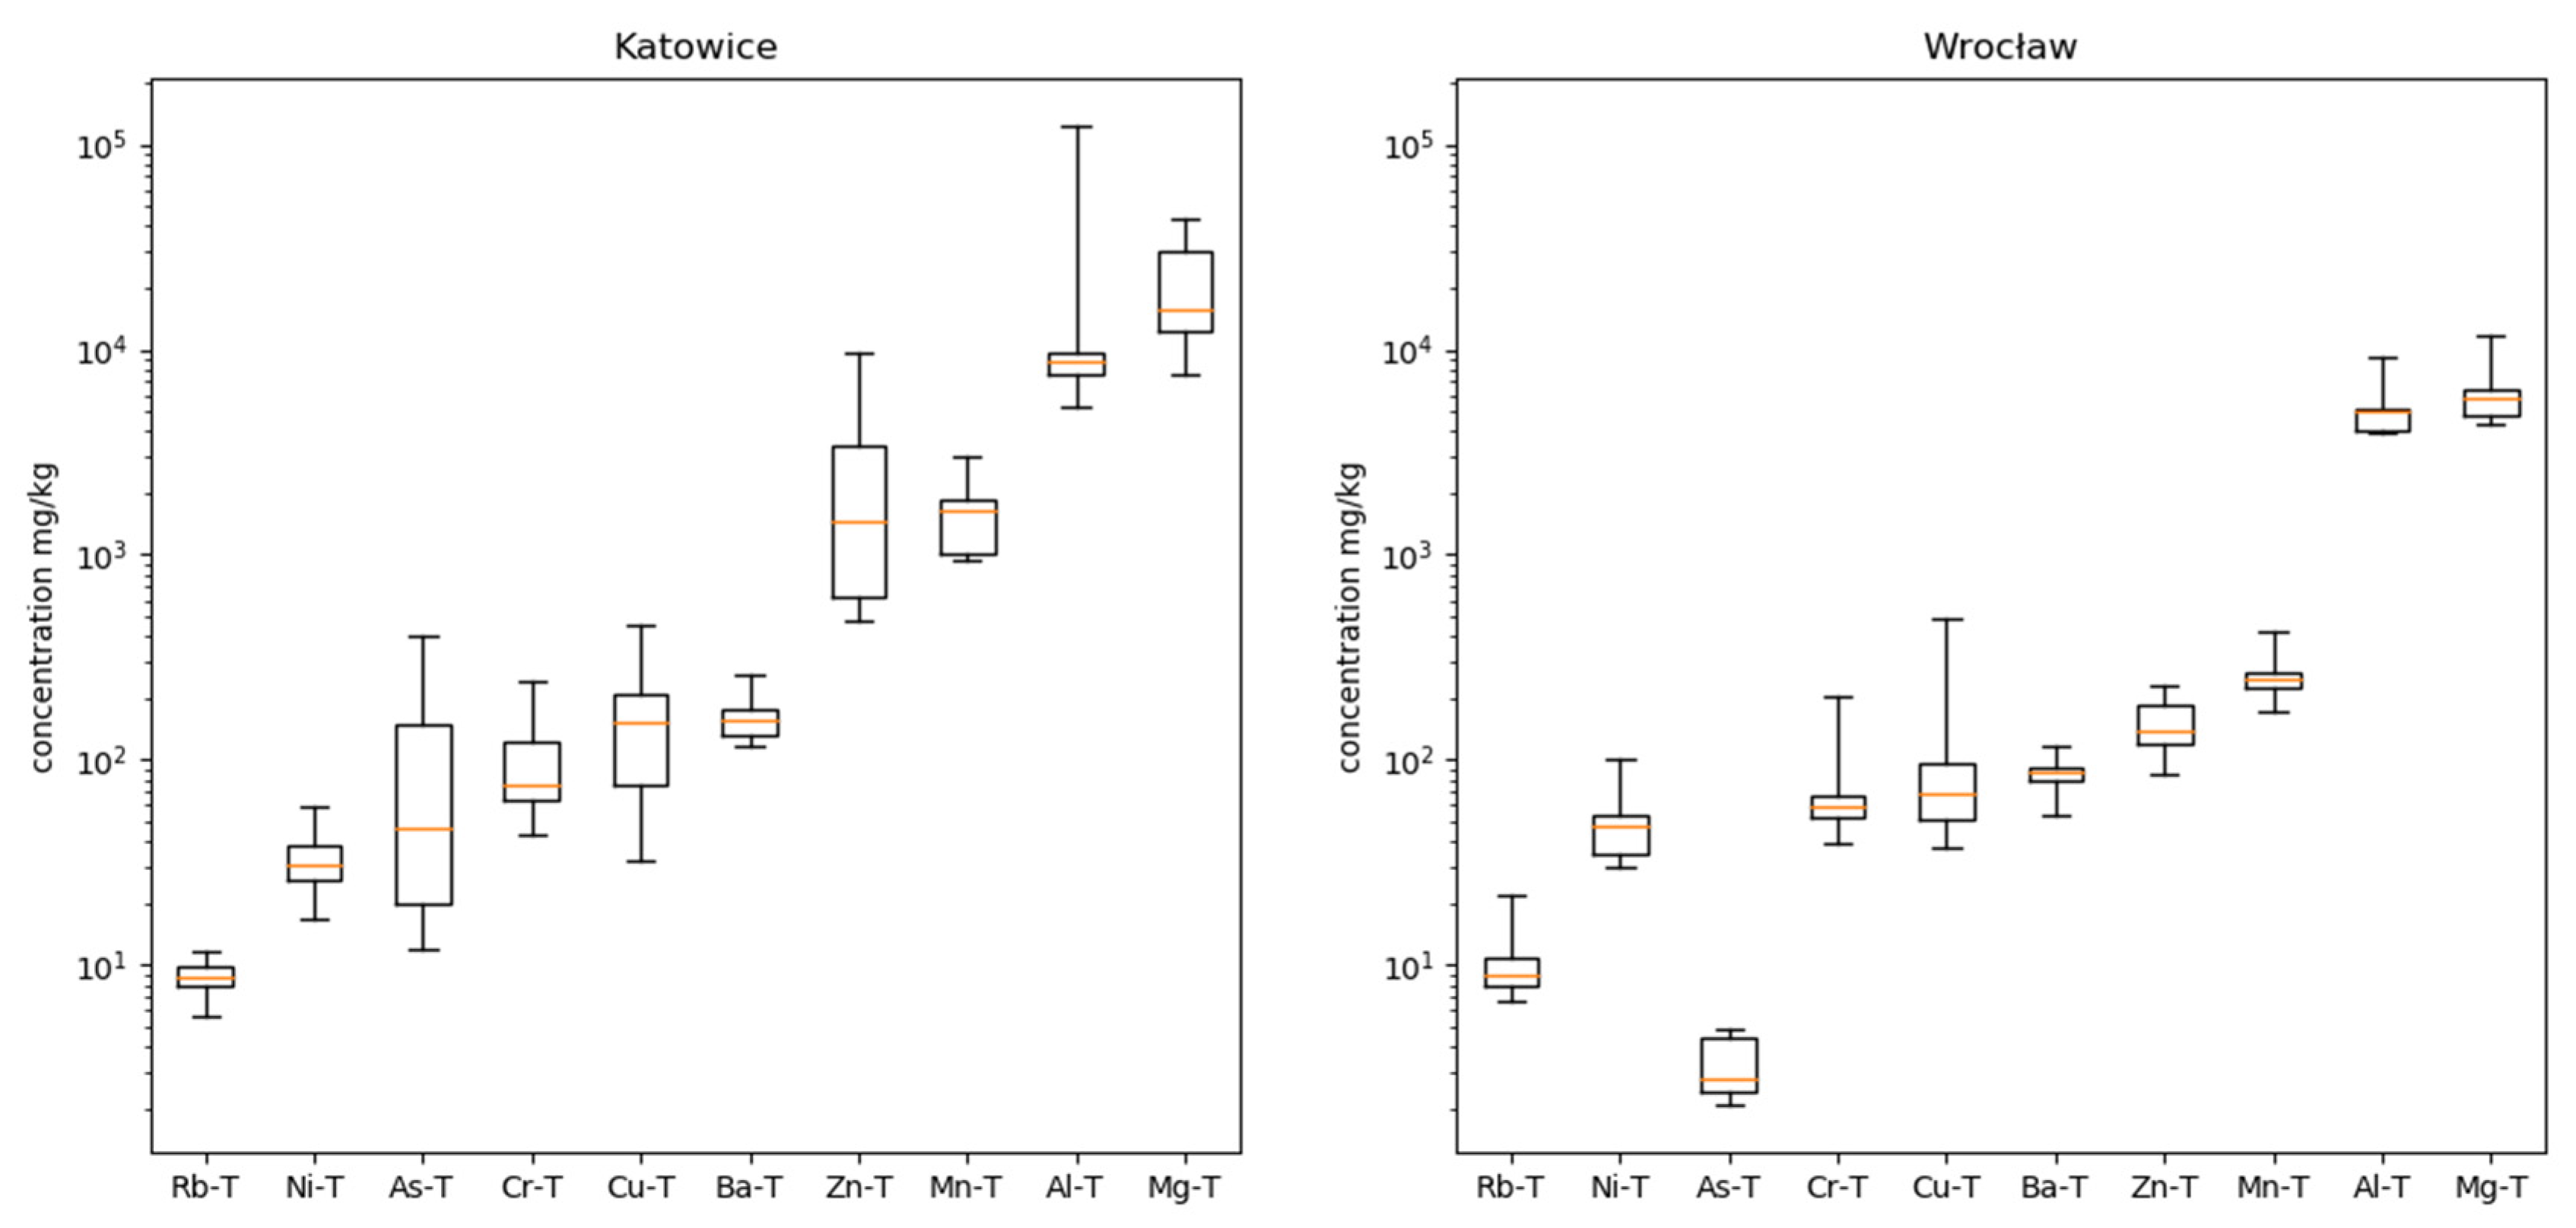
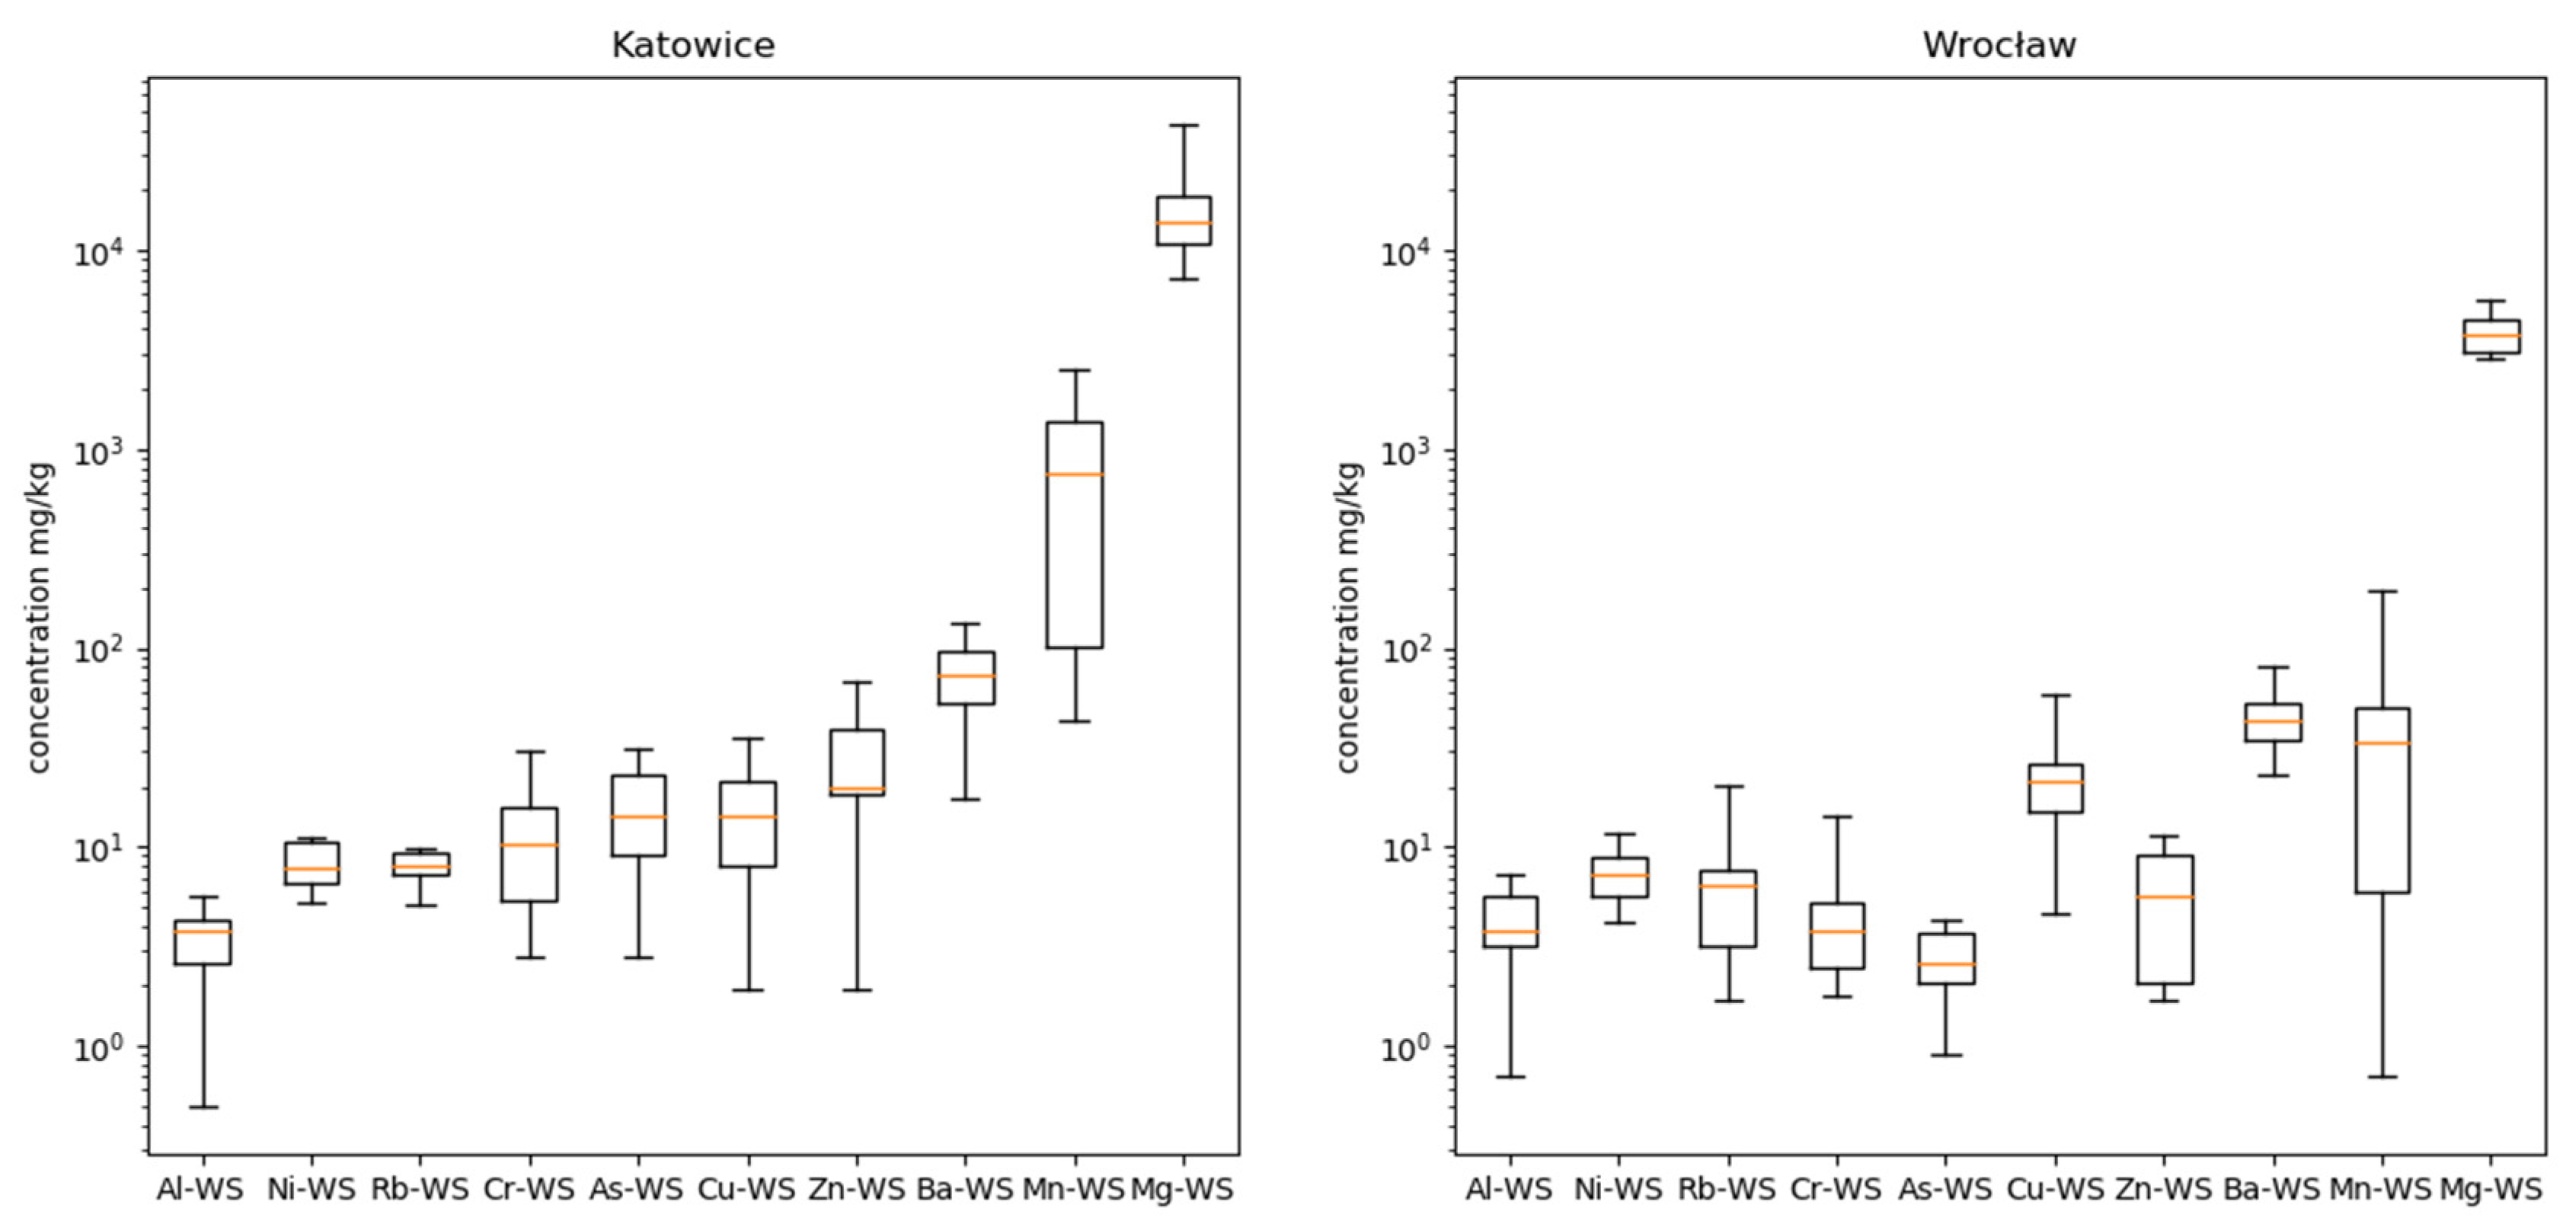
3.1. Road Dust Metal Concentration

The descriptive statistics of the studied metal concentrations in URD as well as concentrations of URD-bound water-soluble fraction of the metals are presented in Figure 2 and Figure 3. The elements in plots are ordered according to the median for concentrations both for the plot describing Katowice and Wrocław. The median concentration of total metal in URD in Katowice is ordered as follows: Mg > Al > Mn > Zn > Ba > Cu > Cr > As > Ni > Rb, while in Wrocław, the order is similar with one exception, Mg > Al > Mn > Zn > Ba > Cu > Cr > Ni > Rb > As. Concentrations of water-soluble fractions of elements are as follows: Mg > Mn > Ba > Zn > Cu > As > Cr > Rb > Ni > Al in Katowice, while in Wrocław: Mg > Ba > Mn > Cu > Ni > Rb > Zn > Al > Cr > As. In general, concentrations of the studied metals in URD are lower in Wrocław than in Katowice both for total and water-soluble fraction of metals.
The correlations between total element concentrations in the URD are presented in Table 5 and Table 6. There are only six significant correlations between metals (at p = 0.1 ) in Wrocław, while in Katowice there are 15 correlations. At level p = 0.05 , seven correlations in Wrocław are significant and in Katowice 14; at level p = 0.01 , four correlations in Wrocław and two in Katowice. Strong correlations for Katowice agglomeration were observed between Cu and Zn, As, Ba, Al; between Zn and As, Ba, Mg and Al; between As and Ba, Mg and Al; between Ba and Mg and Al; between Mg and Al; and finally between Ni and Mg, which could be related with traffic pollution and industrial activity in this region [72]. The number of strong correlations (0.01) for Wrocław agglomeration is quite small as they were observed between Mn and Rb, between Ni and Mg, between Cu and Zn, between Ba and Cr, Al, and between Cr and Al, only which could be related to traffic pollution mainly [73].
.
The concentrations of elements in URD in this study were compared to different sites in the world (Table 7) [18,23,24,25,26,74,75,76]. Mn, Cr, Mg, Rb, Ba, and Al are crustal elements; Zn, As and Cu may originate from fuel combustion, traffic activities, domestic heating and industrial emissions; and Ni may derive from the large furnaces used to make alloys, power plants and trash incinerators. [18,23,24,25,26,74,75,76]. Values in the table indicate that Cu-T (T-total concentration) concentrations in road dust in Poland are at a similar level (Katowice 175 mg/kg, Wrocław 126 mg/kg, Radom 173 mg/kg, Warsaw 109 mg/kg). Definitely, lower Cu-T concentration was recorded for example in Tokat (Turkey), where the lowest concentration of Cr-T was also noted. A higher level of Cr-T and Ni-T was recorded in Greece (Cr 187 mg/kg, Ni 96 mg/kg) than in Poland. Zn-T is an element whose highest concentration was observed in Katowice and the lowest in Tokat. This element is connected with anthropogenic emission sources such as industrial emissions. It is transmitted as a result of engine oil usage, and it is present in fuel, engine lubricants and anti-wear additives [77]. In Katowice, the highest concentrations of Mn-T and As-T were also noted (Table 7). Mn is a ubiquitous environmental heavy metal and it is an essential element for living organisms. Although, as a result of vehicle emissions, the deposition of Mn on the road may result in its incorporation into street dust [78]. As is commonly present in road dust, their anthropogenic sources are mostly road traffic, mining, smelting, refining, waste incineration, and fossil fuel combustion [79]. As concentrations of some elements were the highest in Katowice agglomeration, it suggests a strong influence of industrial activities and traffic in this region.
The water-soluble fraction of Mn, Zn, As, Ba, Mg, in URD was higher for Katowice than Wrocław agglomeration (Table 8). All these metals could be related to emissions from road traffic, the state of the roads, and industrial activities, but also other sources [11,80]. Comparing the results of the water-soluble fraction of metals in URD-bound in Upper and Lower Silesia with the results from other sites (for example from Hungary, UK, Greece or China), it can be stated that the range of their solubility is not very significant [27,28,37,81]. The exception is Al; average solubility of Al in dust originating from Greece is 70%, while in Katowice it is 0.0% (Table 8). The large differences are also observed when comparing solubility of Zn in dust samples from the UK and China with samples from Upper and Lower Silesia (UK 60%, China 40%, Katowice 3%, Wrocław 4%; Table 8).

3.2. The Origin of URD in Katowice and Wrocław Agglomerations

Major Component Analysis (PCA) is a technique used to highlight variability and extract strong patterns in a data set. PCA was performed for samples from Katowice and Wrocław (total metal content in URD). We have found that in both cases the four main components can explain over 90% of the variance of the concentrations (Table 9 and Table 10). The first main component (PC1) accounted for 65% of the variance in the Katowice agglomeration and it was dominated by Zn, As, Ba, Mg, and Al. This component is probably therefore attributed to anthropogenic and lithogenic sources. PC1 dominant elements were also strongly correlated with each other ( p = 0.01; Table 5). Generally, similar relationships are observed for dust from industrial emissions and coal combustion. Especially, the presence of As in the Upper Silesian Agglomeration is strongly connected with emissions from coal combustion, which influences the chemical composition of dust or particulate matter (PM) [38,82]. The second component (PC2) accounted for 13% variance and was only explained by the high-Mn charge (Table 9). It seems that PC2 can be interpreted as a representative of road traffic emissions. The third factor (PC3) accounted for 9% of variance with the following components, Mn, Ni and Cu, suggesting the impact of industrial activities and oil combustion processes. However, Ni correlations with the majority of the elements are not conclusive. Probably PC3 like PC2 may also represent traffic emissions, but in the case of PC3, it seems that it may contribute more to non-exhaust emission. The last factor (PC4) explained 8% of the variance only through Ni.
On the other hand, in Wrocław agglomeration, the first component (PC1) explained 40% of variance and was dominated by As, Ba, and Cr, which is probably attributed to non-exhaust road traffic emission (Table 10); this is mainly proved by the correlation of As and Cr, but also the correlation of Cr with the crustal elements, Table 6. It cannot be excluded that PC1 can be explained by mixed emissions from coal combustion and road traffic. The second factor (PC2) accounted for 17% of the variance and was explained by Ni and Mg high factor loadings. The third factor (PC3) was responsible for 16% of variance with Ni and As. Both PC2 and PC3 may be related to industrial emission and/or crude oil combustion. The last factor (PC4) explained 11% of variance by Cu only. It is almost certain that PC4 could contribute to exhaust emissions from road traffic in Lower Silesia [73,83].
The results of PCA analysis—four components—resolves the dependencies in the sampling sites, however, some of the loadings are negative. In order to obtain additional information about sources of URD, we performed PMF. We decided, similarly like in PCA, to find four factors. The results of PMF were compared with profiles available in source apportionment for Europa [63] using the cosine similarity. As a result, a cosine of the angle between two vectors was found. The higher cosine, the lower the angle between vectors. We chose profiles with similarity higher than 0.95 i.e., when the angle is lower than 0.32 radians. We took under consideration only sources which had all of the elements we have measured (Supplementary Material Tables S1 and S2).
On the basis of the obtained results, it is obvious that it is not possible to clearly assign the emission sources to suitable factors. However, it is possible to refer to source profiles which are already defined [63] and to compare the results with the conclusions from PCA analysis (Table 9 and Table 10). First of all, it should be underlined that only profiles that consisted of the same elements which were identified in our URD samples from Katowice and Wrocław were taken into account for the analysis of factors similarity (from the PMF analyzes and the form profiles present at source apportionment for Europa [63]. However, these profiles comprised of other elements also. Therefore, the obtained PMF results should be interpreted with caution. For example, factor 1 of elemental profile in Katowice had a similarity with the profile of the marine aerosol (Supplementary materials, Table S1). It is obvious that the marine aerosol had no effect on the composition of the URD in Katowice, because the Baltic Sea is located about 500 km north of this sampling area (winds prevailing in Poland are from southern directions). The “marine aerosol” profile from source apportionment for Europa [63] consisted of elements identified in our URD, but also sodium (40%) among others. This element was not assessed in the present study. Hence, the similarity of factor 1 in Katowice with marine aerosol is accidental. However, the second profile related with factor 1 in Katowice seems to confirm the fact that in this city industrial emissions are the main source of metals in URD and PM. The profiles related with factors 2–4 suggest that metals in URD are associated with industrial emissions (e.g., power plant, iron ore converter complex, industrial combustion, coke gas (and coal)). It can also be noticed that, as in the case of PCA analysis, factor 3 is similar to the emission profile of burned coal pellets. This proves the relation of metals in URD with low municipal emissions in Katowice. Factor 2 shows similarities with the profiles of emissions from coal combustion in the energy sector—a small coal boiler and power plant. However, the most probable (best matching factor with profile) is that factor 2 is associated with the metals release in URD from the road surface and mineral dust and soil. The same conclusions could be made from PCA analysis. Although, also in this case, it should be taken into account that source profiles, apart from metals assessed in our study, contained also other elements e.g., silicon, calcium, organic matter or iron (ranged from a few to even 40% of its mass) [41].
In the first factor calculated for metals in URD from Wroclaw, the similarities with profiles typical for road dust (industrial road, near by works, urban road, poor state of pavement) could be noticed; (Supplementary materials, Table S2). Therefore, it seems that PCA results suggesting the association of URD in Wrocław mainly with non-exhaust road traffic emission and crustal/mineral matter are right. In Wroclaw, as in Katowice, similarity was found in PMF analysis of the factors 2–4 with the profiles of industrial emissions and emissions from coal combustion. The profiles related in Wroclaw with factor 4 are related with factor 1 in Katowice, while those related with factor 2 in Katowice are more or less the same as those related with factor 3 in Wroclaw; similar profiles are also related with factor 4 in Katowice and factor 2 in Wroclaw. Therefore, if it is assumed that the sources and profiles are actually assigned to these factors, it can be simplified that industrial emissions had the largest participation in Katowice and the lowest in Wrocław. The most important emission in Wrocław was typical of non-exhaust emission sources and soil dust; this type of emission was on the second place in Katowice. In this agglomeration, emission from coal burning in domestic furnaces clearly consists of one distinguished factor, which confirms the earlier conclusions about the origin of metals in URD in both cities.

3.3. Assessment of Heavy Metals Pollution Level

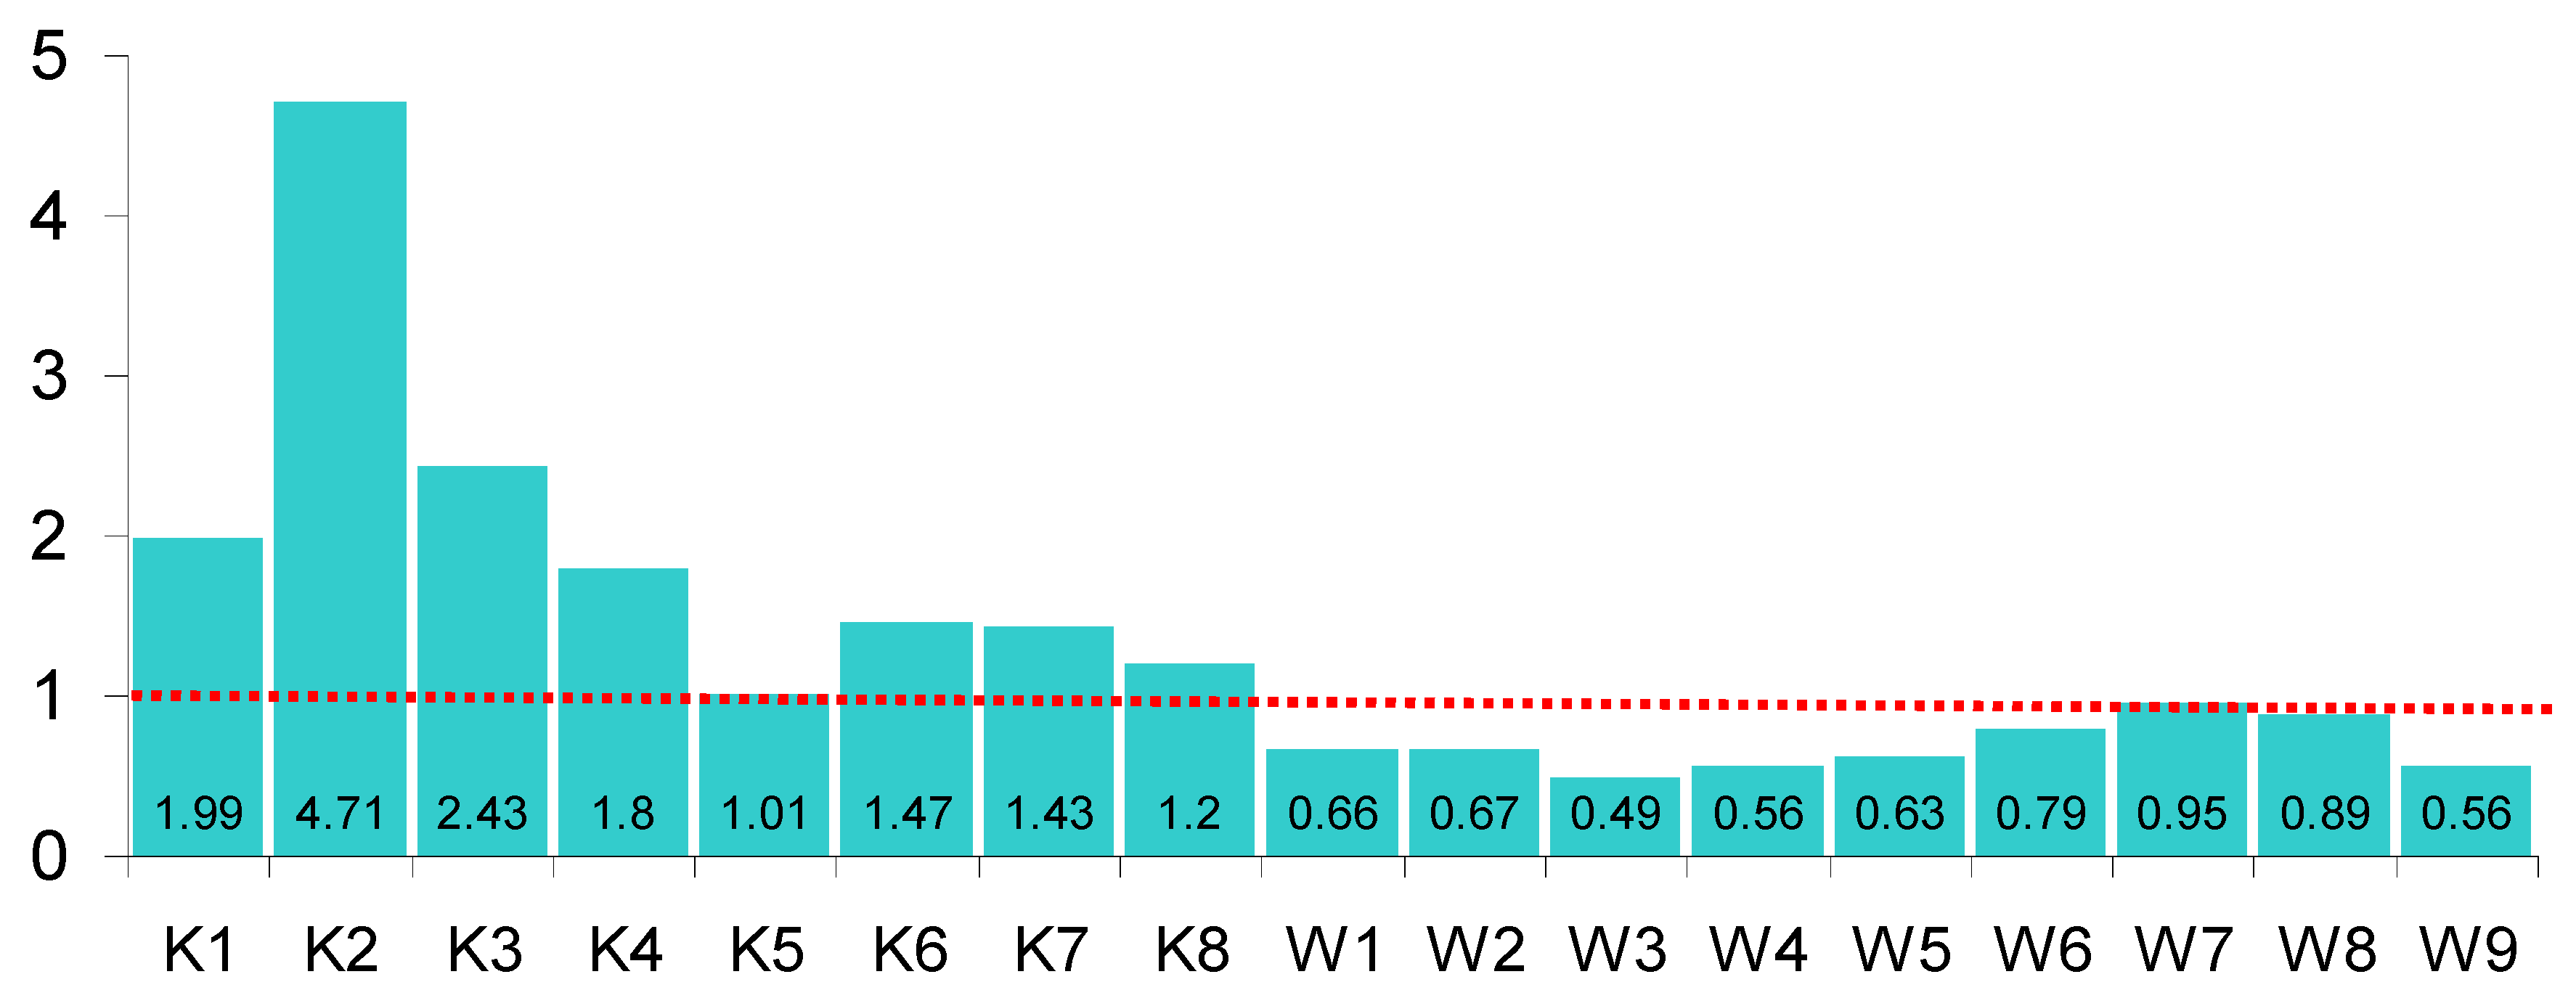
3.3.1. Pollution Load Index (PLI)

The Pollution Load Index was calculated for sites based on total concentrations of 10 elements. The results are provided in the Figure 4. All sites in Katowice have a PLI higher than 1 and all sites in Wrocław have a PLI lower than 1. The geometric mean PLI calculated for eight sites in Katowice and nine sites in Wrocław was 1.79 and 0.67 respectively. In general, Wrocław seems to be significantly less polluted than Katowice, according to a PLI. Probably the presence of abandoned industrial companies and coal-fired houses contributed significantly to the highest values of PLI obtained for Katowice agglomeration [11,38,84]. Even the contaminants deriving from former, abandoned industries could influence the URD composition.

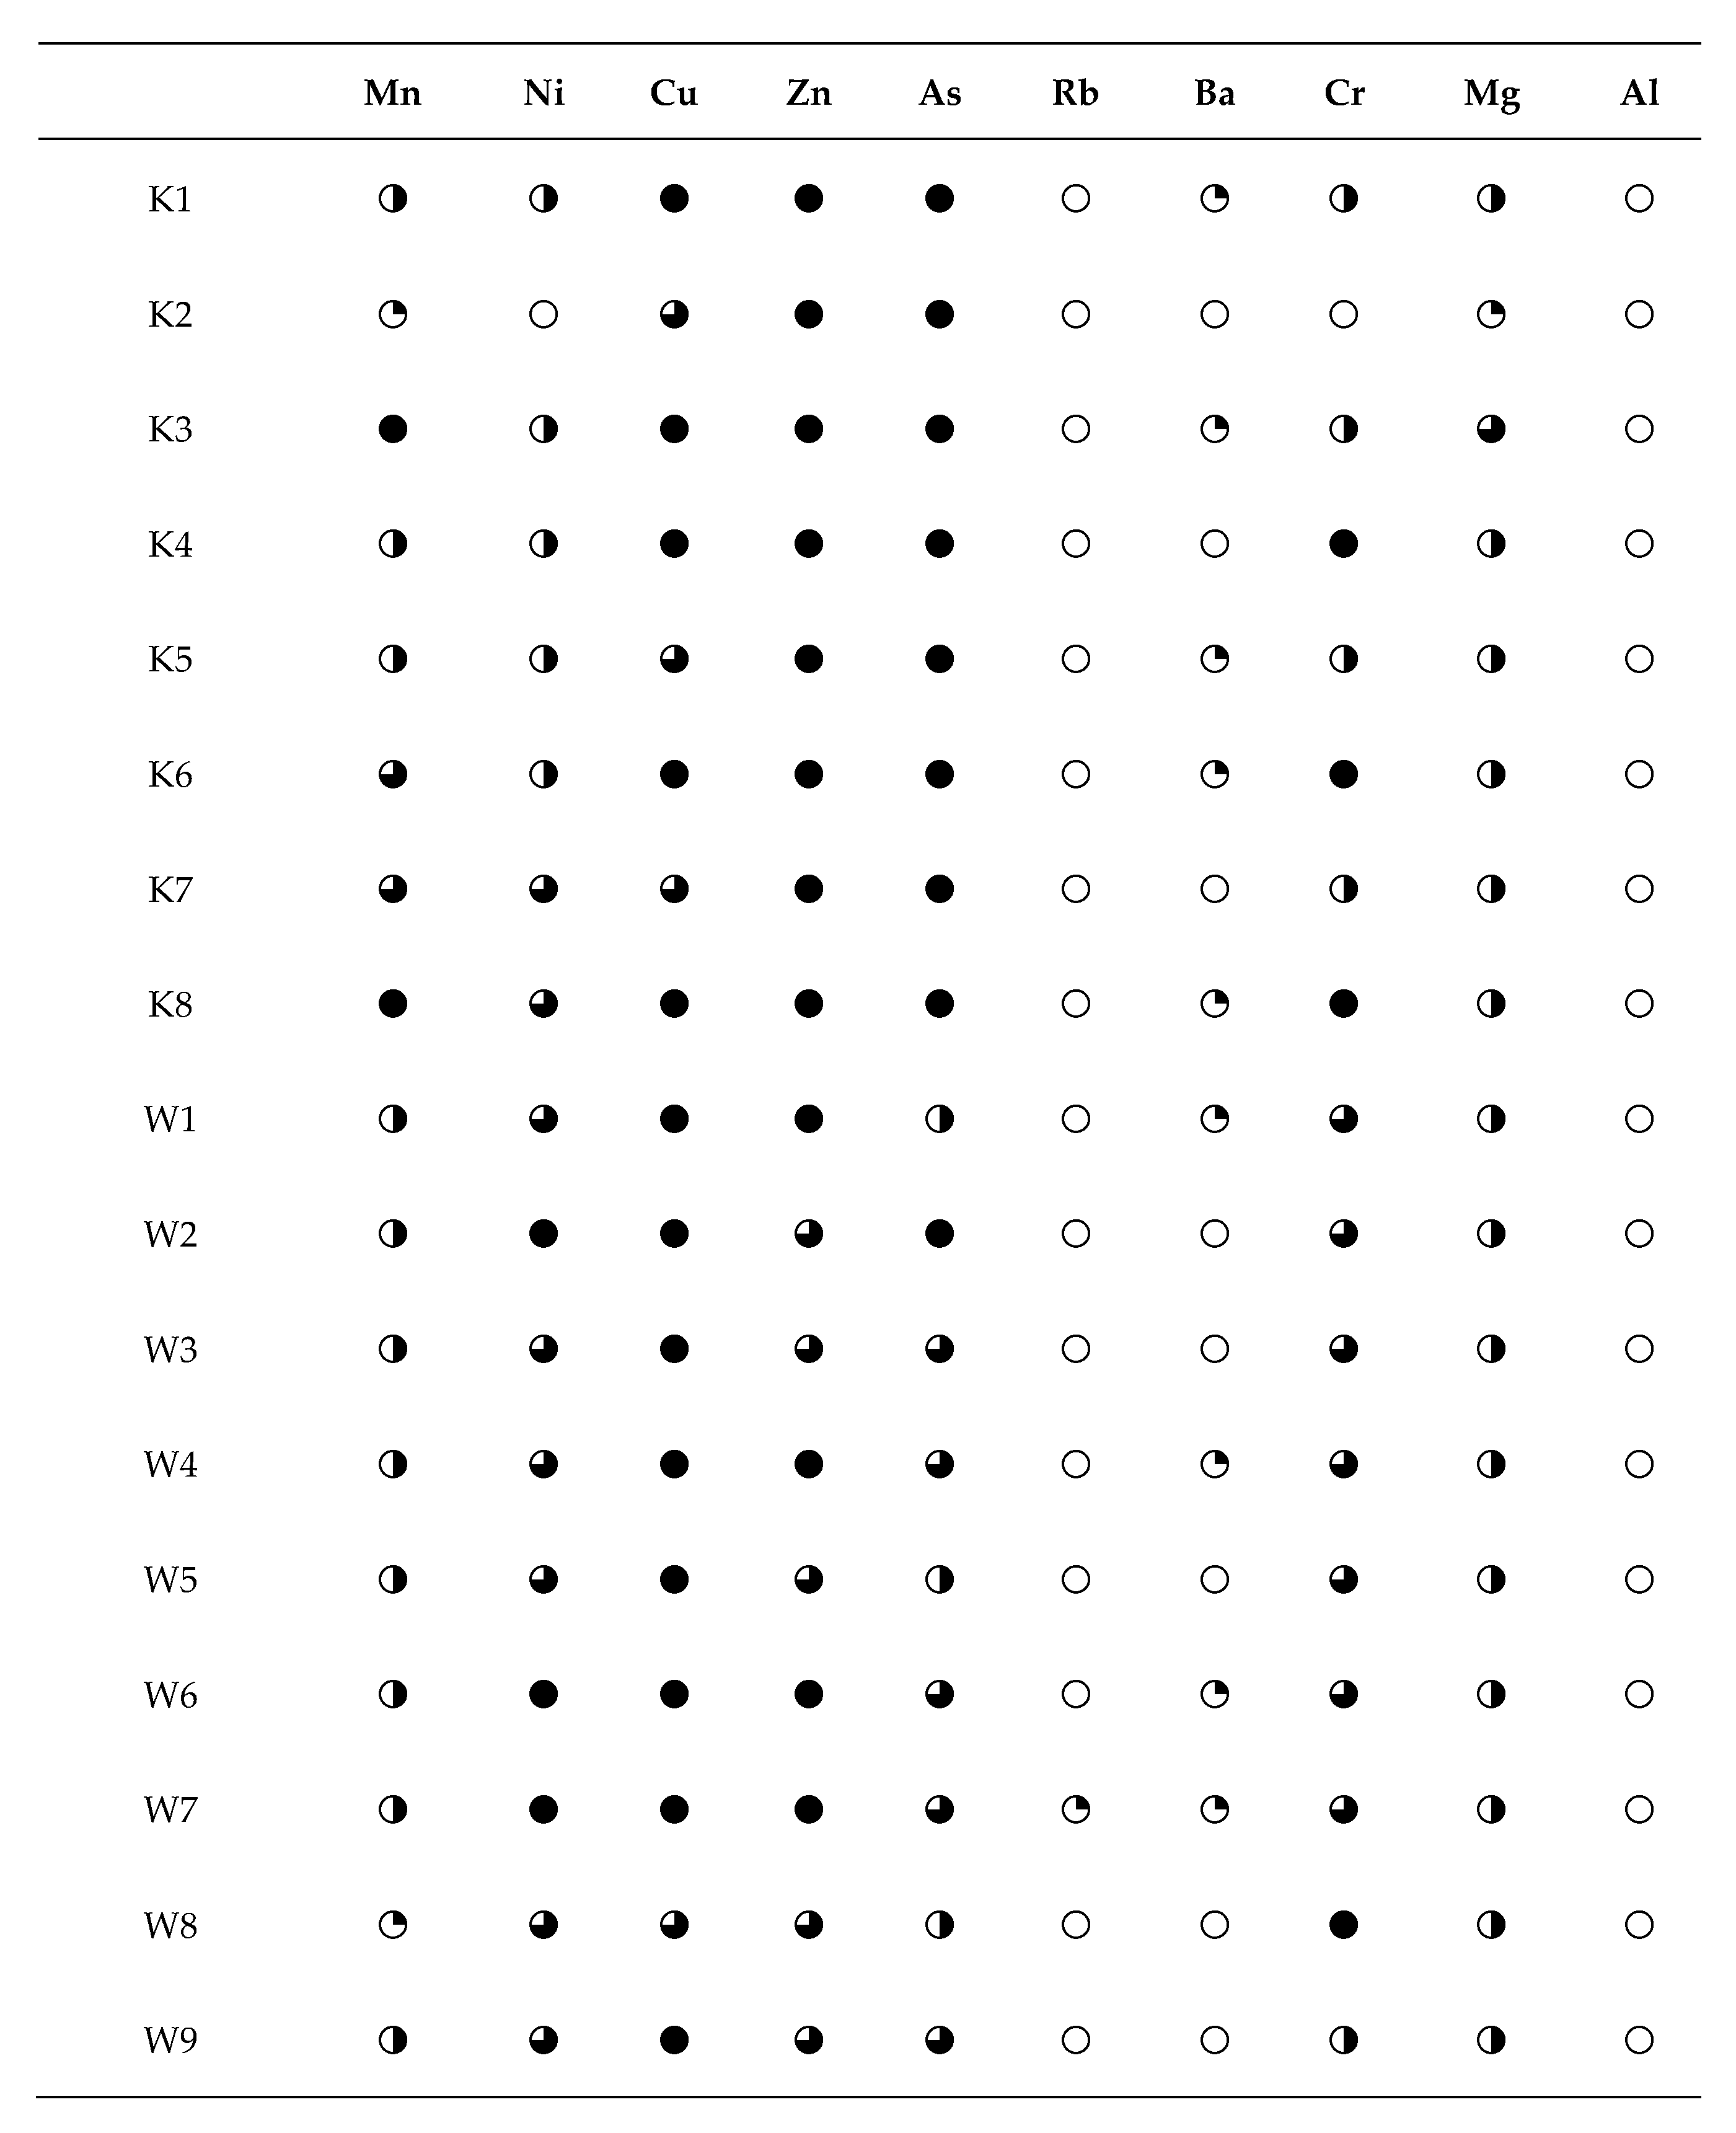
3.3.2. The Enrichment Factor (EF)

The enrichment factors were calculated for all sites and total concentration of particular metals. As a reference element, Al was used. We adopted a profile for the upper continental crust and therefore the profile representing quite generally and broadly the upper crust composition. The results are presented in Figure 5. Only at one site in Katowice region the EF of Mn has moderate enrichment. At other sites, it ranges from significant enrichment to extremely high enrichment, while in the Wrocław regions (Lower Silesia), only significant enrichment of URD in Mn is observed; no extremely high enrichment was observed, suggesting that Wrocław agglomeration may experience low anthropogenic influence compared to Katowice region. Results of EF for Ni show a different pattern. Sites located in Wrocław reveal very high to extremely high enrichment while in Katowice from minimal enrichment to very high enrichment (Figure 5). The content of Ni in URD might suggest that both areas can be related to emission from human activities such as the metallurgical industry, commercial centers and plants [39,40]. URD is similarly enriched in Cu both in Katowice and Wrocław, suggesting the influence of traffic on both regions [82,85]. The case of Zn is similar to that of As; all samples collected in Katowice are extremely highly enriched, while in Wrocław there are sites with less enriched URD. Zn and As are also related to various human activities, mainly with fossil fuels combustion [39,40]. The results in Figure 5 suggest that there are weak anthropogenic sources of Rb and Ba in both Polish locations. The enrichment factors for URD in Cr in Katowice (except one site) and in Wrocław vary in the same range (from significant enrichment to extremely high enrichment), however, it seems that there are more sites with very high enrichment in Wrocław than in Katowice. Probably this is the result of presence and demolition of the Fe-Cr slag heap in the Wrocław agglomeration as this type of waste was left after a smelter closed near Wrocław and it was used for road construction purposes. The EF of Mg suggests significant enrichment at all sites, both in Katowice and Wrocław.

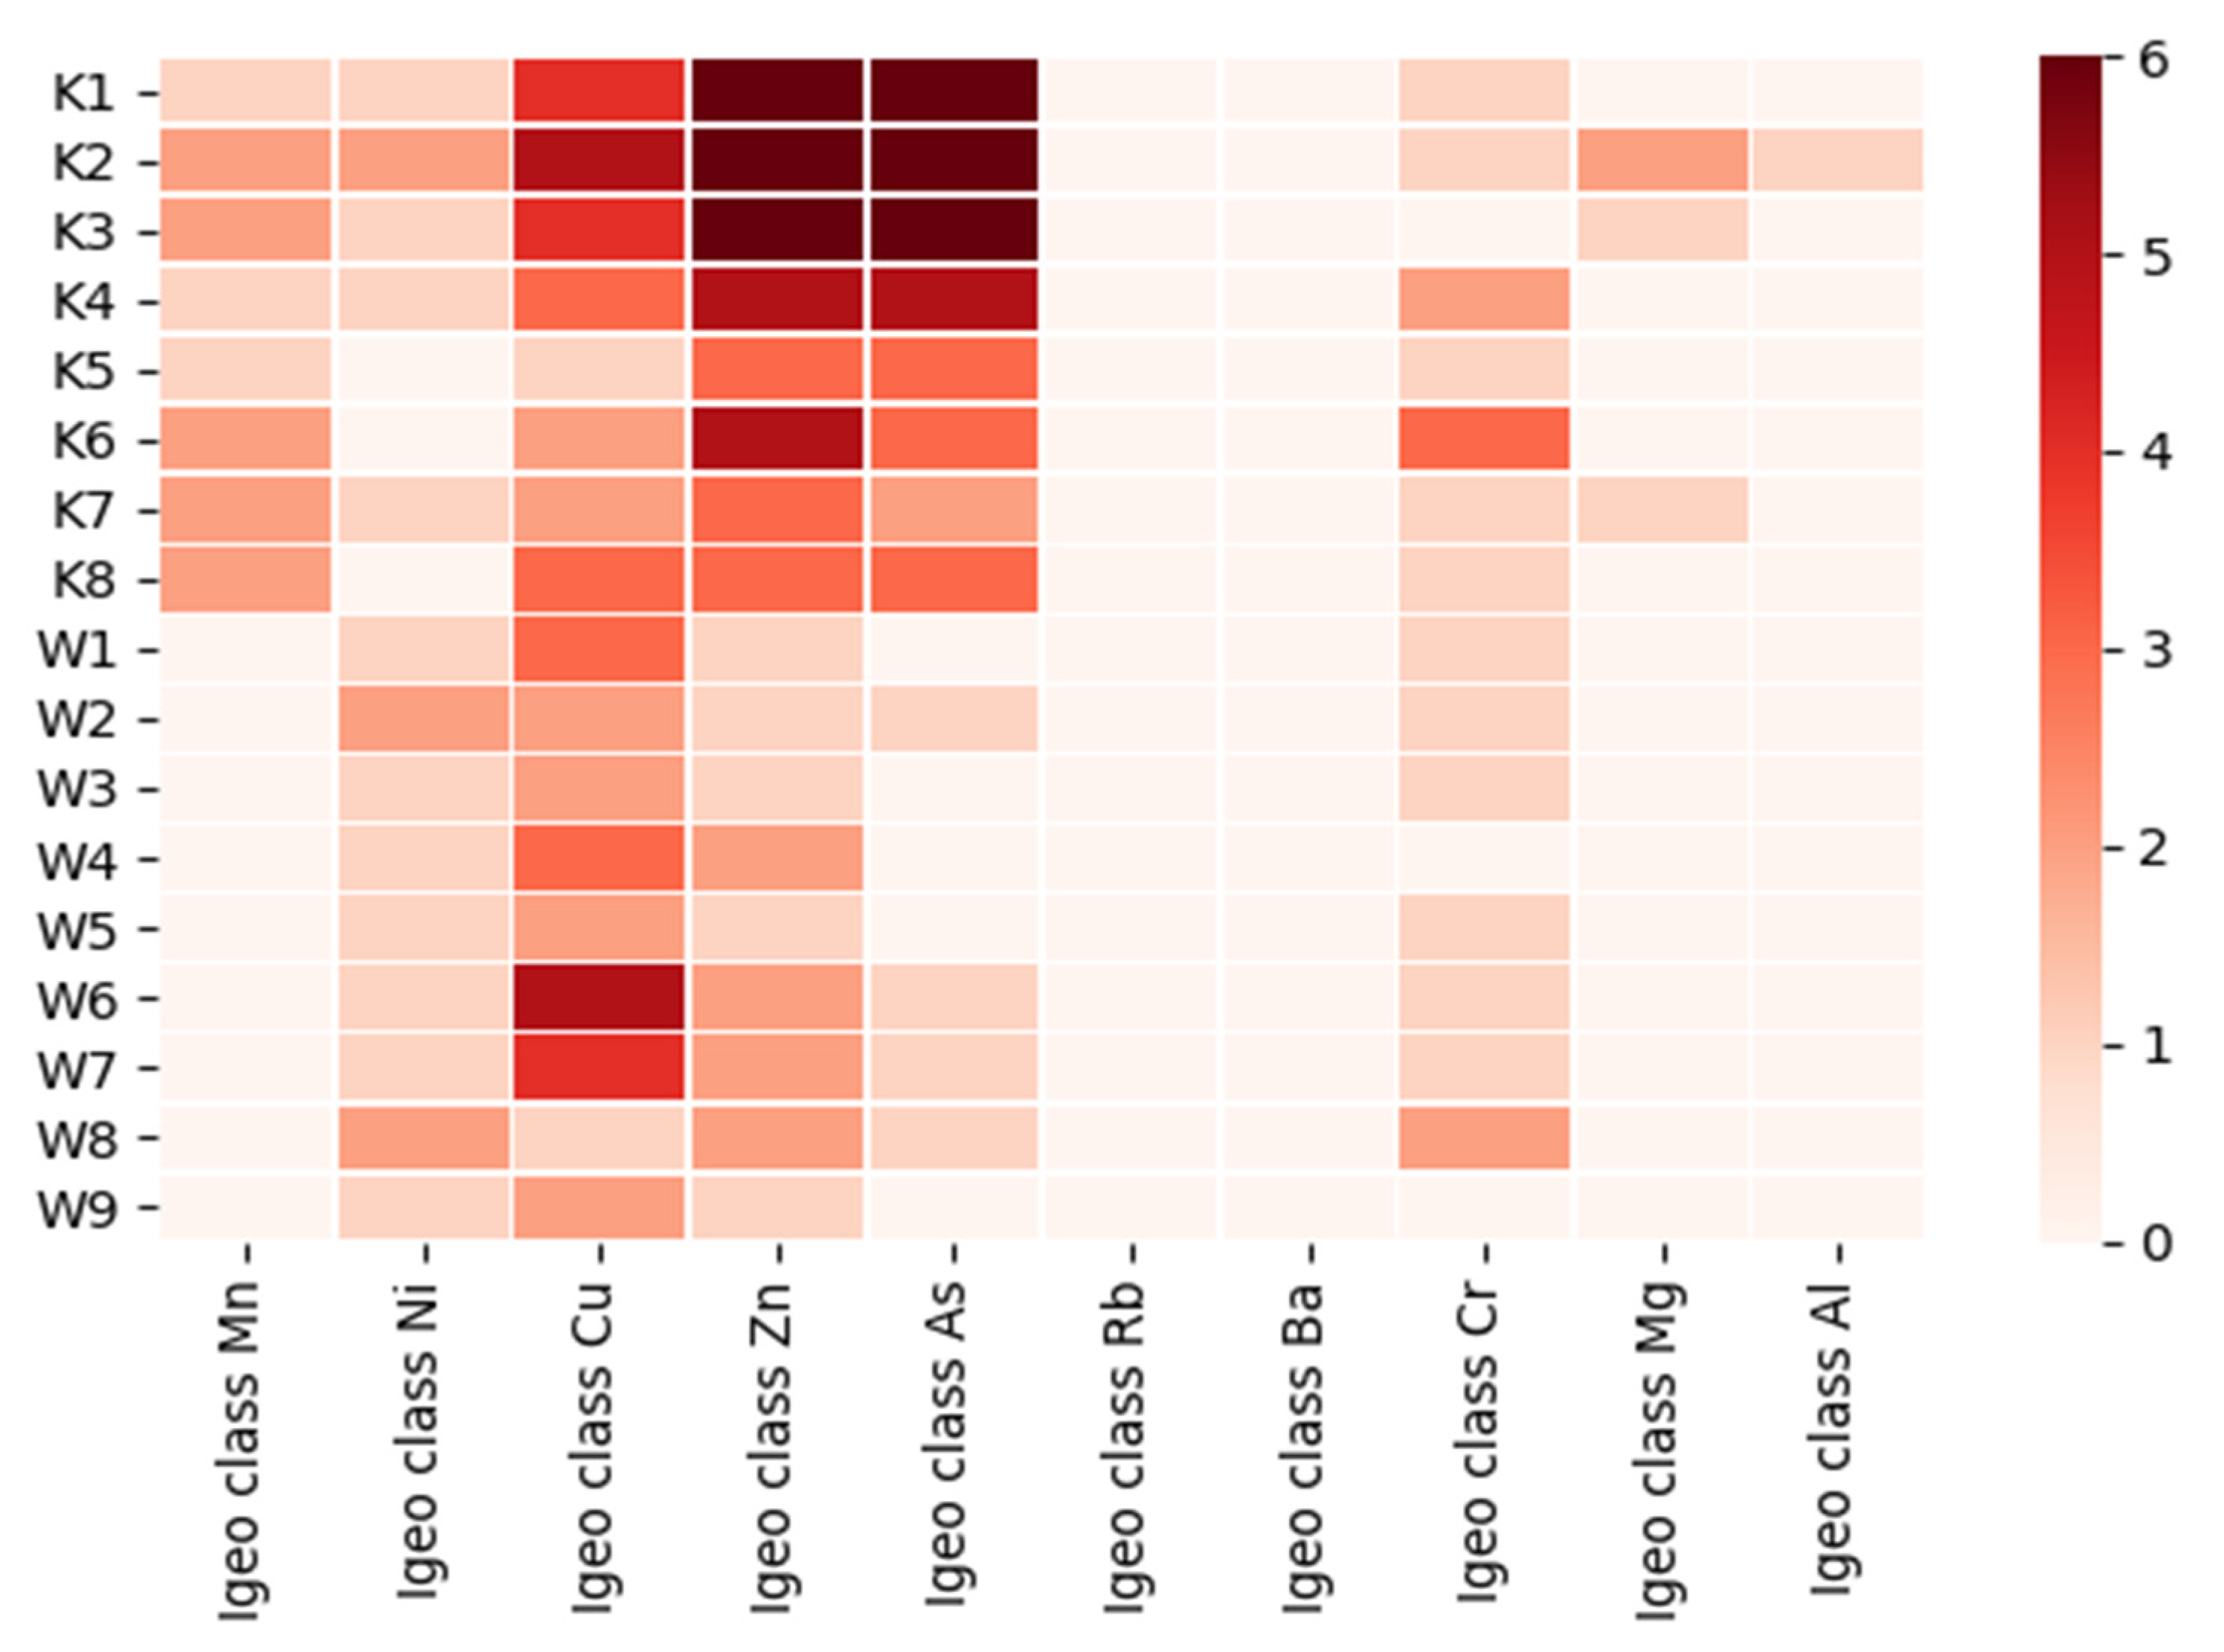
3.3.3. Geoaccumulation Index I geo

The geoaccumulation index (Igeo) was also calculated for both regions. Mn, Zn, As, Cr, and Mg have higher I geo classes in Katowice than in Wrocław, while for Ni, higher I geo classes are observed in Wrocław (Figure 6). The values of I geo indicate no pollution of Mn, Mg, and Al in Wrocław and Rb and Ba in Katowice. The geoaccumulation index class of Zn and As in a few Katowice sites is 6, i.e., these sites are extremely polluted by Zn and As. In Upper Silesia, Zn and As are typical markers of coal combustion [38].

3.4. The Assessment of Health Risk

3.4.1. Exposure Dose

Health risk assessment is closely related to the exposure dose introduced via oral (ing), inhalation (inh) or dermal (derm) route (Table 11 and Table 12). Our studies have shown that the largest amounts of URD-bound metals are absorbed via oral route (maximum dose was obtained for Mg in Katowice for children— Average Daily Dose (ADD)ing 1.4 × 10⁵ ng/kg·d), as shown in Table 11. It was also observed that dust is minimally absorbed by inhalation (the minimum dose was recorded for Ni in Katowice for adults—ADDinh 1.7 × 10⁻³ ng/kg·d). There were also differences in exposure within adults and children. ADD for children via oral route was almost two times higher than adults.
For example, ADDing for Mn ranged from 1.3 × 10³ to 4.2 × 10³ ng/kg·d for adults and from 3 × 10³ to 9.8 × 10³ ng/kg·d for children. However, when comparing dermal exposure pathway is the highest for adults: for example, ADDderm for Mn ranged from 2.6 × 101 to 8.3 × 101 ng/kg·d for adults and from 1.7 × 10⁻¹ to 5.5 × 101 ng/kg·d for children.
Similar observations were recorded by other studies [27,86]. Children are the most exposed health risk group as ADD via oral and inhalation route is about two times higher in children than adults, while the opposite trend was observed when analyzing the dermal route, in this case adults are the most endangered group [27,86].

3.4.2. Non-Cancerogenic Health Risk Assessment

The results clearly indicate that the greatest health risk is caused by URD penetrating through the digestive tract (in this case HQ had the highest values), as shown in Table 13 and Table 14. It is clear because HQ values are results of the exposure dose (Table 13 and Table 14). The hazard quotient values decrease as follows: HQing > HQderm > HQinh both for adults and children and both in Katowice and Wrocław. The overall hazard index HI values for studied metals are rather low and in most cases, HI value does not exceed 1 (is in the range 0−1 × 100). These results indicate a low harmfulness of WORD-related metals to human health in Katowice and Wrocław. One exception is As in URD from Upper Silesia. The HI result for As in Katowice for children is 1.3 × 10⁻¹, which indicates harmful effects on human health, especially for children. In URD samples from Wrocław, no metal has HI value greater than 1. In general, both HQ and HI values are lower for URD samples from Lower Silesia than in the URD samples from Upper Silesia (Table 13 and Table 14).

3.4.3. Cancer Risk Assessment

Results of the excess cancer risk (ECR) calculations are presented in Table 15 and Table 16. The highest ECR (2.2 × 10⁻⁸–2.4 × 10⁻⁷) was recorded for As, for children living in Katowice while the lowest ECR (for children 5.2 × 10⁻¹⁰–1.1 × 10⁻⁹) was recorded for Ni, for children in Katowice also. None of obtained values were higher than 10−6, which indicates that there is no serious risk of cancer. However, it was observed that ECR values for URD from Katowice are closer to the permissible limit (10−6) than those in Wrocław (Table 15 and Table 16).
In general, the cancer risk due to URD should be estimated taking into account PAHs. They are obviously components in collected samples as URD involves both elemental and organic carbon. The estimates presented in this work are lower estimates.
What is interesting, the comparison made with other studies for URD and PM species suggest that the increase of ECR for Upper Silesia population was recorded in both cases, thus the simplified approach presented in this paper could be justified [41,87].

4. Conclusions

The present study demonstrated the distribution, possible sources of selected elements Mn, Ni, Cu, Zn, As, Rb, Ba, Cr, Mg, and Al; and environmental and health risk assessment of urban road dust (URD) in two city agglomerations: Wrocław (Lower Silesia) and Katowice (Upper Silesia). In general, the total content of metals in URD were higher in Katowice than in Wrocław. Pollution Load Index (PLI) indicates that all sites in Katowice region are more severely polluted by studied elements than Wrocław region. The results of enrichment factor (EF) of URD samples from Katowice showed Zn and As were the main anthropogenic origin pollutants in URD. URD from Katowice was from very highly to extremely highly enriched with Cu and minimally to extremely high enriched with Mn, Cr, Mg, and Ni. The EF factor for Wrocław agglomeration indicated Cu as a main anthropogenic pollutant in URD, then Ni, Zn and As showed from very high to extremely high EF. URD in Wrocław was minimally to extremely highly enriched with Mn, Cr, Mg. Rb, Ba, and Al, which are typical crustal elements in URD both in Katowice and Wrocław. The mean values of Igeo for Katowice region suggest that Zn and As are the main pollutants, while in the Wrocław region, there are Cu, Zn, Cr, and Ni. According to the pollution indices, Zn, As and Cu are the primary pollution elements in both regions, probably originated from fuel combustion, traffic activities, domestic heating, and industrial emissions. Additionally, the potential origins of Cu were alloys corrosion in vehicle covers and components, or other materials and metallic surfaces. The principle component analysis (PCA) and correlation analysis provide important information about the potential sources of the elements in URD, which was supported by the results obtained for a positive matrix factorization (PMF) as four factors in PMF analysis were found and interpretation was done by comparing them to the source profiles available at source apportionment for Europa [63]. Two main emission sources of URD-bound metals were identified: road traffic (both exhaust and non-exhaust) and domestic/industrial combustion of fossil fuels. The first one is most important for the shape of elemental composition of URD in Lower Silesia; the second for elemental composition of URD in Upper Silesia.
The health risk analysis shows that intake of the contaminated urban road dust particles was the major pathway of exposure to the metals (oral route) for the children and the adults in both agglomerations, then through dermal contact. The health exposure expressed by the health risk hazard quotient decreases: HQing > HQderm > HQinh. However, the overall hazard index is rather low, which suggests a low harmfulness of the URD for human health in both Katowice and Wrocław agglomerations. The only exception is URD-bound As in Katowice agglomeration, which indicates the great health impact of this metal when ingested by children.
The trend of excess cancer risk (ECR) was similar in both adults and children: As > Cr (VI) > Ni in Katowice and Wrocław. All the values were within safe limit as they were under the range limit of 10−6, which means that URD did not produce a serious carcinogenic risk. Although again the values from Katowice agglomeration were closer to limit values.
To summarise, the elements content in URD from typical urban sites in Upper Silesia were relatively higher than in urban sites in Lower Silesia. It is due to the influences of domestic heating with the use of hard and brawn coal and industrial activity. The main source of metals in road dust in Lower Silesia region is heavy road traffic. It was demonstrated that stationary combustion of fossil fuels is probably a more effective source of toxic and potentially toxic metals than fuel combustion in mobile sources.
Finally, it must be underlined that the environmental risk of metals in URD also depends on their speciation in the URD and contribution of different size particles. According to foreign studies [88], nearly one half of street dusts may become re-suspended into the air with the wind and about 10% street dust enter into the respiratory system. However, such studies have never been conducted in Poland. That is why the analysis of carcinogenic exposure to metals in URD was done on water-soluble fraction of metals, as it is known that this fraction comes mainly from the deposition of PM-bound metals.

Supplementary Materials

The following are available online at https://www.mdpi.com/2073-4433/11/3/290/s1, Table S1. PMF factors for Katowice sites; Table S2. PMF factors for Wrocław sites.

Author Contributions

Conceptualization, W.R.-K.; methodology, W.R.-K., J.S.B. and M.W.; data process, statistical analysis and visualization, W.R.-K., J.S.B., J.R. and M.W.; data acquisition W.R.-K., and M.W.; writing, J.R. and W.R.-K.; reviewing and editing by J.R. and W.R.-K. All authors have read and agree to the published version of the manuscript.

Funding

This research was co-financed within the framework of order No. 82011003902 with a specific subsidy granted to the Faculty of Environmental Engineering, Wroclaw University of Science and Technology (W-7), by the Minister of Science and Higher Education.

Conflicts of Interest

The authors declare no conflict of interest. The funders had no role in the design of the study; in the collection, analyses, or interpretation of data; in the writing of the manuscript, or in the decision to publish the results.

References

  1. Guerreiro, C.; de Leeuw, F.; Ortiz, A.G.; Viana, M.; Colette, A. Air Quality in Europe—2018 Report; European Environment Agency: Luxembourg, 2018. [Google Scholar]
  2. Air Quality in Europe—2017 Report No 13/2017; European Environment Agency: Luxembourg, 2017; ISBN 9789292139216.
  3. Zajusz-Zubek, E.; Mainka, A.; Korban, Z.; Pastuszka, J.S. Evaluation of highly mobile fraction of trace elements in PM10 collected in Upper Silesia (Poland): Preliminary results. Atmos. Pollut. Res. 2015, 6, 961–968. [Google Scholar] [CrossRef]
  4. Houthuijs, D.; Breugelmans, O.; Hoek, G.; Vaskövi, É.; Miháliková, E.; Pastuszka, J.S.; Jirik, V.; Sachelarescu, S.; Lolova, D.; Meliefste, K.; et al. PM10 and PM2.5 concentrations in Central and Eastern Europe: Results from the Cesar study. Atmos. Environ. 2001, 35, 2757–2771. [Google Scholar] [CrossRef]
  5. Huszar, P.; Juda-Rezler, K.; Halenka, T.; Chervenkov, H.; Syrakov, D.; Krüger, B.C.; Zanis, P.; Melas, D.; Katragkou, E.; Reizer, M.; et al. Effects of climate change on ozone and particulate matter over Central and Eastern Europe. Clim. Res. 2011, 50, 51–68. [Google Scholar] [CrossRef]
  6. Majewski, G.; Rogula-Kozlowska, W.; Czechowski, P.O.; Badyda, A.; Brandyk, A. The impact of selected parameters on visibility: First results from a long-term campaign in Warsaw, Poland. Atmosphere 2015, 6, 1154–1174. [Google Scholar] [CrossRef] [Green Version]
  7. Sówka, I.; Chlebowska-Styś, A.; Pachurka, Ł.; Rogula-Kozłowska, W. Seasonal variations of PM2.5 and PM10 concentrations and inhalation exposure from PM-bound metals (As, Cd, Ni): First studies in Poznań (Poland). Arch. Environ. Prot. 2018, 44, 86–95. [Google Scholar]
  8. Majewski, J.G.; Przewožniczuk, W. Study of particulate matter pollution in Warsaw area. Polish J. Environ. Stud. 2009, 18, 293–300. [Google Scholar]
  9. Rogula-Kozłowska, W.; Błaszczak, B.; Szopa, S.; Klejnowski, K.; Sówka, I.; Zwoździak, A.; Jabłońska, M.; Mathews, B. PM2.5 in the central part of Upper Silesia, Poland: Concentrations, elemental composition, and mobility of components. Environ. Monit. Assess. 2013, 185, 581–601. [Google Scholar] [CrossRef]
  10. Rogula-Kozłowska, W.; Klejnowski, K. Submicrometer aerosol in rural and urban backgrounds in southern Poland: Primary and secondary components of PM1. Bull. Environ. Contam. Toxicol. 2013, 90, 103–109. [Google Scholar] [CrossRef]
  11. Kamila, W.; Wioletta, R.K.; Krzysztof, L.; Karolina, K.; Grzegorz, M. Health Risk Impacts of Exposure to Airborne Metals and Benzo(a)Pyrene during Episodes of High PM10Concentrations in Poland. Biomed. Environ. Sci. 2018, 31, 23–36. [Google Scholar]
  12. Pastuszka, J.S.; Rogula-Kozłowska, W.; Zajusz-Zubek, E. Characterization of PM10 and PM2.5 and associated heavy metals at the crossroads and urban background site in Zabrze, Upper Silesia, Poland, during the smog episodes. Environ. Monit. Assess. 2010, 168, 613–627. [Google Scholar] [CrossRef]
  13. Juda-Rezler, K.; Reizer, M.; Oudinet, J.P. Determination and analysis of PM10 source apportionment during episodes of air pollution in Central Eastern European urban areas: The case of wintertime 2006. Atmos. Environ. 2011, 45, 6557–6566. [Google Scholar] [CrossRef]
  14. Majewski, G.; Rogula-Kozłowska, W. The elemental composition and origin of fine ambient particles in the largest Polish conurbation: first results from the short-term winter campaign. Theor. Appl. Climatol. 2016, 125, 79–92. [Google Scholar] [CrossRef] [Green Version]
  15. Majewski, G.; Rogula-Kozłowska, W.; Rozbicka, K.; Rogula-Kopiec, P.; Mathews, B.; Brandyk, A. Concentration, chemical composition and origin of PM1: Results from the first long-term measurement campaign in warsaw (Poland). Aerosol Air Qual. Res. 2018, 18, 636–654. [Google Scholar] [CrossRef]
  16. Zgłobicki, W.; Telecka, M.; Skupiński, S. Assessment of short-term changes in street dust pollution with heavy metals in Lublin (E Poland)—Levels, sources and risks. Environ. Sci. Pollut. Res. 2019, 26, 35049–35060. [Google Scholar] [CrossRef] [Green Version]
  17. Adamiec, E.; Jarosz-Krzemińska, E. Human Health Risk Assessment associated with contaminants in the finest fraction of sidewalk dust collected in proximity to trafficked roads. Sci. Rep. 2019, 9, 16364–16378. [Google Scholar] [CrossRef]
  18. Trojanowska, M.; Świetlik, R. Investigations of the chemical distribution of heavy metals in street dust and its impact on risk assessment for human health, case study of Radom (Poland). Hum. Ecol. Risk Assess. 2019, 1–20. [Google Scholar] [CrossRef]
  19. Logiewa, A.; Miazgowicz, A.; Krennhuber, K.; Lanzerstorfer, C. Variation in the Concentration of Metals in Road Dust Size Fractions Between 2 µm and 2 mm: Results from Three Metallurgical Centres in Poland. Arch. Environ. Contam. Toxicol. 2020, 78, 46–59. [Google Scholar] [CrossRef] [Green Version]
  20. Świetlik, R.; Strzelecka, M.; Trojanowska, M. Evaluation of traffic-related heavy metals emissions using noise barrier road dust analysis. Polish J. Environ. Stud. 2013, 22, 561–567. [Google Scholar]
  21. Khanal, R.; Furumai, H.; Nakajima, F. Toxicity assessment of size-fractionated urban road dust using ostracod Heterocypris incongruens direct contact test. J. Hazard. Mater. 2014, 264, 53–64. [Google Scholar] [CrossRef]
  22. Gope, M.; Masto, R.E.; George, J.; Hoque, R.R.; Balachandran, S. Bioavailability and health risk of some potentially toxic elements (Cd, Cu, Pb and Zn) in street dust of Asansol, India. Ecotoxicol. Environ. Saf. 2017, 138, 231–241. [Google Scholar] [CrossRef]
  23. Birch, G.F.; Scollen, A. Heavy metals in road dust, gully pots and parkland soils in a highly urbanised sub-catchment of Port Jackson, Australia. Aust. J. Soil Res. 2003, 41, 1329–1342. [Google Scholar] [CrossRef]
  24. Men, C.; Liu, R.; Xu, F.; Wang, Q.; Guo, L.; Shen, Z. Pollution characteristics, risk assessment, and source apportionment of heavy metals in road dust in Beijing, China. Sci. Total Environ. 2018, 612, 138–147. [Google Scholar] [CrossRef] [PubMed]
  25. Tüzen, M. Investigation of heavy metal levels in street dust samples in Tokat, Turkey. J. Trace Microprobe Tech. 2003, 21, 513–521. [Google Scholar] [CrossRef]
  26. Bourliva, A.; Papadopoulou, L.; Aidona, E. Study of road dust magnetic phases as the main carrier of potentially harmful trace elements. Sci. Total Environ. 2016, 553, 380–391. [Google Scholar] [CrossRef] [PubMed]
  27. Voutsa, D.; Anthemidis, A.; Giakisikli, G.; Mitani, K.; Besis, A.; Tsolakidou, A.; Samara, C. Size distribution of total and water-soluble fractions of particle-bound elements—assessment of possible risks via inhalation. Environ. Sci. Pollut. Res. 2015, 22, 13412–13426. [Google Scholar] [CrossRef] [PubMed]
  28. Hlavay, J.; Polyák, K.; Molnár, Á.; Mészáros, E. Determination of the distribution of elements as a function of particle size in aerosol samples by sequential leaching. Analyst 1998, 123, 859–863. [Google Scholar] [CrossRef]
  29. Shi, G.; Chen, Z.; Bi, C.; Wang, L.; Teng, J.; Li, Y.; Xu, S. A comparative study of health risk of potentially toxic metals in urban and suburban road dust in the most populated city of China. Atmos. Environ. 2011, 45, 764–771. [Google Scholar] [CrossRef]
  30. Harrison, R.M.; Jones, A.M.; Gietl, J.; Yin, J.; Green, D.C. Estimation of the contributions of brake dust, tire wear, and resuspension to nonexhaust traffic particles derived from atmospheric measurements. Environ. Sci. Technol. 2012, 46, 6523–6529. [Google Scholar] [CrossRef]
  31. Pant, P.; Harrison, R.M. Estimation of the contribution of road traffic emissions to particulate matter concentrations from field measurements: A review. Atmos. Environ. 2013, 77, 78–97. [Google Scholar] [CrossRef]
  32. Pant, P.; Shi, Z.; Pope, F.D.; Harrison, R.M. Characterization of traffic-related particulate matter emissions in a road tunnel in Birmingham, UK: Trace metals and organic molecular markers. Aerosol Air Qual. Res. 2017, 17, 117–130. [Google Scholar] [CrossRef] [Green Version]
  33. Thorpe, A.; Harrison, R.M. Sources and properties of non-exhaust particulate matter from road traffic: A review. Sci. Total Environ. 2008, 400, 270–282. [Google Scholar] [CrossRef] [PubMed]
  34. Gunawardana, C.; Goonetilleke, A.; Egodawatta, P.; Dawes, L.; Kokot, S. Source characterisation of road dust based on chemical and mineralogical composition. Chemosphere 2012, 87, 163–170. [Google Scholar] [CrossRef] [PubMed] [Green Version]
  35. Park, M.; Joo, H.S.; Lee, K.; Jang, M.; Kim, S.D.; Kim, I.; Borlaza, L.J.S.; Lim, H.; Shin, H.; Chung, K.H.; et al. Differential toxicities of fine particulate matters from various sources. Sci. Rep. 2018, 8, 17007–170012. [Google Scholar] [CrossRef] [PubMed]
  36. Lee, K.Y.; Batmunkh, T.; Joo, H.S.; Park, K. Comparison of the physical and chemical characteristics of fine road dust at different urban sites. J. Air Waste Manag. Assoc. 2018, 68, 812–823. [Google Scholar] [CrossRef] [Green Version]
  37. Feng, X.D.; Dang, Z.; Huang, W.L.; Yang, C. Chemical speciation of fine particle bound trace metals. Int. J. Environ. Sci. Technol. 2009, 6, 337–346. [Google Scholar] [CrossRef] [Green Version]
  38. Rogula-Kozłowska, W.; Klejnowski, K.; Rogula-Kopiec, P.; Ośródka, L.; Krajny, E.; Błaszczak, B.; Mathews, B. Spatial and seasonal variability of the mass concentration and chemical composition of PM2.5 in Poland. Air Qual. Atmos. Health 2014, 7, 41–58. [Google Scholar] [CrossRef] [Green Version]
  39. Han, X.; Lu, X.; Qinggeletu; Wu, Y. Health risks and contamination levels of heavy metals in dusts from parks and squares of an industrial city in semi-arid area of China. Int. J. Environ. Res. Public Health 2017, 14, 886. [Google Scholar] [CrossRef] [Green Version]
  40. Li, N.; Han, W.; Tang, J.; Bian, J.; Sun, S.; Song, T. Pollution characteristics and human health risks of elements in road dust in Changchun, China. Int. J. Environ. Res. Public Health 2018, 15, 1843. [Google Scholar] [CrossRef] [Green Version]
  41. Widziewicz, K.; Rogula-Kozłowska, W. Urban environment as a factor modulating metals deposition in the respiratory track and associated cancer risk. Atmos. Pollut. Res. 2018, 9, 399–410. [Google Scholar] [CrossRef]
  42. Wuana, R.A.; Okieimen, F.E. Heavy Metals in Contaminated Soils: A Review of Sources, Chemistry, Risks and Best Available Strategies for Remediation. ISRN Ecol. 2011, 2011, 1–20. [Google Scholar] [CrossRef] [Green Version]
  43. Kobza, J.; Geremek, M.; Dul, L. Characteristics of air quality and sources affecting high levels of PM10 and PM2.5 in Poland, Upper Silesia urban area. Environ. Monit. Assess. 2018, 190, 515. [Google Scholar] [CrossRef] [PubMed] [Green Version]
  44. Sówka, I.; Bezyk, Y.; Pachurka, Ł. Analysis and assessment of air quality in the cities area of Wrocław (Poland) and Lviv (Ukraine). Sci. Rev. Eng. Environ. Sci. 2015, 24, 178–192. [Google Scholar]
  45. US EPA. Risk Assessment Guidance for Superfund Volume I: Human Health Evaluation Manual (Part F, Supplemental Guidance for Inhalation Risk Assessment). In Off. Superfund Remediat. Technol. Innov. Environ. Prot. Agency; 2009; I, pp. 1–68, EPA-540-R-070-002. [Google Scholar]
  46. USEPA. Risk Assessment Guidance for Superfund (RAGS) Volume III—Part A: Process for Conducting Probabilistic Risk Assessment, Appendix B. In Off. Emerg. Remedial Response U.S. Environ. Prot. Agency; 2001; III, pp. 1–385. [Google Scholar]
  47. US-EPA. Framework for Human Health Risk Assessment to Inform Decision Making. 2014. Available online: http://www.epa.gov/sites/production/files/2014-12/documents/hhra-framework-final-2014.pdf (accessed on 6 March 2020).
  48. US EPA. Risk Assessment Guidance for Superfund, Vol. I: Human Health Evaluation; Office of Emergency and Remedial Response, US EPA: Washington, DC, USA, 1989.
  49. U.S. EPA. Integrated Risk Information System: Lead. U.S. Environmental Protection Agency. 2004. Available online: https://cfpub.epa.gov/ncea/iris/iris_documents/documents/subst/0277_summary.pdf (accessed on 2 February 2020).
  50. Jain, S.; Sharma, S.K.; Choudhary, N.; Masiwal, R.; Saxena, M.; Sharma, A.; Mandal, T.K.; Gupta, A.; Gupta, N.C.; Sharma, C. Chemical characteristics and source apportionment of PM2.5 using PCA/APCS, UNMIX, and PMF at an urban site of Delhi, India. Environ. Sci. Pollut. Res. 2017, 24, 14637–14656. [Google Scholar] [CrossRef]
  51. Olawoyin, R.; Schweitzer, L.; Zhang, K.; Okareh, O.; Slates, K. Index analysis and human health risk model application for evaluating ambient air-heavy metal contamination in Chemical Valley Sarnia. Ecotoxicol. Environ. Saf. 2018, 148, 72–81. [Google Scholar] [CrossRef]
  52. USEPA. Risk Assessment Guidance for Superfund (RAGS). Volume I. Human Health Evaluation Manual (HHEM). Part E. Supplemental Guidance for Dermal Risk Assessment. US EPA 2004. Available online: https://www.epa.gov/sites/production/files/2015-09/documents/part_e_final_revision_10-03-07.pdf (accessed on 2 February 2020).
  53. McKinney, W. Data Structures for Statistical Computing in Python. In Proceedings of the 9th Python in Science Conference, Austin, TX, USA, 28 June–3 July 2010; Available online: https://www.semanticscholar.org/paper/Data-Structures-for-Statistical-Computing-in-Python-McKinney/f6dac1c52d3b07c993fe52513b8964f86e8fe381 (accessed on 2 February 2020).
  54. Hunter, J.D. Matplotlib: A 2D graphics environment. Comput. Sci. Eng. 2007, 9, 99–104. [Google Scholar] [CrossRef]
  55. Waskom, M. Seaborn: Statistical Data Visualization—Seaborn 0.9.0 Documentation. Sphinx 1.7.4, 2018. [Google Scholar]
  56. Demšar, J.; Curk, T.; Erjavec, A.; Gorup, Č.; Hočevar, T.; Milutinovič, M.; Možina, M.; Polajnar, M.; Toplak, M.; Starič, A.; et al. Orange: Data mining toolbox in python. J. Mach. Learn. Res. 2013, 14, 2349–2353. [Google Scholar]
  57. Norris, G.; Duvall, R.; Brown, S.; Bai, S. EPA Positive M atrix Factorization (PMF) 5.0 Fundamentals and User Guide; EPA/600/R-14/108; U.S. Environmental Protection Agency Office of Research and Development: Washington, DC, USA, 2014.
  58. Thurston, G.D.; Spengler, J.D. A quantitative assessment of source contributions to inhalable particulate matter pollution in metropolitan Boston. Atmos. Environ. 1985, 19, 9–25. [Google Scholar] [CrossRef]
  59. Chen, H.; Lu, X.; Li, L.Y.; Gao, T.; Chang, Y. Metal contamination in campus dust of Xi’an, China: A study based on multivariate statistics and spatial distribution. Sci. Total Environ. 2014, 484, 27–35. [Google Scholar] [CrossRef]
  60. Yang, Y.; Yang, X.; He, M.; Christakos, G. Beyond mere pollution source identification: Determination of land covers emitting soil heavy metals by combining PCA/APCS, GeoDetector and GIS analysis. Catena 2020, 185, 104297. [Google Scholar] [CrossRef]
  61. Yongming, H.; Peixuan, D.; Junji, C.; Posmentier, E.S. Multivariate analysis of heavy metal contamination in urban dusts of Xi’an, Central China. Sci. Total Environ. 2006, 355, 176–186. [Google Scholar] [CrossRef] [PubMed]
  62. Paatero, P.; Tapper, U. Positive matrix factorization: A non-negative factor model with optimal utilization of error estimates of data values. Environmetrics 1994, 5, 111–126. [Google Scholar] [CrossRef]
  63. Joints Research Centre, Source Apportionment. Available online: https://source-apportionment.jrc.ec.europa.eu/Specieurope/index.aspx (accessed on 2 February 2020).
  64. Tomlinson, D.L.; Wilson, J.G.; Harris, C.R.; Jeffrey, D.W. Problems in the assessment of heavy-metal levels in estuaries and the formation of a pollution index. Helgoländer Meeresunters 1980, 33, 566–575. [Google Scholar] [CrossRef] [Green Version]
  65. Hans Wedepohl, K. The composition of the continental crust. Geochim. Cosmochim. Acta 1995, 59, 1217–1232. [Google Scholar] [CrossRef]
  66. Nagarajan, R.; Anandkumar, A.; Hussain, S.M.; Jonathan, M.P.; Ramkumar, M.; Eswaramoorthi, S.; Saptoro, A.; Chua, H.B. Geochemical Characterization of Beach Sediments of Miri, NW Borneo, SE Asia: Implications on Provenance, Weathering Intensity, and Assessment of Coastal Environmental Status. Coast. Zone Manag. 2019, 12, 279–330. [Google Scholar]
  67. Barbieri, M. The Importance of Enrichment Factor (EF) and Geoaccumulation Index (Igeo) to Evaluate the Soil Contamination. J. Geol. Geophys 2016, 5, 1. [Google Scholar] [CrossRef]
  68. Reimann, C.; De Caritat, P. Intrinsic flaws of element enrichment factors (EFs) in environmental geochemistry. Environ. Sci. Technol. 2000, 34, 5084–5091. [Google Scholar] [CrossRef]
  69. Bern, C.R.; Walton-Day, K.; Naftz, D.L. Improved enrichment factor calculations through principal component analysis: Examples from soils near breccia pipe uranium mines, Arizona, USA. Environ. Pollut. 2019, 248, 90–100. [Google Scholar] [CrossRef]
  70. Mueller, G. Schwermetalle in Den Sedimenten des Rheins—Veranderungen Seit 1971. Umsch. Wiss. Tech. 1979, 79, 778–783. [Google Scholar]
  71. Müller, G. Schadstoffe in Sedimenten—Sedimente als Schadstoffe. Umsch. Wiss. Tech. 1986, 79, 778–783. [Google Scholar]
  72. Rogula-Kozłowska, W. Chemical composition and mass closure of ambient particulate matter at a crossroads and a highway in Katowice, Poland. Environ. Prot. Eng. 2015, 41, 15–29. [Google Scholar]
  73. Rybak, J. Accumulation of Major and Trace Elements in Spider Webs. Water Air Soil Pollut. 2015, 226, 105. [Google Scholar] [CrossRef] [PubMed] [Green Version]
  74. Okorie, A.; Entwistle, J.; Dean, J.R. Estimation of daily intake of potentially toxic elements from urban street dust and the role of oral bioaccessibility testing. Chemosphere 2012, 86, 460–467. [Google Scholar] [CrossRef]
  75. Saeedi, M.; Li, L.Y.; Salmanzadeh, M. Heavy metals and polycyclic aromatic hydrocarbons: Pollution and ecological risk assessment in street dust of Tehran. J. Hazard. Mater. 2012, 227–228, 9–17. [Google Scholar] [CrossRef]
  76. KiebałA, A.; Kozieł, M.; Telecka, M.; ZgłObicki, W. Wielowymiarowa analiza statystyczna metali ciężkich w pyle drogowym na obszarze Lublina. J. Civ. Eng. Environ. Archit. 2015, XXXII, 219–232. [Google Scholar] [CrossRef]
  77. Pulles, T.; Denier van der Gon, H.; Appelman, W.; Verheul, M. Emission factors for heavy metals from diesel and petrol used in European vehicles. Atmos. Environ. 2012, 61, 641–651. [Google Scholar] [CrossRef]
  78. Ogunfowokan, A.O.; Oyekunle, J.A.O.; Durosinmi, L.M.; Akinjokun, A.I.; Gabriel, O.D. Speciation study of lead and manganese in roadside dusts from major roads in Ile-Ife, South Western Nigeria. Chem. Ecol. 2009, 25, 405–415. [Google Scholar] [CrossRef]
  79. Balakrishna, G.; Pervez, S.; Bisht, D.S. Source apportionment of arsenic in atmospheric dust fall out in an urban residential area, Raipur, Central India. Atmos. Chem. Phys. 2011, 11, 5141–5151. [Google Scholar] [CrossRef] [Green Version]
  80. von Schneidemesser, E.; Stone, E.A.; Quraishi, T.A.; Shafer, M.M.; Schauer, J.J. Toxic metals in the atmosphere in Lahore, Pakistan. Sci. Total Environ. 2010, 408, 1640–1648. [Google Scholar] [CrossRef]
  81. Heal, M.R.; Hibbs, L.R.; Agius, R.M.; Beverland, I.J. Total and water-soluble trace metal content of urban background PM 10, PM2.5 and black smoke in Edinburgh, UK. Atmos. Environ. 2005, 39, 1417–1430. [Google Scholar] [CrossRef] [Green Version]
  82. Rogula-Kozłowska, W.; Kozielska, B.; Klejnowski, K.; Szopa, S. Hazardous compounds in urban PM in the central part of upper Silesia (Poland) in winter. Arch. Environ. Prot. 2013, 39, 53–65. [Google Scholar] [CrossRef]
  83. Górka, M.; Bartz, W.; Rybak, J. The mineralogical interpretation of particulate matter deposited on Agelenidae and Pholcidae spider webs in the city of Wrocław (SW Poland): A preliminary case study. J. Aerosol Sci. 2018, 123, 63–75. [Google Scholar] [CrossRef]
  84. Sówka, I.; Chlebowska-Stys, A.; Pachurka, Ł.; Rogula-Kozłowska, W.; Mathews, B. Analysis of particulate matter concentration variability and origin in selected urban areas in Poland. Sustainability 2019, 11, 5735. [Google Scholar] [CrossRef] [Green Version]
  85. Wioletta, R.K.; Klejnowski, K.; Patrycja, R.K.; Mathews, B.; Szopa, S. A study on the seasonal mass closure of ambient fine and coarse dusts in Zabrze, Poland. Bull. Environ. Contam. Toxicol. 2012, 88, 722–729. [Google Scholar]
  86. Świetlik, R.; Trojanowska, M.; Strzelecka, M.; Bocho-Janiszewska, A. Fractionation and mobility of Cu, Fe, Mn, Pb and Zn in the road dust retained on noise barriers along expressway—A potential tool for determining the effects of driving conditions on speciation of emitted particulate metals. Environ. Pollut. 2015, 196, 404–413. [Google Scholar] [CrossRef]
  87. Widziewicz, K.; Rogula-Kozłowska, W.; Loska, K. Cancer risk from arsenic and chromium species bound to PM2.5 and PM1—Polish case study. Atmos. Pollut. Res. 2016, 7, 884–894. [Google Scholar] [CrossRef]
  88. Patra, A.; Colvile, R.; Arnold, S.; Bowen, E.; Shallcross, D.; Martin, D.; Price, C.; Tate, J.; ApSimon, H.; Robins, A. On street observations of particulate matter movement and dispersion due to traffic on an urban road. Atmos. Environ. 2008, 42, 3911–3926. [Google Scholar] [CrossRef]
Figure 1. Location of the sampling sites in Lower (purple) and Upper (orange) Silesia Provinces, Poland.
Atmosphere 11 00290 g001
Figure 2. The total concentration of metals in the URD (T-total). In the plot, the box represents the interquartile range, the median is marked with an orange line, and whiskers are from the minimum to maximum concentration.
Atmosphere 11 00290 g002
Figure 3. The concentration of water-soluble metals in the URD (WS-water-soluble). In the plot, the box represents the interquartile range, the median is marked with an orange line, whiskers are from the minimum to maximum concentration.
Atmosphere 11 00290 g003
Figure 4. The PLI values for K1–K8 (Upper Silesia) and W1–W9 (Lower Silesia).
Atmosphere 11 00290 g004
Figure 5. The enrichment factors (EFs) for URD samples from all studied sites in Upper and Lower Silesia. The ○ symbol represents minimal enrichment, ◔ represents moderate enrichment, ◑—significant enrichment, ◕—very high enrichment, ●—extremely high enrichment.
Atmosphere 11 00290 g005
Figure 6. Heatmap with I geo classes of all elements in 17 sites from Upper and Lower Silesia, Poland.
Atmosphere 11 00290 g006
Table 1. The parameters for calculation of the ADD based on literature data [48].
ParameterAdultsChildren
IngR200100
EF180180
ED706
ATED × 365 d/year = 70 year × 365 dayED × 365 d/year = 6 year × 365 day
BW7015
InhR207,6
PEF1.39 × 1091.39 × 109
ABS0.0010.001
SL0.70.2
SA57002800
ET148
Table 2. The values of the reference doses (RfD) [48].
ng/kg × dRfDingRfDinhRfDderm
Cu4 × 1044 × 1041.2 × 104
Ni2 × 1042 × 1045.4 × 102
Zn3 × 1053 × 1056 × 104
Cr3 × 1032.86 × 1016 × 101
Mn1.4 × 1051.4 × 1054 × 103
As3 × 102-3 × 10²
Mg1.4 × 1051.4 × 105-
Ba2 × 10514.3 × 1014.9 × 103
Table 3. Enrichment factor classes according to Yongming [61].
Class of EFDescription
EF 2 minimal enrichment
2 < EF 5 moderate enrichment
5 < EF 20 significant enrichment
20 < EF 40 very high enrichment
EF > 40 extremely high enrichment
Table 4. Classes of geoaccumulation index I g e o according to Müller [71].
I geo I geo   Class Description
I geo 0 0Practically unpolluted
0 < I geo 1 1Unpolluted to moderately polluted
1 < I geo 2 2Moderately polluted
2 < I geo 3 3Moderately to strong polluted
3 < I geo 4 4Strong polluted
4 < I geo 5 5Strong to extremely polluted
I geo > 5 6Extremely polluted
Table 5. Correlation matrix of total concentrations of metals in URD in Katowice (T-total), correlations highlighted with orange are statistically significant at level p = 0.1 , with yellow p = 0.05 , with green p = 0.01 .
ElementMn-TNi-TCu-TZn-TAs-TRb-TBa-TCr-TMg-TAl-T
Mn-T1.00
Ni-T0.361.00
Cu-T0.470.541.00
Zn-T0.390.600.951.00
As-T0.400.590.970.991.00
Rb-T0.080.550.380.620.551.00
Ba-T0.120.540.760.880.880.631.00
Cr-T−0.33−0.28−0.35−0.34−0.410.03−0.591.00
Mg-T0.540.890.670.760.760.650.73−0.461.00
Al-T0.190.680.810.910.880.670.85−0.250.741.00
Table 6. Correlation matrix of total concentrations of metals in URD in Wrocław (T-total), correlations highlighted with orange are statistically significant at level p = 0.1 , with yellow p = 0.05 , with green p = 0.01 .
ElementMn-TNi-TCu-TZn-TAs-TRb-TBa-TCr-TMg-TAl-T
Mn-T1.00
Ni-T0.191.00
Cu-T0.11−0.151.00
Zn-T0.50−0.310.721.00
As-T0.640.620.270.331.00
Rb-T0.84−0.060.090.490.531.00
Ba-T0.47−0.080.100.480.320.271.00
Cr-T0.250.26−0.180.180.530.250.681.00
Mg-T0.020.82−0.25−0.320.58−0.190.280.661.00
Al-T0.270.07−0.280.090.330.200.800.920.531.00
Table 7. Total metal concentrations in URD in Poland and in selected places in the world (the average values) (T-total) (mg/kg).
CountryCityMn-TNi-TCu-TZn-TAs-TRb-TBa-TCr-TMg-TAl-TReferences
PolandKatowice1619341752683109916210621,01522,370this study
PolandWrocław25850126153310847767005133this study
GreeceThessaloniki5299652667113--187950029,200[26]
AustraliaSydney4815160850---65--[23]
ChinaBeijing55,37332832805--92--[24]
TurkeyTokat285652963---30--[25]
EnglandNew castle-26132421------[74]
IranTeheran117631203791---31--[75]
PolandLublin-2766202---53--[76]
PolandRadom-37173515---65--[18]
PolandWarszawa--109348------[18]
Table 8. The water-soluble fraction of metals in URD in Poland and in the selected places in the world (the average values) (WS—water-soluble) (%).
CountryCityMn-WSNi-WSCu-WSZn-WSAs-WSRb-WSBa-WSCr-WSMg-WSAl-WSReferences
PolandKatowice522717331905115860.0this study
PolandWrocław26162748266588650.1this study
GreeceThessaloniki1215101090-20303070[27]
ChinaBeijing3030204040--10-2[37]
HungaryTihany (Lake Balaton)532131219--17--[28]
UKEdinburgh3810456063--13--[81]
Table 9. PCA components for Katowice sites, components with loading above 0.35 are in bold.
ComponentPC1PC2PC3PC4
Mn-T0.1720.5870.507−0.307
Ni-T0.297−0.0330.4420.363
Cu-T0.3490.109−0.141−0.442
Zn-T0.377−0.060−0.121−0.265
As-T0.3750.011−0.173−0.252
Rb-T0.261−0.4950.2540.196
Ba-T0.353−0.083−0.3810.205
Cr-T−0.181−0.5690.400−0.529
Mg-T0.3520.0840.3240.282
Al-T0.358−0.236−0.091−0.069
Total variance explained65%78%87%95%
Table 10. PCA components for Wrocław sites, components with loading above 0.35 are in bold.
ComponentPC1PC2PC3PC4
Mn-T0.345−0.2740.204−0.395
Ni-T0.1960.3590.5280.060
Cu-T0.023−0.3990.2240.632
Zn-T0.200−0.500−0.0240.297
As-T0.404−0.0160.4230.071
Rb-T0.278−0.3390.128−0.512
Ba-T0.380−0.091−0.3900.168
Cr-T0.4250.173−0.2560.095
Mg-T0.2940.4550.1590.219
Al-T0.3880.160−0.436−0.013
Total variance explained40%67%83%94%
Table 11. Ranges (minimum–maximum) (T—total concentration of element) of Average Daily Dose (ADD) via oral, inhalation, and dermal routes for Katowice agglomeration (ng/kg·d).
Mn-TNi-TCu-TZn-TAs-TBa-TCr-TMg-T
AdultsADD ing1.3 × 103−4.2 × 1032.3 × 101−8.2 × 1015.5 × 100−6.4 × 1026.6 × 102−5.7 × 1031.7 × 101−5.7 × 1021.6 × 102−3.6 × 1026 × 101−3.4 × 1021.1 × 104−6.1 × 10⁴
ADDinh9.4 × 10−2–3 × 10−11.7 × 10−3–5.9 × 10−33.3 × 10−3–4.6 × 10−24.7 × 10−2–9.6 × 10−11.2 × 10−3–4.1 × 10−21.2 × 10−2–2.6 × 10−24.4 × 10−3–2.4 × 10−27.7 × 10−1–4.4 × 100
ADDderm2.6 × 101–8.3 × 1014.6 × 10−1–1.6 × 1009.2 × 10−1–1.2 × 1011.3 × 10−1–2.7 × 1025 × 10−1–1.1 × 10−03.3 × 100–7.3 × 1001.2 × 100–6.8 × 1002.1 × 102–1.2 × 10³
ChildrenADDing9.8 × 103–3 × 1035.4 × 101–1.9 × 1021.1 × 102–1.5 × 1031.5 × 103–3.1 × 1043.9 × 101–1.3 × 1033.8 × 102–8.5 × 1021.4 × 102–7.9 × 1022.5 × 104–1.4 × 10⁵
ADD inh1.6 × 10−1–5.3 × 10−13 × 10−3–1 × 10−22.6 × 10−3–8.2 × 10−21.1 × 10−1–1.7 × 1002.1 × 10−3–7.3 × 10−22 × 10−2–4.6 × 10−27.7 × 10−3–4.3 × 10−21.4 × 100–7.8 × 100
ADDderm1.7 × 10−1–5.5 × 1013 × 10−1–1 × 1002.7 × 10−1–8.4 × 1008.7 × 100−1.7 × 1022.2 × 10−1–7.4 × 1002.1 × 100–4.8 × 1007.9 × 10−1–4.5 × 1001.4 × 102–8 × 10²
Table 12. Ranges (minimum–maximum) (T—total concentration of element) of Average Daily Dose (ADD) via oral, inhalation, and dermal routes for Wroclaw agglomeration (ng/kg·d).
Mn-TNi-TCu-TZn-TAs-TBa-TCr-TMg-T
AdultsADD ing2.4 × 102–6 × 1024.2 × 101–1.4 × 1025.3 × 101–6.8 × 1021.2 × 102–3.2 × 1022.9 × 100–6.9 × 1007.5 × 101–1.7 × 1025.5 × 101–2.9 × 1026 × 103–1.6 × 10⁴
ADDinh1.7 × 10−2–4.3 × 10−23 × 10−3–1 × 10−23.8 × 10−3–4.9 × 10−28.5 × 10−3–2.3 × 10−22.1 × 10−4–4.9 × 10−41.2 × 10−2–4.7 × 10−14 × 10−3–2.1 × 10−24.3 × 10−1–1.2 × 100
ADDderm4.8 × 100–1.2 × 1018.4 × 10−1–2.7 × 1001.1 × 100–1.3 × 1012.4 × 100–6.5 × 1005.9 × 10−2–1.4 × 10−11.5 × 100–3.3 × 1001.1 × 100–5.8 × 1001.4 × 102–3.3 × 10²
ChildrenADDing5.6 × 102–1.4 × 1039.8 × 101–3.3 × 1021.2 × 102–1.6 × 1032.8 × 102–7.6 × 1026.9 × 100–1.6 × 1011.7 × 102–3.9 × 1021.3 × 102–6.8 × 1021.4 × 104–3.8 × 10⁴
ADD inh3.1 × 10−2–7.6 × 10−25.3 × 10−3–1.8 × 10−26.7 × 10−3–8.7 × 10−21.5 × 10−2–4.1 × 10−23.8 × 10−4–8.8 × 10−49.6 × 10−3–2.1 × 10−27.1 × 10−3–3.7 × 10−27.7 × 10−1–2.1 × 100
ADDderm3.1 × 100–7.8 × 1005.5 × 10−1–1.9 × 1006.9 × 10−1–8.9 × 1001.5 × 100–4.2 × 1003.9 × 10−2–9 × 10−29.8 × 10−1–2.2 × 1007.2 × 10−1–3.8 × 1007.9 × 101–2.1 × 10²
Table 13. Ranges of Hazard Quotient and Hazard Index for adults and children for Katowice agglomeration (T—total concentration of element).
Mn-TNi-TCu-TZn-TAs-TBa-TCr-TMg-T
AdultsHQ ing9.3 × 10−3–3 × 10−21.2 × 10−3–4.1 × 10−31.4 × 10−4–1.6 × 10−22.2 × 10−3–4.5 × 10−21.2 × 10−4–4 × 10−38.2 × 10−4–1 × 10−32.7 × 10−2–1.1 × 10−47.6 × 10−2–4.4 × 10⁻¹
HQ inh7.5 × 10−7–1.2 × 10−68.4 × 10−8–1.2 × 10−78.3 × 10−8–1.2 × 10−61.6 × 10−7–3.2 × 10⁻⁶-8.4 × 10⁻⁸–1.3 × 10−41.5 × 10−4–8.6 × 10−45.5 × 10−6–3.2 × 10⁻⁵
HQderm7.3 × 10−3–1.3 × 10−21.2 × 10−3–3.1 × 10−37.7 × 10−5–1.1 × 10−32.2 × 10−4–4.4 × 10−38.4 × 10−5–2.8 × 10−36.8 × 10−4–1.5 × 10−32 × 10−2–1.1 × 10⁻¹-
HI1.6 × 10−2–5.1 × 10−22 × 10−3–7.2 × 10−35 × 10−4–1.7 × 10−22.4 × 10−3–4.9 × 10−22 × 10−4–6.9 × 10−31.2 × 10−3–3.3 × 10−34 × 10−2–2.3 × 10−17.6 × 10−2–4.4 × 10⁻¹
ChildrenHQ ing7.5 × 10−8–1.1 × 10−72.7 × 10−3–9.6 × 10−32.7 × 10−3–3.8 × 10−26.9 × 10−3–1 × 10−11.3 × 10−1–4.4 × 1005.8 × 10−9–1.3 × 10−84.7 × 10−2–2.6 × 10−15.4 × 10−7–3.1 × 10⁻⁶
HQ inh1.2 × 10−6–3.8 × 10−68.9 × 10−6–1.2 × 10−56.5 × 10−8–1.3 × 10−68.9 × 10−7–5.7 × 10⁻⁶-1.5 × 10⁻⁷–2.4 × 10−42.7 × 10−4–1.5 × 10−39.7 × 10−6–1.4 × 10⁻⁵
HQderm4.8 × 10−3–1.3 × 10−25.6 × 10−4–1.1 × 10−36.7 × 10−6–2.1 × 10−41.9 × 10−4–2.9 × 10−37.4 × 10−4–1.2 × 10−24.4 × 10−4–9.7 × 10−41.3 × 10−2–7.4 × 10⁻²-
HI4.2 × 10−3–1.4 × 10−23.3 × 10−3–1.1 × 10−22.7 × 10−3–3.7 × 10−25.3 × 10−3–1 × 10−11.3 × 10−1–4.5 × 1004.3 × 10−4–9.7 × 10−46.1 × 10−2–3.4 × 10−11 × 10−5–5.9 × 10⁻⁵
Table 14. Ranges of Hazard Quotient and Hazard Index for adults and children for Wrocław agglomeration (T—total concentration of element).
Mn-TNi-TCu-TZn-TAs-TBa-TCr-TMg-T
AdultsHQ ing1.7 × 10−3–4.3 × 10−32 × 10−3–7.2 × 10−31.3 × 10−3–1.7 × 10−23.9 × 10−4–1.1 × 10−32.1 × 10−5–4.9 × 10−53.7 × 10−4–8.3 × 10−41.8 × 10−2–9.7 × 10−24.3 × 10−2–1.2 × 10⁻¹
HQ inh1.2 × 10−7–3 × 10−71.5 × 10−7–5.2 × 10−71.1 × 10−7–1.2 × 10−62.8 × 10−8–7.7 × 10⁻⁸-4.7 × 10⁻⁸–3.3 × 10−61.4 × 10−4–7.3 × 10−43.1 × 10−6–8.4 × 10⁻⁶
HQderm1.2 × 10−3–3 × 10−31.5 × 10−3–5.3 × 10−36.2 × 10−5–1.2 × 10−33.9 × 10−5–1.1 × 10−41.6 × 10−5–3.4 × 10−53 × 10−4–6.7 × 10−41.8 × 10−2–9.6 × 10⁻²-
HI2.9 × 10−3–7.2 × 10−33.6 × 10−3–1.2 × 10−21.4 × 10−3–1.8 × 10−24.3 × 10−4–1.2 × 10−33.6 × 10−5–8.3 × 10−56.8 × 10−4–1.5 × 10−33.7 × 10−2–1.9 × 10−14.3 × 10−2–1.2 × 10⁻¹
ChildrenHQ ing1.2 × 10−8–3 × 10−84.9 × 10−3–1.7 × 10−23 × 10−3–3.9 × 10−29.2 × 10−4–2.5 × 10−32.3 × 10−2–5.3 × 10−22.7 × 10−9–5.9 × 10−94.3 × 10−2–2.7 × 10−13 × 10−7–8.3 × 10⁻⁷
HQ inh2.2 × 10−7–5.4 × 10−71.6 × 10−5–5.5 × 10−56.8 × 10−8–2.1 × 10−65 × 10−8–1.4 × 10⁻⁷-6.8 × 10⁻⁸–1.5 × 10−72.5 × 10−4–1.3 × 10−35.5 × 10−6–1.5 × 10⁻⁵
HQderm9.9 × 10−4–1.9 × 10−31 × 10−3–3.5 × 10−31.9 × 10−5–2.3 × 10−42.6 × 10−5–7 × 10−51.2 × 10−2–5.3 × 10−22 × 10−4–4.4 × 10−41.2 × 10−2–6.3 × 10⁻²-
HI9.9 × 10−4–1.9 × 10−35.9 × 10−3–2 × 10−23.1 × 10−3–3.9 × 10−29.5 × 10−4–2.6 × 10−32.3 × 10−2–5.4 × 10−22 × 10−4–4.4 × 10−45.5 × 10−2–2.9 × 10−15.8 × 10−6–1.6 × 10⁻⁵
Table 15. Excess cancer risk for Katowice (WS—water-soluble fraction of studied element).
ElementGroupRanges
As-WSAdults2,2 × 10−8−2.4 × 10⁻⁷
Children5 × 10−9−5.5 × 10⁻⁸
Cr (VI)-WSAdults6 × 10−8–6.7 × 10⁻⁷
Children1.3 × 10−8–1,5 × 10⁻⁷
Ni–WSAdults2.2 × 10−9–4.8 × 10⁻⁹
Children5.2 × 10−10–1.1 × 10⁻⁹
Table 16. Excess cancer risk for Wrocław (WS—water-soluble fraction of studied element).
ElementGroupRanges
As-WSAdults7 × 10−9–3.3 × 10⁻⁸
Children1.6 × 10−9–7.6 × 10⁻⁹
Cr (VI)-WSAdults3.9 × 10−8–3 × 10⁻⁷
Children8.9 × 10−9–7 × 10⁻⁸
Ni-WSAdults1.8 × 10−9–5.1 × 10⁻⁹
Children4.1 × 10−10–1.2 × 10⁻⁹

