Article

Overview of Injuries Associated with Extreme Weather Events in New Hampshire, U.S., 2001–2009

1
Department of Atmospheric Science and Chemistry, Plymouth State University, Plymouth, NH 03264, USA
2
Shade Tree Meteorology, LLC, Troy, NY 12180, USA
3
New Hampshire Department of Health and Human Services, Division of Public Health Services, Concord, NH 03301, USA
4
Mount Washington Observatory, North Conway, NH 03860, USA
5
Department of Mathematics, Plymouth State University, Plymouth, NH 03264, USA
*
Author to whom correspondence should be addressed.
Atmosphere 2020, 11(3), 281; https://doi.org/10.3390/atmos11030281
Submission received: 4 February 2020 / Revised: 5 March 2020 / Accepted: 9 March 2020 / Published: 12 March 2020
(This article belongs to the Special Issue Public Health Impacts of Climate Change)

Abstract

:
Global climate change is an environmental hazard with significant public health impacts. High-impact weather events including periods of extreme temperature or extreme precipitation are frequently associated with adverse effects on human health. This study evaluates the impact of extreme weather events on injuries across New Hampshire. A set of five daily extreme weather metrics (EWMs) was analyzed: daily maximum temperature ≤32 °F (0 °C), daily maximum temperature ≥90 °F (32 °C), daily maximum temperature ≥95 °F (35 °C), daily precipitation ≥1″, and daily precipitation ≥2″. Exposure to these EWMs was defined by linking the population within 10 miles of nine weather stations distributed across the state. Injuries were defined as hospitalizations categorized as: all-cause injury, vehicle accidents, accidental falls, accidents due to natural and environmental causes (including excessive heat, excessive cold, exposure due to weather conditions, lightning, and storms and floods), accidental drowning, and carbon monoxide poisoning. The associations between all injury categories and all EWMs as well as daily maximum temperature and daily precipitation were explored. A quasi-Poisson regression model was used to evaluate the relationship between the four strongest exposure–outcome pairs linking maximum temperature to all-cause injury-, vehicle accident-, accidental fall-, and heat-related hospital visits. Results indicate that daily maximum temperature (>90 °F) was most strongly associated with heat-related hospital visits and was also associated with all-cause injury-related hospital visits. Future work should include further analysis of cold weather metrics and incorporate these findings into public health planning and response efforts.
Keywords:
cold; flood; heat; injury; weather

Graphical Abstract

1. Introduction

According to the National Climate Report, temperature averages and temperature extremes are on the rise across the United States (US), with a high proportion of the warmest years on record occurring after 2000 [1]. More recently, more global high temperature records were broken compared to low temperature records [2], and globally, heat waves are becoming more frequent and intense, while the frequency and intensity of cold waves is decreasing [3]. The Northeast US climate is getting warmer, wetter, and experiencing more extreme weather events [4]. The projected shift in extreme weather patterns is expected to lead to more premature deaths, hospital admissions, and emergency department visits.
In addition to changing temperature patterns, average U.S. precipitation is increasing, and the Northeast reports the highest rate of increase in precipitation compared to all other regions of the country [4]. Extreme precipitation events over most of the mid-latitude land masses are highly likely to become more intense and more frequent because of the increase in global mean surface temperature [5]. These changes to the global climate threaten human health and well-being in several ways, including examples such as heat stress from higher temperatures, traumatic injury from more intense storms, dislocation due to wildfires and hurricanes, and mental stress from disaster events. As the climate continues to change, it is expected that existing health threats will intensify and new health threats may emerge. In recent history, the Northeast US experienced a number of extreme weather events with significant health impacts. For example, in August 2011, parts of Vermont, New Hampshire, and New York were affected by immense flooding from Tropical Storm Irene, resulting in flood advisories and boil orders.
The effect of temperature on hospital admissions is well documented across the US, such as in California [6,7] and Alabama [8]. Internationally, the relationship between extreme temperatures and hospitalizations has been documented in Toronto [9], Europe [10], and Scotland [11]. Following the 2003 summer heat wave in Europe, several studies focused on the impact of extreme heat on mortality [12,13,14]. Since most studies concerning the impacts of extreme temperature focus on deaths, estimates of the overall burden associated with extreme temperatures are limited [3]. There are limited studies investigating the impact of extreme weather on injuries and especially on injury-related hospital visits.
It is particularly interesting to evaluate these relationships in New Hampshire, a small rural state characterized by a humid continental climate with warm, humid summers and cold, snowy winters. In mid-summer, average daily maximum temperatures range from 70 °F to 85 °F (21–30 °C). In mid-winter, average daily minimum temperatures range from 0 °F to 15 °F (−17 to −9.5 °C). Precipitation is evenly distributed throughout the year. The average rainfall is around 40″ (1016 mm) in lower elevations and increases to nearly 100″ (2540 mm) at higher elevations in the White Mountains. Average snowfall during the winter ranges from 60″ to 100″ (1524 to 2540 mm) in lower elevations and increases to over 200″ (5080 mm) at higher elevations [1].
Since 1895, the average temperature and number of extreme precipitation events across the U.S. have increased; however, the temperature rise has not been consistent across the country or over time [4]. Similarly, spatial variability in extreme weather is observed across New Hampshire. For example, Berlin and North Conway report statistically significant decreases in extreme weather related to heat; both of these locations also report a statistically significant decrease in their highest annual maximum temperatures. Concord reports a statistically significant increase in the lowest annual minimum temperature. Keene and North Conway report statistically significant increases in extreme precipitation events, with increasing trends or no change observed across the rest of the state. Furthermore, Concord, Keene, and Lakeport report statistically significant increases in total annual precipitation, consistent with increasing trends of heavy downpours documented in New Hampshire and across the United States [4].
Since most studies concerning the impacts of extreme temperature focus on deaths, estimates of the burden of non-fatal health outcomes such as injuries are not often reported [3]. The most recent and comprehensive analysis to evaluate the association between extreme temperature and injury-related deaths concluded that a 2.7 °F (1.5 °C) increase in temperature would be associated with an estimated 1600 excess injury deaths across the US [15]. Integrating knowledge of the changing climate with an understanding of how those changes impact both morbidity and mortality can better inform decisions concerning climate change mitigation and adaptation, strategies for building community resilience, and priorities for future research.
This particular study focuses on injury-related hospital visits associated with extreme weather events. Extreme weather events are defined as high-impact events that vary significantly from typical conditions in either severity or duration, such as heat waves or cold waves, or rare events that do not happen very frequently, such as droughts or floods [16]. This study is the first of its kind to explore the association between extreme weather events and injury-related hospital visits in New Hampshire. The objectives of this project were to identify extreme weather metrics that are associated with injury-related hospital visits, summarize methods most appropriate for evaluating the associations, and quantify the associations across New Hampshire.

2. Methods

This study evaluates trends in extreme weather events across New Hampshire and links these extreme events to adverse health outcomes. Using data from National Oceanic and Atmospheric Administration’s (NOAA’s) National Center for Environmental Information (NCEI), 35 years of data (1981–2015) were downloaded from nine weather stations across the state (Figure 1). The study areas were defined as the 10-mile area surrounding the nine weather stations in the communities of Berlin, Colebrook, Concord, Durham, Hanover, Keene, Lakeport, Nashua, and North Conway. Daily maximum temperature, daily minimum temperature, and daily precipitation were extracted from the Global Historical Climatology Network- Daily (GHCN-Daily) dataset [17,18]). These continuous variables were used to create five categorical extreme weather metrics (EWMs): daily maximum temperature ≥90 °F (heat metric 1; HM1), daily maximum temperature ≥95 °F (heat metric 2; HM2), daily maximum temperature ≤32 °F (cold metric 1; CM1), daily precipitation ≥1″ (precipitation metric 1; PM1), and daily precipitation ≥2″ (precipitation metric 2; PM2). These metrics represent the number of days over or under the threshold of interest. The thresholds were chosen as common cutpoints for studying temperature and precipitation extremes. Once these variables were identified, time series of the exposures were evaluated for temporal trends. The Mann–Kendall test for statistical significance was used to determine whether a trend existed, if it was a positive or negative trend, and if it was statistically significant. These metrics are referred to as the exposure variables.
To measure the health outcomes, hospital data from the New Hampshire Limited Use Hospital Discharge Dataset courtesy of New Hampshire Department of Health and Human Services were used for the years 2001–2009. The dataset includes patient-level information on age, sex, race, ethnicity, residence, year and month of admission, year and date of discharge, and diagnosis codes. Cases were defined based on the International Classification of Disease 9th Revision (ICD-9). It is important to note that the way diagnosis codes are recorded can vary from one hospital to the next. Table 1 lists the ICD-9 codes for injuries used in this analysis; Table 2 identifies the subcategories of injuries due to natural and environmental causes. Primary, secondary, and any additional diagnosis codes (including emergency codes or Ecodes) were used to create these categories. These metrics are referred to as the outcome variables.
To define the study area, a 10-mile buffer was created around each of the nine weather stations. All towns wholly or partially within this buffer were included in the analysis (Table S1) based on the assumption that the weather occurring at the weather station is representative for at least a 10-mile radius around that location. Hospital data from these specific towns were extracted and merged with the corresponding meteorological data. The study population totaled 962,274 people, representing about 72% of the total state population.
Using 2010 population data from the United States Census Bureau, crude injury rates were computed in a manner similar to the crude death rates computed by Thacker (2008) [19]; they were calculated by dividing the number of condition-specific injures by the 2010 US census population and converting the rate to per hundred thousand people. These numbers were then divided by nine (the number of years included in the study) to determine annual injury rates similar to those reported in the most recent New Hampshire Injury Report [20].
Spearman correlations were calculated between all health outcomes (all-cause injury, motor vehicle accidents, accidental falls, accidents due to natural or environmental causes, accidental drowning, and CO poisoning) and each of the five exposure metrics (HM1, HM2, CM2, PM1, and PM2), daily maximum temperature, and daily precipitation (Table 3). The significance of each correlation coefficient was based on the associated p-value (p < 0.05). Pairs with the strongest, statistically significant correlation were chosen for regression analysis. Additionally, two subsets of natural or environmental cause-related hospital visits (cold-related and heat-related) were analyzed by season: for the cool (November–March) and warm (May–September) seasons.
To better understand the nature of the association between hospital visits and various meteorological parameters, exposure–response relationships were examined utilizing regression analysis. Generalized linear models (GLMs) are widely used to evaluate the relationship between environmental exposures and health outcomes [21,22,23,24]. Generalized additive models (GAMs) are also often used as a flexible and effective technique for conducting nonlinear regression analyses in time-series studies, particularly when evaluating the relationship between environmental exposures and health outcomes [25,26,27,28]. GAMs have been considered vastly preferable for time-series studies of environmental exposures because they allow for nonparametric adjustments of nonlinear confounding effects such as seasonality, long-term time trends, and weather [26,28,29,30,31,32].
To assess the robustness of our findings, this study evaluated both types of regression models, GLM and GAM, assuming Poisson and Gaussian distributions. The model-building process involved evaluating multiple models within the same distribution family in a stepwise fashion by adding variables and evaluating the goodness-of-fit of each model based on the Akaike information criterion (AIC; [33,34,35]) and the adjusted R-squared value.
The best-fit model was a GAM with a quasi-Poisson distribution that accounted for over-dispersion [36,37,38,39,40]. This approach allows the expected value and variance of the outcome variable to have a linear relationship, while the nonlinear relationships between the outcome and predictor variables are modeled via piecewise functions (or splines) [22]. Based on results from the correlation analysis, continuous maximum temperature was identified as the primary exposure of interest. An indicator variable was added to control for day of week (DOW) differences between weekday and weekend hospital visits [41,42,43]. A spline on time was also included to control for long-term time trends. In some cases, an additional variable was included to control for seasonality [26,27,44]. The model for each exposure–outcome pair resembled the following format:
log(Yt) = β0 + β1Tmax + s(time) + β2DOW + β3Exp + εt
where t refers to the day of the observation; (Yt) denotes the daily outcome count on day t; β0 is the intercept (daily outcome count when the predictor is zero); Tmax is the maximum temperature on day t; s(time) controls for temporal trends with a smoothing effect on time; DOW indicates the day of the week; Exp denotes the second exposure variable chosen for that particular model; β1, β2, and β3 are the coefficients associated with each predictor; and εt is the residual error.
To assess the association between each exposure–outcome pair for each study area, relative risks were calculated and reported with a 95% confidence interval (CI). Relative risks (RR) were expressed as the estimated change in risk of hospitalization associated with a 2 °F (1 °C) change in the predictor (Tmax).
After obtaining study area-specific results for each analytical model, results were then combined to calculate an overall RR for the state of New Hampshire using meta-analysis methods with a random-effects model [40,45,46,47,48,49]. The combined results were expressed with 95% CI for each exposure–outcome pair. R statistical software [50] was used for this analysis: the “mgcv” package was used to create the models, and the “rmeta” package was used to conduct the meta-analysis.

3. Results

3.1. Injury Rates–Primary Health Outcomes

Accidental falls were the most common type of hospital visit across the entire time period for all study areas, and accidental drownings were the least common. Within the environmental category, visits related to heat and cold were the most common. Population totals represent the total population of the study area that is explicitly referenced and all towns and cities included within the 10-mile buffer of the weather station (Table S1). Injury rates for all-cause injuries and the five primary categories are shown in Table 4.
The highest rate of all-cause injuries was 16,671 per 100,000 in Colebrook, and the lowest rate was 8566 per 100,000 in Hanover. Among the five primary categories, the highest injury rates were for accidental falls, with the highest in Berlin (5366 per 100,000), and the three highest reported in the three northernmost study areas (North Conway, Berlin, and Colebrook). The second highest injury rates were for vehicle accidents, with the highest in Lakeport (2332 per 100,000). The third highest injury rates were for natural- and environmental-related injuries, with the highest in Colebrook, Lakeport, and Berlin (46.4, 38.1, and 35.0 per 100,000, respectively). The fourth highest injury rates were for CO poisoning, with the highest in Colebrook and Berlin, the two northernmost study areas (18.6 and 16.8 per 100,000, respectively). Overall, the lowest injury rates were those associated with accidental drowning, with the highest injury rates reported in Lakeport in the Lakes Region (6.6 per 100,000), followed by Berlin in the North Country (5.1 per 100,000).

3.2. Injury Rates–Secondary (Environmental) Health Outcomes

Within the natural and environmental category, the highest injury rates were associated with extreme temperatures, both hot and cold (Table 5). The highest cold-related injury rates were found in the northernmost study areas, Colebrook and Berlin (33.4 and 19.7 per 100,000, respectively), and the lowest were found in Hanover, Nashua, and Durham (9.6, 10.6, and 10.9 per 100,000, respectively). The highest heat-related injury rates were found in Keene, Durham, Berlin, and Lakeport (14.6, 14.3, 13.9, and 13.8 per 100,000), while the lowest were found in Hanover, Colebrook, Concord, and North Conway (7.8, 9.3, 9.4, and 9.7 per 100,000, respectively). Lakeport reported the highest injury rate for lightning-related visits (2.4 per 100,000). Lakeport, Nashua, and North Conway reported the highest injury rate for injuries due to unspecified weather (2.9, 2.1, and 2.1 per 100,000, respectively). Multiple study areas had no reports of storm- and flood- related visits (Berlin, Hanover, Lakeport, and North Conway). Colebrook reported the highest storm-related injury rate of 1.9 per 100,000, while Durham and Nashua reported the lowest storm-related injury rate of 0.1 per 100,000.

3.3. Statistical Relationship between Climate and Health

Correlation analysis showed that the strongest relationship was between all-cause injury-related visits and maximum temperature (Table 6) in six of the nine study areas. Seasonal correlations were then tested for heat-related hospital visits in the warm season (May–September; MJJAS) and cold-related hospital visits in the cool season (November–March; NDJFM). Spearman correlation coefficients were computed for every exposure–outcome pair. Seasonal correlations were computed separately (Table 7). All-cause injury-related visits and heat-related visits were the strongest correlations observed; these were correlated with either maximum temperature, HM1, or, in one instance, HM2. Colebrook was the only study area that reported a strong correlation in the cool season indicating an inverse relationship between cold-related hospital visits and maximum temperatures.
Examining the correlations for all of the study areas indicates a strong relationship between injury-related hospital visits and daily maximum temperature (Tmax). Daily maximum temperature was most strongly correlated with four outcome categories: all-cause injuries, vehicle accidents, accidental falls, and heat-related injuries. All correlations presented were considered statistically significant (p < 0.05). The remainder of this study focuses on the association between daily maximum temperature and these four outcome categories.

3.4. Regression Analyses

The four outcome categories most strongly correlated with daily maximum temperature were all-cause injuries, vehicle accidents, accidental falls, and heat-related injuries. To determine the appropriate model framework, GAMs and GLMs were tested for goodness of fit based on the AIC and adjusted R-squared. Since the model fit consistently improved with the introduction of the spline on time, the GAM framework was selected for all models. Within the GAM framework, Gaussian, Poisson, and quasi-Poisson model families were investigated. However, further analysis identified evidence of over-dispersion, so a quasi-Poisson model was ultimately chosen.
The quasi-Poisson GAM model framework was used for each exposure–outcome pair. The model was run for each individual study area and the association between the exposure and outcome was evaluated based on the relative risk with a 95% confidence interval (CI). Finally, the area-specific relative risks for each exposure–outcome pair were combined to create an overall relative risk for the state of New Hampshire by conducting a meta-analysis using a random-effects model, where the random effect was the study area. These combined results were also expressed with 95% CI for each exposure–outcome pair. All the models incorporate maximum temperature, a spline on time, day of week, and one additional variable chosen individually for each exposure–outcome pairing (Table 8).

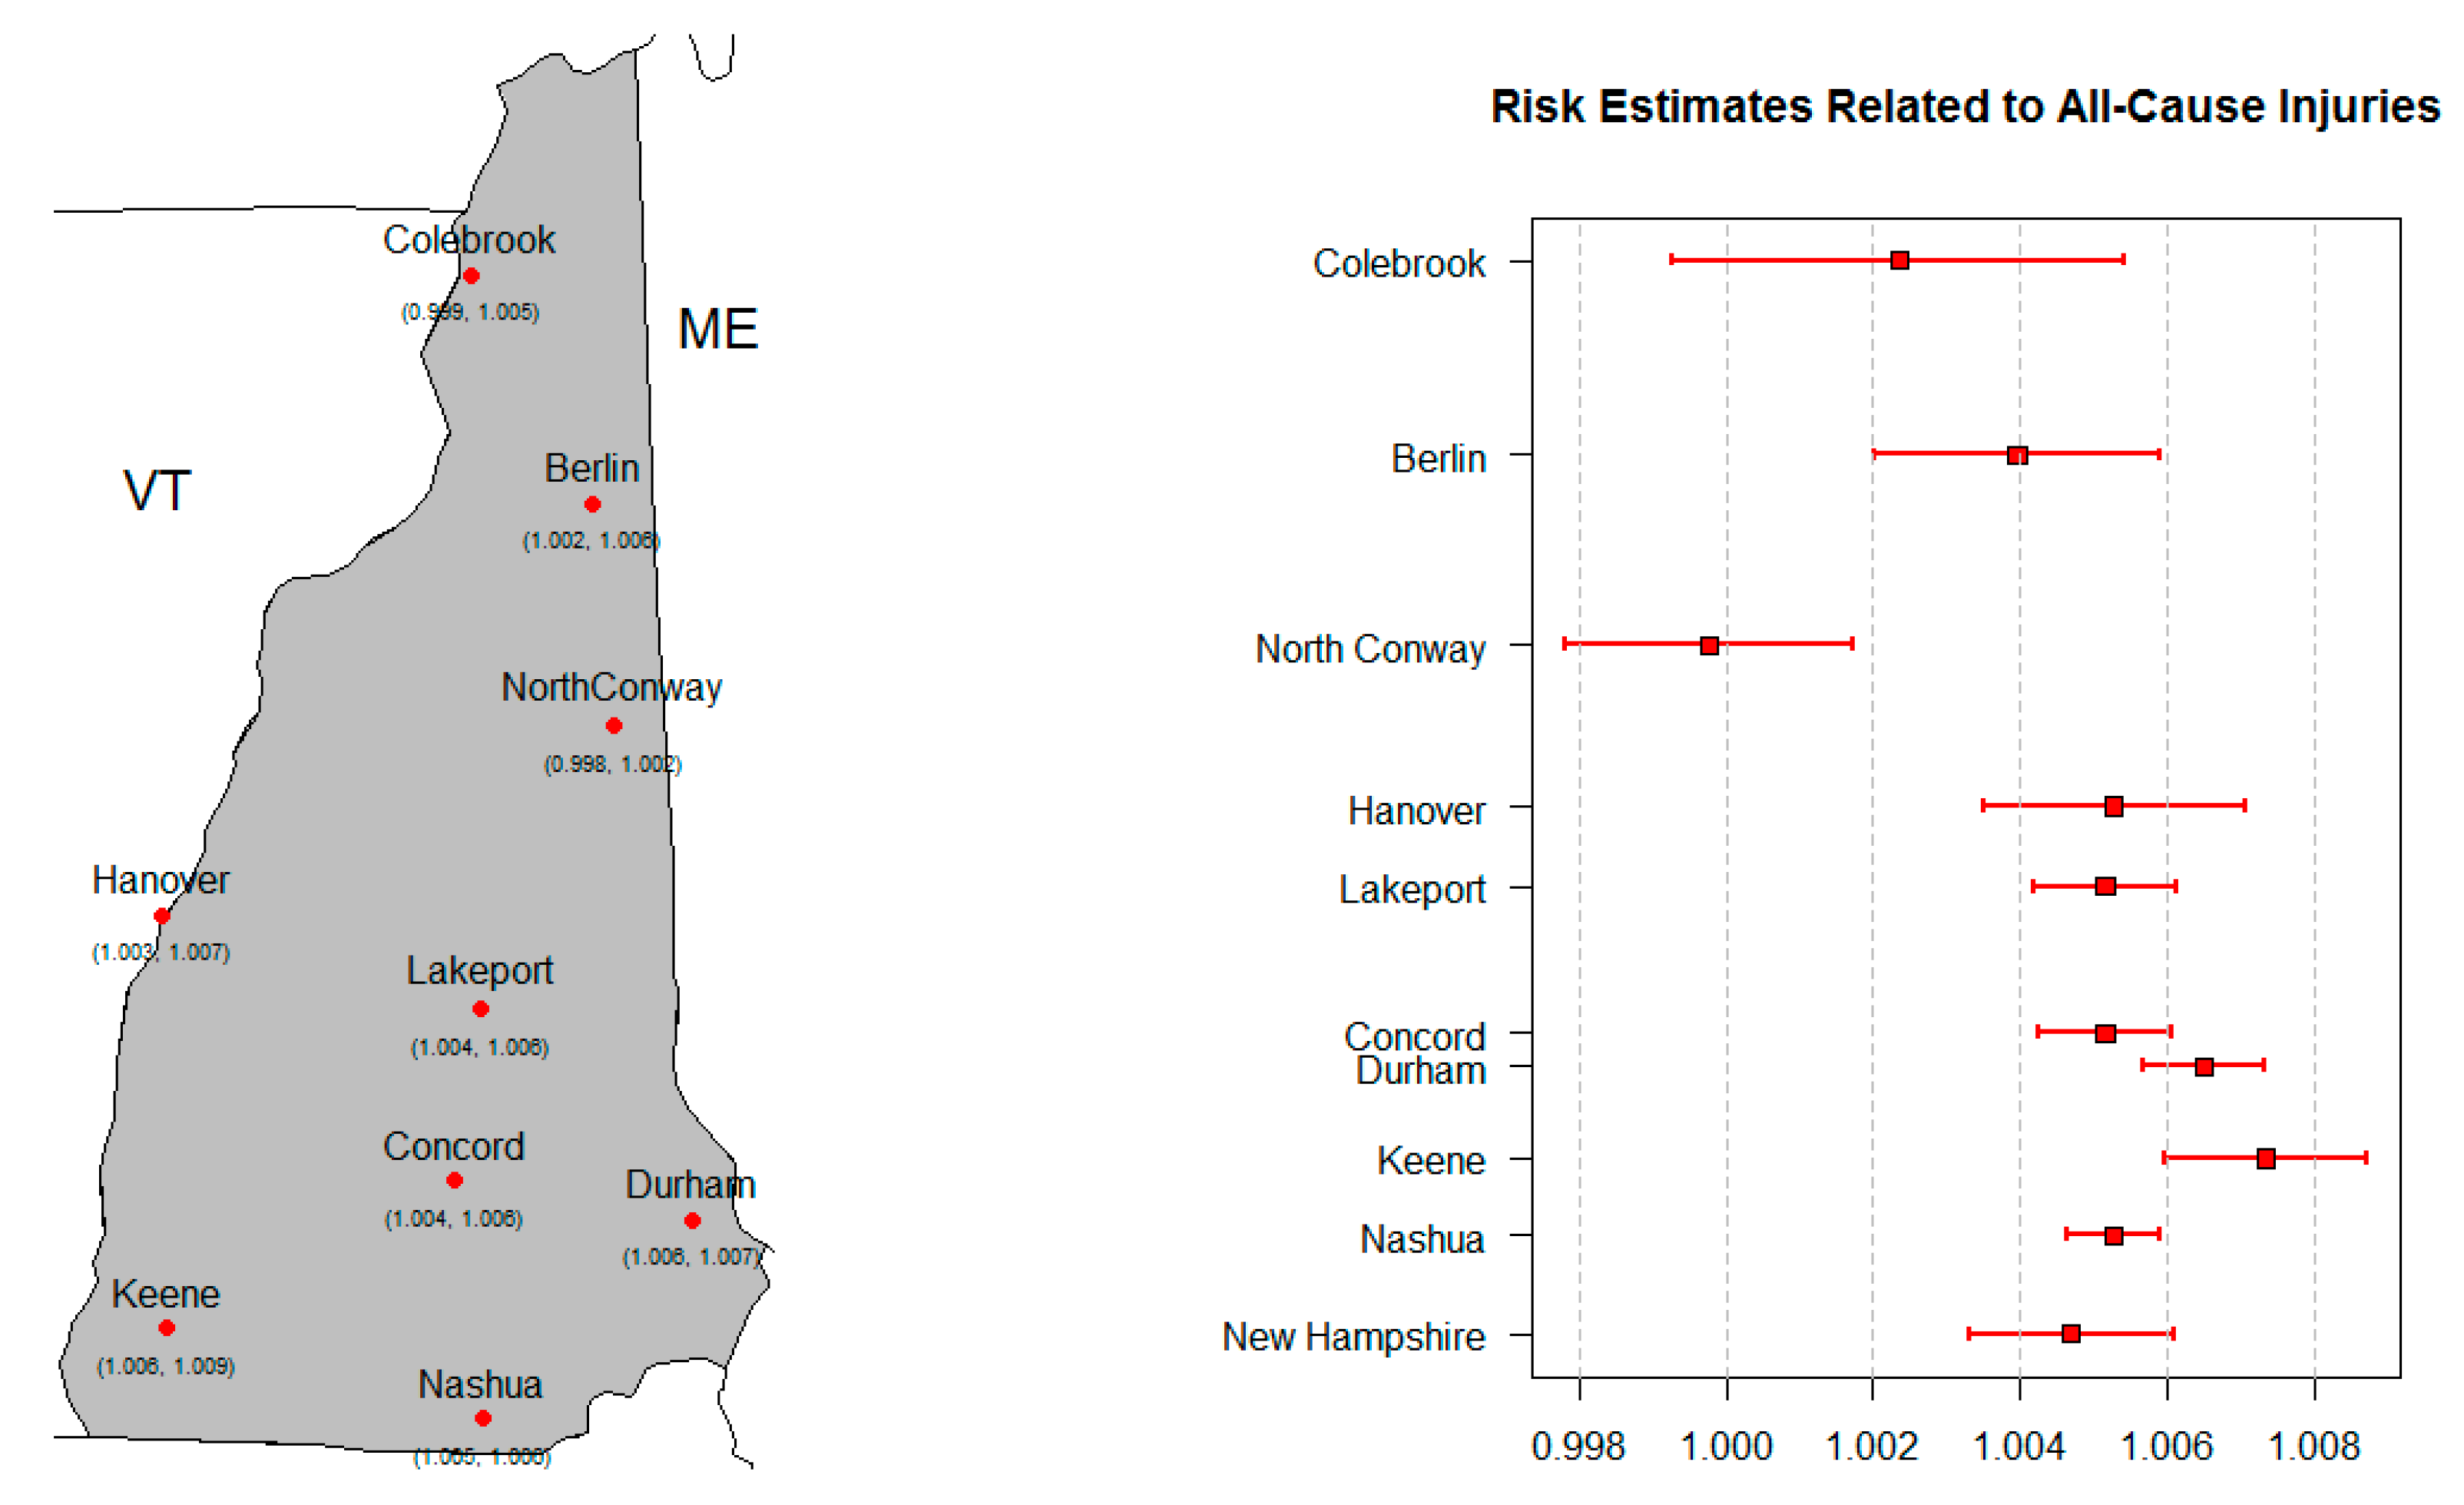
3.4.1. All-Cause Injury ~ Tmax

The data suggest a positive relationship between maximum temperature and all-cause injuries (Figure 2). This indicates that as the temperature increases, so does the risk of all-cause injury. A dummy variable for the warm season (May–September; summer) was the additional variable chosen to explain the relationship between all-cause injury-related hospital visits and maximum temperature. The effect of maximum temperature on all-cause injury-related visits was significant (p < 0.05) in seven of the nine study areas, excluding two of the northernmost study areas: Colebrook and North Conway. The relative risk (RR) of all-cause injury-related visits was highest in Keene (1.007 (CI: (1.006, 1.009)) and lowest in North Conway, (0.999 (CI: 0.998, 1.002)), although not statistically significant. The overall RR for NH, based on the meta-analysis, was 1.005 (CI: 1.003,1.006).

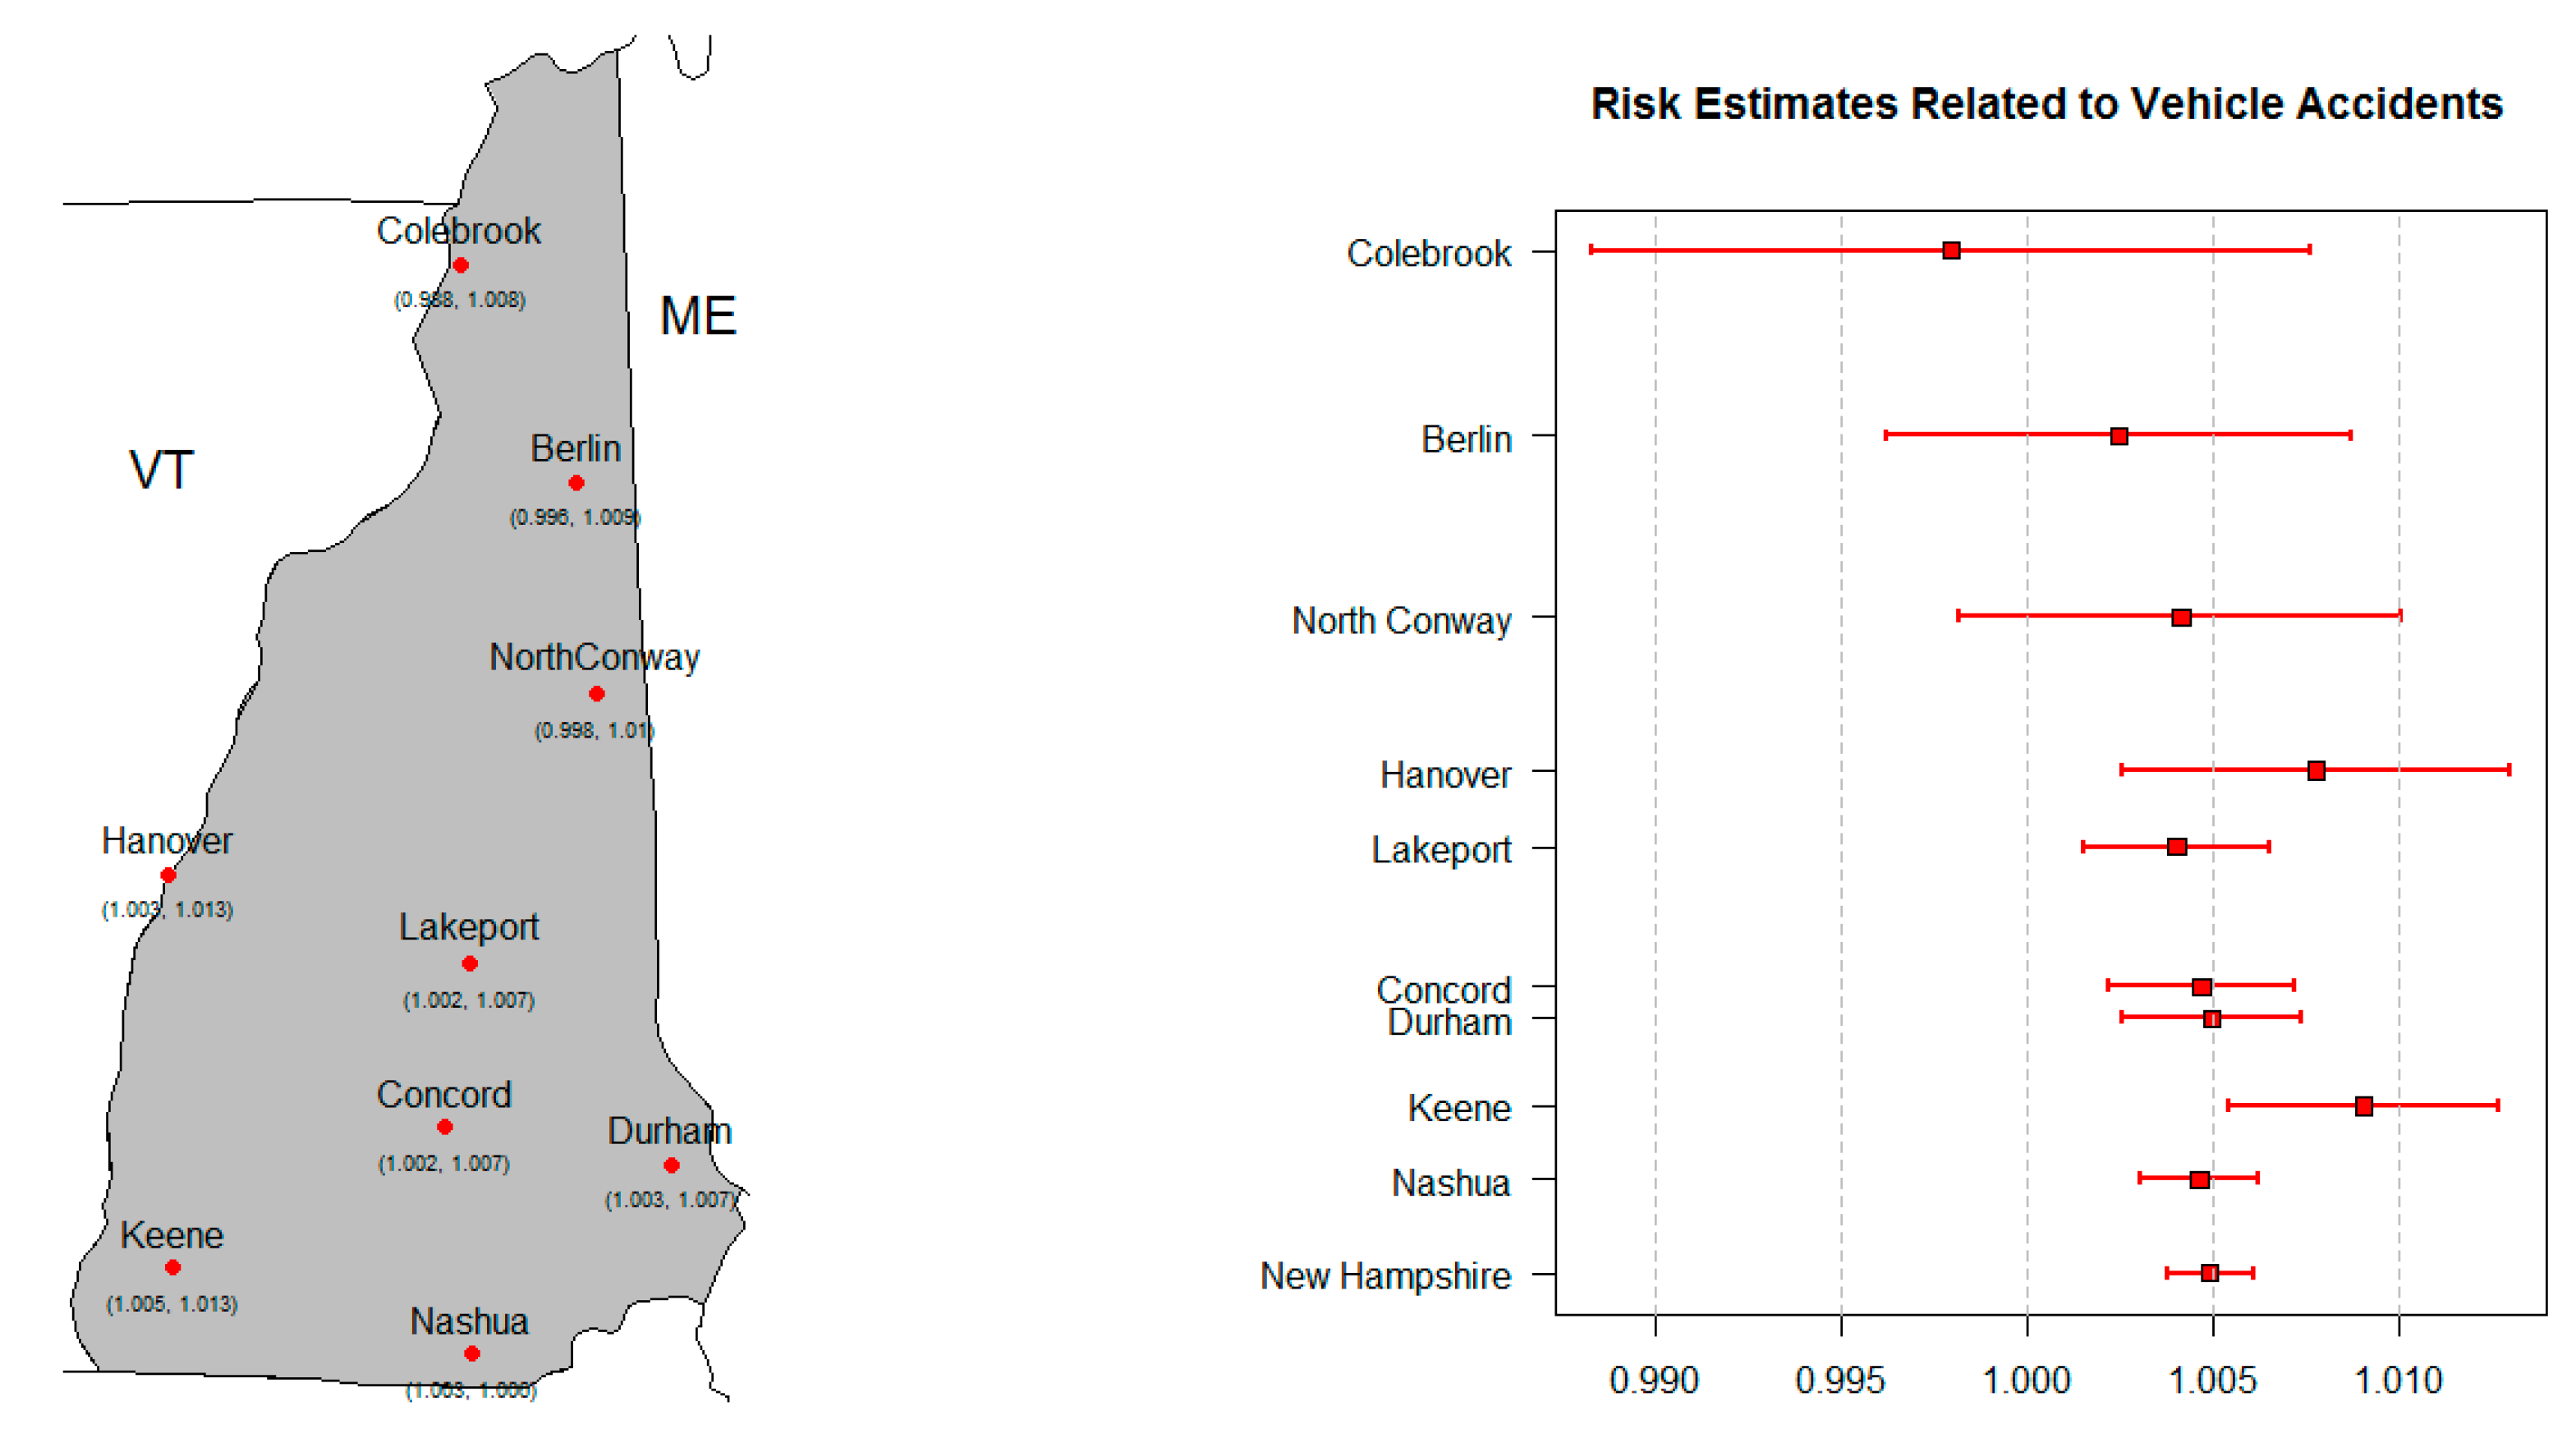
3.4.2. Vehicle Accidents ~ Tmax

The data suggest a positive relationship between maximum temperature and vehicle accident-related hospital visits (Figure 3). A dummy variable for the warm season (May–September; summer) was the additional variable chosen to explain the relationship between vehicle accident-related hospital visits and maximum temperature. The effect of maximum temperature on vehicle accident-related hospital visits was significant (p < 0.05) in the six most southern study areas (Figure 3). The RR of vehicle accident-related visits was highest in Keene (1.009 (CI: 1.005, 1.013)) and lowest in Colebrook (0.998 (CI: 0.988, 1.008)), although not statistically significant. The overall RR for NH, based on the meta-analysis, was 1.005 (CI: 1.004, 1.006).

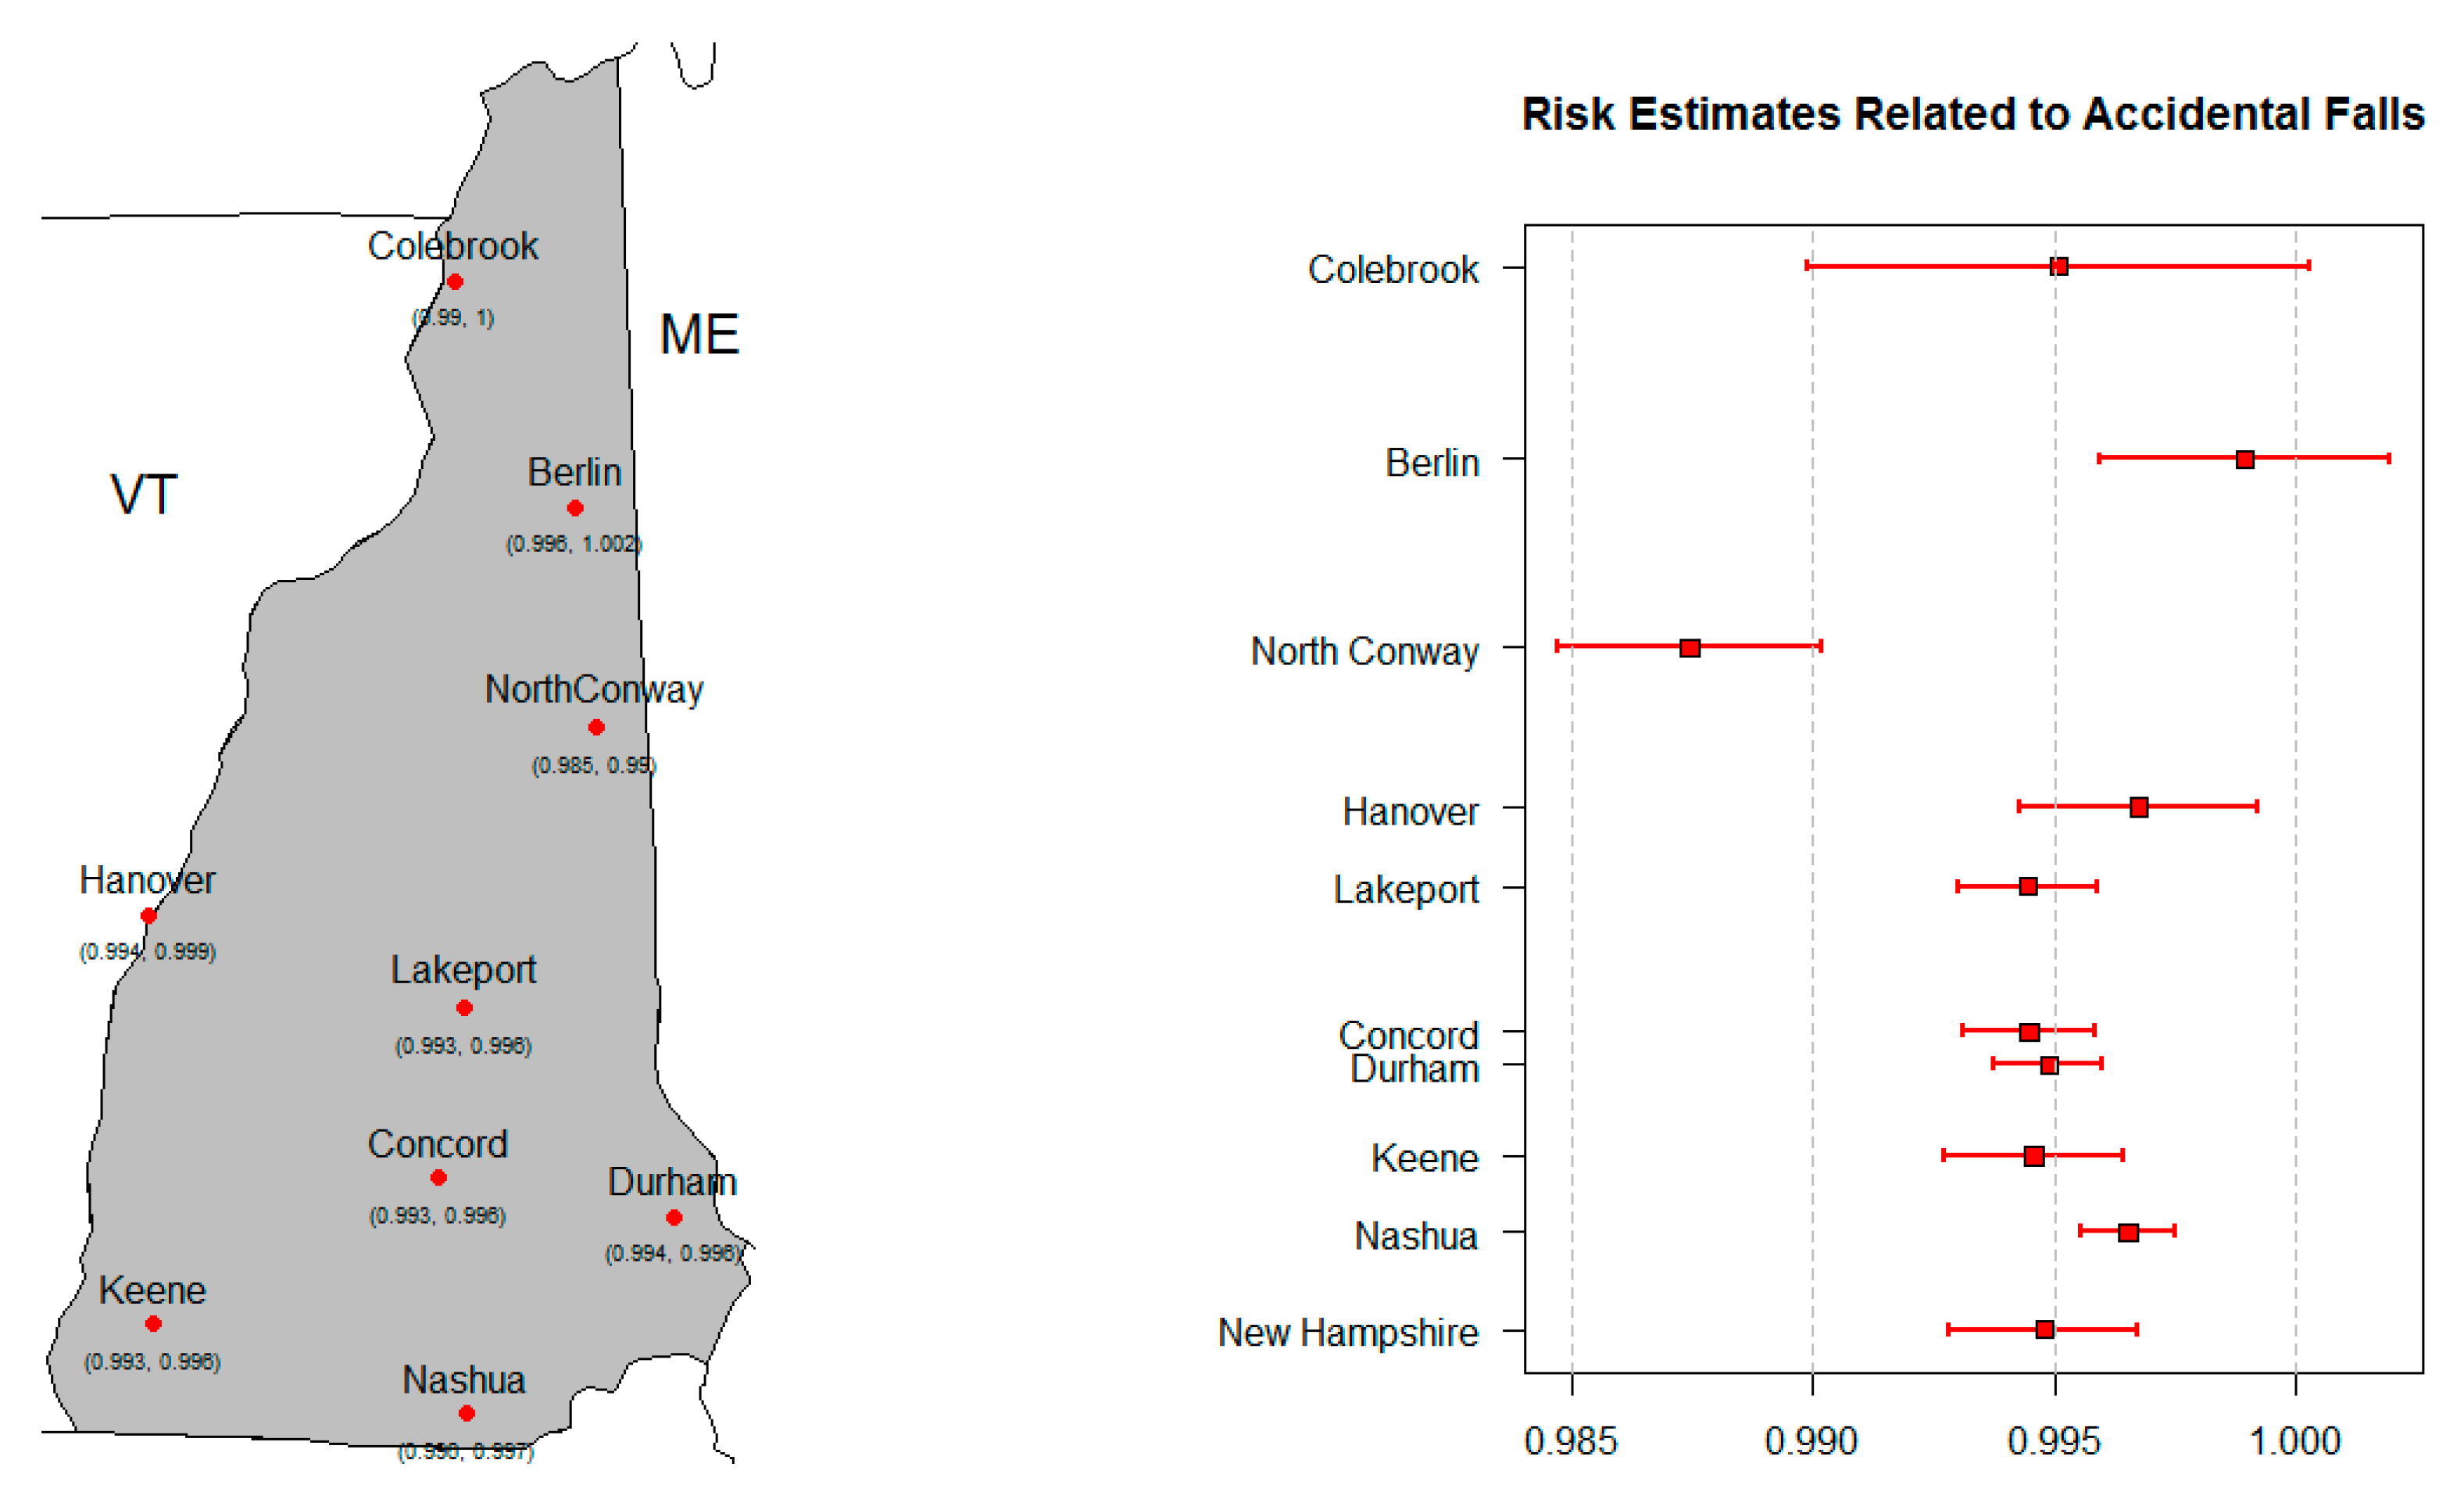
3.4.3. Accidental Falls ~ Tmax

The data show an inverse relationship between maximum temperature and accidental fall-related injuries (Figure 4). This indicates that as the temperature decreases, the risk of falls increases. CM1 (Tmax ≤ 32 °F) was the additional variable chosen to explain the relationship between accidental fall-related hospital visits and maximum temperature. The effect of CM1 on accidental fall-related hospital visits was significant in all study areas except Colebrook, while the effect of maximum temperature was significant (p < 0.05) in all but the two northernmost study areas of Berlin and Colebrook. The RR was strongest in North Conway (0.987 (CI: 0.985, 0.990)) and weakest in Berlin (0.999 (CI: 0.996, 1.002)), although not statistically significant. The overall RR for NH, based on the meta-analysis, was 0.995 (CI: 0.993, 0.997).

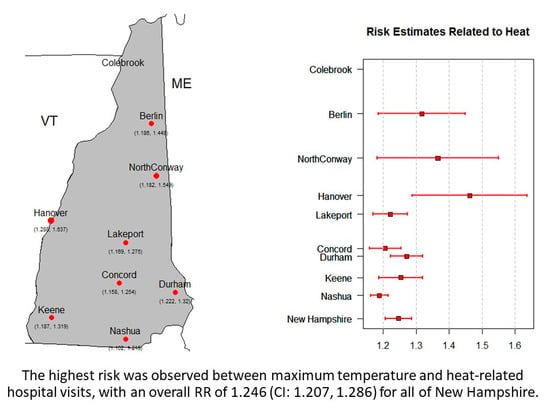
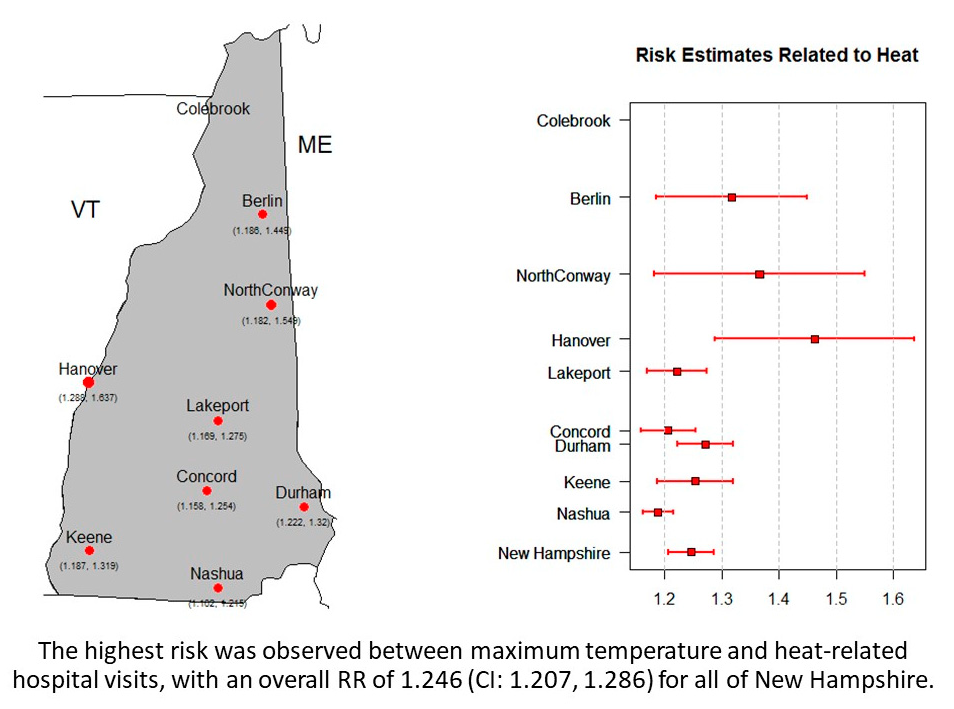
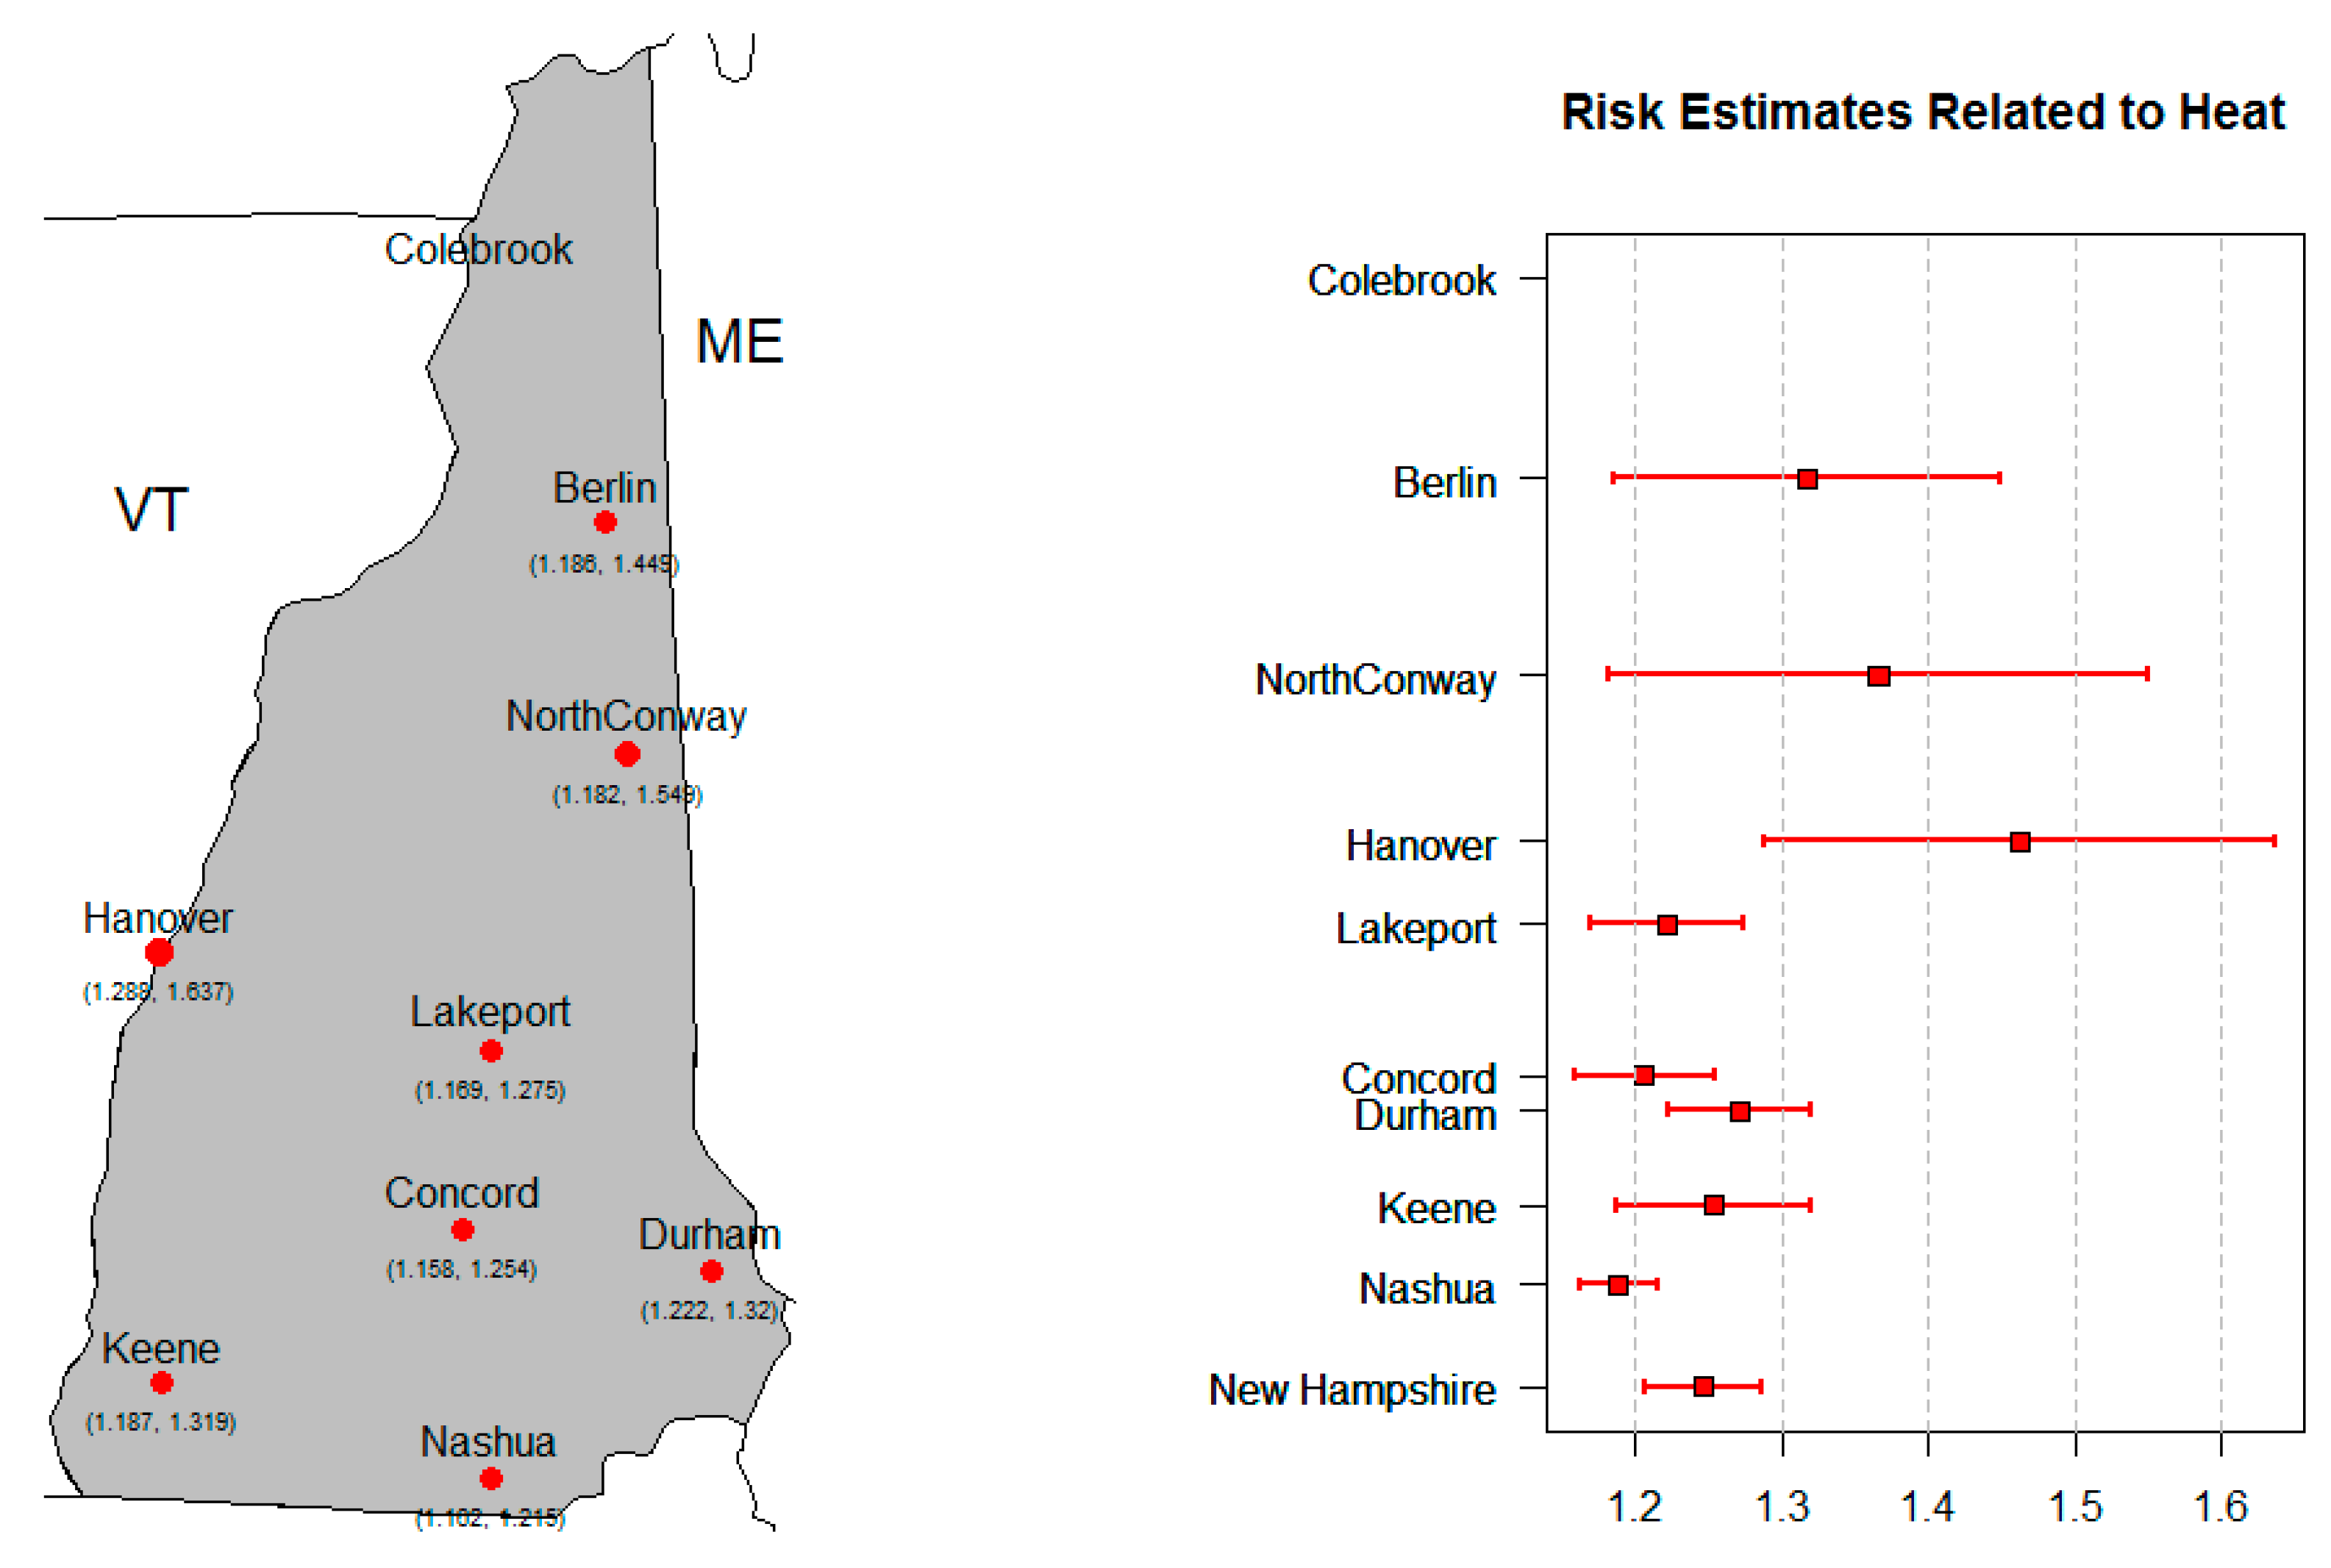
3.4.4. Heat-Related Injury ~ Tmax

The data suggest a positive relationship between maximum temperature and heat-related hospital visits (Figure 5). HM1 (Tmax ≥ 90 °F) was the additional variable chosen to explain the relationship between heat-related hospital visits and maximum temperature. The effect of maximum temperature on heat-related hospital visits was significant (p < 0.05) in all of the study areas, excluding Colebrook (Figure 5). However, HM1 was significant in all study areas except Berlin, Hanover, and Keene. The RR was highest in Hanover (1.462 (CI: 1.288, 1.637)) and lowest in Nashua (1.188 (CI: 1.162, 1.215)). The overall RR for NH, based on the meta-analysis, was 1.246 (CI: 1.207, 1.286).

4. Discussion

4.1. Injury Rates

Overall injury rates were highest for accidental falls, consistent with a 2012 New Hampshire Injury Report produced by NH DHHS [20]. These findings confirm an inverse relationship between maximum temperature and accidental fall-related injuries, highlighting the chance to use extreme weather events as a timely opportunity to conduct outreach and education to support preventive measures. The highest injury rates for accidental falls were reported by the two northernmost study areas in Coos County (i.e., Berlin, and Colebrook) and may be associated with an older population and/or higher likelihood of outdoor occupations. According to the 2013–2017 American Community Survey 5-year estimates, approximately 22 percent of Coos County is 65 years and older, compared to 16 percent of New Hampshire overall. Accidental falls were followed by vehicle accidents, with the highest injury rates reported in Lakeport and may be related to a higher likelihood of extreme weather in a more populated yet rural area.

4.2. Exposure Metrics

Across the state, maximum temperature and hot-weather days ≥90 °F (i.e., HM1) were the exposure metrics most strongly associated with all-cause injury visits and a majority of the other health outcome categories. Cold weather days ≤32 °F degrees (i.e., CM1) were strongly associated with visits related to vehicle accidents, accidental falls, CO poisoning, and natural and environmental injuries. These findings may be able to inform the timing and priority of public notifications, such as National Weather Service advisories, watches, and warnings, for extreme weather events as well as broader stakeholder planning.

4.3. Relative Risks

Of the four exposure–outcome pairs tested, the highest risk was observed between maximum temperature and heat-related visits, with an overall RR of 1.246 (CI: 1.207, 1.286) for all of New Hampshire (Figure 5). This positive association indicates that as the maximum temperature increases, the risk of visiting the hospital for a heat-related visit also increases. The next highest RR was observed between maximum temperature and vehicle accident-related visits (1.005 (CI: 1.004, 1.006)) and all-cause injury-related visits (1.005 (CI: 1.003, 1.006)). These RRs indicate that the risk of all-cause injuries and vehicle accident-related injuries increases as the maximum temperature increases. The next strongest RR was observed between maximum temperature and accidental falls (0.995 (CI: 0.993, 0.997)), indicating an inverse relationship between accidental falls and maximum temperature.
All study areas indicated a positive association between maximum temperature and all-cause injuries, with the exception of two of the northernmost study areas (Colebrook and North Conway), where a null effect was observed. Of the remaining stations, the northernmost (Berlin) study area reported the weakest RR between maximum temperature and all-cause injuries with an RR of 1.004 (CI: 1.002, 1.006). In contrast, the strongest, most positive RRs associated with all-cause injuries were observed in the three southernmost areas of Keene, Durham, and Nashua, with Keene reporting the strongest association with an RR of 1.007 (CI: 1.006, 1.009). These findings indicate the relevance of geographic location in all-cause injury-related hospital visits and support previous findings linking anamalously warm temperatures to increased risk of injury-related deaths [15].
All study areas indicated a positive association between maximum temperature and vehicle accident-related injuries, with the exception of the three northernmost study areas (Colebrook, Berlin, and North Conway), where a null effect was observed. Keene reported the highest RR for vehicle accident-related injuries with an RR of 1.009 (CI: 1.005, 1.013), while Lakeport reported the lowest RR for vehicle accident-related injuries with an RR of 1.004 (CI: 1.002, 1.007). Possible explanations for the positive association between maximum temperature and vehicle accidents include more congested roadways due to people taking vacations during warmer months and more teens out of school, leading to more inexperienced drivers on roadways.
All study areas indicated a negative association between maximum temperature and accidental fall-related injuries, with the exception of the two northernmost study areas (Colebrook and Berlin), where a null effect was observed. This suggests that the risk of accidental falls increases as maximum temperature decreases. Of the remaining six stations, the northernmost (North Conway) study area reported the strongest, most negative RR: 0.987 (CI: 0.985, 0.99). These results may be attributed to more residents being active in the winter due to the abundance of winter recreational activities (e.g., alpine and Nordic skiing, backcountry skiing, ice skating, sledding, hiking) or to more cases of slips and falls due to snowy and icy surfaces. As maximum temperature increases, the risk of accidental falls appears to decrease.
All study areas indicated a positive association between maximum temperature and heat-related injuries, with the exception of Colebrook where a heat-related RR could not be calculated due to too few data to reliably fit a model. The highest RRs associated with heat-related injuries were observed in the three northernmost areas of Hanover, North Conway, and Berlin, with Hanover reporting the strongest association with an RR of 1.462 (CI: 1.288, 1.637). In contrast, Nashua reported the lowest RR of 1.188 (CI: 1.162, 1.215). As Nashua is the southernmost study area and the most populated study area, this could indicate more prevalent air conditioning, which has been known to counteract the adverse effects of heat [51].

4.4. Comparative Studies

Consistent with a 2012 New Hampshire Injury Report produced by DHHS [20], injury rates are highest for accidental falls. It is important to identify accidental falls as a target outcome for preventive measures and share these weather-related findings with partners working on injury prevention in New Hampshire. Continued investigation of heat-related injuries is essential. While most heat-related studies focus on mortality, these findings suggest that maximum temperature is most strongly associated with heat-related hospital visits and thus confirms the risk of heat-related injuries among all individuals [52]. These results suggest that heat-related hospital visits will continue to increase under future climate scenarios and motivates the need for further research on risk factors of heat-related injuries and effective intervention strategies.

4.5. Limitations

There are limitations that need to be considered when interpreting the results of this study. It has been observed that the effects of temperature on morbidity and mortality can persist over several days [22,53,54]. However, as this study serves as an exploratory analysis of morbidity associated with meteorological factors for the state of New Hampshire, only the same-day temperature was used in order to capture short-term effects of temperature. It is recommended that future work investigate the lagged effects of temperature on morbidity, by utilizing the distributed lag non-linear model framework, which has been widely used in investigating the lagged effects of environmental factors on mortality [24,39,55].
Using hospital discharge, diagnosis codes add an inherent limitation to the study. Differences in the way diagnosis codes are recorded can vary from one hospital to the next and could account for variation in counts of specific injuries across study areas [56]. For example, a hospital visit due to dehydration in a heat wave might only be coded as dehydration, with no mention of heat, and may be caused by non-environmental causes such as infection or food poisoning. Additionally, several factors were not controlled for in the analysis related to various social, behavioral, or institutional biases that could lead to a higher vulnerability, such as adequate access to healthcare. Additional data on the study population demographics could be useful to better define vulnerability.
It is also important to note that when creating the 10-mile buffers around each weather station to create the study areas, some of the buffers extend into other states, such as Vermont, Maine, or Massachusetts. As a result, the number of hospital visits occurring within 10 miles of a weather station does not capture the overall impact because this study focuses solely on New Hampshire residents who visited a New Hampshire facility and excludes residents from neighboring states who might use New Hampshire hospital services as well as New Hampshire residents who visited an out-of-state facility.

5. Conclusions

The main objectives of this study were to (1) create standard extreme weather metrics that can be linked to hospitalization data, (2) determine analysis methods most appropriate for identifying the associations between extreme weather metrics and injury-related hospitalizations, and (3) evaluate trends across New Hampshire. These methods can be applied to other states and jurisdictions with access to similar exposure and outcome data. These findings will inform public health professionals at the state and local levels working to implement prevention and adaptation strategies in the state of New Hampshire, and throughout the region.
Exploring the four exposure–outcome pairs indicated that maximum temperature was most strongly associated with heat-related hospital visits. Based on the analysis of climate trends over 35 years, the study areas of Durham and Nashua appear to be at significantly higher risk for extreme heat events, as compared to the state overall. It is expected that injury-related hospital visits associated with extreme heat events will increase in these regions as temperatures continue to rise. Recent climate change models for New Hampshire project that the number of days with maximum temperatures over 90 and 95 degrees are expected to increase significantly in the next few decades [57]. Public health practitioners and community planners can expect that as temperatures continue to rise, the risk of heat-related hospitalizations will also rise, unless preventative action is taken to help the population become more resilient to increasing heat stress. Strategies to prevent hospital visits related to extreme weather events should include evidence-based outreach and communication to target populations. These preventive actions and messages should be geographically relevant, as risk varies by location.
This study adds an important dimension to the growing body of knowledge related to the impacts of climate change on health, as there have been no previous reports in the state of New Hampshire that estimate the effects of extreme weather on injury. This study has several strengths, including the use of robust datasets with high spatial and temporal resolution, which were explored using several model frameworks and a variety of exposure and outcome categories.
Other environmental factors not included in this study have the potential to improve model performance. In particular, the addition of air pollution data could prove useful as there are already multiple documented studies on the effect of air pollution on mortality and morbidity and the potential confounding effect of air pollution on extreme weather [27,28,29,44,58]. In addition, accessing quality-controlled hourly meteorological data would also allow for the development of exposure variables known to impact human health, such as the heat index, wind chill, and freezing rain [59,60,61,62]. It is recommended that future work investigate the relationship between precipitation and injuries, in particular, accidental falls.
The injury rates and relative risks presented herein can be used as indicators for public health action to help communities plan and adapt to the impacts of climate change. Public health professionals can equip communities with the knowledge and resources to successfully adapt to environmental changes and extreme weather events. This study presents a multitude of data and information that can be utilized by the State Health Department and local partners to tailor efforts to meet the unique needs of communities in New Hampshire with diverse climates and demographics.

Supplementary Materials

The following are available online at https://www.mdpi.com/2073-4433/11/3/281/s1, Table S1: Study areas with corresponding towns and populations.

Author Contributions

All authors contributed equally to the conceptualization, analysis, and writing that supported this manuscript. All authors have read and agreed to the published version of the manuscript.

Funding

This research was funded by the National Center for Environmental Health (NCEH) at the Centers for Disease Control and Prevention (CDC), grant number NUE1 EH001332-01. The contents are solely the responsibility of the authors and do not necessarily represent the official views of the CDC or the US DHHS.

Acknowledgments

We would like to thank the New Hampshire Department of Health and Human Services as well as the Centers for Disease Control and Prevention for supporting this work.

Conflicts of Interest

The authors declare no conflict of interest. The funders had no role in the design of the study; in the collection, analyses, or interpretation of data; in the writing of the manuscript, or in the decision to publish the results.

References

  1. NCDC. Climate of New Hampshire; NCDC Climate Services Branch Report 7; NCDC: Asheville, NC, USA, 2017.
  2. Meehl, G.A.; Tebaldi, C.; Walton, G.; Easterling, D.; McDaniel, L. Relative increase of record high maximum temperatures compared to record low minimum temperatures in the U.S. Geophys. Res. Lett. 2009, 36. [Google Scholar] [CrossRef] [Green Version]
  3. Balbus, J.; Crimmins, A.; Gamble, J.L.; Easterling, D.R.; Kunkel, K.E.; Saha, S.; Sarofim, M.C.C. 1: Introduction: Climate Change and Human Health. In The Impacts of Climate Change on Human Health in the United States: A Scientific Assessment; U.S. Global Change Research Program: Washington, DC, USA, 2016; pp. 25–42. [Google Scholar]
  4. U.S. Global Change Research Program. 2014 National Climate Assessment; Cambridge University Press: Cambridge, UK; New York, NY, USA, 2014. Available online: http://nca2014.globalchange.gov/report/our-changing-climate/precipitation-change (accessed on 31 August 2016).
  5. IPCC. Summary for Policy Makers. In Climate Change The Physical Science Basis; Contribution of Working Group I to the Fifth Assessment Report of the Intergovernmental Panel on Climate Change; Stocker, T.F., Qin, D., Plattner, G.-K., Tignor, M., Allen, S.K., Boschung, J., Nauels, A., Xia, Y., Bex, V., Midgley, P.M., Eds.; IPCC: Geneva, Switzerland, 2013. [Google Scholar]
  6. Knowlton, K.; Rotkin-Ellman, M.; King, G.; Margolis, H.G.; Smith, D.; Solomon, G.; Trent, R.; English, P. The 2006 California heat wave: Impacts on hospitalizations and emergency department visits. Environ. Health Perspect. 2009, 117, 61–67. [Google Scholar] [CrossRef] [PubMed]
  7. Basu, R.; Pearson, D.; Malig, B.; Broadwin, R.; Green, R. The effect of high ambient temperature on emergency room visits. Epidemiology 2012, 23, 813–820. [Google Scholar] [CrossRef] [PubMed]
  8. Kent, S.T.; McClure, L.A.; Zaitchik, B.F.; Smith, T.T.; Gohlke, J.M. Heat waves and health outcomes in Alabama (USA): The importance of heat wave definition. Environ. Health Perspect. 2014, 122, 151–158. [Google Scholar] [CrossRef] [PubMed]
  9. Lavigne, E.; Gasparrini, A.; Wang, X.; Chen, H.; Yagouti, A.; Fleury, M.D.; Cakmak, S. Extreme ambient temperatures and cardiorespiratory emergency room visits: Assessing risk by comorbid health conditions in a time series study. Environ. Health 2014, 13, 5. [Google Scholar] [CrossRef] [Green Version]
  10. Michelozzi, P.; Accetta, G.; de Sario, M.; D’Ippoliti, D.; Marino, C.; Baccini, M.; Biggeri, A.; Anderson, H.R.; Katsouyanni, K.; Ballester, F.; et al. High temperature and hospitalizations for cardiovascular and respiratory cases in 12 European cities. Am. J. Respir. Crit. Care Med. 2009, 179, 383–389. [Google Scholar] [CrossRef] [PubMed] [Green Version]
  11. Dawson, J.; Weir, C.; Wright, F.; Bryden, C.; Aslanyan, S.; Lees, K.; Bird, W.; Walters, M. Associations between meteorological variables and acute stroke hospital admissions in the west of Scotland. Acta Neurol. Scand. 2008, 117, 85–89. [Google Scholar] [CrossRef]
  12. Garssen, J.; Harmsen, C.; de Beer, J. The effect of the summer 2003 heat wave on mortality in the Netherlands. Eurosurveillance 2005, 10, 165–168. [Google Scholar] [CrossRef]
  13. Kovats, R.S.; Johnson, H.; Griffith, C. Mortality in southern England during the 2003 heat wave by place of death. Health Stat Q. 2006, 29, 6–8. [Google Scholar]
  14. Le Tertre, A.; Lefranc, A.; Eilstein, D.; Declercq, C.; Medina, S.; Blanchard, M.; Chardon, B.; Fabre, P.; Filleul, L.; Jusot, J.F.; et al. Impact of the 2003 Heatwave on All-Cause Mortality in 9 French Cities. Epidemiology 2006, 17, 15. [Google Scholar] [CrossRef]
  15. Parks, R.M.; Bennet, J.E.; Tamura-Wicks, H.; Kontis, V.; Toumi, R.; Danaei, G.; Essati, M. Anamalously warm temperatures are associated with increased injury deaths. Nat. Med. 2020, 26, 65–70. [Google Scholar] [CrossRef] [PubMed] [Green Version]
  16. U.S. Environmental Protection Agency. Understanding the Link between Climate Change and Extreme Weather. 2016. Available online: https://www.epa.gov/climate-change-science/understanding-link-between-climate-change-and-extreme-weather (accessed on 10 October 2016).
  17. Menne, M.J.; Durre, I.; Korzeniewski, B.; McNeal, S.; Thomas, K.; Yin, X.; Anthony, S.; Ray, R.; Vose, R.S.; Gleason, B.E.; et al. Global Historical Climatology Network—Daily (GHCN-Daily), Version 3.12; NOAA National Climate Data Center: Asheville, NC, USA; p. 2012.
  18. NOAA National Climatic Data Center. Available online: http://doi.org/10.7289/V5D21VHZ (accessed on 10 October 2016).
  19. Thacker, M.T.F.; Lee, R.; Sabogal, R.I.; Henderson, A. Overview of deaths associated with natural events, United States, 1979-2004. Disasters. 2008, 32, 303–315. [Google Scholar] [CrossRef] [PubMed]
  20. Thomas, K.E.; Johnson, R.L. Injuries in the State of New Hampshire 2001–2009; New Hampshire Department of Health and Human Services, Division of Public Health Services, Injury Surveillance Program: Concord, NH, USA, 2012; p. 96. [Google Scholar]
  21. Kovats, R.S.; Hajat, S.; Wilkinson, P. Contrasting patterns of mortality and hospital admissions during hot weather and heat waves in greater London, UK. Occup. Environ. Med. 2004, 61, 893–898. [Google Scholar] [CrossRef] [PubMed] [Green Version]
  22. Schwartz, J.; Samet, J.M.; Patz, J.A. Hospital admissions for heart disease: The effects of temperature and humidity. Epidemiology 2004, 15, 755–761. [Google Scholar] [CrossRef]
  23. Armstrong, B. Models for the relationship between ambient temperature and daily mortality. Epidemiology 2006, 17, 624–631. [Google Scholar] [CrossRef]
  24. Muggeo, V.M.; Hajat, S. Modelling the non-linear multiple-lag effects of ambient temperature on mortality in Santiago and Palermo: A constrained segmented distributed lag approach. Occup. Environ. Med. 2009, 66, 584–591. [Google Scholar] [CrossRef]
  25. Hastie, T.; Tibshirani, R. Generalized additive models. Stat. Sci. 1986, 1, 297–310. [Google Scholar] [CrossRef]
  26. Schwartz, J. Nonparametric smoothing in the analysis of air pollution and respiratory illness. Can. J. Stat. 1994, 22, 471–488. [Google Scholar] [CrossRef]
  27. Kelsall, J.E.; Samet, J.M.; Zeger, S.L.; Xu, J. Air pollution and mortality in Philadelphia, 1974–1988. Am. J. Epidemiol. 1997, 146, 750–762. [Google Scholar] [CrossRef]
  28. Dominici, F.; Samet, J.M.; Zeger, S.L. Combining evidence on air pollution and daily mortality from the twenty largest U.S. cities: A hierarchical modeling strategy (with discussion). J. R. Stat. Soc. Ser. A 2000, 163, 263–302. [Google Scholar] [CrossRef]
  29. Schwartz, J. Air pollution and hospital admissions for heart disease in eight U.S. counties. Epidemiology 1999, 10, 17–22. [Google Scholar] [CrossRef] [PubMed]
  30. Samet, J.M.; Dominici, F.; Curriero, F.C.; Coursac, I.; Zeger, S.L. Fine particulate air pollution and mortality in 20 U.S. cities: 1987–1994. N. Emgl. J. Med. 2000, 343, 1742–1757. [Google Scholar] [CrossRef] [PubMed]
  31. Katsouyanni, K.; Touloumi, G.; Samoli, E.; Gryparis, A.; Le Tertre, A.; Monopolis, Y.; Rossi, G.; Zmirou, D.; Ballester, F.; Boumghar, A.; et al. Confounding and effect modification in the short-term effects of ambient particles on total mortality: Results from 29 European cities within the APHEA2 project. Epidemiology 2001, 12, 521–531. [Google Scholar] [CrossRef] [PubMed] [Green Version]
  32. Dominici, F.; McDermott, A.; Zeger, S.L.; Samet, J.M. On the use of generalized additive models in time-series studies of air pollution and health. Am. J. Epidemiol. 2002, 156, 193–203. [Google Scholar] [CrossRef] [PubMed]
  33. Akaike, H. Information theory as an extension of the maximum likelihood principle. In Second International Symposium on Information Theory; Petrov, B.N., Csaki, F., Eds.; Akademiai Kiado: Budapest, Hungary, 1973; pp. 267–281. [Google Scholar]
  34. Sakamoto, Y.; Ishiguro, M.; Kitagawa, G. Akaike Information Criterion Statistics; KTK Scientific Publisher: Tokyo, Japan, 1988. [Google Scholar]
  35. Guisan, A.; Edwards, T.C., Jr.; Hastie, T. Generalized linear and generalized additive models in studies of species distributions: Setting the scene. Ecol. Model. 2002, 157, 89–100. [Google Scholar] [CrossRef] [Green Version]
  36. Barry, S.C.; Walsh, A. Generalized additive modelling and zero inflated count data. Ecol. Model. 2002, 157, 179–188. [Google Scholar] [CrossRef]
  37. Constantin de, M.G.; Murtugudde, R.; Sapiano, M.R.; Nizam, A.; Brown, C.W.; Busalacchi, A.J.; Yunus, M.; Nair, G.B.; Gil, A.I.; Lanata, C.F.; et al. Environmental signatures associated with cholera epidemics. Proc. Natl. Acad. Sci. USA 2008, 105, 17676–17681. [Google Scholar] [CrossRef] [Green Version]
  38. Almeida, S.P.; Casimiro, E.; Calheiros, J. Effects of apparent temperature on daily mortality in Lisbon and Oporto, Portugal. Environ. Health 2010, 9. [Google Scholar] [CrossRef] [Green Version]
  39. Guo, Y.; Barnett, A.G.; Pan, X.; Yu, W.; Tong, S. The impact of temperature on mortality in Tianjin, China: A case-crossover design with a distributed lag non-linear model. Environ. Health Perspect. 2011, 119, 1719–1725. [Google Scholar] [CrossRef] [Green Version]
  40. Gronlund, C.J.; Zanobetti, A.; Schwartz, J.D.; Wellenius, G.A.; O’Neill, M.S. Heat, heat Waves, and Hospital Admissions among the Elderly in the United States. Environ. Health Perspect. 2014, 122, 1187–1192. [Google Scholar] [CrossRef] [Green Version]
  41. Leonard, K.J.; Rauner, M.S.; Schaffhauser-Linzatti, M.M.; Yap, R. The effect of funding policy on day of week admissions and discharges in hospitals: The cases of Austria and Canada. Health Policy 2003, 63, 239–257. [Google Scholar] [CrossRef]
  42. Lin, S.; Luo, M.; Walker, R.J.; Liu, X.; Hwang, S.A.; Chinery, R. Extreme high temperatures and hospital admissions for respiratory and cardiovascular diseases. Epidemiology 2009, 20, 738–746. [Google Scholar] [CrossRef] [PubMed]
  43. Wei-ping, M.; Gu, S.; Wang, Y.; Zhang, X.; Wang, A.; Zhao, N.; Song, Y. The use of mixed generalized additive modeling to assess the effect of temperature on the usage of emergency electrocardiography examination among the elderly in Shanghai. PLoS ONE 2014, 9, e100284. [Google Scholar]
  44. Samoli, E.; Schwartz, J.; Wojtyniak, B.; Touloumi, G.; Spix, C.; Balducci, F.; Medina, S.; Rossi, G.; Sunyer, J.; Bacharova, L.; et al. Investigating regional differences in short-term effects of air pollution on daily mortality in the APHEA project: A sensitivity analysis for controlling long-term trends and seasonality. Environ. Health Perspect. 2001, 109, 349–353. [Google Scholar] [CrossRef] [PubMed]
  45. DerSimonian, R.; Laird, N. Meta-analysis in clinical trials. Control Clin. Trials 1986, 7, 177–188. [Google Scholar] [CrossRef]
  46. Normand, S.L. Meta-Analysis: Formulating, Evaluating, Combining, and Reporting. Stat. Med. 1999, 18, 321–359. [Google Scholar] [CrossRef]
  47. Alessandrini, E.; Sajani, S.Z.; Scotto, F.; Miglio, R.; Marchesi, S.; Lauriola, P. Emergency ambulance dispatches and apparent temperature: A time series analysis in Emilia–Romagna, Italy. Environ. Res. 2011, 111, 1192–1200. [Google Scholar] [CrossRef]
  48. Gasparrini, A.; Armstrong, B.; Kenward, M.G. Multivariate meta-analysis for non-linear and other multi-parameter associations. Stat. Med. 2012, 31, 3821–3839. [Google Scholar] [CrossRef] [Green Version]
  49. Ueda, K.; Nitta, H.; Ono, M.; Takeuchi, A. Estimating mortality effects of fine particulate matter in Japan: A comparison of time-series and case crossover analyses. J. Air Waste Manag. Assoc. 2012, 59, 1212–1218. [Google Scholar] [CrossRef]
  50. R Core Team. R: A Language and Environment for Statistical Computing; R Foundation for Statistical Computing: Vienna, Austria, 2015; ISBN 3-900051-07-0. Available online: http://www.R-project.org/ (accessed on 1 August 2016).
  51. Ostro, B.; Rauch, S.; Green, R.; Malig, B.; Basu, R. The effects of temperature and use of air conditioning on hospitalizations. Am. J. Epidemiol. 2010, 172, 1053–1061. [Google Scholar] [CrossRef] [PubMed]
  52. Nelson, N.G.; Collins, C.L.; Comstock, R.D.; McKenzie, L.B. Exertional heat-related injuries treated in emergency departments in the U.S.; 1997–2006. Am. J. Prev. Med. 2011, 40, 54–60. [Google Scholar] [CrossRef] [PubMed]
  53. Turner, L.R.; Barnett, A.G.; Connell, D.; Tong, S. Ambient temperature and cardiorespiratory morbidity: A systematic review and meta-analysis. Epidemiology 2012, 23, 594–606. [Google Scholar] [CrossRef] [PubMed] [Green Version]
  54. Bai, L.; Ding, G.; Gu, S.; Bi, P.; Su, B.; Qin, D.; Xu, G.; Liu, Q. The effects of summer temperature and heat waves on heat-related illness in a coastal city of China, 2011-2013. Environ. Res. 2014, 132, 212–219. [Google Scholar] [CrossRef] [PubMed] [Green Version]
  55. Gasparrini, A.; Armstrong, B. The impact of heat waves on mortality. Epidemiology 2011, 22, 68–73. [Google Scholar] [CrossRef] [Green Version]
  56. Stafoggia, M.; Forastiere, F.; Agostini, D.; Biggeri, A.; Bisanti, L.; Cadum, E.; Caranci, N.; de’Donato, F.; De Lisio, S.; De Maria, M.; et al. Vulnerability to Heat-Related Mortality: A Multicity, Population-Based, Case-Crossover Analysis. Epidemiology 2006, 17, 315–323. [Google Scholar] [CrossRef]
  57. Wake, C.P.; Burakowski, E.A.; Wilkinson, P.; Hayhoe, K.; Stoner, A.; Keeley, C.; LaBranche, J. Climate Change in Southern New Hampshire: Past, Present and Future; The Sustainability Institute, 2014; Volume 2, Available online: https://scholars.unh.edu/sustainability/2 (accessed on 25 September 2016).
  58. Moolgavkar, S. Air pollution and hospital admissions for diseases of the circulatory system in three U.S. metropolitan areas. J. Air Waste Manag. Assoc. 2000, 50, 1199–1206. [Google Scholar] [CrossRef] [Green Version]
  59. Levy, A.R.; Bensimon, D.R.; Mayo, N.E.; Leighton, H.G. Inclement weather and the risk of hip fracture. Epidemiology 1998, 9, 172–177. [Google Scholar] [CrossRef]
  60. Carder, M.; McNamee, R.; Beverland, I.; Elton, R.; Cohen, G.R.; Boyd, J.; Agius, R.M. The lagged effect of cold temperature and wind chill on cardiorespiratory mortality in Scotland. Occup. Environ. Med. 2005, 62, 702–710. [Google Scholar] [CrossRef] [Green Version]
  61. Kim, H.; Ha, J.S.; Park, J. High temperature, heat index, and mortality in 6 major cities in South Korea. Arch. Environ. Occup. Health 2006, 61, 265–270. [Google Scholar] [CrossRef]
  62. Yip, F.Y.; Flanders, W.D.; Wolkin, A.; Engelthaler, D.; Humble, W.; Neri, A.; Lewis, L.; Backer, L.; Rubin, C. The impact of excess heat events in Maricopa County, Arizona: 2000-2005. Int. J. Biometeorol. 2008, 52, 765–772. [Google Scholar] [CrossRef]
Figure 1. Study areas include all towns within a 10-mile buffer of the weather stations.
Atmosphere 11 00281 g001
Figure 2. Risk estimates for all-cause injury-related hospital visits associated with a 1 °C increase in temperature, reported with a 95% CI.
Atmosphere 11 00281 g002
Figure 3. Risk estimates for hospital visits related to vehicle accidents associated with a 1 °C increase in temperature, reported with a 95% CI.
Atmosphere 11 00281 g003
Figure 4. Risk estimates for hospital visits related to accidental falls associated with a 1 °C increase in temperature, reported with a 95% CI.
Atmosphere 11 00281 g004
Figure 5. Risk estimates for hospital visits related to heat associated with a 1 °C increase in temperature, reported with a 95% CI.
Atmosphere 11 00281 g005
Table 1. Emergency codes (Ecodes) and ICD-9 codes used to create injury categories.
EventICD-9 Code or Ecode
All-Cause800-999
Motor Vehicle AccidentsE810-E829; E846-E849
Accidental FallsE880-E888
Natural and EnvironmentalE900; E901; E904.3; E907; E908; 991-992
Accidental DrowningE910
Carbon Monoxide PoisoningE868
Table 2. Emergency codes (Ecodes) and ICD-9 codes used to create injury sub-categories related to natural or environmental causes.
Natural EventICD-9 Code or Ecode
ColdE900; 991
HeatE900; 992
ExposureE904.3
LightningE907
Storms and floodsE908
Table 3. Exposure variables and outcome variables used in this analysis.
ExposuresOutcomes
Daily Maximum Temperature ≥90 °F
(≥32 °C)
(Heat Metric 1; HM1)
All-Cause Injury (All)
Daily Maximum Temperature ≥95 °F
(≥35 °C)
(Heat Metric 2; HM2)
Motor Vehicle Accidents (Veh)
Daily Maximum Temperature ≤32 °F
(≤0 °C)
(Cold Metric 1; CM1)
Accidental Falls (Falls)
Daily Precipitation ≥1″
(Precipitation Metric 1; PM1)
Accidents due to Natural or Environmental Causes (Environmental)
Daily Precipitation ≥2″
(Precipitation Metric 2; PM2)
Accidental Drowning
Maximum Temperature (Tmax)CO Poisoning
Daily Precipitation (Precip)Cold Visits
Heat Visits
Lightning
Exposure
Storms and Floods
Table 4. Annual injury rates per 100,000 people across all study areas.
Study AreaPopulationAll-Cause InjuriesVehicle AccidentsAccidental FallsEnviron.Accidental DrowningCO Poisoning
Berlin15,23015,976.51873.55366.635.05.116.8
Colebrook598116,671.32142.05342.846.4018.6
Concord137,4199999.71398.23063.423.83.15.3
Durham186,34011,420.81323.93486.528.22.65.7
Hanover36,9828565.71124.32804.418.92.17.5
Keene64,6619325.61462.22906.828.73.17.2
Lakeport89,17015,126.42332.14590.738.16.611.3
Nashua405,78510,987.21656.13269.522.83.37.3
North Conway20,70612,937.71589.44642.231.13.88.0
Table 5. Annual injury rates per 100,000 people for subcategories within the environmental category across all study areas.
Study AreaPopulationColdHeatWeather Not SpecifiedLightningStorms and Floods
Berlin15,23019.713.90.70.70
Colebrook598133.49.301.91.9
Concord137,41911.39.41.51.20.3
Durham186,34010.914.31.41.60.1
Hanover36,9829.67.80.31.20
Keene64,6611114.61.51.40.2
Lakeport89,17019.113.82.92.40
Nashua405,78510.612.32.110.1
North Conway20,70617.29.72.12.10
Table 6. Strongest correlations for each study area with the outcome variable listed first and the exposure variable listed second.
Study AreaStrongest2nd Strongest3rd Strongest
BerlinAll/Tmax (0.193)Veh/Tmax (0.135)Heat/HM1 (0.134)
ColebrookHeat/HM1 (0.109)All/Tmax (0.108)Falls/ Tmax (−0.072)
ConcordAll/Tmax (0.407)Heat/HM1 (0.340)Heat/Tmax (0.233)
DurhamHeat/HM1 (0.507)All/Tmax (0.497)Environmental/HM1 (0.335)
HanoverAll/Tmax (0.290)Heat/HM1 (0.181)Heat/HM2 (0.165)
KeeneAll/Tmax (0.292)Heat/HM1 (0.249)Veh/Tmax (0.210)
LakeportAll/Tmax (0.440)Heat/HM1 (0.368)Heat/Tmax (0.226)
NashuaAll/Tmax (0.554)Heat/HM1 (0.353)Heat/Tmax (0.348)
North ConwayFalls/ Tmax (−0.216)Falls/ CM1 (0.187)Veh/Tmax (0.155)
Table 7. Strongest seasonal correlations for each study area with the outcome variable listed first and the exposure variable listed second (season listed third as Warm or Cool).
Strongest2nd Strongest
BerlinAll/Tmax /Warm (0.132)Heat/HM1/Warm (0.131)
ColebrookHeat/HM1/Warm (0.119)Cold/Tmax /Cool(−0.097)
ConcordHeat/ HM1/Warm (0.309)Heat/Tmax /Warm (0.279)
DurhamHeat/HM1/Warm (0.504)Heat/Tmax /Warm (0.400)
HanoverAll/ Tmax /Warm (0.207)Heat/HM1/Warm (0.197)
KeeneHeat/ HM1/Warm (0.225)Heat/Tmax /Warm (0.212)
LakeportHeat / HM1/Warm (0.368)Heat/Tmax /Warm (0.286)
NashuaHeat / Tmax /Warm (0.366)Heat/HM1/Warm (0.341)
North ConwayHeat / HM1/Warm (0.140)Heat/HM2/Warm (0.129)
Table 8. Model frameworks used to evaluate each exposure–outcome pair.
Exposure–OutcomeModel
All-cause Injury ~ Tmaxlog(Yt) = β0 + β1 Tmax + s(time) + β2 DOW + β3 Summer + εt
Vehicle Accidents ~ Tmaxlog(Yt) = β0 + β1 Tmax + s(time) + β2 DOW + β3 Summer + εt
Accidental Falls ~ Tmaxlog(Yt) = β0 + β1 Tmax + s(time) + β2 DOW + β3 EWMcold + εt
Heat-related Visits ~ Tmaxlog(Yt) = β0 + β1 Tmax + s(time) + β2 DOW + β3 EWMhot + εt

