Article

Monitoring of Air Pollution by Moss Bags around an Oil Refinery: A Critical Evaluation over 16 Years

Department of Life and Environmental Sciences, University of Cagliari, Via Sant’Ignazio 13, 09123 Cagliari, Italy
*
Author to whom correspondence should be addressed.
Atmosphere 2020, 11(3), 272; https://doi.org/10.3390/atmos11030272
Submission received: 27 January 2020 / Revised: 3 March 2020 / Accepted: 6 March 2020 / Published: 9 March 2020
(This article belongs to the Special Issue Biomonitoring of Air Pollution)

Abstract

:
The present study analyzes the results of a biomonitoring campaign, carried out by means of Hypnum cupressiforme Hedw. moss bags around an oil refinery, located in the southwestern part of Sardinia island (Italy). This work focuses mainly on the effects of rainfall and distance from the source of contamination on the content of 14 trace elements measured over 16 years. In addition, to point out any increasing or decreasing trends, as well as any peak in presence of airborne pollutants in the area, annual elements’ concentration values are plotted and discussed. Coefficients of variation were also calculated on accumulation values in order to evaluate stability of measurements across the years and to evaluate if similar exposure conditions, i.e., humidity and distance from contamination source, resulted in more uniform accumulation values. In conclusion, (i) the vicinity of the source of contamination as well as rainfall influenced element content in the biomonitor in the case study differently, depending on the considered element and on the exposure condition, (ii) H. cupressiforme moss bags provided relatively stable measurements during the 16-year time frame (observed variations in elements content can be attributed to environmental inputs in the area), (iii) similar conditions of exposure determined less variable accumulation values.

1. Introduction

Biomonitoring, intended as the use of living organisms or biological tissues to measure a certain ecological condition [1], is a simple, efficient and cost-effective way to characterize (qualitatively and quantitatively) the presence of airborne pollutants, known to represent a threat to ecosystems and human health [1,2,3,4,5]. Bryophytes and lichens, due to their structural and physiological features—they lack a root system, therefore, their supply of nutrients relies mainly on wet and dry atmospheric deposition [3]—are a commonly used taxa in the monitoring of air quality and deposition of airborne pollutants. The systematic use of bryophytes in the biomonitoring of atmospheric pollutants started in the 1950s, to characterize industrial emissions of fluorine [6], while from the 1980s they also began to be considered as a valid tool to study the deposition of organic airborne pollutants [7]. Taxa belonging to the bryophytes generally present an elevated surface to volume ratio, lack well-developed epidermis or cuticle and possess high permeability to water and to elements dissolved in it [8], moreover, ion-binding sites are abundant in bryophytes’ cell walls, so the adsorption capacity of their tissues is relevant [3]. The above-mentioned features enable bryophytes, and especially mosses, to accumulate airborne pollutants coming in contact with them. Atmospheric pollutants could interact with mosses in three forms: As aqueous solution, gas or solid particles and can adhere on cells’ surfaces, outer walls (via ion exchange process) or be included into cells (via passive or active transport) [1,9]. Accumulation of atmospheric pollutants can be influenced by the features of the particulate, of the biomonitor and by ecological parameters. Particles’ size, as well as the chemical nature of the pollutants greatly influence their accumulation in tissues—generally, uptake efficiency follows the following order, lead (Pb) > cobalt (Co), chromium (Cr) > copper (Cu), cadmium (Cd), molybdenum (Mo), nickel (Ni), vanadium (V) > zinc (Zn) > arsenic (As) [3,10,11]. Surface structure (and its number and type of cation exchange sites), cells’ pH, biomass productivity and age of the tissue are biomonitor-constitutive factors also affecting bioaccumulation of particles. Finally, temperature, precipitations, aridity [12], vegetal coverage [13], occurrence of exposed mineralization and presence of sea salt [10,14,15] and acidic precipitations [16,17] are ecological factors that affect accumulation and concentration of elements in mosses [9], and consequently their reliability in biomonitoring anthropogenic airborne pollutants. Among the several moss-based biomonitoring approaches, the “moss bag technique” is one of the most frequently used and it consists in exposing mesh bags containing moss samples (generally grown in absence of contamination) to assess air quality and the presence of airborne pollutants in a certain area [18].
The present study is based on and discusses a subset of data resulting from a biomonitoring activity which started in the 1990s and is currently ongoing. The biomonitor used in the survey is the moss Hypnum cupressiforme Hedw., which is exposed in the form of subspherical moss bags, to monitor air quality in the vicinities of an industrial plant (an oil refinery) located in the southwestern part of Sardinia island (Italy). According to the sampling design, the moss bags were exposed for 9 weeks at different distances from the contamination source (oil refinery) for three, non-consecutive times a year. This sampling design was conceived following Castello et al. 1999 [19], in order to monitor airborne pollutants in the area around the source of contamination—in the immediate vicinities and in more remote areas—and to test if topography and meteorological condition of exposure (essentially rainfall) affect moss uptake.

2. Materials and Methods
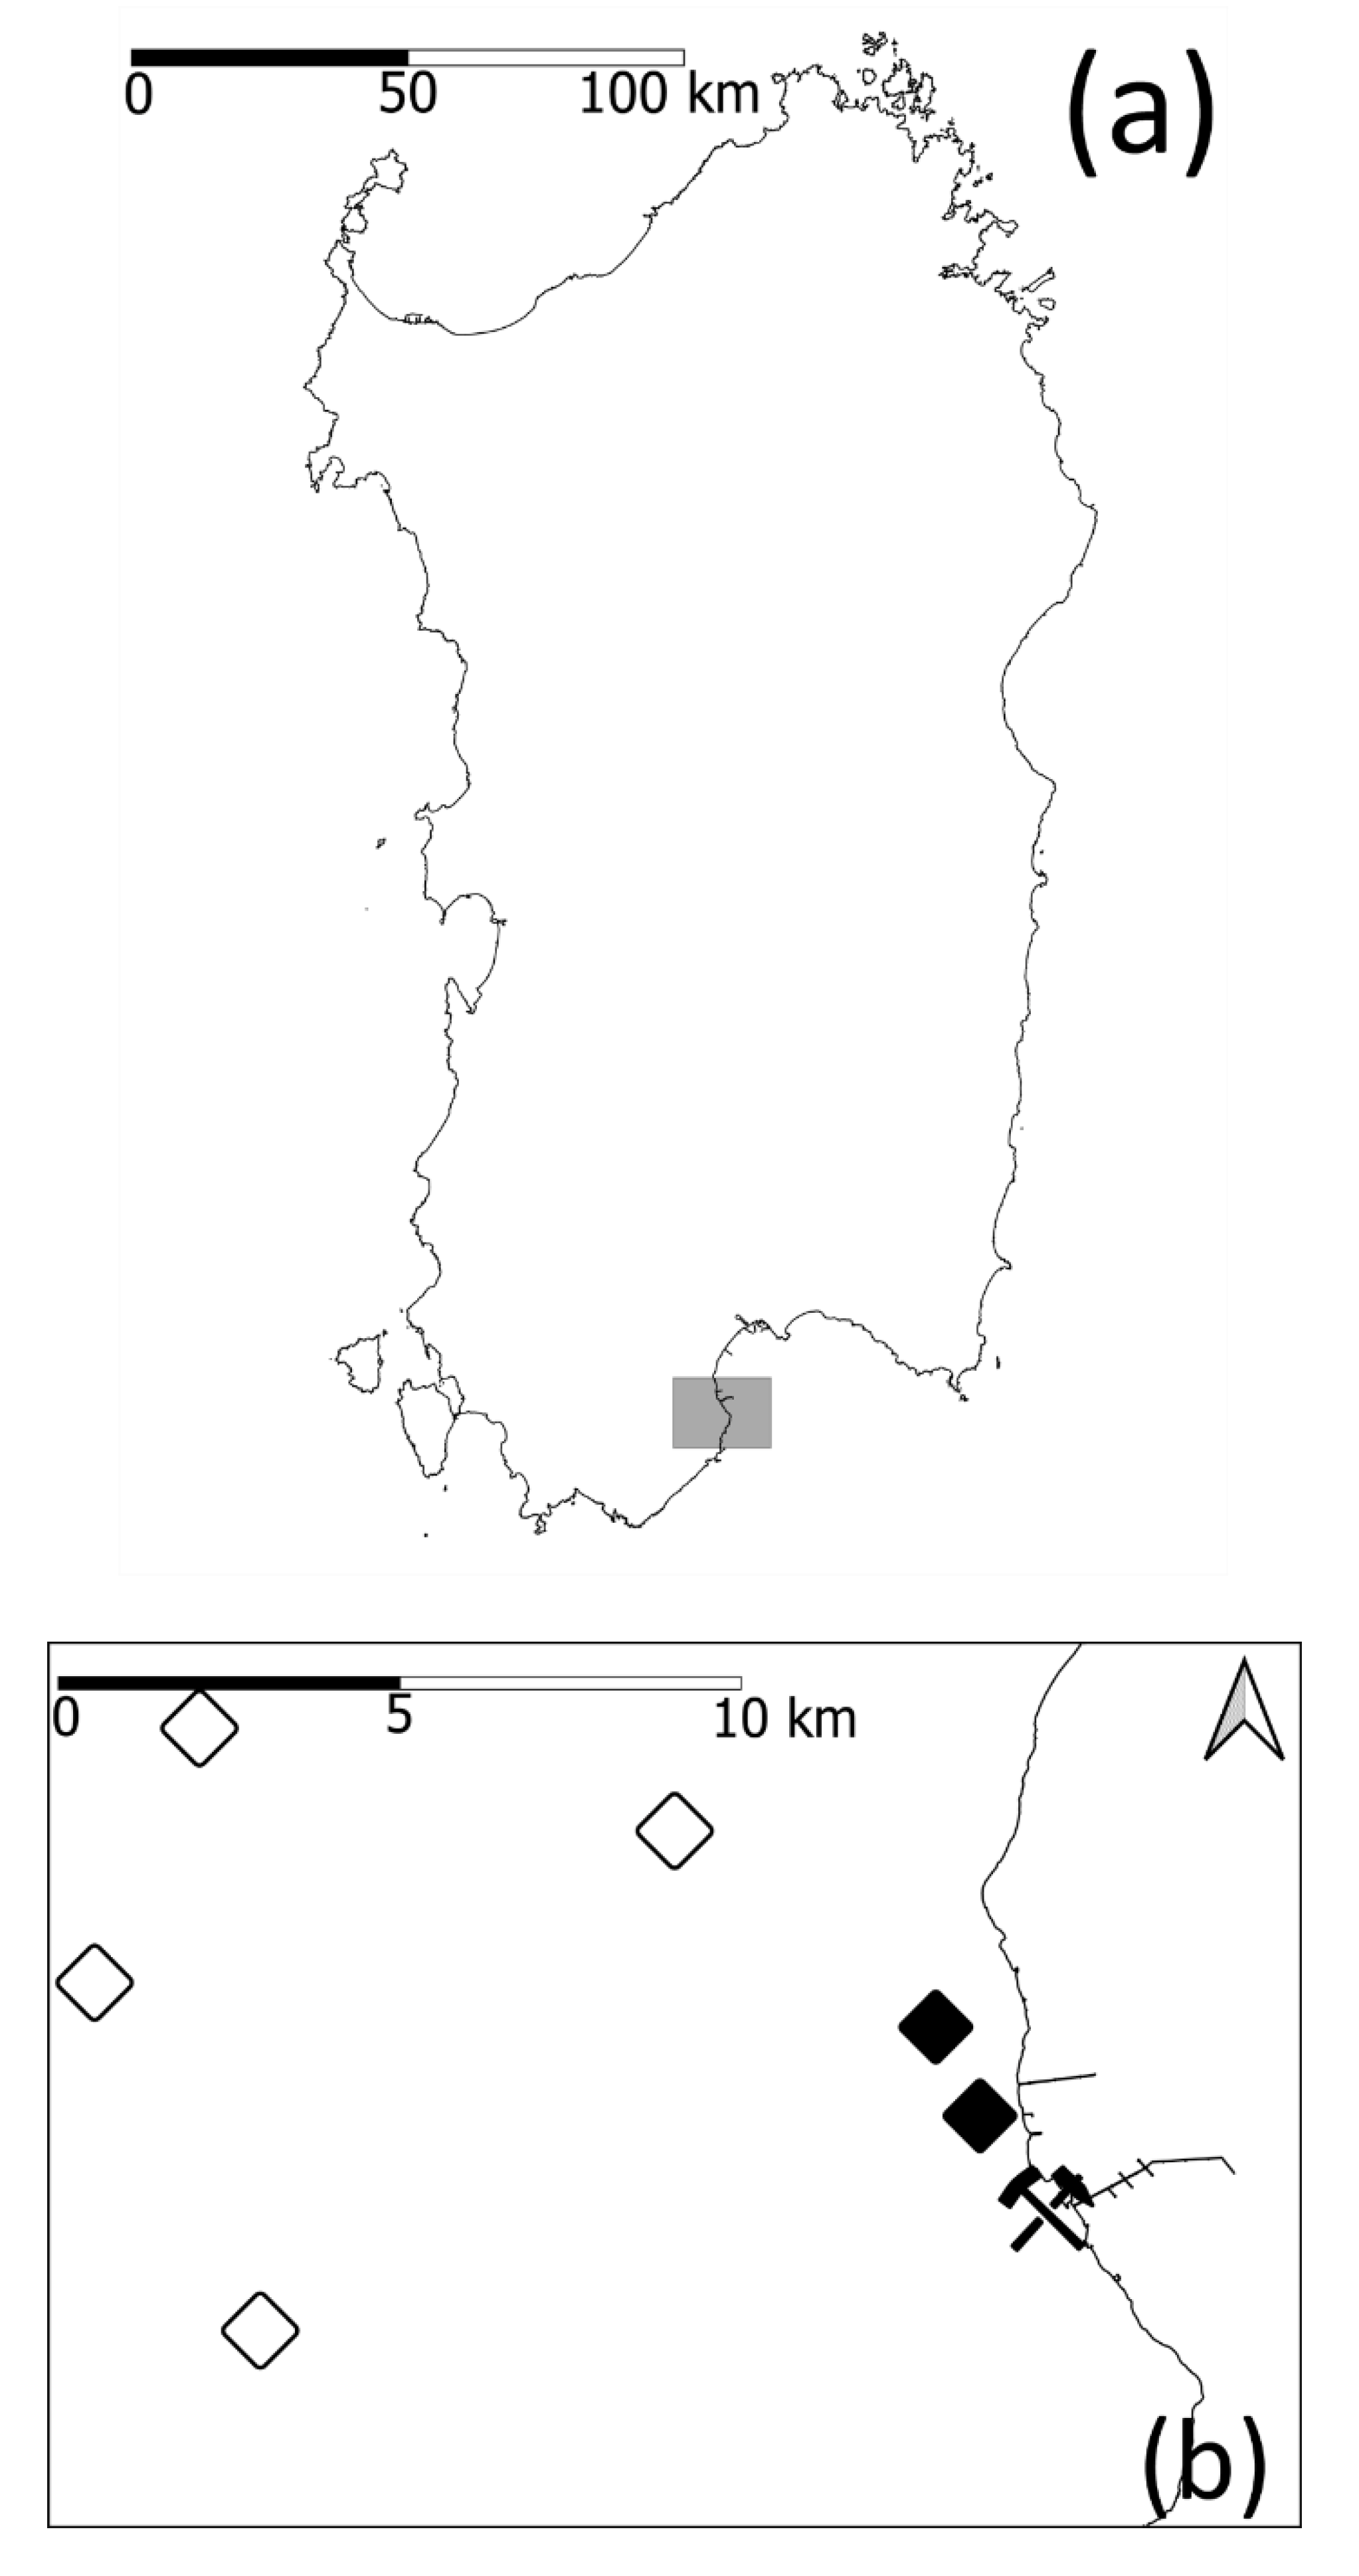
2.1. Study Area

The present study was carried out in Sardinia (Italy) (Figure 1a), the second largest island of the Mediterranean Sea. Located in a central position in the sea basin, it presents a typical Mediterranean climate: Warm summers (temperatures can easily exceed 40 °C) with high levels of humidity and generally an absence of precipitation, mild winters (temperatures rarely drop below 0 °C), and rainfall occurs mainly in autumn and spring, presenting annual mean values of about 400 mm. Dominant winds in the island come from NW and E-SE. The monitored industrial area is located in the southeastern portion of the island (Figure 1b), on magmatic (leucogranites) and metamorphic (schists) rocks, surrounded by typical Mediterranean vegetation presenting Quercus suber L., Quercus ilex L., Juniperus communis L., Phillyrea latifolia L., etc. [3]. The main industrial activities of the island are carried out in the study area, where the oil refinery reaches 10 mln tons of products per year.

2.2. Moss Bags

Moss bags were prepared using the moss H. cupressiforme, collected using plastic gloves to avoid contamination. The collection area is well-preserved, unpolluted and natural (coordinates 39°17′9.87′’ N and 9°23′12,87′’ E), and presents meteorological and geographical features similar to the investigated area. Each subspherical bag contains 1.4 g of moss, carefully washed in distilled water (washings were repeated until every residual debris in the moss was eliminated), air-dried under laboratory conditions, and packed in a 15 × 15 cm nylon net (2 mm mesh size) [19].

2.3. Sampling Design

Bags were spatially distributed in the study area paying attention to avoid proximity to isolated houses, urban areas and communication routes in order to minimize influences of sources of air pollution other than the refinery in the final content of elements in moss bags [18]. Dominant winds and geomorphology of the area were considered at the time of choosing the disposition of the bags, in fact bags were exposed downwind to the refinery, considering the dominant winds and avoiding the interposition of relevant reliefs between the source of contamination and the exposure sites. Consistent with these principles, a total of 6 sites of exposure were selected: 4 distant, about 15 kms from the center of contamination (from now on identified as “far” sites), and 2 distantced less than 1 km from the refinery (from now on identified as “near” sites of exposure). In each site, three bags were exposed in order to obtain the elements’ measurements in triplicate.
Each year, bags were exposed three, non-consecutives times, for 9 weeks (consistent with Capozzi et al. [20], who suggested a period of exposure longer than 6 weeks), distributed throughout the year: From March to May, from July to September and from October to December. In this way, it was possible to obtain 189 days of monitoring (half a year) distributed evenly along the year with the intention to better represent climatological variability of the region. In the present work, autumn (from October to December) and spring (from March to May) were considered together and identified as “humid” conditions of exposure, as rainfall occurs mostly during these months in the region [21], while summer (from July to September) was considered as a “dry” condition of exposure, due to the aridity occurring in the region during this season. After each exposure, period bags were gathered and the concentration of 14 elements As, Ca, Cd, Cr, Cu, Fe, Hg, K, Mg, Na, Ni, Pb, V, Zn assessed. During each exposure, three period bags were kept unexposed in the laboratory, carefully preserved from any kind of contamination by storing them in a sealed thermostat, in order to calculate background levels of contamination moss. Background levels of contamination were subtracted from the final elements’ concentration values of the exposed bags, as in [3].

2.4. Chemical Analysis

Elements’ content was measured as undertaken in [3], through the use of plasma optical emission spectrometry (Thermo iCAP 6500 duo). Of each one of the three moss bag exposed in each site, 0.5 g of the content was air-dried using a homogenizer, and then digested for 45 min in a microwave digester (MILESTONE ETHOS 1) with 7 mL of HNO3 65% (Sigma-Aldrich) and 1 mL of H2O2 30% (Sigma-Aldrich) at 200 °C. The digested samples were then diluted with distilled water to a total volume of 50 mL. To obtain calibration curves, a stock solution (Merck) containing 1.000 μg/mL of each of the 13 elements of interest was used to prepare intermediate, multi-element standard solutions with the following concentrations: 50, 20, 1, 0.1, 0.01, and 0.005 μg/mL. Quality control was performed using the standard reference material, lichen-336 (IAEA). Elements’ deposition values of each site were recorded. Obtained values were used in the statistical analysis.

2.5. Data Analysis

Analyses, in the present study, were conducted on a subset of data collected over the duration of 16 consecutive years (from 2003 to 2018), in which the following trace elements were assessed: As, Ca, Cd, Cr, Cu, Fe, Hg, K, Mg, Na, Ni, Pb, V, Zn. From now on, we will refer and report element content values as the enrichment value of each element measured in bags (final content of the element after the exposure period, minus the pre-exposure value for that element). Effects of rainfall and distance from the source of contamination on the accumulation of elements were estimated, calculating elements mean concentration values during the 16 years of monitoring campaign for each exposure condition, and subsequently calculating statistical significance of differences among compared sets of data by the Mann–Whitney U test. Data were plotted to represent year-by-year fluctuation in pollutants’ accumulation values and their relation to rainfall and distance from the contamination source. Mean accumulation values were calculated before and after 2010 (the year in which the construction works of a great dam in the study area began) and significance of differences among compared set of data was tested by Wilcoxon test. Finally, coefficients of variation (cv) were calculated on concentration values, not considering differences in exposure conditions, and later subsetting concentration values based on a similar condition of exposure. This procedure permitted to evaluate if more uniform ecological parameters during the exposure period could reduce variation of accumulation values. Calculating the cv of various sets of data (intended as the standard deviation to mean ratio) permitted the comparison of values’ variation around mean values among the different datasets considered. The explorative analysis of data (means, standard errors and coefficients of variation) was carried out using the 1.2.1335 version of the RStudio software [22]. The same software implemented with the ggplot2 package was also used to create graphs.

3. Results

3.1. Element Accumulation in Relation to Exposure Conditions

In Table 1, Table 2 and Table 3 elements concentration values (mg kg−1) are reported as the mean of the values measured during the whole 16 years in the different exposure conditions (per year: n far = 12; n near = 6; n humid = 12; n dry = 6). Elements can be divided on the basis of the magnitude of their concentration values: Elements reaching hundreds of mg per kg of moss (Na, Ca, Fe, Mg, K), reported in Table 1, and elements with concentrations levels lower than 10 mg per kg of moss (Zn, Pb, Ni, Cu, V, Cr, As, Cd, Hg), reported in Table 2. Statistical significance of differences among data are reported in Table 3 as p-values obtained by the Mann–Whitney U test, with significance level alfa at 0.05.

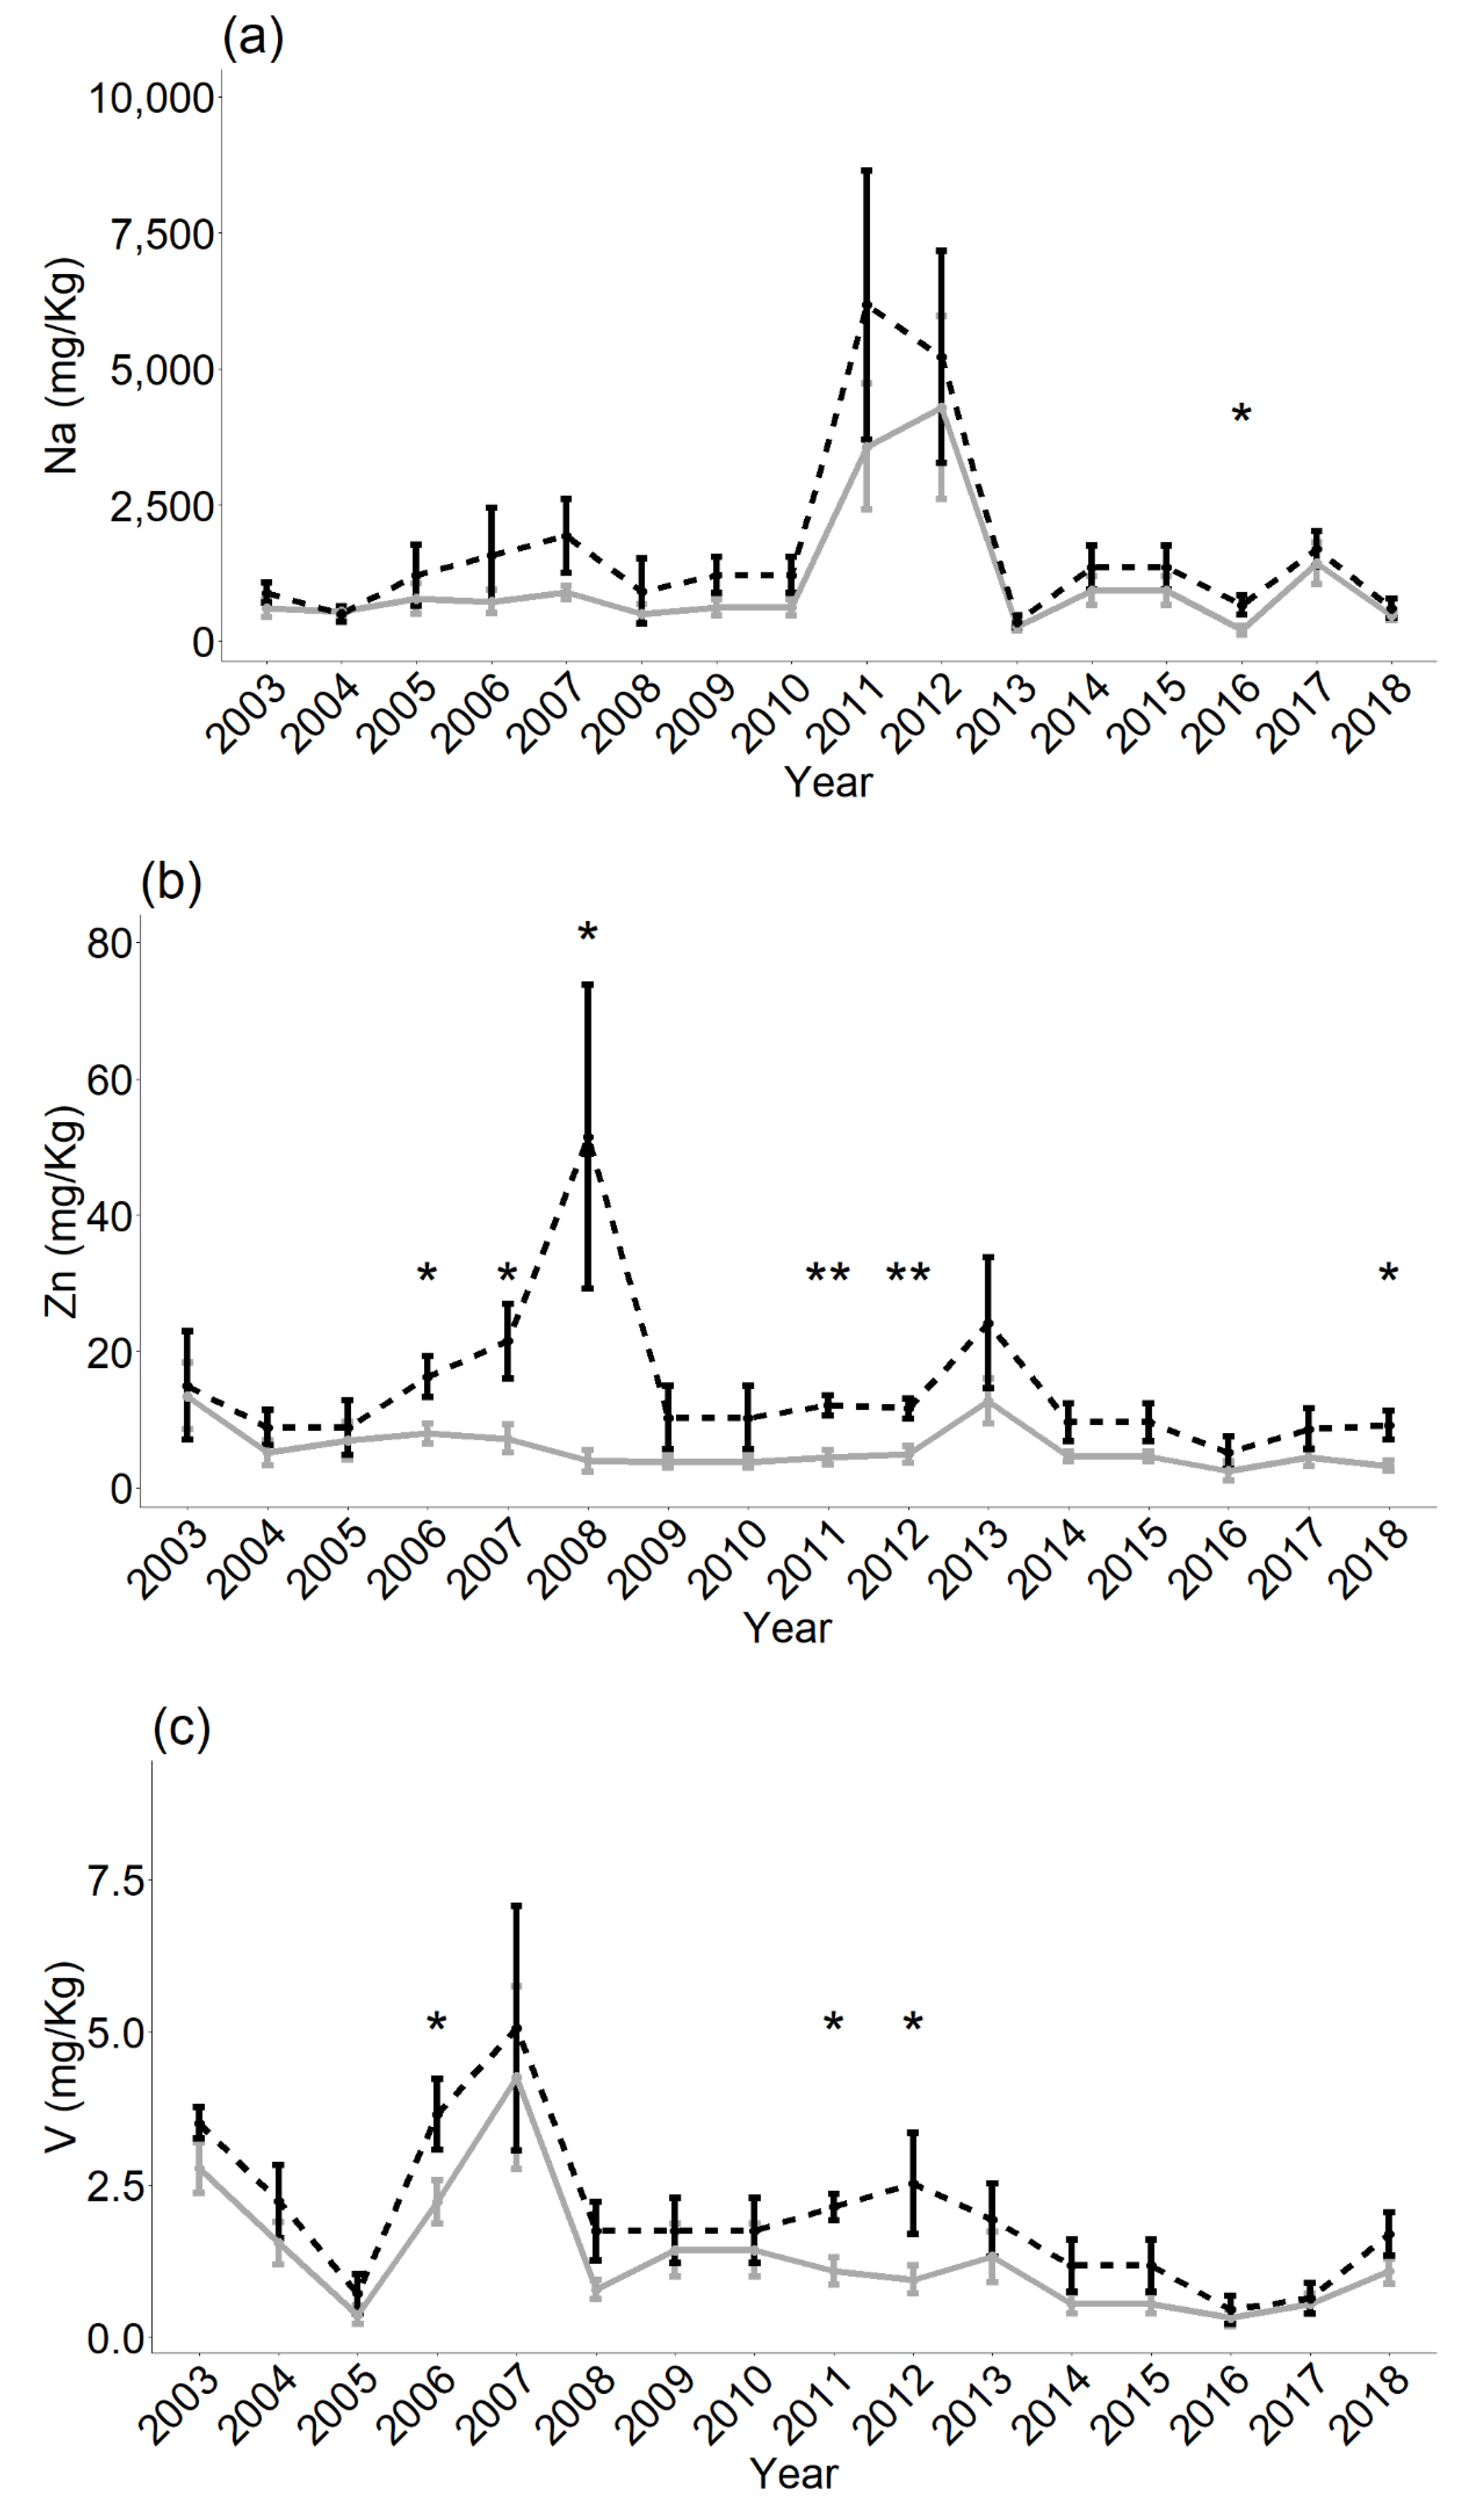
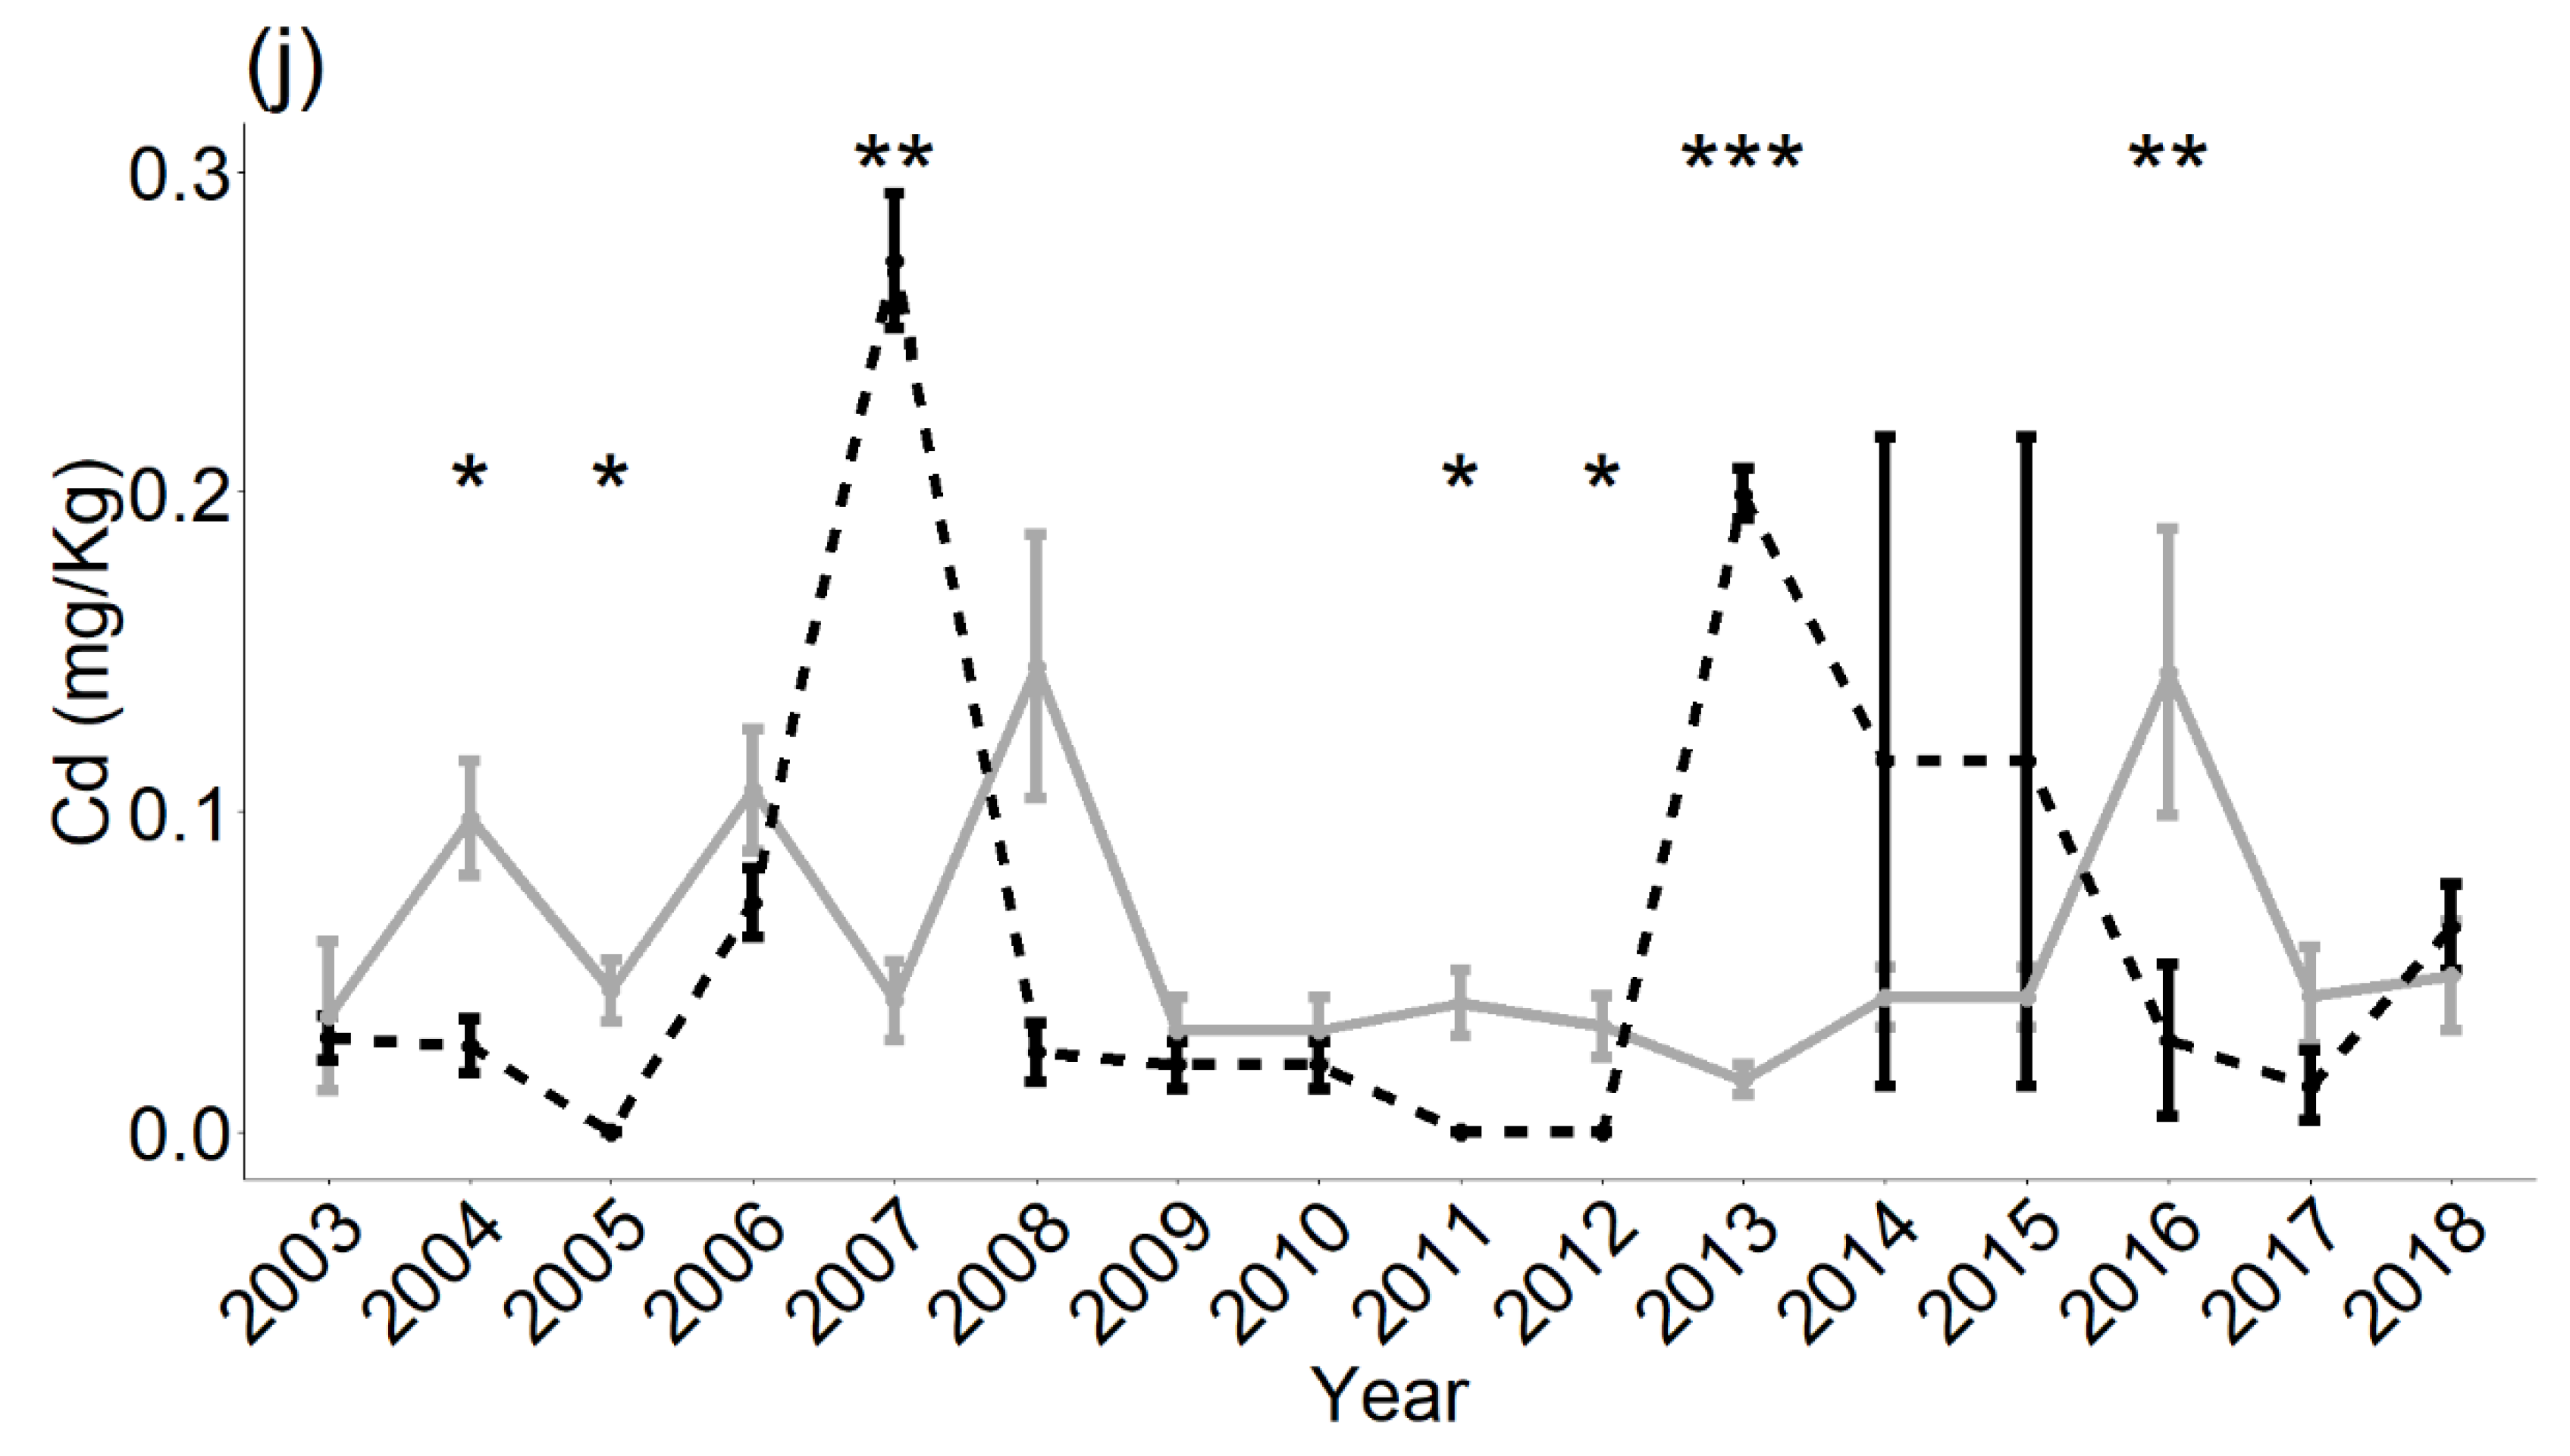
3.2. Temporal Fluctuations in Pollutant Content

Graphs describe fluctuation of accumulation values year by year, summarizing differences in pollutants content measured near and far from the source of contamination (Figure 2a–d), as well as in dry and humid exposure conditions (Figure 2e–j). In Table 4, mean accumulation values are reported for the most representative elements, before and after the start of the construction works of a great dam (year 2010) in the vicinity of the study area.

3.3. Dispersion of Accumulation Data

In Table 5, coefficients of variation of accumulation data of each element are reported, calculated without subsetting data on the basis of exposure conditions of bags (cv total), and calculated on accumulation data measured in bags exposed to the same ecological conditions.

4. Discussion

Data resulting from the biomonitoring activity have been analyzed in the present study. The resulting analyses show that the two considered parameters—rainfall and distance from the source of contamination—influenced element accumulation in bags in different ways, and that differences in accumulation values between different exposure conditions are rarely significative. Nevertheless, elements accumulation seemed to have been influenced by anthropic activities carried out in the study area during the analyzed time frame, as well as by ecological features of the area, such as vicinity of the sea and exposed lithology. Therefore, analysis of the data presented in this study, enable several considerations on the features of airborne pollutants present in the study area, and on how the use of H. cupressiforme as a biomonitor permitted the characterization of atmospheric pollution in the vicinity of the oil refinery.
Among the assessed elements, as reported in [20], As, Cd, Hg, Ni and Pb are included in EU directives for air quality, Al, Cr, Cu, V and Zn are identified as indicators of industrial emissions and Ca, Fe, K, Mg, and Na are elements whose presence is mainly linked to the lithology of the area, in particular to granite and metamorphic rocks, and to the immediate vicinity of the sea. In the next paragraphs we will discuss the presence of these elements in the study area.

4.1. Air Quality and Industrial Emissions

As regards the analysis of elements’ accumulation values in bags, the distinction between macro- and trace elements appears clearly in Table 1, Table 2 and Table 3 in all the exposure conditions: Presence of Na, Ca, Fe, Mg and K reaches, in fact, thousands of mg per kg of moss, while trace elements such as Zn, Pb, Ni, Cu, V, Cr, As, Cd and Hg accumulation values range between 16.00 (Zn) and 0.01 (Hg) mg per kg of moss. Results of this study were compared with results of similar works, assessing airborne pollutants via moss bags. Ares et al. [23], studied a polluted area in the vicinities of an oil refinery in the city of Santa Cruz de Tenerife (Spain), exposing transplants of the moss Pseudoscleropodium purum (Hewd.) M. Fleisch for two months. After-exposure, element concentration values (of Na, Fe, Pb, Ni, V, Cr, As, Cd and Hg) results were higher than those measured in this study, except for Na. In [24], accumulation values of several elements (Fe, Pb, Cu, Cr and As) are reported, measured via H. cupressiforme moss bags in urban and industrial areas in Turkey and in different regions of Europe (Czech Republic, Finland, Germany, Hungary, Netherlands, Norway, Poland and Spain). As a result, accumulation values measured in the study area in Turkey were always higher than those measured in the study area of the present work, as well as the majority of values measured around Europe, except for Ni values. Ni values in the present study are higher than those reported in [24] for Czech Republic, Finland, Germany, Hungary, Netherlands, Norway and Poland; Fe values in the present study exceeded those reported in [24] for Czech Republic and Finland; Cu values exceeded values measured in Finland and Galicia (Spain); and Pb values exceeded values assessed in Finland. As it regards trace elements, their presence in bags is obviously lower if compared with the macro elements, nevertheless as they are known to have a negative impact on human and environmental health [1,3,5], assessing their presence in the atmosphere is crucial in air quality studies. In the 2019 report on air quality by the European Environment Agency (EEA) [25], southwestern Sardinia was enlisted with those areas in which As and Ni presence is very low and does not exceed the 1 and 5 ng m−3 threshold values, respectively, while Pb and Cd atmospheric concentration values were reported to be quite high ranging between the 0.10 and the 0.50 µg m−3 and the 5 and 8 ng m−3, respectively [25]. Concentration values measured in the present study (Table 1, Table 2 and Table 3) partially confirm evaluations made in the EEA report for southwestern Sardinia, in fact, As and Cd are among the least present in bags, ranging between 0.15 and 0.10 mg kg−1, and 0.05 and 0.08 mg kg−1 (depending on exposure condition), respectively, while Pb and Ni present mid-range values, ranging between the 1.63 and the 4.63 mg kg−1 for Pb, and the 0.91 and the 5.05 mg kg−1 (depending on the exposure condition) for Ni. As this study was concerned with the influence of seasonality and distance from the source of contamination on accumulation of elements in bags, both macro- and trace elements present in moss bags seem, in a certain way, to be influenced by these two parameters (Table 1 and Table 2). Nevertheless, the influence of the two parameters could be more or less pronounced and differences between accumulation values measured at different exposure conditions are rarely significative (Table 3). In what follows, accumulation values of the most representative elements will be discussed. Concentration of Na in bags increases in the humid condition of exposure, both near and far from the source of contamination, while its content increases near the source of contamination, and in both cases differences between values are significative. Presence of this element is generally not linked to industrial activity, but rather to the lithology of the area and sea spray [26,27], so that its higher concentration values in the vicinities of the refinery in the present case study could be explained by the scarce vegetal coverage around the industrial plant and by the proximity of the sea. Concentration values of Mg, Zn, Ni, Cu, V and As increase near the refinery showing higher concentration values in the dry condition of exposure. As it concerns the origin of these elements (except Mg, a macro-element whose presence is linked to the influence of the sea [23]), it could be attributed to dry deposition of anthropogenic airborne pollutants, generally linked to industrial activity [20], that is intensively carried out in the monitored refinery and in similar industrial plants in the study area. As it concerns the year-by-year analysis of data (Figure 2a–j), this does not seem to point out any increasing or decreasing general trend in pollutants’ content during the analyzed time frame in the study area (only Fe content appears to decrease in the most recent years). The absence of any appreciable decreasing trend in accumulation data of the present study does not respect the decreasing trend depicted in the 2019 report on air quality by the EEA for As, Cd, Hg, Pb and Ni, though the EEA report refers to rural background measurements. Reported line charts also provide additional information about the influence of rainfall and distance on the accumulation of elements by H. cupressiforme moss bags. Finally, Table 5 shows how similar exposure condition (as it concerns rainfall and distance from the source of contamination) reduced dispersion of accumulation values in some of the analyzed elements. Coefficient of variation is a dimensionless measure of dispersion of data around the mean value, and in the present case study, it is possible to notice how similar ecological condition of exposure reduced dispersion of accumulation values of Na, Ca, Zn and Hg. This suggests that H. cupressiforme moss bags are more sensitive to the influence of the two parameters considered in the present study, as it concerns the accumulation of these elements, allowing for more accurate estimations of their presence if the ecological conditions of exposure are more uniform.

4.2. Ecological Factors Influencing Biomonitoring Results

H. cupressiforme is a moss commonly used as biomonitor [3,28,29,30,31,32,33], in the present study H. cupressiforme moss bags proved to be a very sensitive biomonitor to ecological features of the monitored area. The role of ecological conditions of exposure in the accumulation of airborne pollutants will be briefly discussed. High accumulation values of macro-elements (Table 1) must be attributed to the vicinity of the sea and to the lithology of the area. More precisely, high levels of Na and Mg could be explained by the deposition of sea salt and marine aerosol [23] transported inland from the sea (moss bags distance from the sea ranges from ~1 to ~15 kms) by the S-E-wind dominant in the area. Ca, Fe, K and Na are very common elements in Earth’s crust, so they can easily accumulate in moss bags via dry deposition of soil particulate matter. This form of deposition strongly contributes to the total concentration of elements in mosses, in fact elements originating from the soil readily accumulate in mosses [24], especially in arid regions with sparse vegetal coverage and exposed lithology [25], as is the study area. Reduced distances of bags by the source of contamination increase accumulation of pollutants in bags [1,9,26]. Table 1 and Table 2 also show that in the present case study, vicinity of the source of contamination causes an increase in concentration of the anthropogenic elements Zn, Ni, Cu, V and As, while background areas seem to be less concerned by the presence of these elements [20]. K and Hg accumulation values are not in line with this trend, showing higher concentration levels in bags positioned far from the industrial plant. Nevertheless, the reason for this could lie in the vicinity of the sea and in sea-salt cations, transported by marine aerosol competing with K and Hg [1,10,14] or in unexpected sources of contamination, increasing the content of these elements in bags positioned far from the refinery. Regarding the influence of precipitation in elements’ accumulation, Table 1 and Table 2 show how, in humid conditions of exposure (corresponding to autumn and spring in the studied area), concentration of Na, K and Hg in bags increase when compared to the dry conditions of exposure (summer). This was expected as wet deposition is highly responsible for the accumulation of pollutants in mosses [9] and in several studies pollutants’ accumulation in moss bags increased during humid conditions of exposure [18]. Exceptions to this general rule emerge in the present study in Ca, Mg, Zn, Ni, Cu, V and As. In fact, these elements reached higher accumulation values in the biomonitor during the dry period of the year, likely via dry deposition, though differences between accumulation values measured in dry and humid periods of the year are rarely significative. As this study concerns the influence of anthropic activity on airborne pollutants present in the area, element contents in bags appear to be influenced not only by the activity of the refinery, but also by construction works. More precisely, line charts point out a peak in dry deposition after 2010 in almost all the monitored trace elements. The explanation for this peak in pollutant content after 2010 could be the start of construction works of a great dam in the vicinity of the study area, that probably led to the mobilization of a great amount of particulate, that likely influenced trace elements’ content in bags. Table 4 quantifies the variation in accumulation values before and after 2010 in some of the most representative elements. In this case study, H. cupressiforme moss bags provided stable accumulation values during the analyzed time frame, as cv values reported in Table 5 appear to be sufficiently low, considering the feature of the study. In Table 5, it is also possible to observe that values measured in similar conditions of exposure are less dispersed, showing the influence of ecological parameters in the features of pollutants accumulation values in the biomonitor [1,9,18]. This study analyses a subset of data resulting from an ongoing technical survey, in which the moss bag technique has been normally used since the early 1990s as a tool to assess air quality in the surroundings of an oil refinery. The application of this approach, also in a technical, industrial field, confirms the validity of this biomonitoring technique as it is cost-effective and permits prolonged and highly spatially and temporally detailed assessments. Nevertheless, the influences of ecological parameters such as rainfall, lithology and the proximity of the sea emerge clearly from the analysis of bag element content, underlining how this approach in biomonitoring of airborne pollutants needs a carefully planned experimental design and a critical evaluation of results on the basis of the ecological context.

5. Conclusions

The moss bag technique is known to be a valid biomonitoring approach, in this case study, the reliability of this approach in the long-term monitoring of airborne pollutants has been proven by the low level of variation of accumulation values measured in the monitored time frame. Nevertheless, analysis of data demonstrate that bags were able to register environmental episodes that occurred during the biomonitoring campaign (e.g., construction works in the study area), and that accumulation values are affected by ecological factors such as the presence of the sea, underlining the importance of a critical approach in interpreting accumulation data, and their relation with ecological conditions of exposure. With that said, it is possible to consider the integration of the moss bag technique in the quantitative and qualitative characterization of airborne pollutants presence in contexts strongly influenced by human activity, such as industrial plants, cities, airports and similar, in order to guarantee time and spatial extensive, and low-priced monitoring of the presence of pollutants and the impacts on nature, in combination with other measurements achieved by more high-tech monitoring devices.

Author Contributions

Conceptualization, A.D.A., P.C. and A.C.; methodology, A.C. and P.C.; software, A.D.A. and P.C.; validation, A.C. and P.C.; formal analysis, P.C. and A.C.; investigation, A.D.A., P.C. and A.C.; resources, A.C.; data curation, A.D.A. and P.C.; writing—original draft preparation, A.D.A.; writing—review and editing, P.C. and A.C.; visualization, A.D.A.; supervision, A.C.; project administration, A.C. and P.C.; funding acquisition, A.C. All authors have read and agreed to the published version of the manuscript.

Acknowledgments

The authors are grateful to SARLUX S.r.l. for the concession of the data and to SARTEC S.r.l. for the chemical analysis.

Conflicts of Interest

The authors declare no conflict of interest.

References

  1. Wolterbeek, B. Biomonitoring of trace element air pollution: Principles, possibilities and perspectives. Environ. Pollut. 2002, 120, 11–21. [Google Scholar] [CrossRef]
  2. Arnold, S.M.; Angerer, j.; Boogard, P.J.; Hughes, M.F.; O’Lone, R.B.; Robinson, S.H.; Schnatter, A.R. The use of biomonitoring data in exposure and human health risk assessment: Benzene case study. Crit. Rev. Toxicol. 2013, 43, 119–153. [Google Scholar] [CrossRef] [Green Version]
  3. Cortis, P.; Vannini, C.; Cogoni, A.; De Mattia, F.; Bracale, M.; Mezzasalma, V.; Labra, M. Chemical, molecular, and proteomic analyses of moss bag biomonitoring in a petrochemical area of Sardinia (Italy). Environ. Sci. Pollut. Res. 2016, 23, 2288–2300. [Google Scholar] [CrossRef] [PubMed]
  4. Pleil, J.D.; Williams, M.A.; Sobus, J.R. Chemical safety for sustainability (CSS): Human in vivo biomonitoring data for complementing results from in vitro toxicology—A commentary. Toxicol. Lett. 2012, 215, 201–207. [Google Scholar] [CrossRef] [PubMed]
  5. Beelen, R.; Raaschou-Nielsen, O.; Stafoggia, M.; Andersen, Z.J.; Weinmayr, G.; Hoffmann, B. Effects of long-term exposure to air pollution on natural-cause mortality: An analysis of 22 European cohorts within the multicentre ESCAPE project. Lancet 2014, 383, 785–795. [Google Scholar] [CrossRef]
  6. MacIntyre, W.H.; Harden, L.J.; Hester, W. Measurement of atmospheric fluorine. Ind. Eng. Chem. 1952, 44, 1365–1370. [Google Scholar]
  7. Thomas, W.; Herrmann, R. Nachweis von Chlorpestiziden, PCB, PCA und Schwermetallen mittels epiphytischer Moose als Biofilter entlang eines Profils durch Mitteleuropa. Staub Reinhalt. Luft. 1972, 40, 440–444. [Google Scholar]
  8. Gonzalez, A.G.; Pokrovsky, O.S. Metal adsorption on mosses: Toward a universal adsorption model. J. Colloid Interface Sci. 2014, 415, 169–178. [Google Scholar] [CrossRef] [Green Version]
  9. Chakrabortty, S.; Paratkar, G.T. Biomonitoring of trace element air pollution using mosses. Aerosol Air Qual. Res. 2006, 3, 247–258. [Google Scholar] [CrossRef] [Green Version]
  10. Berg, T.; Røyset, O.; Steinnes, E. Moss Hylocomium splendens used as biomonitor of atmospheric trace element deposition: Estimation of uptake efficiencies. Atmos. Environ. 1995, 29, 353–360. [Google Scholar] [CrossRef]
  11. Zeichmeister, H.G.; Hohenwallner, D.; Riss, A.; Hanus-Illnar, A. Variation in heavy metal concentrations in the moss species Abietinella abietina (Hedw.) Fleisch according to sampling time, within site variability and increase in biomass. Sci. Total. Environ. 2003, 301, 55–65. [Google Scholar] [CrossRef]
  12. Cauto, J.A.; Fernandez, J.; Aboal, J.R.; Carballeira, A. Active biomonitoring of element uptake with terrestrial mosses: A comparison of bulk and dry deposition. Sci. Total Environ. 2004, 324, 211–222. [Google Scholar] [CrossRef] [PubMed]
  13. De Caritat, P.; Reimann, C.; Bogatyrev, I.; Chekuskin, V.; Finne, T.E.; Halleraker, J.H.; Kashulina, G.; Niskavaara, H.; Pavlov, V. Regional distribution of Al, B, Ba, Ca, K, La, Mg, Mn, Na, P, Rb, Si, Sr, Th, U and Y in terrestrial moss within a 188,000 km2 area of the central Barents region: Influence of geology, seaspray, and human activity. Appl. Geochem. 2001, 16, 137–159. [Google Scholar] [CrossRef]
  14. Berg, T.; Steinnes, E. Use of Mosses (Hylocomium splendens and Pleurozium schreberi) as biomonitors of heavy metal deposition: From relative to absolute deposition values. Environ. Pollut. 1997, 98, 61–71. [Google Scholar] [CrossRef]
  15. Gjengedal, E.; Steinnes, E. Uptake of metal ions in moss from artificial precipitation. Environ. Monit. Assess. 1990, 14, 77–87. [Google Scholar] [CrossRef]
  16. Brown, D.H.; Beckett, R.P. Differential sensitivity of lichens to heavy metals. Ann. Bot. 1983, 52, 51–57. [Google Scholar] [CrossRef]
  17. Seaward, M.R.D. The use and abuse of heavy metal bioassays of lichens for environmental monitoring. In Proceedings of the 3rd International Conference of Bioindicators, Deteriorisations Regionis, Liblice, Czechoslovakia, 12–16 September 1977; Academia: Praha, Czech Republic, 1980; pp. 375–384. [Google Scholar]
  18. Ares, A.; Aboal, J.R.; Carballeira, A.; Giordano, S.; Adamo, P.; Fernández, J.A. Moss bag biomonitoring: A methodological review. Sci. Total. Environ. 2012, 432, 143–158. [Google Scholar] [CrossRef]
  19. Castello, M.; Cenci, R.M.; Gerdol, R. Proposte metodologiche per l’uso di briofite come bioaccumulatori di metalli in traccia. In Proceedings of the Biomonitoraggio della Qualità dell’Aria sul Territorio Nazionale, Roma, Italy, 26–27 November 1998; Volume 2, pp. 233–240. [Google Scholar]
  20. Capozzi, F.; Giordano, S.; Aboal, J.R.; Adamo, P.; Bargagli, R.; Boquete, T.; Di Palma, A.; Real, C.; Reski, R.; Spagnuolo, V.; et al. Best options for the exposure of traditional and innovative moss bags: A systematic evaluation in three European countries. Environ. Pollut. 2016, 214, 362–373. [Google Scholar] [CrossRef]
  21. Bacchetta, G. Flora vascolare del Sulcis (Sardegna Sud-Occidentale, Italia); Universidad del País Vasco: Leioa, Spain, 2006; pp. 27–29. [Google Scholar]
  22. R Core Team. A Language and Environment for Statistical Computing; R Foundation for Statistical Computing: Vienna, Austria, 2019. [Google Scholar]
  23. Ares, A.; Fernández, J.A.; Aboal, J.R.; Carballeira, A. Study of the air quality in industrial areas of Santa Cruz de Tenerife (Spain) by active biomonitoring with Pseudoscleropodium purum. Ecotoxicol. Environ. Saf. 2011, 74, 533–541. [Google Scholar] [CrossRef]
  24. Uyar, G.; Elif, A.; Ören, M.; Karaca, F.; Öncel, M.S. Determination of heavy metal pollution in Zonguldak (Turkey) by moss analysis (Hypnum cupressiforme). Environ. Eng. Sci. 2009, 26, 183–194. [Google Scholar] [CrossRef]
  25. European Environment Agency. Air Quality in Europe—2019 Report; Publications Office of the European Union: Luxembourg, 2019; ISSN 1977-8449.
  26. Mäkinen, A. Biomonitoring of atmospheric deposition in the Kola peninsula (Russia) and Finnish Lapland, based on the chemical analysis of mosses. Minist. Environ. Rapp. 1994, 4, 1–83. [Google Scholar]
  27. Loppi, S.; Bonini, I. Lichens and mosses as biomonitors of trace elements in areas with thermal springs and fumarole activity (Mt. Amiata, central Italy). Chemosphere 2000, 41, 1333–1336. [Google Scholar] [CrossRef]
  28. Adamo, P.; Giordano, S.; Sforza, A.; Bargagli, R. Implementation of airborne trace element monitoring with devitalised transplants of Hypnum cupressiforme Hedw.: Assessment of temporal trends and element contribution by vehicular traffic in Naples city. Environ. Pollut. 2011, 159, 1620–1628. [Google Scholar] [PubMed]
  29. Giordano, S.; Adamo, P.; Monaci, F.; Pittao, E.; Tretiach, M.; Bargagli, R. Bags with oven-dried moss for the active monitoring of airborne trace elements in urban areas. Environ. Pollut. 2009, 157, 2798–2805. [Google Scholar] [CrossRef] [PubMed]
  30. Capozzi, F.; Giordano, S.; Di Palma, A.; Spagnuolo, V.; De Nicola, F.; Adamo, P. Biomonitoring of atmospheric pollution by moss bags: Discriminating urban-rural structure in a fragmented landscape. Chemosphere 2016, 149, 211–218. [Google Scholar] [CrossRef] [PubMed]
  31. Clough, W.S. The deposition of particles on moss and grass surface. Atmos. Environ. 1975, 9, 1113–1119. [Google Scholar] [CrossRef]
  32. Ötvös, E.; Kozák, I.O.; Fekete, J.; Sharma, V.K.; Tuba, Z. Atmospheric deposition of polycyclic aromatic hydrocarbons (PAHs) in mosses (Hypnum cupressiforme) in Hungary. Sci. Total Environ. 2004, 330, 89–99. [Google Scholar] [CrossRef]
  33. Tretiach, M.; Pittao, E.; Crisafulli, P.; Adamo, P. Influence of exposure sites on trace element enrichment in moss-bags and characterization of particles deposited on the biomonitor surface. Sci. Total. Environ. 2011, 409, 822–830. [Google Scholar] [CrossRef]
Figure 1. (a). The study area. (b). The oil refinery is represented by the crossed hammers. Black and white marks indicate exposure sites near and far from the source of contamination.
Atmosphere 11 00272 g001
Figure 2. In graphs 2(a)–(d), values measured near and far the source of contamination are represented by a black-dashed line and by a grey-continuous line, respectively. In graphs 2(e)–(j), values measured in the dry and in the humid exposure conditions are represented by a black-dashed line and by a grey-continuous line, respectively. Statistical significance of differences between compared sets of data (Wilcoxon test p-values, significance level alfa at 0.05) are reported as asterisks. (*, p-value less than 0.05; **, p-value less than 0.01; ***, p-value less than 0.001)
Atmosphere 11 00272 g002aAtmosphere 11 00272 g002bAtmosphere 11 00272 g002cAtmosphere 11 00272 g002d
Table 1. Element content (mg kg−1) in moss bags. Data reported as mean values +/− standard error.
Exposure
Condition
[Na]+/− SE[Ca]+/− SE[Fe]+/− SE[Mg]+/− SE[K]+/− SE
NearHumid2138.19395.37589.7593.36475.6661.27312.4141.79171.3743.51
Dry966.11164.581518.07302.07405.3767.29340.5267.97148.0451.62
FarHumid1362.78229.02707.4491.05420.4550.38287.9434.31222.9543.52
Dry550.4267.971215.39208.88486.4352.43297.4149.29171.3759.67
Table 2. Element content (mg kg−1) in moss bags. Data reported as mean values +/− standard error.
Exposure Condition[Zn]+/− SE[Pb]+/− SE[Ni]+/− SE[Cu]+/− SE[V]+/− SE[Cr]+/− SE[As]+/− SE[Cd]+/− SE[Hg]+/− SE
NearHumid12.251.663.230.472.321.311.970.411.710.160.880.110.130.020.050.010.040.02
Dry16.583.683.430.995.053.092.660.662.240.401.390.450.150.030.080.020.010.003
FarHumid5.400.614.260.760.910.101.690.271.110.111.010.140.100.030.060.010.060.03
Dry6.601.001.630.254.881.631.810.361.720.310.820.250.130.020.050.010.030.01
Table 3. Statistical significance between compared sets of values assessed by Mann–Whitney U test. Data reported as p-values (significance level alfa at 0.05).
NaCaFeMgKZnPbNiCuVCrAsCdHg
Near humid vs. Near dry0.0080.140.450.320.820.50.720.360.550.570.90.70.130.07
Far humid vs. Far dry0.0090.840.060.680.260.960.050.490.850.280.040.060.080.8
Near humid vs. Far humid0.0030.330.20.340.63>0.0010.990.210.320.0030.970.140.90.67
Near dry vs. Far dry0.060.840.230.80.150.0030.230.270.330.080.230.930.950.08
Table 4. Accumulation data (mg kg−1) measured before and after the start of the construction works (2010). Data are reported as mean values. Statistical significance of differences between compared sets of data are reported as Wilcoxon test p-values (significance level alfa at 0.05).
Na+/− SECa+/− SEPb+/− SENi+/− SE
Before 2010842.3883.59811.46107.802.230.581.123.66
After 20101691.11231.42929.90100.834.080.213.661.12
p-value0.10 0.93 0.35 0.01
Table 5. Coefficients of variation calculated on the totality of accumulation data (cv total) and on data measured in same condition of exposure (humid, dry, near, far).
Exposure
Condition
[Na][Ca][Fe][Mg][K][Zn][Pb][Ni][Cu][V][Cr][As][Cd][Hg]
cv total189.84146.38116.32125.86210.02151.23191.52427.49176.30120.09182.31212.27159.32610.67
NearHumid169.47141.59118.06119.63227.09124.19134.40516.71190.4785.75118.21190.79115.12487.03
Dry110.40125.85107.58126.25220.52144.06187.43396.48160.59117.07209.87146.62205.47324.13
FarHumid187.89140.39133.96129.98212.93125.95200.60125.97177.69107.01160.27297.24141.73596.59
Dry98.79133.1386.23128.37198.97121.40121.32266.89159.67146.41239.93143.14154.08289.70

