Article

Characterization of Total OH Reactivity in a Rapeseed Field: Results from the COV3ER Experiment in April 2017

1
Laboratoire des Sciences du Climat et de l’Environnement, LSCE, UMR CNRS-CEA-UVSQ, IPSL, 91191 Gif-sur-Yvette, Île-de-France, France
2
National Research Institute for Agriculture, Food and the Environment, INRAe, UMR INRAe-AgroParisTech, Paris Saclay University, Route de la Ferme, 78850 Thiverval-Grignon, France
3
Faculty of Sciences, University of Paris, 75013 Paris, France
4
Now: Max-Planck Institute for Chemistry, Hahn-Meitner-Weg 1, 55128 Mainz, Germany
5
Now: Department of Chemistry and Environmental Research Institute, University College Cork, T12 YN60 Cork, Ireland
*
Authors to whom correspondence should be addressed.
Atmosphere 2020, 11(3), 261; https://doi.org/10.3390/atmos11030261
Submission received: 18 January 2020 / Revised: 26 February 2020 / Accepted: 28 February 2020 / Published: 5 March 2020
(This article belongs to the Special Issue Atmospheric Volatile Organic Compounds (VOCs))

Abstract

:
Croplands remain poorly studied ecosystems in terms of total hydroxyl radical (OH) reactivity, especially when compared to forests. As part of the COV3ER project, total OH reactivity (ROH), defined as the total loss rate of OH due to its reaction with reactive species in the atmosphere, was characterized in a rapeseed field (Grignon, France) during the blooming season in April 2017. Measurements were performed in a dynamic chamber as well as in ambient air using the Comparative Reactivity Method (CRM). Complementary measurements of organic (including a proton transfer reaction quadrupole ion–time of flight mass spectrometry, PTRQi-ToFMS) and inorganic compounds were also performed in order to calculate the expected OH reactivity and evaluate the missing fraction. Measured ROH varied diurnally in the dynamic chamber (mROHchamber) with maxima around 20 to 30 s−1 at midday and minima during dark hours, following the variability of the enclosed branch VOCsrapeseed, which is light- and temperature-dependent. Oxygenated VOCs were the major compounds emitted by the rapeseed crop. However, in terms of contribution to OH reactivity, isoprene accounted for 40% during the daytime, followed by acetaldehyde (21%) and monoterpenes (18%). The comparison between mROHchamber and calculated ROH (cROHchamber) exhibited little or no difference during dark hours, whereas a maximum difference appeared around midday, highlighting a significant missing fraction (46% on average during daytime) mainly related to biogenic temperature- and/or light-dependent emissions.

1. Introduction

Up to 104–105 of different organic species have been identified so far in the Earth’s atmosphere and this figure may only represent a small fraction of the total number actually present [1]. They arise from anthropogenic and natural sources, the latter emissions being dominant (90%) on the global scale [2]. Once emitted in the atmosphere, volatile organic compounds (VOCs) are transformed by photochemical processes, leading to the formation of harmful secondary pollutants such as ozone (O3) and secondary organic aerosols (SOAs), which have serious impact on human health and the environment. The major depletion route of atmospheric VOCs is via reaction with OH radicals, representing the main tropospheric oxidant during the daytime [3].
Natural sources of VOCs include forests, agricultural lands, grasslands, shrubs, biomass burning and oceans [4]. They are involved in growth, reproduction and defense mechanisms of the plant and they play an important role in allelopathic interactions, defined as chemically induced interactions between plants or fungi [5,6]. It has been reported that biogenic VOCs’ (BVOCs) chemical composition and emission rates are linked to internal factors in the plant like genetics and biochemical processes. They can be affected by abiotic and biotic external factors such as temperature, radiation, water availability and interactions with other living species [7,8]. Biogenic VOCs exhibit a large chemical diversity. They include terpenoids, which are dominant in the global atmosphere (isoprene, monoterpenes, sesquiterpenes, etc.), oxygenated VOCs (OVOCs such as methanol, acetone, acetaldehyde, formaldehyde, etc.) and other classes such as sulfur- and nitrogen-containing compounds, organic halides, alkanes and alkenes [9]. All these compounds represent a strong potential sink for atmospheric oxidants and hence to the hydroxyl radical.
One way to characterize the overall sink of OH in a given environment and to evaluate the importance of atmospheric photochemistry is to measure total OH reactivity. Total OH reactivity is defined as the total loss rate of OH, which is the inverse of OH lifetime (s−1). It represents the sum of the reaction frequencies with OH of all chemicals, calculated as the product of each compound concentration by the compound rate coefficient of reaction with OH [10]. Measurements of total OH reactivity have been performed using Laser Induced Fluorescence systems (pump-and-probe or flow reactor) and the Comparative Reactivity Method (CRM) using a Proton-Transfer-Reaction Mass Spectrometer (PTR-MS) as a detector or a fast Gas-Chromatographic/Photo-Ionization Detector, each system exhibiting advantages and limitations [11]. Total OH reactivity proved to be an effective parameter for quantifying the contribution of VOCs to atmospheric chemistry in various environments. However, the comparison between the measured and the calculated OH reactivity from measured species often revealed differences, showing that there are still some unidentified or unquantified OH sinks [12].
Since the 1960s, the focus was mainly made on BVOC emissions from forests, and little interest was shown for BVOC emissions from agriculture [9]. Karl et al. (2009) [13] introduced a new plant-specific emission inventory where they showed that, on the Pan-Europe scale, agriculture contributes up to 27% to total BVOC emissions. These emissions are dominated by OVOCs (65%), followed by monoterpenes (26%) and isoprene (7%). However, they also reported a lack of experimental data on terpenes, sesquiterpenes and oxygenated VOCs, especially from crops, leading to higher uncertainties on BVOC emission estimates from agriculture included in inventories. Similarly, in terms of OH reactivity, most of the studies conducted in natural ecosystems were in forested areas. Only two took place in suburban areas, near agricultural lands [14,15] where different observations were reported. Ren et al. (2005) [14] found a mean OH reactivity of 6.1 s−1, with little diurnal variation, in an agricultural research farm in Pennsylvania, US, between May and June. Lou et al. (2010) [15] described a diurnal cycle of OH reactivity in a regional background site surrounded by farmlands in the Pearl River Delta, China, during summer, with a mean maximum of 50 s−1 at dawn dominated by anthropogenic emissions and a mean minimum of 20 s−1 at noon, more influenced by local biogenic emissions. These differences highlighted the need to better characterize the OH reactivity in rural environments, in which BVOC emissions can add a significant contribution of photochemical pollution due to the surrounding abiotic VOC emissions [16]. In particular, assessment of the OH reactivity at the branch scale, using dynamic chambers, would be a relevant approach to improve our understanding of the photochemical impacts of agriculture. So far, two studies have investigated OH reactivity using dynamic branch enclosures [17,18]. The first one, conducted by Kim et al. (2011) [17] on four different tree species (red oak, white pine, beech and red maple) and the second by Nolscher et al. (2013) [18] on Norway spruce trees studying total OH reactivity emission rates (TOHRE). No study was found on OH reactivity from a crop dynamic chamber.
Agricultural lands occupy around 37% of land use worldwide [19]. With the increase in global human population (10.2 billion by the year 2100), the increased demand for food and nutrition would require an additional ≈2 billion hectares of cropland [20]. Furthermore, in order to meet the increasing need of energy in the modern society, biofuels from plants appear to be an important mitigation strategy for the impact of fossil fuels on the environment [21]. Thus, a new era of agriculture is encouraging the cultivation of biofuel-producing crops such as soybean, corn and rapeseed. Oilseed rape or rapeseed (Brassica napus) is one of the main oil and protein-producing plants grown in Europe [22,23]. It represents up to 69% of oleaginous crops and 14% of total agricultural area of cereals-, oil- and protein-producing crops in France [24]. The rapeseed flowering period is considered as a period of high photochemical activity, especially on clear days where the light yellow surface of the crop reflects the sunlight, increasing the radiation density and leading to the emission of various amounts of BVOCs [25]. Some studies have reported that oilseed growing can also be responsible for allergic effects especially at the mid-flowering stage of development [23,26]. Previous studies investigated the variety and amount of BVOCs emitted by the spring rapeseed, showing that OVOCs and monoterpenes were the main emitted compounds. Gonzaga Gomez et al. (2019) [27] found methanol to be the most emitted compound, whereas McEwan and Macfarlane Smith (1998) [23] reported high levels of monoterpenes from spring rapeseed, with limonene exhibiting the highest concentration, followed by β-myrcene and sabinene. In light of all these observations, a better characterization of BVOCs and their contribution to OH reactivity in croplands, among which are rapeseed fields, is of great importance.
This study aims to investigate BVOCs and their total OH reactivity on a rapeseed crop level in a typical agricultural ecosystem, based on CRM/PTR-MS. A dynamic chamber was installed in April 2017 on a healthy, initially non-flowered rapeseed plant to perform measurements during the blooming period. In parallel, VOCs were also sampled in the incoming and the outgoing chamber air using a proton transfer reaction–quadrupole ion–time of flight–mass spectrometry (PTRQi-ToFMS). An expected OH reactivity was calculated from PTRQi-ToFMS data and other complementary measurements of organic and inorganic compounds. Thereby, it was possible to estimate the amount of a potential missing OH reactivity and to discuss its possible sources on a diel basis.

2. Experiments

2.1. Field Site Description

As part of the ADEME-COV3ER project (Biogenic Volatile Organic Compounds: Emissions by managed ecosystems), a field campaign was conducted from the 7th to the 25th of April 2017. The ICOS FR-Gri measurement site (Figure 1) is a 19 ha field belonging to the AgroParisTech experimental farm of Grignon (48°51′ N, 1°58′ E), located about 30 km west from Paris, France. The usual crop rotation at the field site is winter wheat, silage maize, winter barley, with only one former occasional occurrence of rapeseed in 2013. From the south, the east, the north-west and the south-west, the site is surrounded by roads with substantial traffic (5000 to 15,000 vehicles per day, 2010 counts, Statistiques du département des Yvelines pour 2010). From the north, the south and the east, other agricultural lands surround the site. The small (1100 inhabitants, Insee 2015) village of Grignon is located around 700 m west of the measurement site, and an animal farm (more than 200 cows and 1000 sheeps) is situated 400 m to the south-west. The main wind directions are north-west during clear days and south-west during cloudy and rainy days [28,29,30]. Rapeseed was sown on 16 August 2016, with a density of 460 000 plants/ha. The canopy height was around 134 cm.

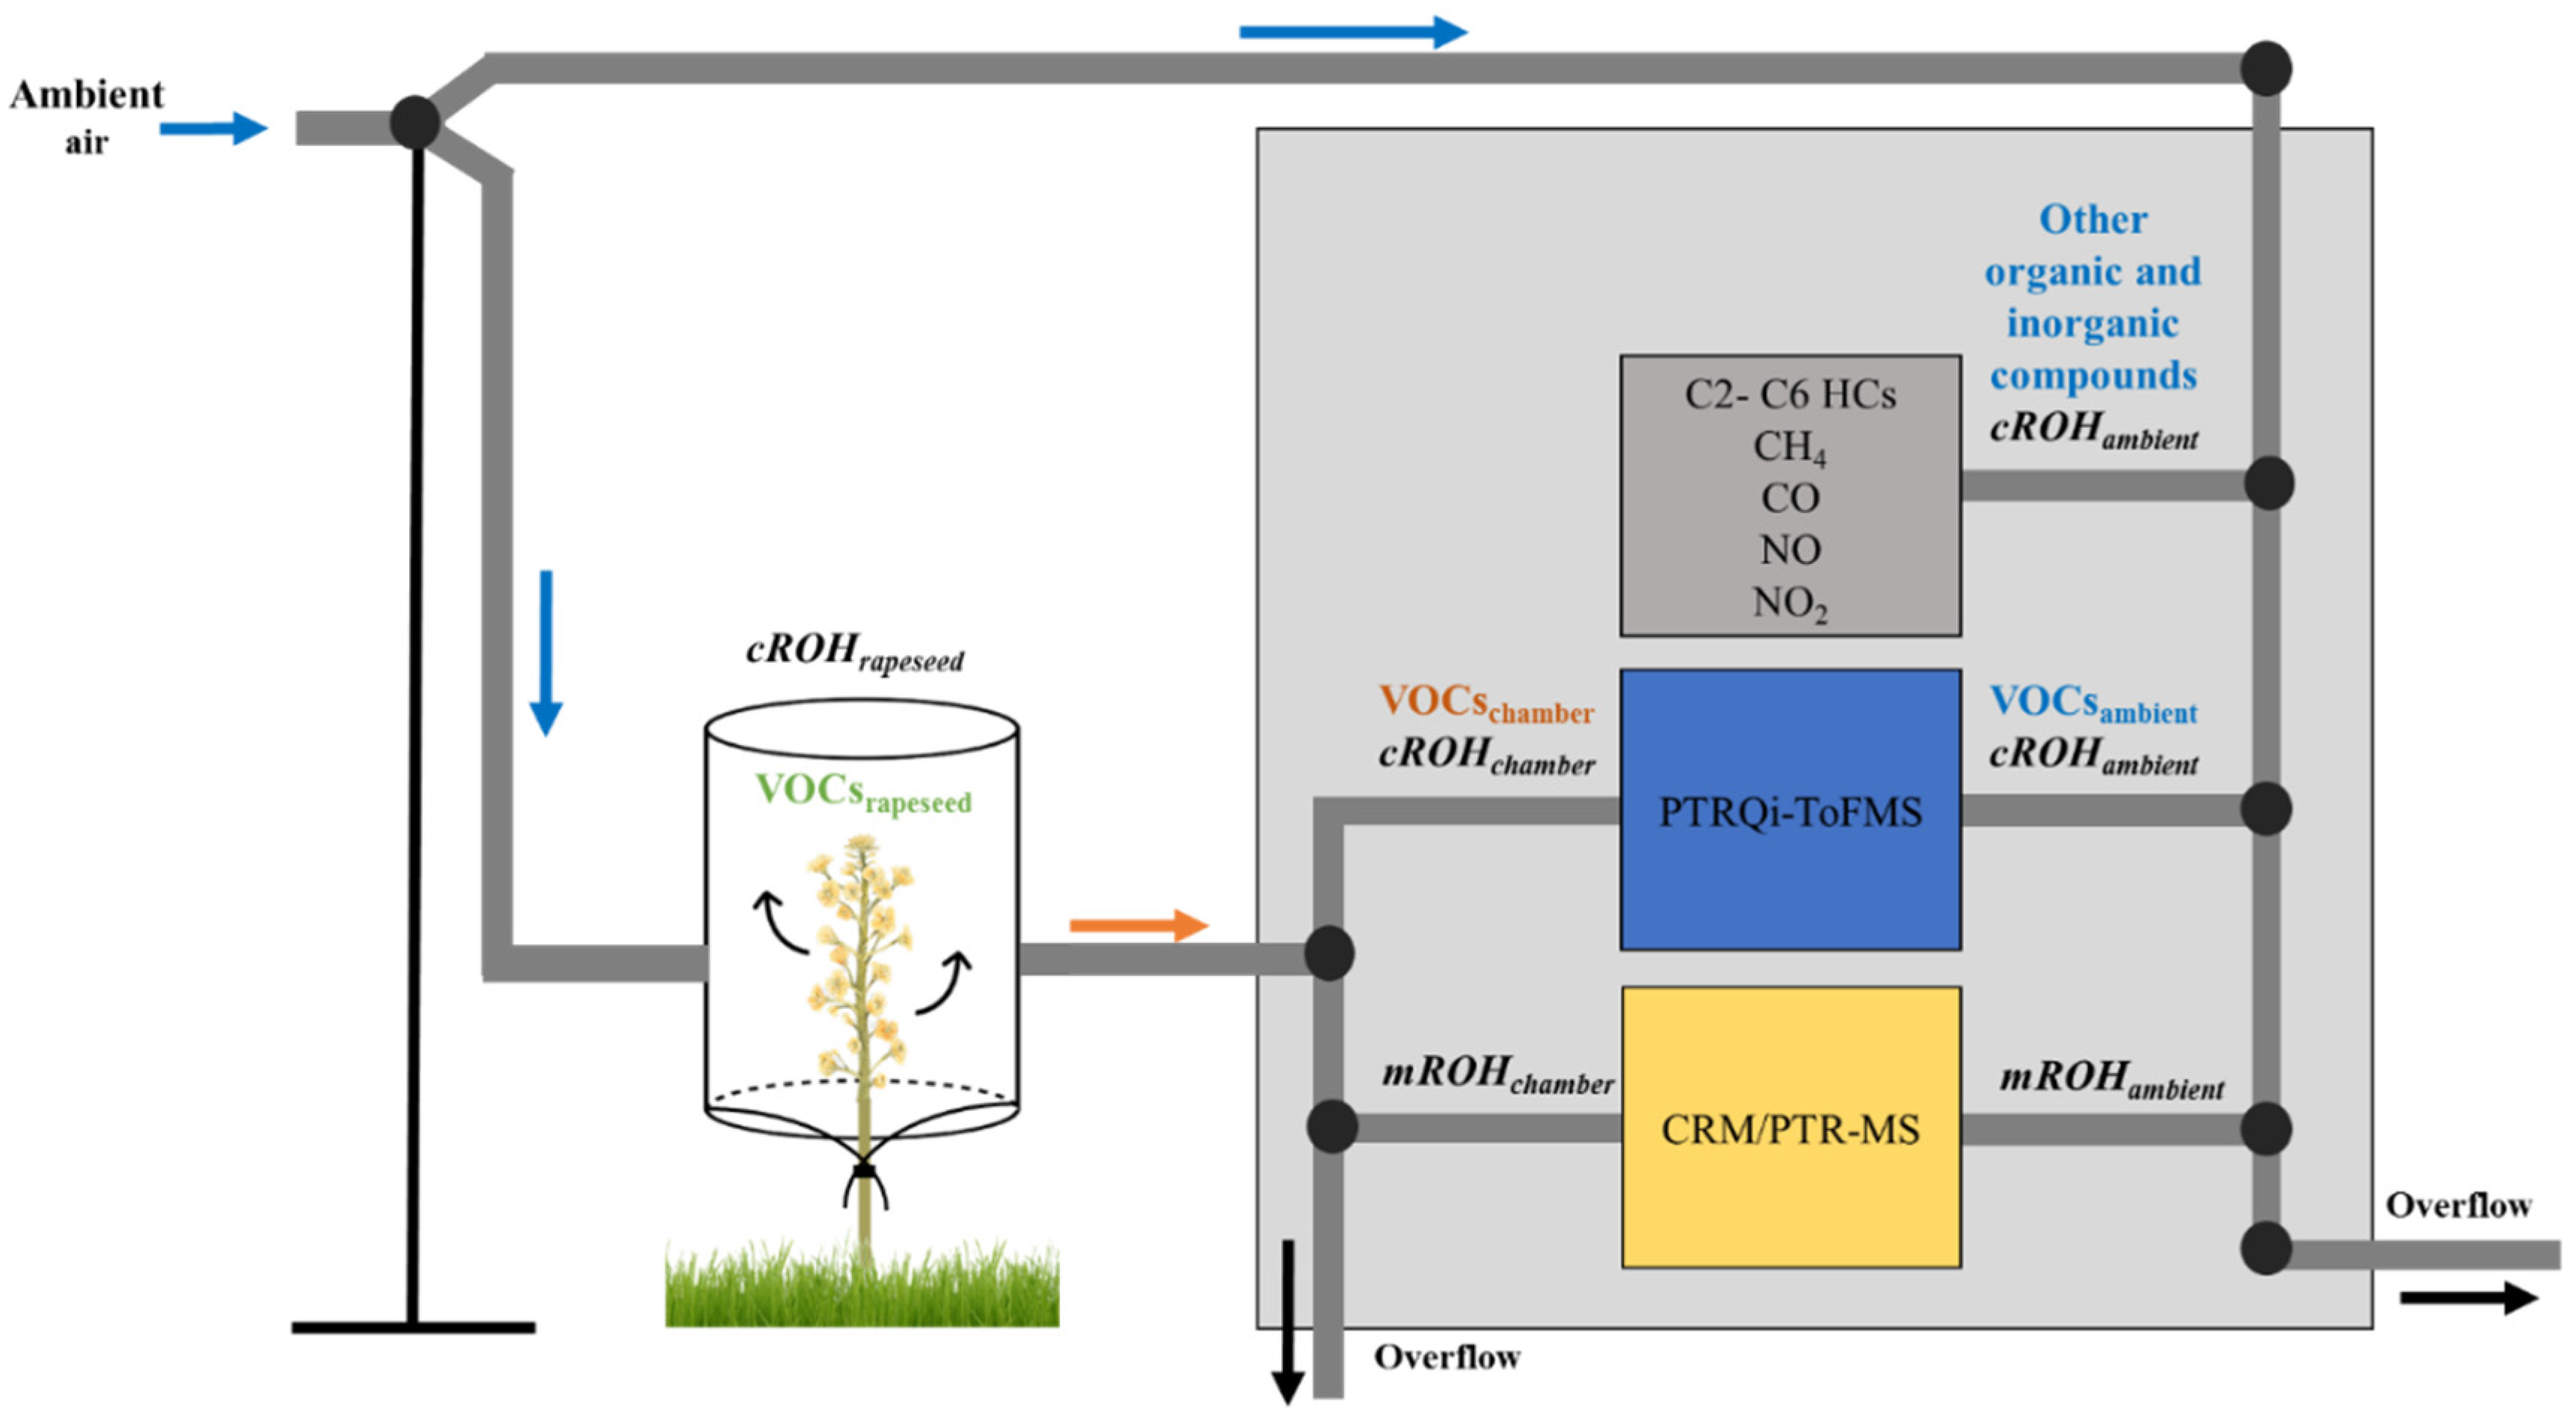
2.2. Plant Dynamic Chamber and Air Sampling

In order to determine the chemical nature and the concentration of BVOCs emitted from a rapeseed plant as well as their OH reactivity, a young, healthy, non-flowered rapeseed plant (Brassica napus) was selected for the installation of an enclosure system (a dynamic chamber) from which the measurements were made. The enclosure system was a 60 L polytetrafluoroethylene (PTFE) cylindrical frame bounded by a sealed 50 μm thick PTFE film to which ambient air was introduced at 15 L min−1 using a PTFE-coated diaphragm pump, leading to a residence time of about 4 min. Ambient air was chosen instead of zero air, in order to measure BVOC and OH reactivity at the crop level, under in situ conditions, without altering potential plant interaction with ambient air species. Furthermore, the introduction of ambient air is useful to track not only plant emissions, but also the deposition of compounds present in the atmosphere. A rapid mixing of the chamber air and a slight overpressure were ensured using a PTFE fan. Temperature (T °C), photosynthetic active radiation (PAR μmol m−2 s−1), relative humidity (RH %), carbon dioxide (CO2 µmol mol−1) and water vapor (H2O mmol mol−1) were continuously monitored inside the chamber. For more details about the enclosure system refer to Genard-Zielinski et al. (2015) [31].

2.3. Meteorological Measurements

Measurements of meteorological variables were carried out at the FR-Gri ICOS site, according to the ICOS standard protocols [32]. They include two profiles of air temperature and relative humidity (measurement heights at 1, 2.7 and 5 m) and wind speed/direction (measurement heights at 0.5, 1, 2, 3 and 5 m), radiation measurements (short- and long-wave incoming and reflected radiation, photosynthetically active radiation, albedo), soil temperature and humidity profiles from the surface down to 90 cm, and soil surface heat flux. The data were acquired continuously with dataloggers (Campbell Inc., USA) at rates from 20 s to 1 min, quality-checked and post-processed to get half-hourly averages. All sensors were regularly maintained and calibrated to ensure good quality data.

2.4. Instrumentation

2.4.1. Comparative Reactivity Method (CRM) and Instrument Performance

Total OH reactivity measurements were performed using the CRM, first developed and described by Sinha et al. (2008) [33]. This technique relies on quantifying the competition between a reference molecule (pyrrole C4H5N) and ambient reactive species to react with in situ generated OH radicals. The whole experiment can be summarized in three main analytical steps: pyrrole, which is not normally present in ambient air, is introduced with dry zero air and dry nitrogen, in a glass reactor. The latter is equipped with a UV mercury lamp and connected to a detector which in our case is a proton transfer reaction–quadrupole–mass spectrometer (PTR-MS). During this first step, no OH radicals are generated due to dry conditions in the system. The pyrrole concentration is monitored at the protonated m/z 68 as C1 which corresponds to the initial concentration of pyrrole available in the reactor after potential photolysis. Then, dry N2 is humidified and dry zero air is replaced by humid zero air (generated from ambient air going through a catalytic converter) in order to generate OH radicals by H2O photolysis under the 184.9 nm wavelength emitted by the lamp. Pyrrole concentration at this stage is C2, lower than C1, due to its reaction with OH. The third and final step consists of introducing ambient air instead of humid zero air. The various species present in ambient air compete with pyrrole for the available OH, leading to an increase in pyrrole concentration measured as C3. Measurements of C1, C2 and C3 allow determining the OH reactivity of the sampled air in a quantitative manner where the difference between C2 and C3 is dependent on the amount and reactivity of VOC present in the sampled air. Total OH reactivity is derived from Equation (1), where it is assumed that pyrrole reacts with OH following the pseudo-first-order kinetical regime i.e., [Pyrrole] >> [OH]:
R OH   =   ( C 3 C 2 ) ( C 1 C 3 )   kp   C 1
with kp the reaction rate of pyrrole with OH (1.2 × 10⁻¹⁰ cm3 molecule−1 s−1 [34]).
However, three main measurement artifacts can occur while operating the CRM, for which corrections should be applied on OH reactivity raw values: (1) changes in the relative humidity within the setup between zero air (C2) and ambient air (C3), leading to different OH levels, (2) recycling of OH in the presence of nitrogen oxide (NO) due to the NO + HO2 reaction and (3) deviation from pseudo-first-order kinetics. In some CRM systems, corrections for potential NO2 and/or O3 artifacts are also considered [35,36]. An additional correction is applied due to the dilution of ambient air inside the reactor by N2 and pyrrole flows.
CRM/PTR-MS System Characterization
In order to assess the performance of the instrument and to apply adequate corrections on OH reactivity raw data, a set of tests have been performed throughout the field campaign (see S1). The PTR-MS (Ionicon Analytik GmbH, Innsbruck, Austria) was calibrated at the beginning and the end of the campaign showing a good stability in dry and wet conditions. The photolysis rate ( C 0 C 1 ) C 0 (with C0 being the pyrrole level in dry conditions before switching on the UV mercury lamp) was determined to be around 6% since pyrrole can absorb at some of the wavelengths emitted by the UV mercury lamp. On average, C1 was 70.5 ± 0.3 ppbv for the measurement period presented herein.
Even though a catalytic converter was used to generate humid zero air from ambient air, small differences in humidity are still observed between ambient and zero air. These changes can influence the level of OH radicals between C2 and C3, leading to an artifact in the C2 measurement. Therefore, six humidity tests were done, measuring the change in C2 (ΔC2) with the change of RH, tracked using the variation in the m/z 37-to-m/z 19 ratio (Δ [m/z 37-to-m/z 19 ratios]) (with m/z 37 being H3O+·H2O the first water cluster and m/z 19 being H3O+, the number of primary ions and their ratio being proportional to the absolute humidity inside the reactor). These tests, performed on incoming and outgoing chamber air were in good agreement, showing a linear relationship between ΔC2 (ppbv) and Δ (m/z 37-to-m/z 19 ratio) with a slope (mean humidity correction factor) of −119.68 ± 3.2 and R2 = 0.84. The application of this factor on C2 (Equation (1)) gives a corrected C2 noted C2*.
As mentioned before, OH radicals are artificially generated inside the reactor using the photolysis of water vapor. This reaction also results in hydrogen atoms that can be associated with oxygen molecules present in air leading to the formation of HO2. In the presence of high levels of NO in sampled air, HO2 radicals can be rapidly converted into OH radicals resulting in different levels of OH between C2 and C3 and leading to an artifact on C3 measurements. Therefore, tests were performed by introducing different levels of NO (1.2 to 19.6 ppbv) inside the reactor while sampling humid zero air. When the NO level in the system increases, the pyrrole mixing ratio in C3 decreases. The variation of C3 (ΔC3) was thus monitored as the difference between an expected C3 and the measured C3, where the expected C3 is calculated using C1, C2 and an expected OH reactivity due to NO. The relationship between ΔC3 and the NO mixing ratio is not linear. It follows a quadratic regression (S1.b), ΔC3 = a [NO]2 + b[NO], where [NO] is in ppbv with the following parameters fitted during this pre-experimental test a = −0.0013 and b = 0.3214 (see also Michoud et al., 2015 [35]). This correction leads to corrected C3 noted C3*. We note that this correction was minor most of the time as the NO mixing ratio was low during the campaign (0.7 ± 0.5 ppbv on average during the considered period except for one peak recorded on the morning of the 21st of April 2017 when the NO mixing ratio reached 46 ppbv around 06:00 UTC (local time = UTC + 2)).
Regarding nitrogen dioxide (NO2), no tests have been performed on site, since NO2 is not expected to lead to the formation of secondary OH inside the reactor. However, its conversion into NO showed that it can cause an artifact [35]. During the intercomparison of OH reactivity instruments over the SAPHIR chamber [11], our CRM/PTR-MS suffered from an artifact from high (≥10 ppbv) NO2 concentration, even if this effect was to a lower extent when compared to other CRM instruments. The absolute change in OH reactivity values was about + 1.9 s−1 in the presence of 10 ppbv of NO2. This correction was only considered in order to estimate the weight of the NO2 interference on OH reactivity measurements. As NO2 was on average 12 ppbv during the campaign, this could have led to an underestimation of about 2 s−1 of the corresponding OH reactivity.
Based on previous experiments, no dependency was seen for LSCE-CRM regarding O3 [11]. Therefore, no correction was applied.
OH reactivity values are determined based on Equation (1). This equation assumes that the instrument is operated under pseudo-first-order conditions (i.e., [Pyrrole] >> [OH]), which is not the case with current CRM instruments. To assess this correction, injections of known concentrations of propane and isoprene were performed during the field campaign. These two gas standards represent extreme cases since propane is a medium reactive VOC in the atmosphere (k(propane-OH) = 1.09   ×   10−12 cm3 molecules−1 s−1), while isoprene is one of the most reactive (k(isoprene-OH) = 1.0 × 10⁻¹⁰ cm3 molecules−1 s−1). The measured OH reactivity obtained from these tests is then compared with the expected OH reactivity, which allows extracting a correction factor that depends on the pyrrole-to-OH ratio [37]. Therefore, standard OH reactivity experiments were conducted at various pyrrole-to-OH ratios ranging between 1.7 and 2.7, which is the range observed most of the time during the COV3ER campaign, leading to a correction factor F = 1.59x2 − 7.22x + 9.46 with x = pyrrole/OH. Finally, correction on reactivity values due to dilution was around 1.44 during the campaign (D).
Taking all mentioned corrections into account, final OH reactivity was determined following Equation (2):
R OH   =   ( C 3 C 2 ) ( C 1 C 3 )   kp   C 1   F   D
The limit of detection was about 3 s−1 (3σ), based on the calculations described by Michoud et al. (2015) [35] and overall uncertainties have been estimated at 35% (1σ) for the measured OH reactivity by our CRM/PTR-MS [38].
Ambient Air Sampling
The sampling lines were shared with the PTRQi-ToFMS. In total, 8 ¼” internal diameter PFA 20 m lines were sampled at a flow rate of ~7 L min−1. Among these 8 lines, the line from the rapeseed enclosure and the line sampling ambient air at 270 cm height were subsampled to the 4 port-valve of the CRM system, with a flow rate around 1 L min−1, through a 1/8” internal diameter PFA line, using two pumps: the first one is a PTFE-coated pump located upstream of the reactor and the other one is from the Gas Calibration Unit (GCU) used to generate humid zero air from ambient air (Figure S2). All Teflon lines were heated to 50 °C.
Since the PTRQi-ToFMS was used during this campaign to measure gradients, eddy covariance fluxes and the air out of the dynamic chambers, the measurement sequence was programmed as following: 20 min of eddy covariance measurements followed by 5 min of gradient measurement, 3 min in the chamber out and 2 min of background.

2.4.2. Proton Transfer Reaction Quadrupole ion-Time of Flight Mass Spectrometer (PTRQi-ToFMS)

Instrument Setup
A PTRQi-ToFMS (Ionicon Analytik GmbH, Innsbruck, Austria) was used for continuous online measurements of VOC mixing ratios at 10 Hz. The analyzer was described in detail previously ([27,39,40]) and the setup used in this study is detailed in Gonzaga Gomez et al. (2019) [27]. VOCs are protonated inside a reaction tube, then injected into a quadrupole ion guide and electromagnetic lenses that focus the ions into the time-of-flight mass spectrometer (ToF, TofWerk, Switzerland) which separates the ions by inertia prior to their detection on a multi-channel-plate (MCP) coupled to a time-to-digital converter (Burle Industries Inc., Lancaster, PA, USA). The drift tube pressure was tuned to 4 ± 0.0001 mbar, drift temperature was 80 ± 0.06 °C, and drift voltage E was 995 ± 0.03 V. These conditions ensured an E/N ratio (where E is the electric field strength and N the gas density) of 132 ± 0.03 Td (1 townsend = 10–17 V cm2), which was chosen as a good compromise to avoid fragmentation and limit clustering [41,42]. The number of detection channels was set to 240,000 and the mass spectrum spanned 15 to 530 m/z. The extraction rate of ions in the ToF was set to 40 µs (25 kHz). A total of 2500 extracted spectra were averaged prior to recording at 10 Hz. The proton transfer reaction is effective for compounds having a proton affinity higher than that of water (691.7 kJ mol−1), which means that the major atmospheric compounds are not protonated (N2, O2, CO2, CH4, N2O) allowing for detection of trace compounds.
Acquisition and Pre-processing of PTRQi-ToFMS Data
Data acquisition was performed with homemade Labview® software which logged a list of ion peaks integrated online by the TOFDaq software (TOFWERK, SW). The desired ion peak list was set-up at the start of the experiment based on measured air sampled at the site, analyzed by a homemade Labview peak analyzer. Every 5 min, the data were stored on the hard drive, and a mass calibration was performed with the automatic TOFDaq software feature using ions m/z 21.0221 (H318O+) and m/z 59.049 (acetone C3H6OH+), and a 2-s moving average. Mass calibration was quality-checked online by computing the peak mass of m/z 21.022 and m/z 59.049 after calibration and was found to be stable throughout most of the experiment. Unstable mass calibration periods were discarded at the computation stage. The channel’s number of the 16-way valve embedded in the PTRQi-TOFMS was also recorded. The synchronized data were pre-processed with another Labview program that computed the mean and standard deviation of the cps at the entry and exit of the chamber as well as at reference level (2.7 m) and in the canopy at 1.34 m. In this pre-processing step, the first 15 s and the last 5 s of a recording were removed prior to computing cps statistics to avoid unstable drift pressures that occurred after each valve switching.
PTRQi-ToFMS Calibration
In order to account for the sensitivity changes, the PTRQi-ToFMS was regularly calibrated. We used a standard cylinder containing 102 ppbv of benzene, 104 ppbv of toluene, 130 ppbv of ethylbenzene and 336 ppbv of xylene (122 ppbv Ortho, 121 ppbv Meta, 123 ppbv Para; BTEX, Messer). Gas from this cylinder was diluted with synthetic air (alphagaz 1, Air Liquide, FR) using two fluorinert-coated mass flow controllers (Bronkhorst), to generate concentrations from 0 to 50 ppbv of BTEX. The calibration was done almost every week. The zero check was performed every 30 min by passing through a hydrocarbon filter (Supelco ref 22445-12 or Restek ref 21991) for 2 min and keeping the last 30 s. The zero was withdrawn from the normalized cps every 30 min as shown in Equation (S3.1). The sensitivity S i was calculated as the slope with zero intercept of the regression between mixing ratio in equation (S3.1) assuming S i = 1 and the known mixing ratio. The procedure was applied for the three compounds cited above for the calibration. We found that the sensitivity was 2 ± 0.15. Based on an intercomparison between our PTRQi-ToFMS and a PTR-MS intercompared within the ACTRIS network [43] we adjusted methanol sensitivity to S m e t h a n o l = 14 as explained in Gonzaga Gomez et al. (2019) [27]. Except for methanol, a single sensitivity value was applied for all masses, since the protonation reaction constant was assumed equal for all masses.

2.4.3. Gas Chromatography-Flame Ionization Detector (GC- FID)

A gas chromatograph equipped with a Flame Ionization Detector (airmoVOC C2–C6, Chromatotec, Saint Antoine, France) was used to measure hydrocarbons in the C2–C6 fraction. The sampling was done for 10 min with a flow rate of 11 sccm via a stainless steel inlet, followed by a 20 min analysis. After going through a Nafion dryer, ambient air arrives to a preconcentration unit cooled down to −8 °C, filled with Carboxen, Carbopack B and Carbotrap C. A thermodesorption at 220 °C follows and the sample is injected into a metal capillary column (Porous Layer Open Tubular Column PLOT, Al2O3/KCl; 0.53 mm inner diameter and 25 m length, Varian Inc, USA). Calibrations were performed frequently using a certified standard VOC mixture (National Physical Laboratory, UK). The overall uncertainty was estimated to be 15% (1σ) [44].

2.4.4. NOx Concentration Measurements

Nitrogen oxides (NOx) concentrations in ambient air were measured with a NO-NO2-NOx chemiluminescence analyzer (Model 42-CTL, Thermo Environnement, Mégatec, France). Data were acquired continuously at 1 Hz using a datalogger (Model CR10, Campbell Inc., USA). The NO-NO2-NOx instrument was calibrated in the laboratory before being installed on the field, and the span was regularly checked during the campaign (about once every two weeks). The inlet was placed at a height of 2.5 m, on the side of the FR-Gri field.

2.4.5. CO and CH4 Measurements

A 48i-TL, thermo-Environnement was used to measure carbon monoxide (CO) by the absorption of light in the infrared range. A zero was done every 4 h, and the calibration was checked several times throughout the campaign, by the injection of a pre-calibrated air bottle (≈200 ppbv).
Regarding methane (CH4), a G2201-i Picarro based on Cavity Ring Down Spectroscopy (CRDS), was deployed. CRDS uses a single frequency laser diode to measure specific gas-phase molecules which scatter and absorb light in the near infrared absorption spectrum. By measuring the height of absorption peaks, the concentrations can be determined. More details on the instrument and setup used in this campaign can be found in Assan et al. (2017) [45].
All deployed instruments are summarized in Table 1 and Figure 2.

2.5. Calculation of OH Reactivity

Based on the available trace gases observations, mentioned in Section 2.4 an expected OH reactivity (calculated OH reactivity, cROH) could be determined using the following equation:
cROH = ΣcROHi = Σ ki-OH Xi
where cROHi is the calculated OH reactivity of a compound i, Xi is its concentration and ki-OH is its respective rate coefficient of the reaction with the hydroxyl radical OH.
While cROHambient was calculated considering VOCsambient (PTRQi-ToFMS), light (C2–C6) hydrocarbons, NOx, CO and CH4 measured in ambient air (Figure 2), cROHchamber was determined using VOCschamber (PTRQi-ToFMS) measured in the outgoing chamber air and the organic and inorganic species measured in ambient air, assuming that inorganic compounds and light hydrocarbons were not emitted nor deposited in the rapeseed chamber. This assumption was made since these compounds’ variabilities in ambient air (S6) showed no dependency on temperature nor PAR, demonstrating that they were not directly linked to biogenic emissions.
As reported in Gonzaga Gomez et al. (2019) [27], the PTRQi-ToFMS deployed during the COV3ER campaign detected 1078 ions (fragments and isotopes included) with a mass-to-charge ratio (m/z) ranging from 31 to 500. For rapeseed, around 420 ions exceeded the set threshold (signal/ noise ratio > 3), from which 24 masses were selected as the main contributors to rapeseed BVOCs emission fluxes, based on their mean net flux. This list of 24 masses was considered first, including m/z 31.018, m/z 33.034, m/z 41.038, m/z 43.018, m/z 45.033, m/z 57.069, m/z 59.048, m/z 61.028, m/z 69.070, m/z 79.063, m/z 81.069, m/z 83.084, m/z 90.946, m/z 91.053, m/z 93.035, m/z 105.069, m/z 108.956, m/z 125.957, m/z 137.131, m/z 153.052, m/z 190.962, m/z 192.960, m/z 223.061 and m/z 225.043. However, when it came to consider VOCsambient and VOCschamber in cROHambient and cROHchamber, respectively, this list was shortened to 12 masses, with known chemical nature and established rate coefficients (k) for the reaction with OH. It is important to note that, in our case, total monoterpenes are represented by the sum of m/z 81.068 and m/z 137.129, since m/z 81.068 was mainly a monoterpene fragment. Isoprene, detected at m/z 69.070 also exhibited a fragment at m/z 41.038, therefore, the corresponding signal was corrected for the potential fragmentation with a factor of 1.3. Formaldehyde could be detected and quantified at m/z 31.018. Indeed, Warneke et al. (2011) [46] reported that PTR-MS can be used for formaldehyde measurements, even though HCHO detection by PTR-MS can be strongly dependent on humidity and can be less sensitive than for other compounds. The 12 selected PTRQi-ToFMS masses as well as the other organic and inorganic measured trace gases are listed in Table 2, together with their respective rate constants for the reaction with OH used for calculations. It is worth noting that the OH reactivity of monoterpenes was calculated as the product of the concentration of total monoterpenes (m/z 137 and m/z 81) and the rate constant of the reaction of limonene with OH. This assumption was based on previous studies, where limonene was reported to be the dominant monoterpene emitted by Brassica napus [23]. It is worth noting that this rate constant also represents the average rate constant taking into account, in addition to the rate constant of the reaction of limonene with OH, those of sabinene (ksabinene-OH = 117 × 10−12 cm3 molecule−1 s−1 (at 296K) [47]) and myrcene (kmyrcene-OH = 213 × 10−12 cm3 molecule−1 s−1 (at 294K) [48]), since these latter compounds can also be important monoterpenes emitted by rapeseed.
Finally, this list of compounds (Table 2) contains species known to be biogenic compounds: isoprene, monoterpenes and green leaf volatiles (GLV). This latter family consists of C6 compounds emitted by almost every green plant upon herbivory or pathogen infection and known for their important role in plant defenses [49]. Several OVOCs appear in this list: formaldehyde, methanol, acetaldehyde, acetone, etc. OVOCs can be of anthropogenic or biogenic origins and can be primarily emitted by plants or generated from secondary reactions (acetaldehyde, acetic acid, etc.). Therefore, it is important to distinguish between rapeseed BVOCs emissions and background air emissions. In this context, we determined the concentration of VOCs related to the enclosed plant emissions as VOCsrapeseed = VOCschamber − VOCsambient (Figure 2).

2.6. Data Availability

The CRM/PTR-MS system operated from 7–25 April 2017. However, final experimental conditions, including heating the sampling lines and sampling ambient air from a mast at ≈ 2.7 m height, commenced 10 April 2017. All other instruments were operational between the 10th and the 25th of April except for the NOx analyzer, resulting from technical problems from 14–19 April. Since NO data is important to correct for the CRM artifact due to the recycling of OH radicals (NO + HO2), only OH reactivity data corrected for the NO interference are presented. It should be noted that one to 2–3 days were dedicated at the beginning, the middle (12–13 April) and the end of the campaign, to perform some tests aiming to check the stability of the CRM system. In addition, enclosure measurements were interrupted for 2 days during the campaign (between the 15th and the 17th April 2017), since a fungicide (FILAN SC (concentrated suspension) consisting of 200 g/L boscalid and 200 g/L dimoxystrobin) application was planned for this period. Therefore, taking into account the CRM/PTR-MS availability with a 1h incoming air/4h outgoing air measurement sequence, as well as the availability of the other deployed instruments, only the results from the 20th to the 23rd of April, representing the later stage of the blooming period, are presented and further discussed.

3. Results and Discussion

In the first part of the result section, the variability of measured total OH reactivity in the outgoing chamber air (mROHchamber) as well as in the incoming ambient air (mROHambient) is described, linked to some meteorological parameters. In a second part, calculated OH reactivity is determined in ambient air (cROHambient) as well as from the rapeseed branch (cROHrapeseed), with a description of the individual contribution of biogenic and abiotic compounds to mROHchamber. The final part is dedicated to discussing the possible origins of missing OH reactivity, based on the investigation of further masses measured with the PTRQi-ToFMS.

3.1. Total OH Reactivity

Figure 3b,c report the variability of measured total OH reactivity from the rapeseed dynamic chamber (mROHchamber) with temperature, PAR and RH, from the 20th to the 23rd of April 2017. mROHchamber varied diurnally between the limit of detection and 47.6 s−1, with an average of 12.0 ± 6.7 s−1. Higher values were measured during daytime and minimum values during night-time, following PAR and temperature profiles. The average day and night mROHchamber was 14.9 ± 7.1 and 8.1 ± 3.1 s−1, respectively. The night-time mROHchamber was in the same order of magnitude of the mean total OH reactivity measured in the incoming chamber air (mean mROHambient = 7.5 ± 2.4 s−1). However, the latter did not show a clear diurnal cycle as in the chamber reactivity. Such findings were similar to the observations made by Ren et al. (2005) [14] during a field experiment conducted in an agricultural research farm, where averaged ambient OH reactivity was 6.1 s−1 with little diurnal variation. However, our results are lower than the mean values (20 s−1 at noon and 50 s−1 at day-break) recorded in ambient air by Lou et al. (2010) during the PRIDE-PRD2006 campaign at a rural site which was dominated by anthropogenic pollutants (CO, NOx, etc.) at night and strongly influenced by local biogenic emissions of isoprene during the day [15]. Our results were also lower than the 25 s−1 OH reactivity reported by Nolscher et al. (2013) [18] from a dynamic branch cuvette enclosure system mounted on a Norway spruce and much lower than the OH reactivity recorded by Kim et al. (2011) from red oak, white pine, beech and red maple branch enclosures which ranged between tens and hundreds of s−1 [17]. Thus, recorded levels of OH reactivity in ambient air and in the dynamic chamber were in the lower range of total OH reactivity, compared to various forest ecosystems, where OH reactivity reached maximum levels between 30 and 100 s−1 [17,18,33,58,59,60].
From 20–23 April, the crop growth was relatively stable as shown by the stem length, the total leaf length and the fraction of open flowers evolution (see S4). mROHchamber showed to be clearly correlated to environmental abiotic factors rather than changes in plant physiology. As mentioned before, mROHchamber minima recorded during nights were close to the levels measured in ambient air, which indicates that at night, there was no or little contribution from the plant emissions to OH reactivity. This observation is confirmed by ΔmROH = mROHchamber − mROHambient (Figure 3a), with relatively low values during the night, whereas, during the day, ΔmROH reached a maximum of 10 s−1 on average at midday (between 11h and 14h UTC). This difference appeared around 05:00 (UTC) when the sun rose (PAR > 0 μmol m−2 s−1), peaked around noon in parallel with maximal solar radiations and temperatures, and decreased in the late afternoon down to a minimum around 19:00 (UTC). The midday difference was the highest on the 21st of April (ΔmROH = 14.3 s−1), when a higher daytime temperature and a more intense solar radiation were recorded inside the enclosure. These observations show that the contribution of plant emissions to OH reactivity were temperature- and/or light-dependent. It is worth noting that a higher temperature was recorded inside the chamber compared to ambient air (mean difference = 8.5 °C, see S5), this should be kept in mind when analyzing ΔmROH.
It is worth noting that an extra daytime peak of mROHchamber (Figure 3b) was recorded in the morning of the 21st of April (05:00–07:30 UTC) that did not appear on the other days and was also seen on ΔmROH (Figure 3a). This peak of ΔmROH is likely due to the subtraction of a mROHambient (an average of 7.5 s−1) not representative of the atmospheric conditions at that hour of the day; indeed, we remind that mROHambient was only recorded 1 h each 4 h, and that the ambient air composition can change quickly. In addition, higher night-time levels were observed during the nights of 21st and the 22nd April (around 01:00 UTC). These events are further discussed in Section 3.2 while investigating the contribution of measured compounds to total measured OH reactivity.

3.1.1. Ambient Air Measurements and their Calculated OH Reactivity (cROHambient)

Measurements in ambient air included NO, NO2, CO, CH4, C2–C6 hydrocarbons and other VOCs (Figure S6a). As already stated, NO was around 0.7 ± 0.5 ppbv on average for the considered period, except for one peak recorded on the morning of the 21st April, 2017 when the NO mixing ratio reached 46 ppbv around 06:00 UTC. NO2 showed higher mixing ratios than NO and was around 12 ppbv on average. CO was on average 151 ± 21 ppbv with a higher mixing ratio on the morning of the 21st April, occurring at the same time as the NO peak and reaching 243 ppbv around 07:00 UTC. These high peaks of NO and CO, observed on the morning of the 21st April, correspond to the hours of the day when the wind was mainly coming from the east of the site (wind direction ≈ 50°) and had a low speed, which suggests little mixing in the surface layer. These peaks lasted for 2–3 h and they were most likely related to traffic from the road nearby and advection from Paris and its suburbs. In terms of calculated OH reactivity, these two compounds, accounted for 4.6 s−1 on average to the ambient measured OH reactivity, with a maximum of 14.3 s−1 on the morning of the 21st of April 2017 (S6b).
Regarding VOCs, CH4 presented an average of 2100 ppbv, with a higher level on the night between the 20th and the 21st of April and a high/sharp peak around 01:00 UTC of the 22nd. The same observation was made on the sum of C2-C6 hydrocarbons (GC-FID) and the oxygenated VOCsambient (PTRQi-ToFMS). In terms of OH reactivity, CH4, non-methane hydrocarbons in the C2-C6 fraction and OVOCs accounted, each, for 0.3–0.4 s−1 on average, with a maximum of 0.7, 1 and 1.2 s−1, respectively, around midnight on the 22nd. Monoterpenes accounted for 0.7 s−1 on average and isoprene had a negligible contribution, around 0.1 s−1, both showing surprisingly the same midnight peak reaching 3.2 and 0.7 s−1, respectively. This peak coincides with a wind mainly coming from the north of the site and highlights possible emissions from a nearby waste treatment plant [61]. All the mentioned compounds accounted for 6.5 s−1 on average of mROHambient, representing a relative mean contribution of 87%.
It is worth pointing out again that, assuming that the inorganic compounds and light hydrocarbons were not emitted nor deposited in the rapeseed chamber, all the compounds present in the incoming chamber air (ambient air) contribute to mROHchamber. This contribution was around 89% and 41% during night-time and daytime, respectively.

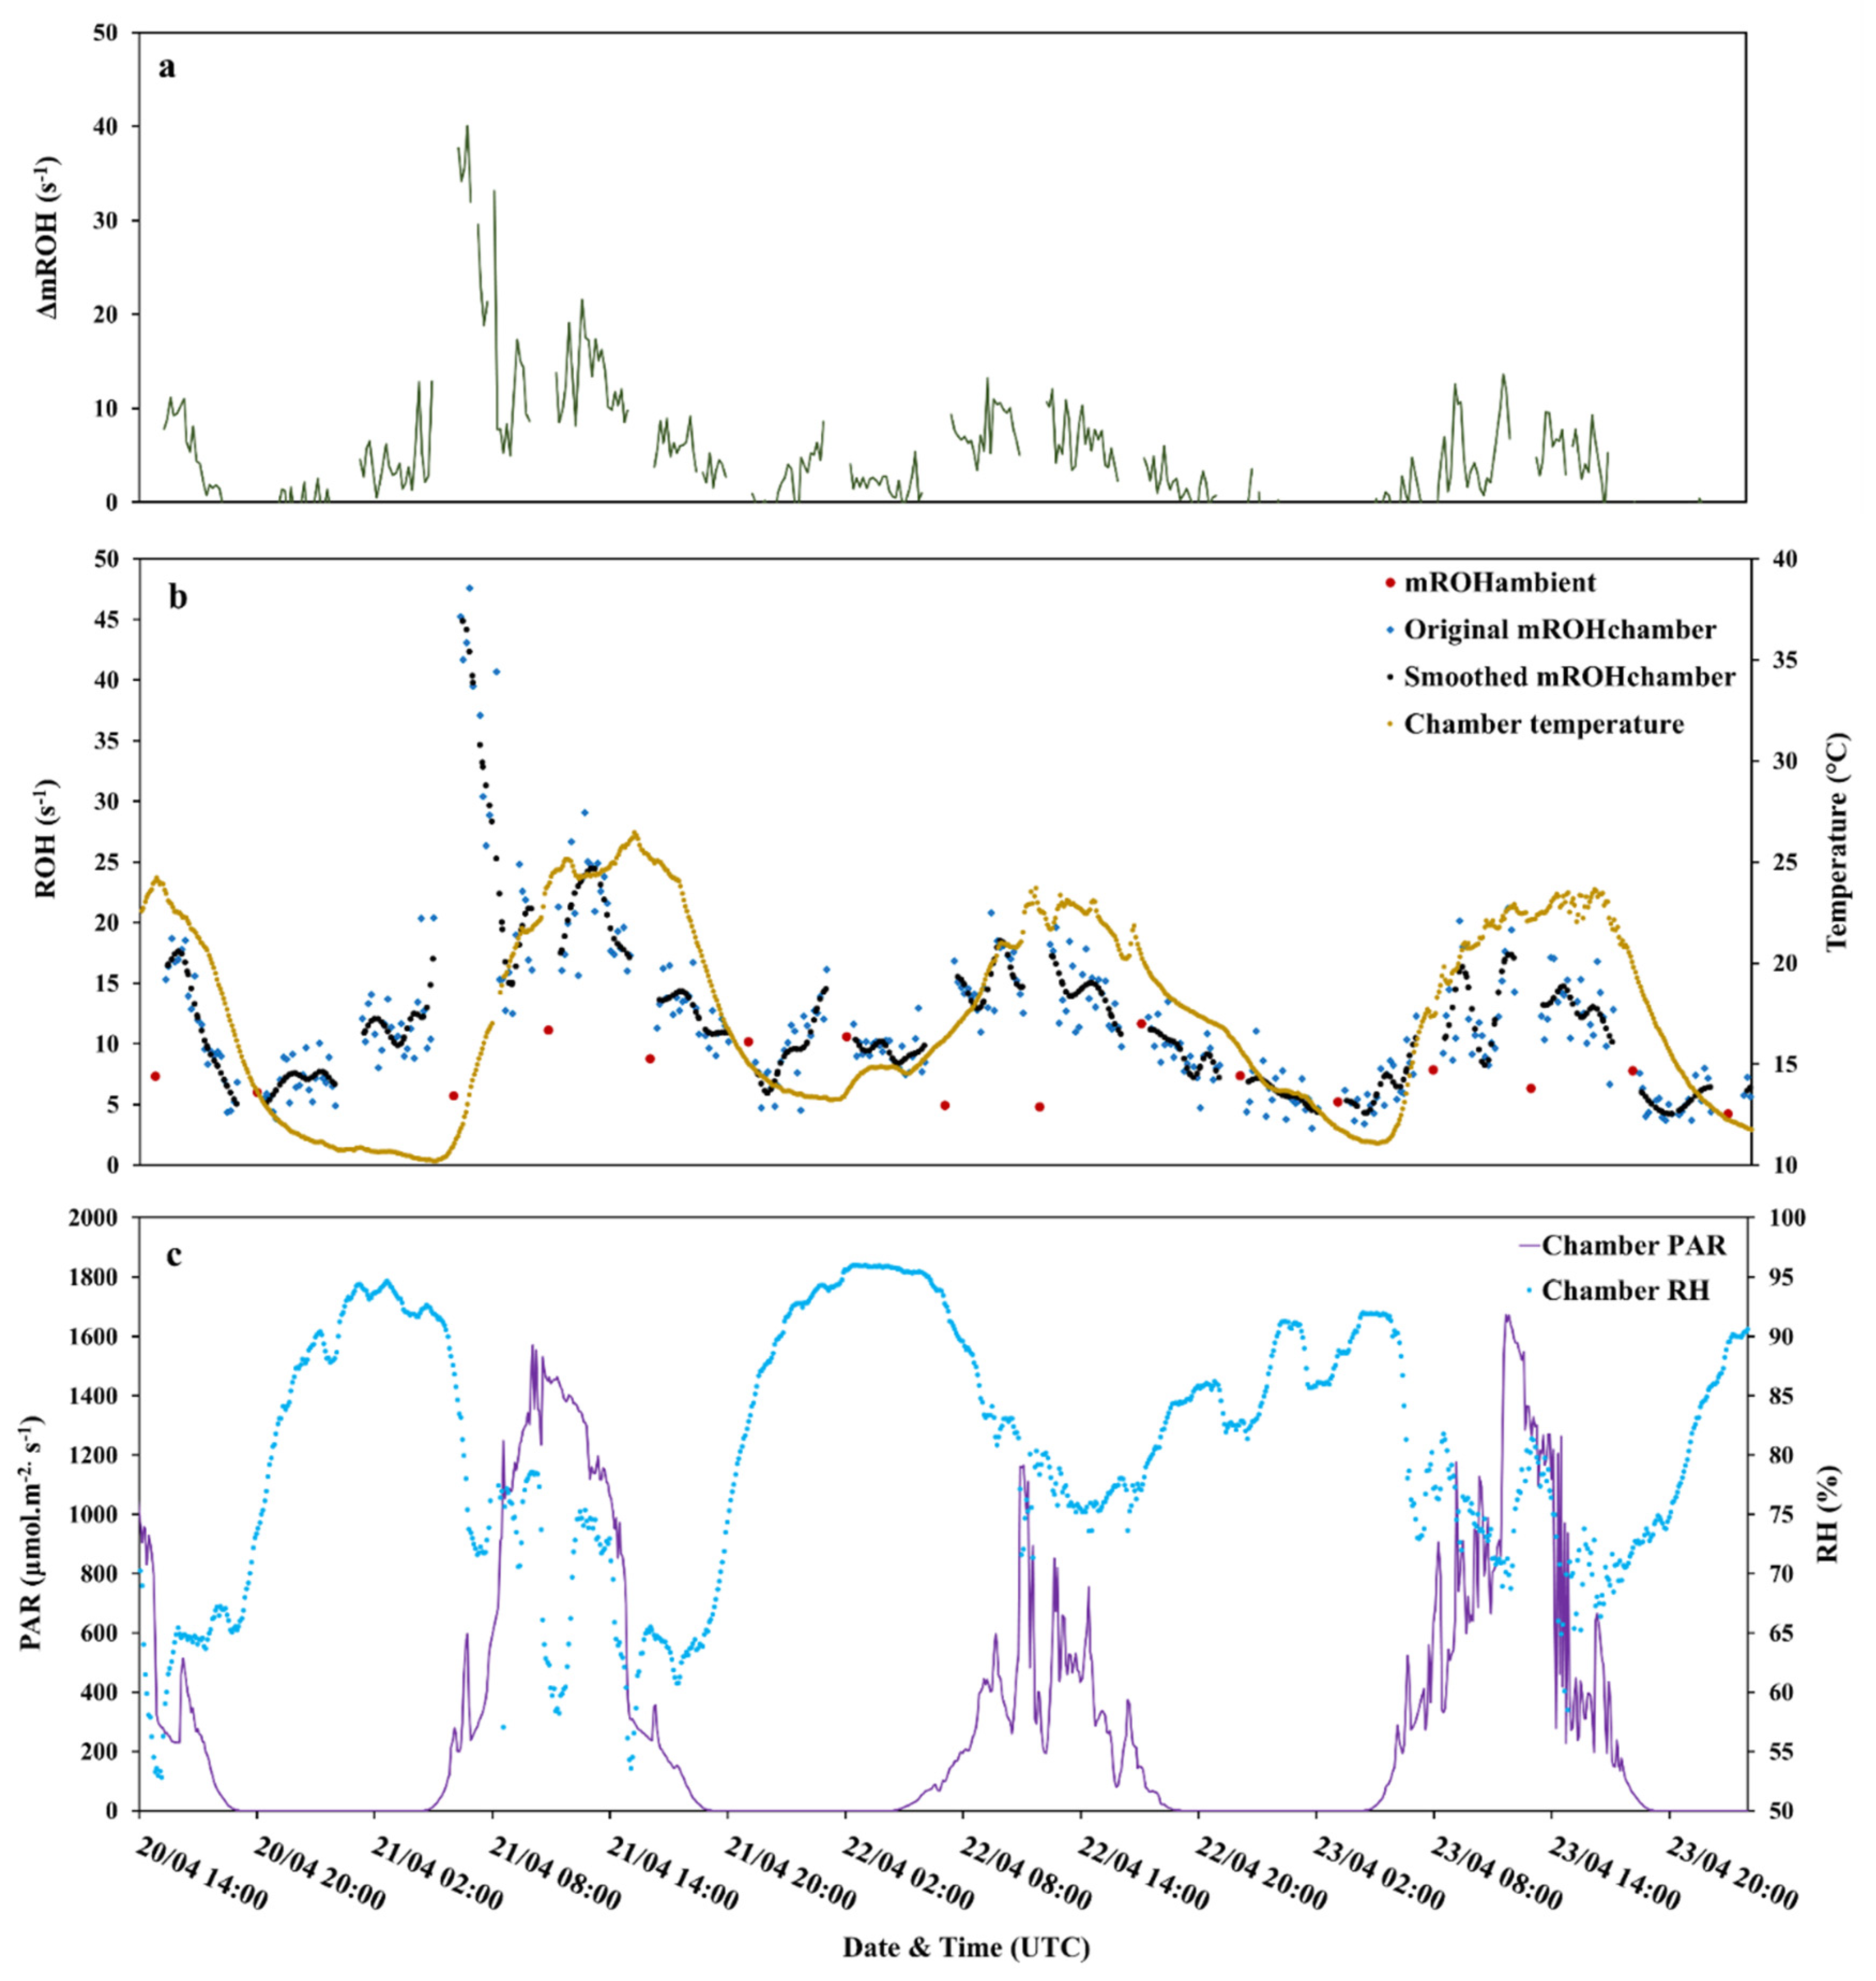
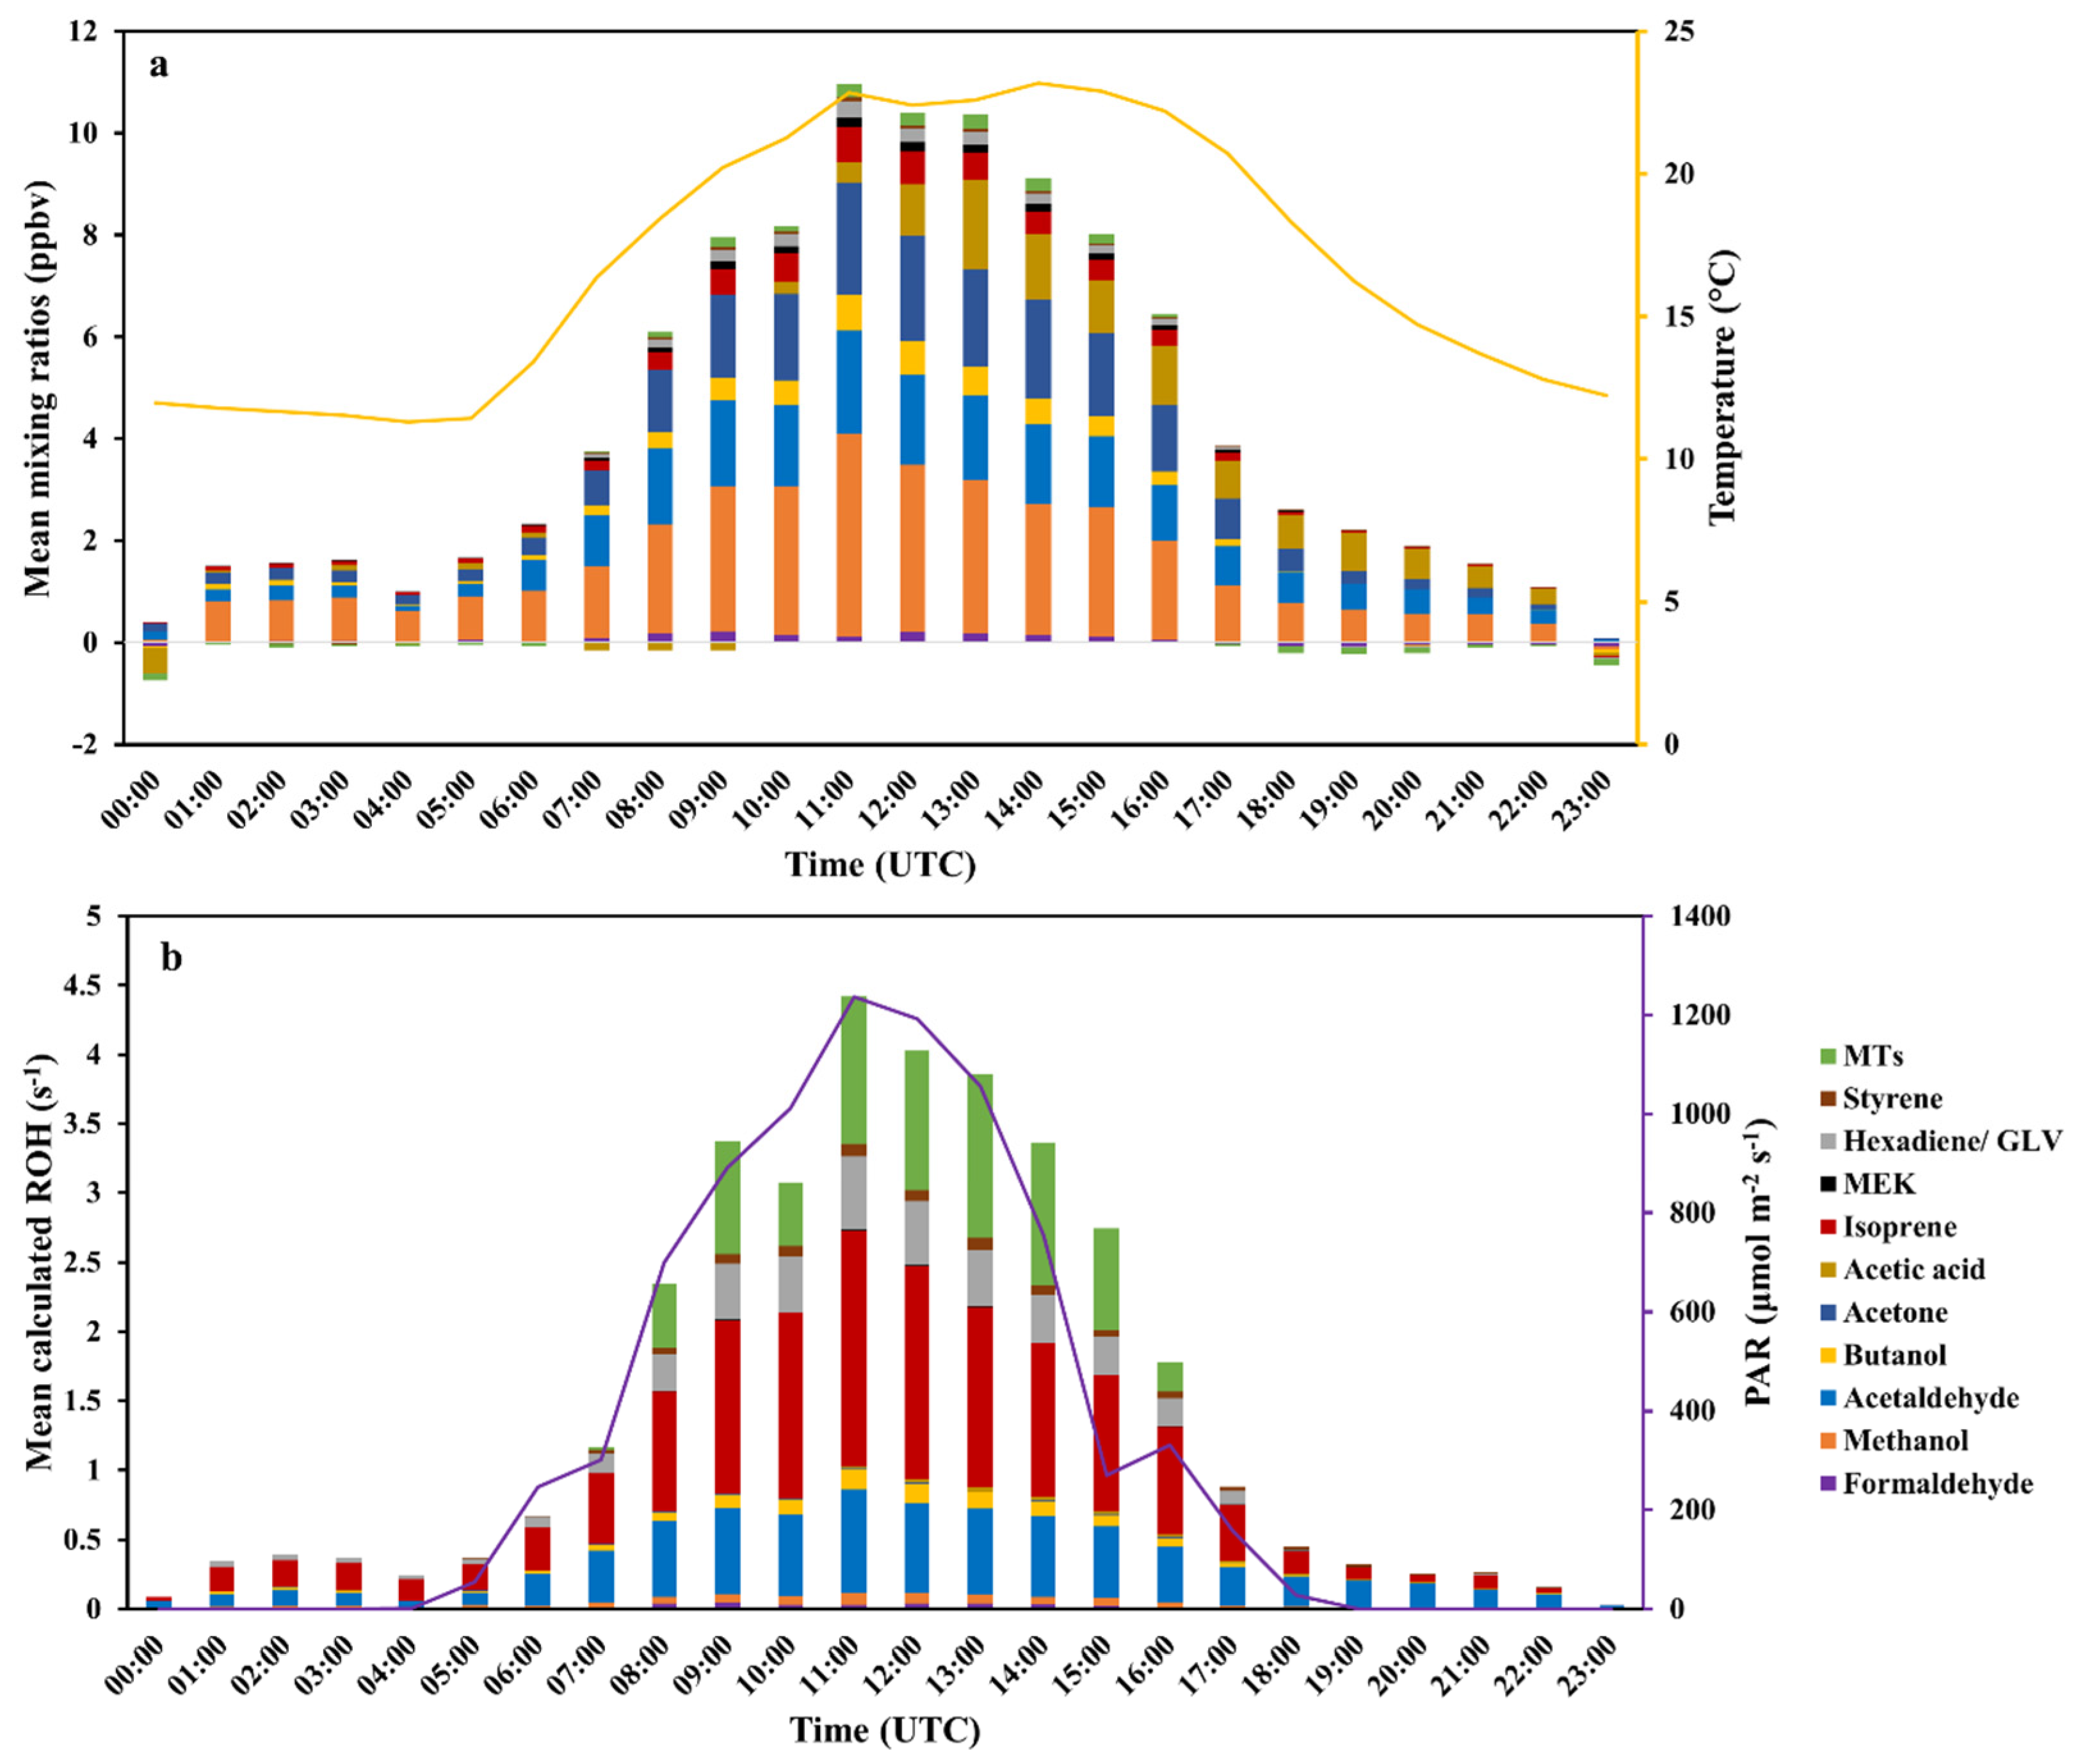
3.1.2. BVOCs from the Rapeseed Plant (VOCsrapeseed) and Their Calculated OH Reactivity (cROHrapeseed)

As mentioned before, the PTRQi-ToFMS was the only instrument measuring VOCs from the dynamic chamber (VOCschamber) as well as in ambient air (VOCsambient). Thereby, it was possible to characterize VOCs originating directly from the enclosed plant (VOCsrapeseed = VOCschamber − VOCsambient), on which we focus in the following section.
The summed mean mixing ratios of the 11 VOCsrapeseed is presented in Figure 4a. It exhibits a diel variability with a maximum of 11 ppbv on average around midday (11 h–14 h UTC) and a minimum during the night (≈ LOD), similar to temperature and light profiles. This observation confirms that BVOCs emissions from rapeseed and their concentrations in the enclosure are generally light- and/or temperature-dependent. It also highlights that these compounds are the main drivers of the day/night variability seen on mROHchamber.
Between the 20th and the 23rd of April, biogenic OVOCs (listed in Table 2) accounted for the major (92%) part of VOCsrapeseed. Among the measured biogenic OVOCs, methanol was dominant with 1.4 ppbv on average, representing 38% of the oxygenated compounds emitted, followed by acetaldehyde and acetone, with 0.8 ppbv each, accounting for 21–22%. Acetic acid (0.4 ppbv) presented around 11%, whereas the others (formaldehyde, butanol and MEK) did not exceed 8% together. Regarding isoprene and monoterpenes, they had relatively low contributions to the total VOCsrapeseed, with 0.2 and 0.01 ppbv on average, amounting for 5.2% and 0.2%, respectively. These observations during the blooming period are in agreement with other studies on rapeseed. König et al. (1995) [62] classified rapeseed as an OVOC emitter with other crop species. Müller et al. (2002) [25] reported an important emission and/or rapid formation of carbonyl compounds from flowering rape as an important source of biogenic OVOCs in the studied ecosystem. Furthermore, these relatively high levels of OVOCs, recorded during the blooming period, were also observed later during the senescence period, starting at the end of April 2017, in the study conducted by Gonzaga Gomez et al. (2019) [27] on the same field site. However, few studies presented rapeseed as an important emitter of monoterpenes, which accounted for 60–90% of the total VOCs identified in spring oilseed rape, whereas non-terpenoid components, including OVOCs (acetaldehyde, acetone and 3-methyl-2-butanone) were found at low levels [23].
When looking at individual BVOC variability (S7), all compounds had a clear diurnal cycle, except for acetic acid whose variability followed neither temperature nor light. Emissions of isoprene, as well as of the rest of the OVOCs and hexadiene/Green Leaf Volatiles (GLV), were correlated to light and/or temperature, because they exhibited higher levels during daytime compared to the night-time, and for night-time levels, they showed higher levels during the 22nd night when higher night-time temperatures were recorded. Finally, monoterpenes did not show the same behavior and their emissions were close to zero during the night, even when night-time average chamber temperature was at its highest, around 15 °C.
Figure 4b illustrates the mean contribution of each VOCrapeseed to the mean calculated OH reactivity (cROHrapessed) that exhibited an average diurnal variation between the LOD and 4.4 s−1. Interestingly, the major contributors to cROHrapeseed during daytime were isoprene with 40%, followed by acetaldehyde (21%) and monoterpenes (18%). Hexadiene/ GLV accounted for 12% and the rest (formaldehyde, methanol, butanol, acetone, acetic acid, MEK and styrene), did not exceed 10% all together. Despite that methanol was the most abundant compound in the chamber, its contribution to OH reactivity remains low, compared to less emitted but more reactive species, like isoprene and monoterpenes.
Compared to measured OH reactivity in the outgoing chamber air (mROHchamber), all of the considered biogenic VOCsrapeseed explained 13% on average of the mROHchamber during daytime with a maximum contribution at midday (11:00–14:00 UTC) reaching 24% on average, whereas during night-time, biogenic VOCsrapeseed contribution to mROHchamber was negligible. Contributions of ambient species and rapeseed emissions to mROHchamber are summarized in Table 3.

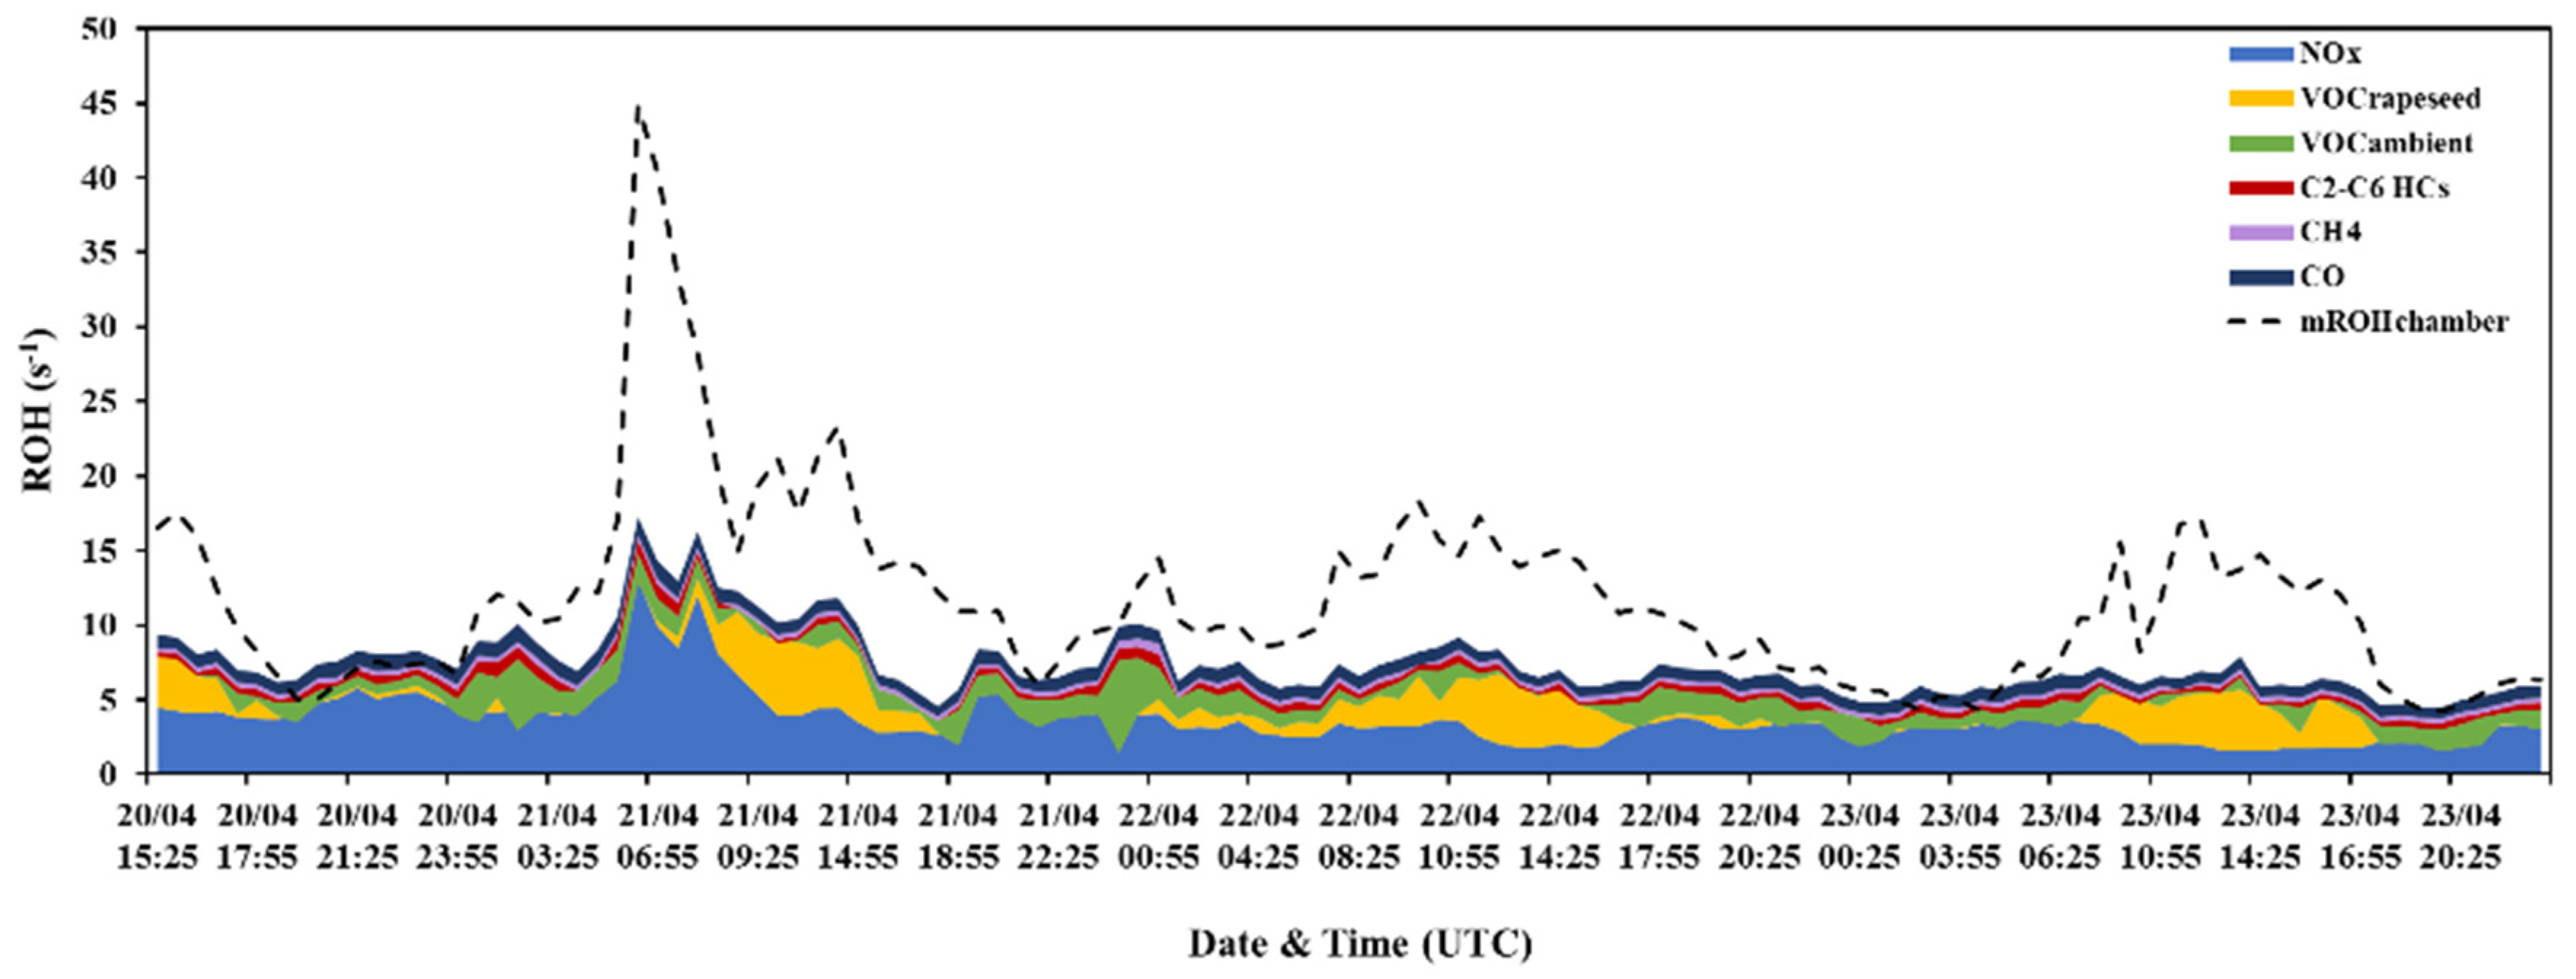
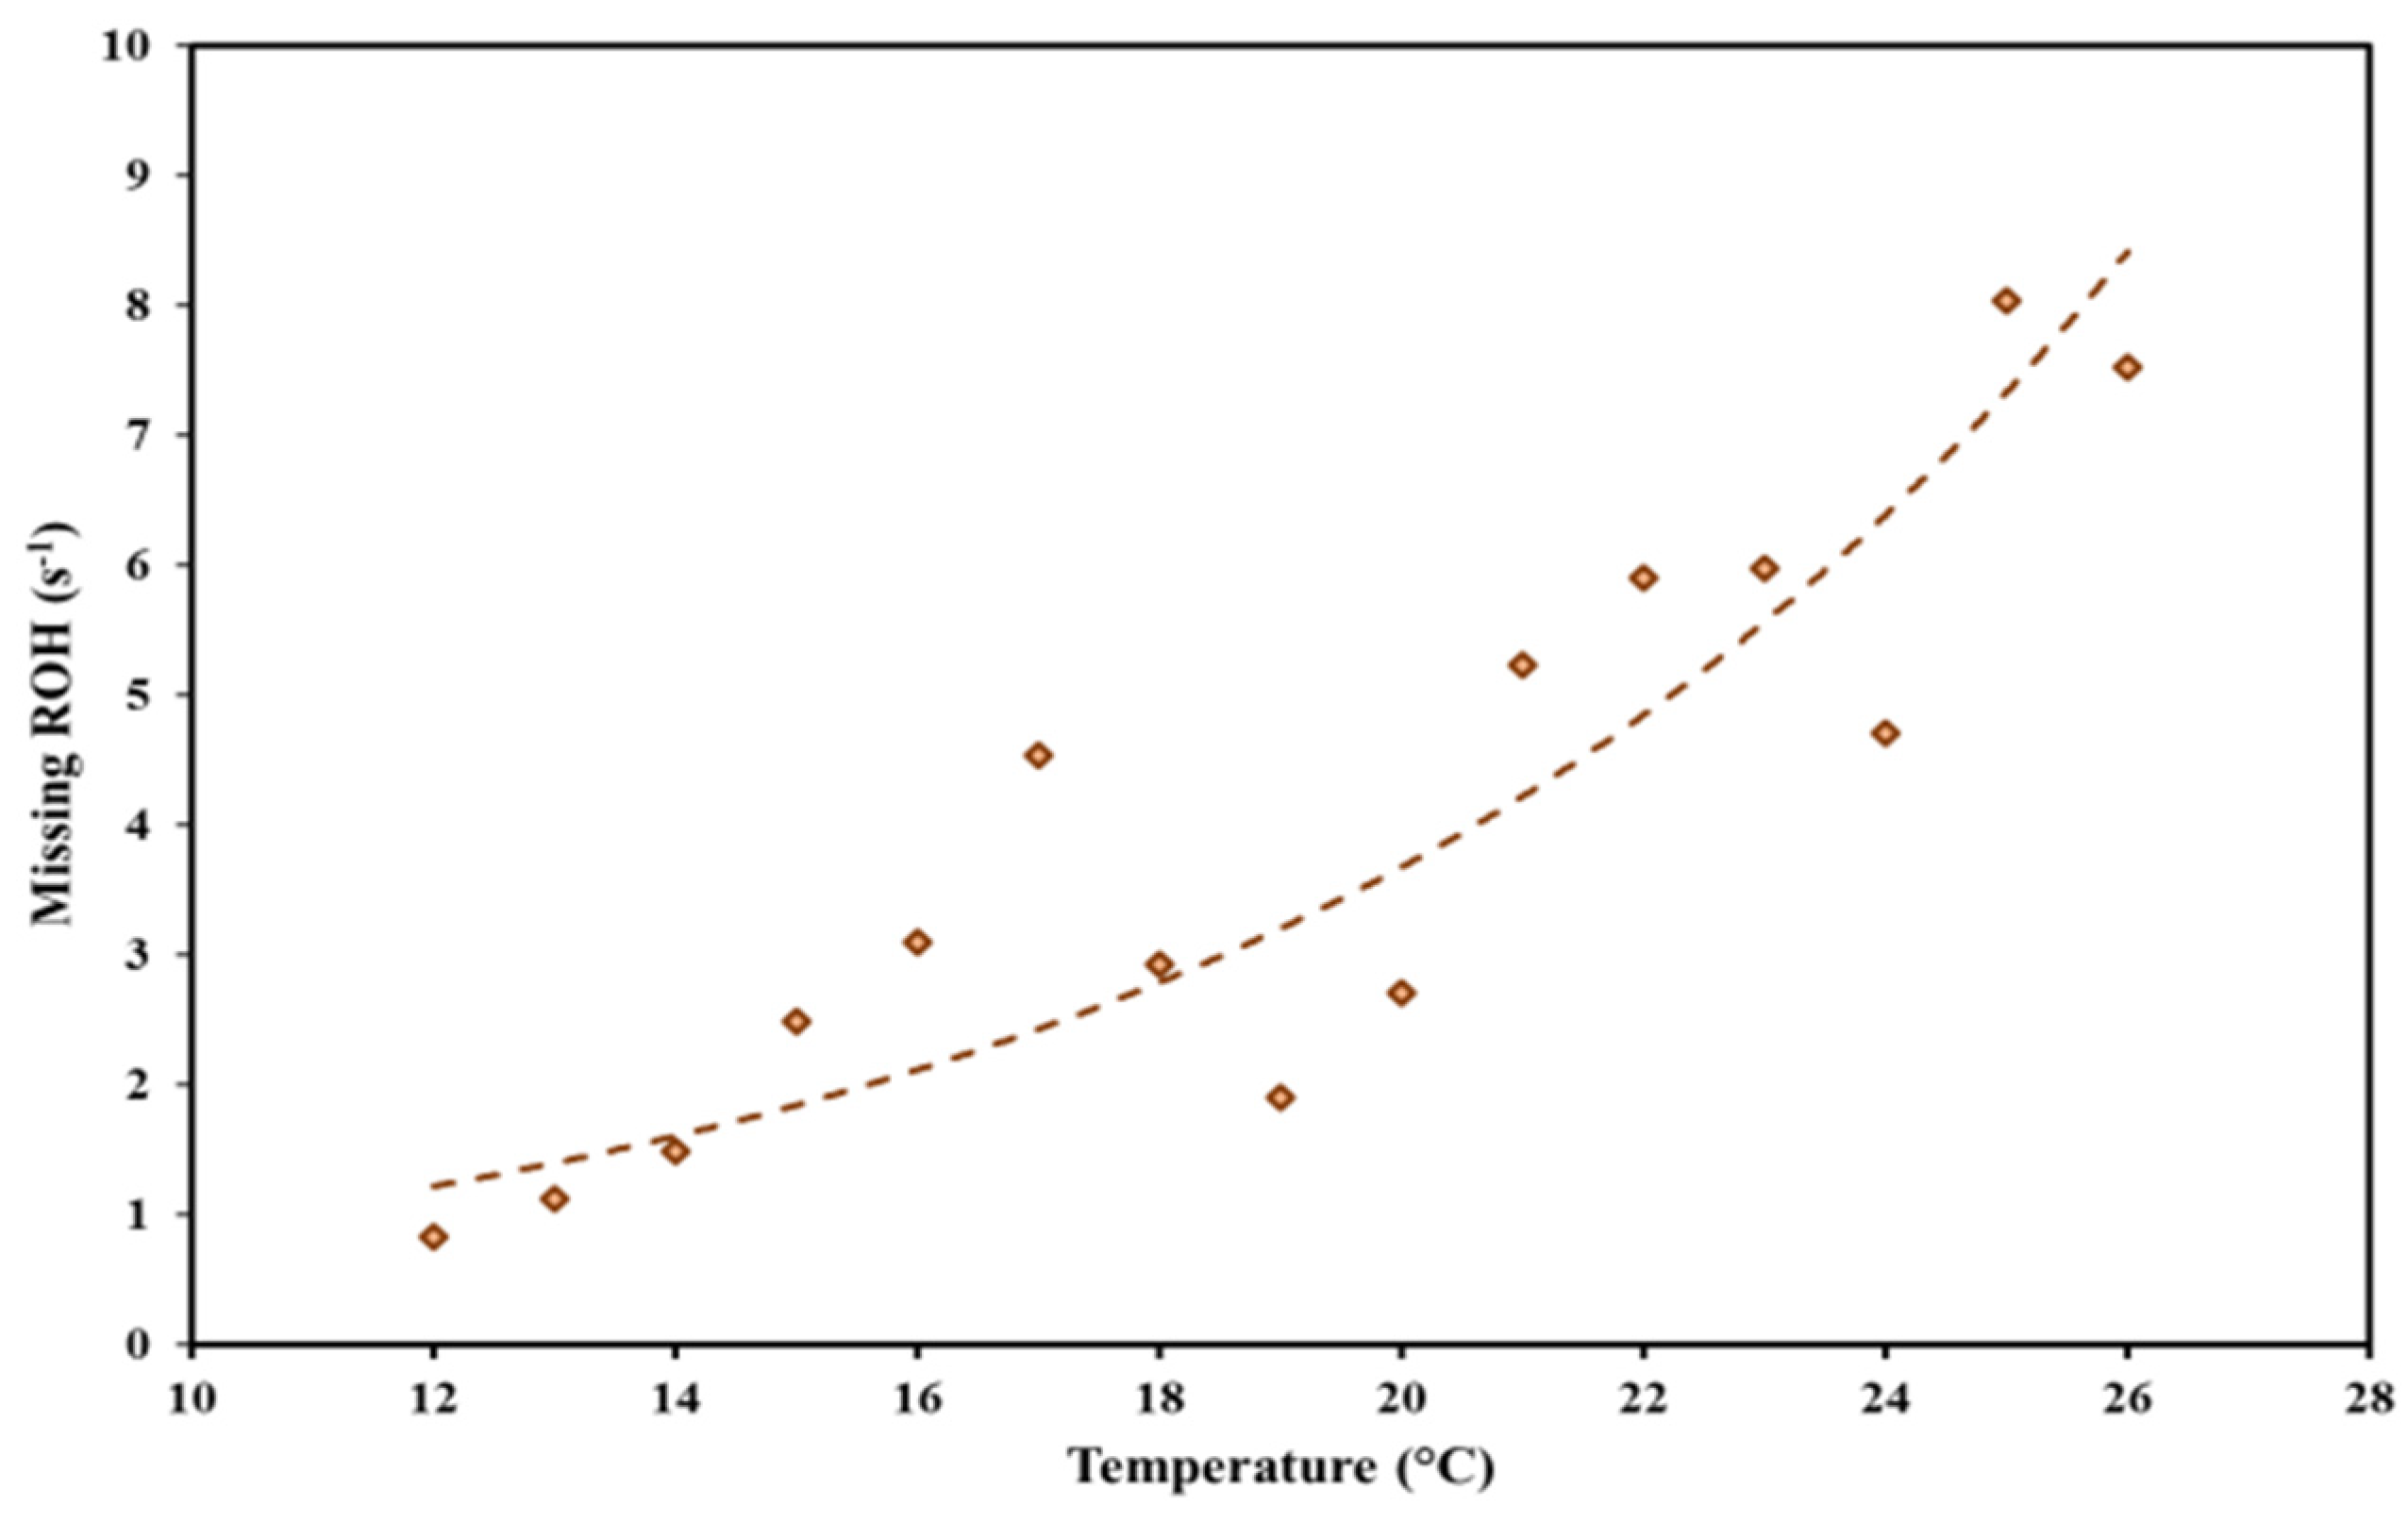
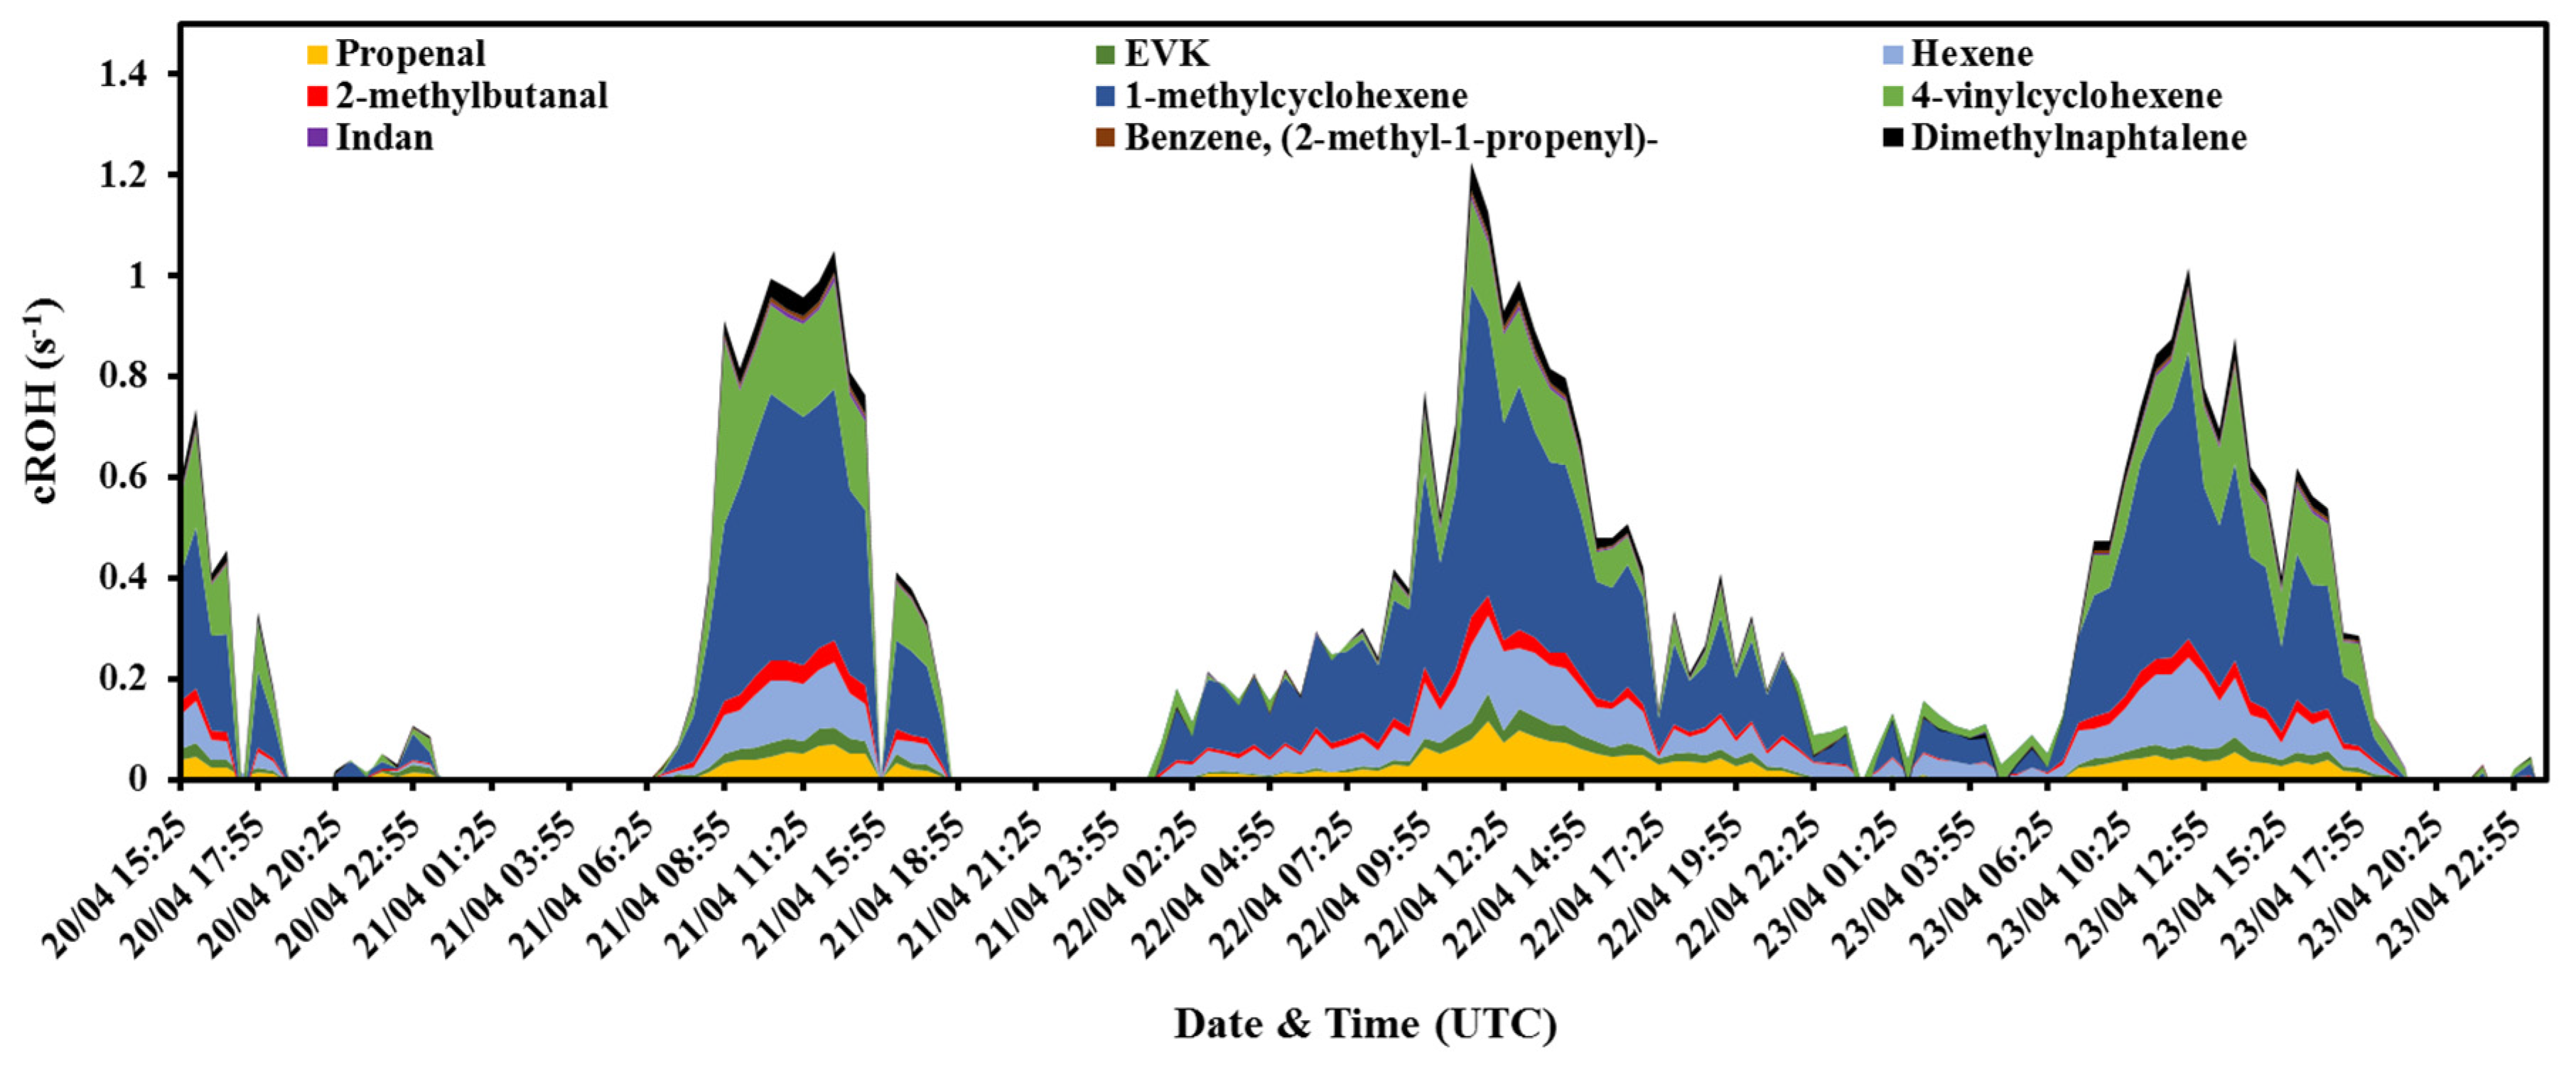
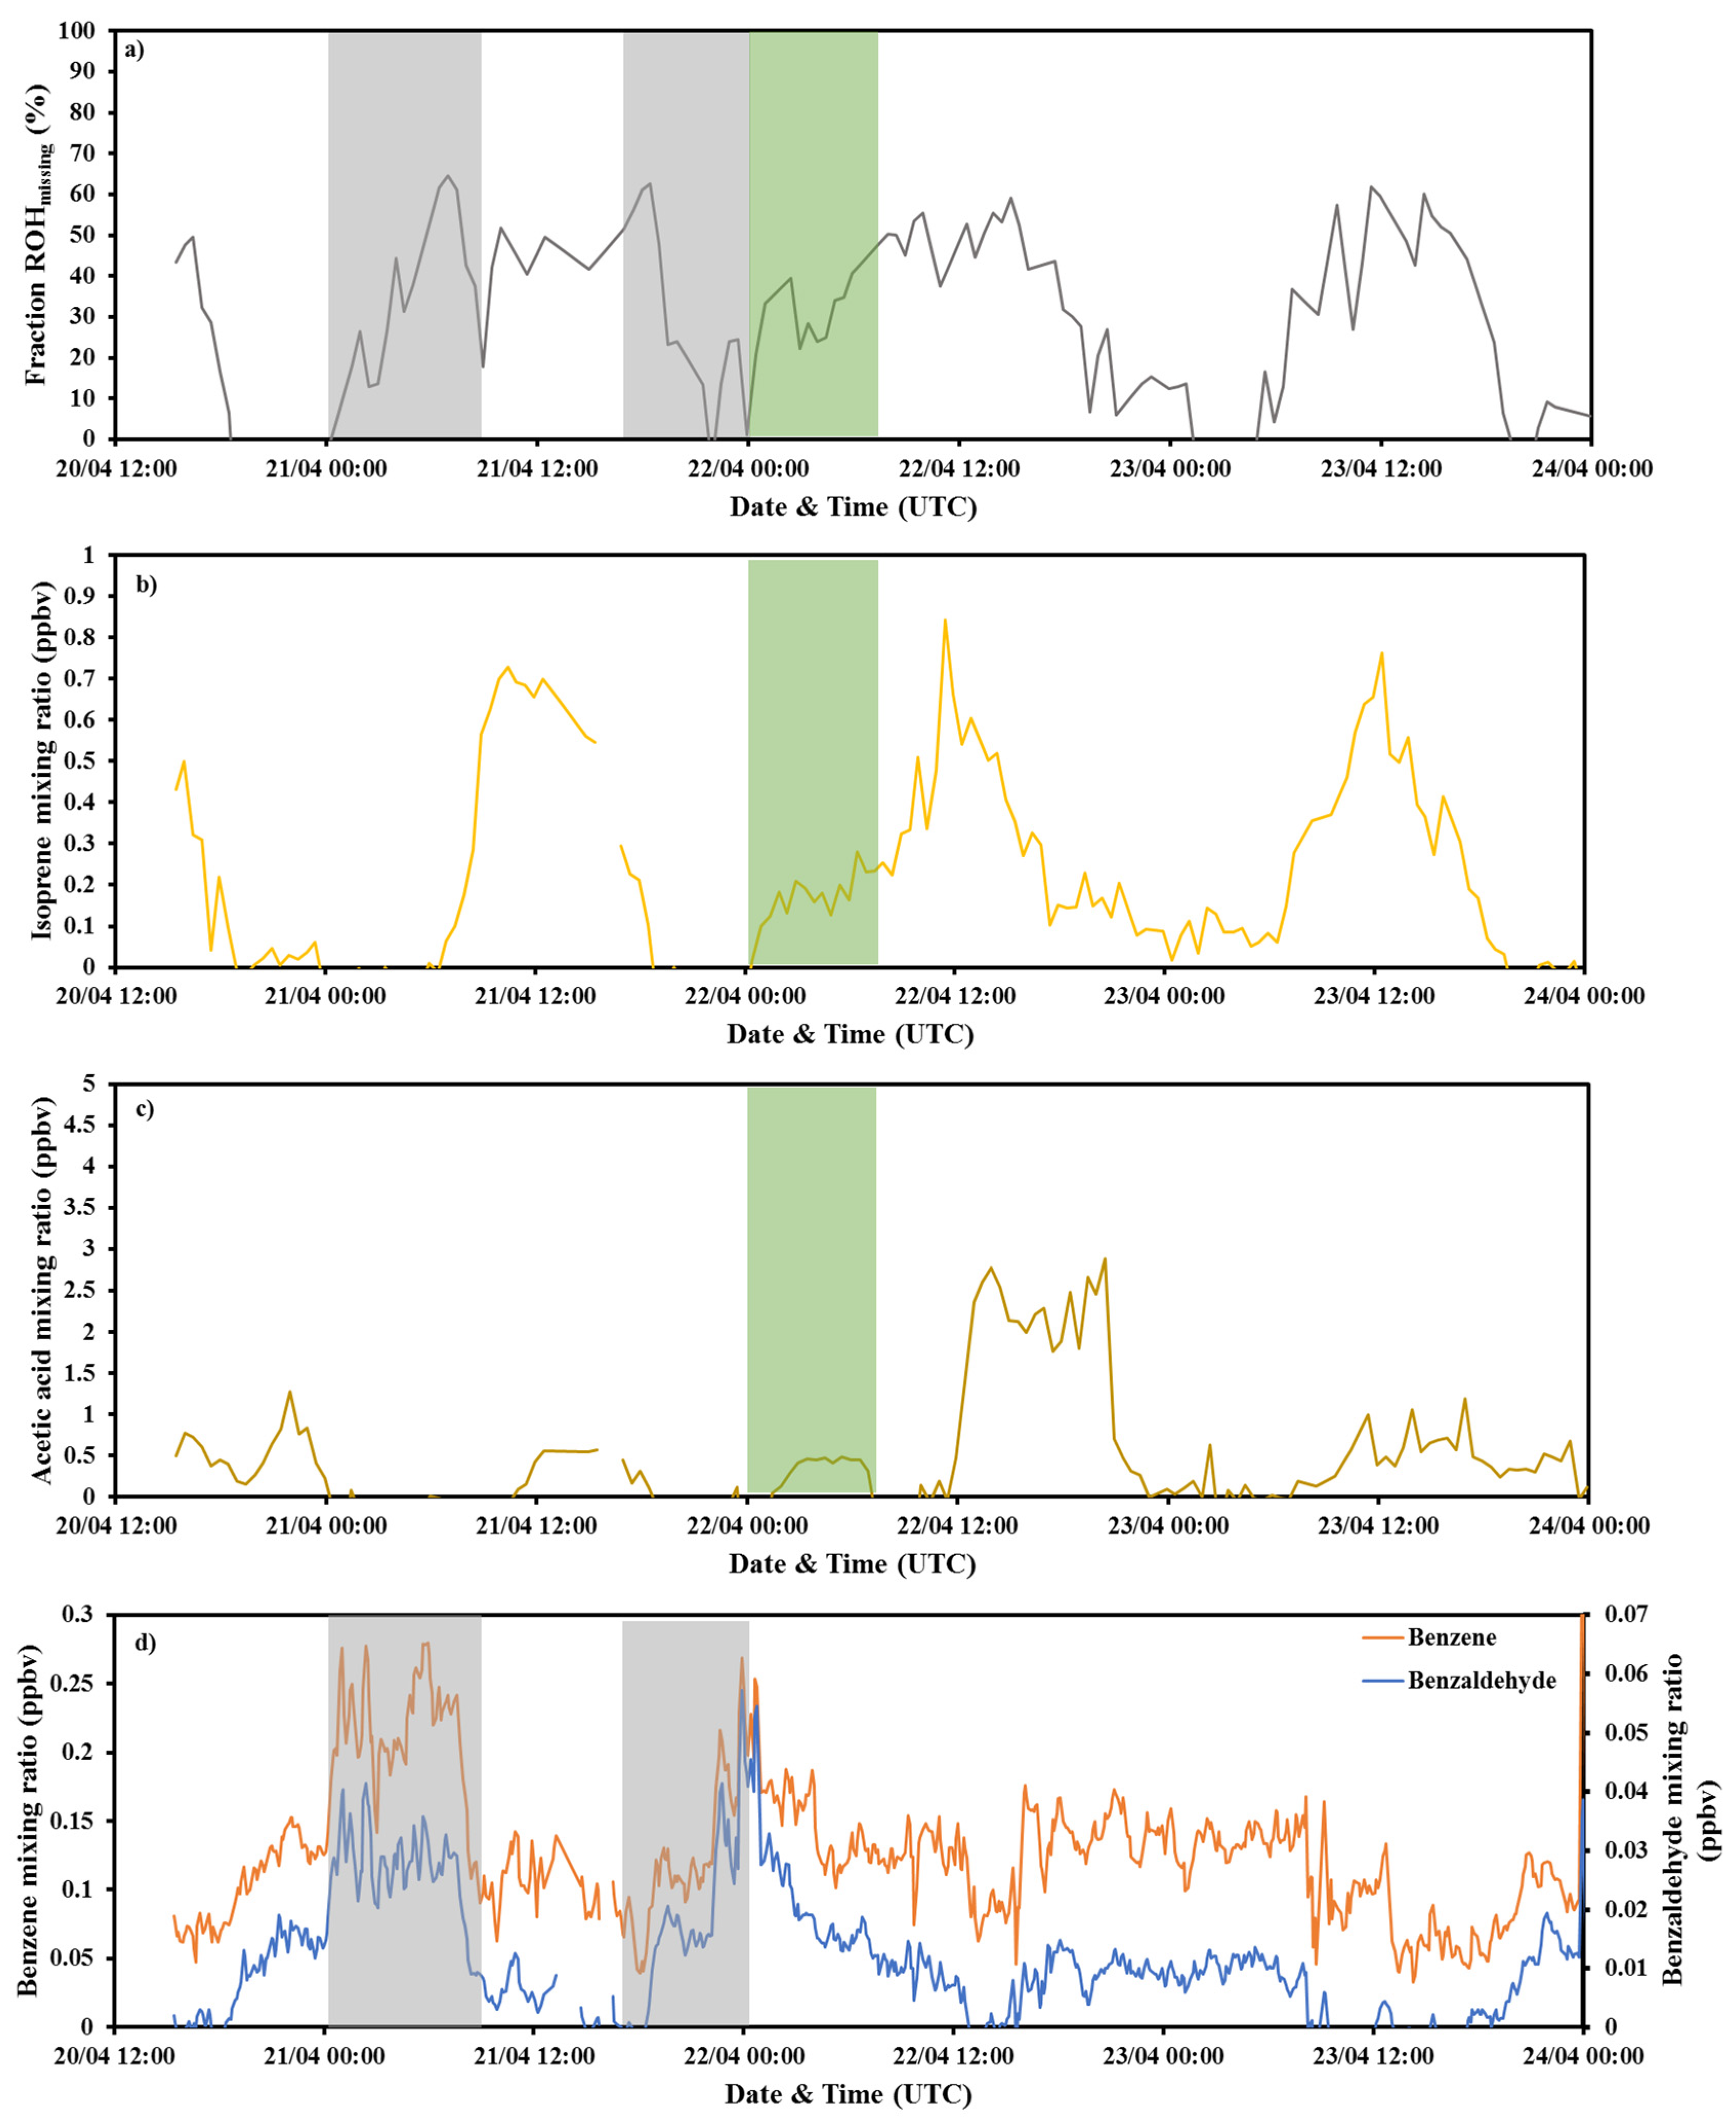
3.2. Investigation of the Missing OH Reactivity

The comparison between measured OH reactivity (mROHchamber) and the reactivity calculated by the sum of individually measured reactive compounds (cROHchamber) enabled us to assess the known reactive carbon budget and to determine the unaccounted for OH sink, known as missing OH reactivity (ROHmissing). Figure 5 shows the variability of mROHchamber and cROHchamber. Little or no missing OH reactivity was observed during the night, whereas a more important difference was seen around midday (mean midday missing OH reactivity ≈ 8 s−1), suggesting that this missing OH reactivity was mainly related to light- and/or temperature-dependent compounds either primarily emitted or secondarily formed in the chamber.
Among the approaches used to explore the origin of missing reactivity, one consists of correlating the missing OH reactivity with temperature (Figure 6). As such, we tried to fit the missing OH reactivity with the equation applied by Di Carlo et al. (2004) [63], adapted from the one normally used to describe temperature-dependent emissions of monoterpenes [64].
ROHmissing(T) = ROHmissing(293)exp(β(T-293)
with ROHmissing(T) and ROHmissing(293) representing the missing OH reactivity at a given temperature T(K) and 293 K, respectively, and β (K−1), the temperature sensitivity factor.
The β value obtained was around 0.14 K−1 with a correlation coefficient (R2) of 0.8. In other studies, β ranged between 0.054 and 1.144 K−1 suggesting that in this study the daytime missing OH reactivity may be related to temperature-dependent monoterpene-like emissions. Furthermore, missing OH reactivity moderately correlated with PAR, following an exponential relationship with an R2 of 0.7, which suggests that the missing OH reactivity may also be due to light-dependent emissions, although it is difficult to disentangle radiation and temperature effects in field conditions, since both are correlated by the energy balance of the plant.
Figure 5 also demonstrates the clear diurnal co-variability between cROHVOCsrapeseed (orange) and ROHmissing (the difference between the dashed line of mROHchamber and the sum of calculated OH reactivity of the individually measured species), with higher levels around midday, suggesting that primary biogenic VOCsrapeseed, whose emissions are driven by temperature and/or light, are potential candidates for the daytime missing OH reactivity.
Midday missing OH reactivity: In order to investigate the potential species behind the observed midday missing OH reactivity, we looked at the PTRQi-ToFMS masses that correlated up to 80% and more with isoprene. These correlations were done based on the fact that isoprene is a primary compound, which emission is known to be light- and temperature-dependent. As a result, 201 additional ions were investigated (Table S8). However, when it came to estimate their contribution to total OH reactivity, this list was reduced to only 9 masses which were tentatively identified and for which rate coefficients could be found (Table 4). Using their mixing ratios related to plant emissions (VOCsrapeseed), the selected 9 compounds exhibited a diurnal cycle with a maximum contribution of 1 to 1.2 s−1 around noon, and a negligible contribution during night hours (Figure 7). This observation is an evidence that midday missing OH reactivity can be related to unaccounted primary emitted compounds, but the identified compounds only explained a part of the missing reactivity (12% on average of midday missing OH reactivity). It is worth noting that, among the investigated ions (Table S8), m/z 41.038 was identified, as mentioned before (Section 2.5), as a potential fragment of isoprene. Considering its mixing ratio in the calculation of isoprene’s OH reactivity induces a maximum increase of 3 s−1 and an average increase of 1.9 s−1 around midday, it explains 24%, on average, of midday missing OH reactivity. Thus, this test (S9) should be kept in mind while calculating OH reactivity and investigating the missing OH reactivity.
Considering the masses that correlated 90% or more with m/z 69.070 (excluding the masses already investigated and mentioned in Table 2 and Table 4), their summed mixing ratios in the chamber air out ranged between the LOD and 0.8 ppbv. If all of them had a comparable reactivity to that of isoprene towards the hydroxyl radical, their contribution to total OH reactivity would reach a maximum of 2.1 s−1 and would explain 16% on average of midday missing OH reactivity. This contribution would reach a maximum of 0.02 s−1 only if all the investigated compounds had a reactivity comparable to that of methanol, explaining only 0.1% on average of midday missing OH reactivity. Regarding the masses that correlated between 80% and 90% with m/z 69.070, their summed mixing ratios accounted for a maximum of 2.7 ppbv, contributing up to 6.9 s−1 and 0.06 s−1, if all of them had a comparable reactivity to that of isoprene or methanol, respectively. These masses would explain up to 52% and only 0.5% on average of midday missing OH reactivity with a reactivity as high as that of isoprene or as low as that of methanol, respectively.
Other masses: Gonzaga Gomez et al. (2019) [27] reported the presence of other masses which were not necessarily observed in previous studies on brassica napus [25,62,71,72]. Among these masses, m/z 43.018 exhibited relatively large mixing ratios, reaching 5 ppbv. This observation is not surprising, knowing that this mass represents a fragment of several oxygenated compounds. This implies that the mixing ratios of some oxygenated compounds were underestimated, leading to an underestimation of the calculated OH reactivity. Based on an intercomparison exercise (Eurochamp, Orléans, 2019), in which the deployed PTRQi-ToFMS participated along with many other PTR-MS instruments, the fragmentation rates on m/z 43.018 on the deployed PTRQi-ToFMS were the following: acetone 3.4%, acetaldehyde 3.6%, acetic acid 20%, MVK 13% and MEK 1.0% (Lafouge F., personal communication). Taking these rates into account and correcting the mixing ratios of acetone, acetaldehyde, acetic acid and MEK for potential fragmentation in OH reactivity calculations increased the calculated OH reactivity by 0.05 s−1 maximum. This result highlights that not accounting for fragmentation that can occur on some oxygenated VOCs is not responsible for the observed missing OH reactivity.
Other missing OH reactivity events: In addition to midday missing OH reactivity, a higher missing OH reactivity was also observed in the early morning of the 21st of April (around 07:00 UTC) and in the beginning of the evening (around 18:00 UTC) as well as at midnight and during the night of the 22nd of April 2017 (Figure 8). Regarding the night of the 22nd April, higher night-time mixing ratios of some BVOCs in the chamber were recorded (i.e., isoprene), meaning that this event could be explained by unknown biogenic emissions from the plant. Interestingly, acetic acid, whose emission did not follow clearly temperature or light, also exhibited larger concentration levels during this night. Studies showed that acetic acid can be primary emitted by vegetation or generated from secondary reactions. Gonzaga Gomez et al. (2019) [27] reported emissions of acetic acid from rapeseed during the senescence period. Furthermore, Veromann et al. (2012) [71] reported higher acetic acid emissions from rapeseed after nitrogen fertilization, which could be the case in our experiment, since N-treatment was applied twice before the campaign. Seeing the relatively short residence time and the relatively rapid air renewal in the dynamic enclosure, the chances for acetic acid formation via secondary chemistry are low. These post N-treatment emissions could also be detected under several masses (Table S8) which were identified as N-containing compounds [73]. This includes m/z 100.074, m/z 116.074, m/z 124.117, m/z 138.059 and m/z 252.158, identified as C5H9NO, C5H9NO2, C8H13N, C7H7NO2 and C14H21NO3, respectively.
No specific behavior related to BVOCs emissions from the enclosed plant could explain the higher missing OH reactivity observed in the early morning of the 21st April (around 07:00 UTC) and in the beginning of the evening (around 18:00 UTC) as well as at midnight of the 22ndApril (Figure 8). However, investigating known anthropogenic VOCs, such as benzene (m/z 79.053) and benzaldehyde (m/z 107.049), detected with the PTRQi-ToFMS, demonstrated the higher ambient mixing ratios of these compounds during the mentioned events. Therefore, these events of missing OH reactivity could be mainly attributed to emissions of anthropogenic origin.

4. Conclusions

Hydroxyl radical reactivity, defined as the total loss rate of the hydroxyl radical in the atmosphere, has been shown to be an effective parameter to evaluate the loading of reactive species in ambient air. Despite the fact that total OH reactivity measurements have been performed in various environments, little has been done over agricultural ecosystems. This study presents the first characterization of total OH reactivity from rapeseed (Brassica napus) by means of a dynamic enclosure chamber during the blooming period in the Fr-Gri ICOS site, located in southwestern Paris during April 2017.
The average total OH reactivity measured from the dynamic chamber during the daytime was 15 ± 7 s−1, against 8 ± 3 s−1 during the night-time. The OH reactivity varied diurnally in a similar manner as BVOCs emissions, which were driven by temperature and/or light. Rapeseed emissions were dominated by oxygenated compounds, which is in agreement with some previous studies. However, in terms of OH reactivity, isoprene had the largest contribution during the day, followed by acetaldehyde and monoterpenes, whereas during the night, biogenic VOCs had a negligible contribution to OH reactivity. This provides the rationale to measure OH reactivity in addition to VOC abundance. No significant difference was observed between measured and calculated OH reactivity during night-time, whereas a missing fraction of up to 8 s−1 on average was observed around midday. During daytime, missing OH reactivity was exponentially correlated mainly to temperature but also to light. Further investigation of PTRQi-ToFMS masses suggested that daytime missing OH reactivity fraction is mostly related to primary emitted compounds, especially because the short residence time in the chamber (4 min) reduces the chances for secondary chemistry.
One main strength of this field experiment is to have carried out parallel measurements with the CRM and the PTRQi-ToFMS, which reflected the presence of unaccounted for reactive species. However, we were limited in terms of missing OH reactivity estimation, in particular due to challenges in identifying the chemical compounds behind the detected ions as well as their rate coefficients for the reaction with OH. This study demonstrated the need for coupling PTR-MS and GC techniques in order to identify the compounds behind the masses detected by the PTR-MS, especially when several possible compounds are suggested for the same molecular mass. Finally, it could be of great interest to perform more laboratory work aiming to broaden our knowledge on the gas-phase chemistry and kinetics of a wider variety of atmospheric compounds with the hydroxyl radical, such as for some N-containing compounds (C5H9NO, C5H9NO2, C8H13N and C7H7NO2), which exhibited a diurnal cycle in the chamber air out.
Our work highlights that the studied rapeseed crop is a relatively low contributor to the amount of reactive species released in the atmosphere, and a relatively low contributor to total OH chemistry compared to forest ecosystems. If this is confirmed, this may mean that the expansion of bioenergy crops, like rapeseed, may have a limited impact on atmospheric OH chemistry. We should bear in mind, though, that bioenergy crop production has other impacts on the atmosphere and terrestrial ecosystems through ammonia and nitrous oxide emissions or nitrate leaching, and represent critical food security issues.

Supplementary Materials

The following are available online at https://www.mdpi.com/2073-4433/11/3/261/s1, Figure S1a. Linear least square fit of ΔC2 (ppbv) vs. Δ(m37/m19) for the tests conducted on the field to assess the correction for humidity differences between C2 and C3. Green dots and red dots correspond to tests performed with ambient air and outgoing chamber air, respectively, Figure S1b. Experimental parameterization to correct for the NO interference, representing changes in C3 (ΔC3 ppb = C3expected − C3measured) as function of NO mixing ratios (ppbv) in the reactor, Figure S1c. Measured ROH vs. the theoretical ROH for propane and isoprene, introduced at different concentrations and under different pyrrole/OH ratios. Circles and diamonds correspond to propane and isoprene tests, respectively, Figure S2. Schematic of the CRM/PTR-MS sampling system, Table S3. Standard Ionicon transmission curve used for computing the mixing ratio, Figure S4. Rapeseed branch evolution in the dynamic enclosure. The left vertical axis represents the length of the stem, total leaves and total flowers (in cm). The right vertical axis represents the percentage of open flowers. The red line indicates the day when the chamber was re-installed after the planned fungicide application, Figure S5. Temperature recorded inside the dynamic chamber (yellow) and in ambient air (green) during the measurement period between the 20th and the 23rd, April 2017, Figure S6.a. Variability of NOx (NO, NO2), CO, CH4, propane, propene, acetaldehyde and acetone in ambient air, with wind direction and wind speed, Figure S6.b. Variability of calculated OH reactivity of NOx, CO, CH4, total HCs C2-C6 and total VOCsambient (PTRQi-ToFMS), Figure S7. Variability of calculated OH reactivity of some biogenic VOCs emitted by the rapeseed plant (VOCsrapeseed = VOCschamber − VOCsambient), Table S8. List of the 201 masses that correlate for 80 % and more with isoprene (m/z 69.070), Figure S9. Variability of calculated OH reactivity using PTR-MS data with a correction of the isoprene signal (m/z 69.070) by a factor of 1.3 (blue) and by summing the m/z 69.070 with the potential fragment on m/z 41.038 (yellow).

Author Contributions

Methodology S.B., F.T. and R.S.-E. for the CRM-PTRMS, V.G. and D.B. for the GC-FID, F.L., R.C., L.G.G. and B.L. for PTRQi-ToFMS, P.B. for the NOx measurements and meteorological data, C.B. for the dynamic chamber, F.T. for CO measurements; formal analysis, S.B., F.T., V.G., F.L., R.C., P.B., J.K., L.G.G. and B.L., data curation, S.B., F.T., F.L. and B.L.; writing—original draft preparation, S.B.; writing—review and editing, S.B., V.G., B.L., C.B., N.Z., J.K., R.C., P.B.; supervision, V.G.; project administration, B.L.; funding acquisition, B.L. All authors have read and agreed to the published version of the manuscript.

Funding

This research was funded by ADEME (COV3ER, n°1562C0032) project.

Acknowledgments

The authors acknowledge the European Union’s Horizon 2020 research and innovation program under the Marie-Sklodowska-Curie grant agreement No 674911-IMPACT, the EU ICOS Research Infrastructure, ANAEE-FR services (ANR project n°11-INBS-0001) which provided the PTR-TOF-MS, the CNRS and the CEA. We gratefully thank Dominique Tristant and Yves Python from AgroParisTech farm for giving access to their fields. We would also like to thank S. Assan and F. Vogel for the methane data.

Conflicts of Interest

The authors declare no conflict of interest. The funders had no role in the design of the study; in the collection, analyses, or interpretation of data; in the writing of the manuscript, or in the decision to publish the results.

Data Availability

Data are available upon request from the corresponding author.

References

  1. Goldstein, A.H.; Galbally, I.E. Known and unexplored organic constituents in the earth’s atmosphere. Environ. Sci. Technol. 2007, 41, 1514–1521. [Google Scholar] [CrossRef] [Green Version]
  2. Guenther, A. A global model of natural volatile organic compound emissions. J. Geophys. Res. 1995, 100, 8873–8892. [Google Scholar] [CrossRef]
  3. Helmig, D.; Bottenheim, J.; Galbally, I.E.; Lewis, A.; Milton, M.J.; Penkett, S.; Plass-Duelmer, C.; Reimann, S.; Tans, P.; Thiel, S. Volatile Organic Compounds in the Global Atmosphere. Eos (Washington. DC) 2009, 90, 513–514. [Google Scholar] [CrossRef] [Green Version]
  4. De Gouw, J.; Warneke, C. Measurements of volatile organic compounds in the earth’s atmosphere using proton-transfer-reaction mass spectrometry joost. Reprod. Hum. Horm. 2007, 26, 223–257. [Google Scholar]
  5. Laothawornkitkul, J.; Taylor, J.E.; Paul, N.D.; Hewitt, C.N. Biogenic volatile organic compounds in the Earth system: Tansley review. New Phytol. 2009, 183, 27–51. [Google Scholar] [CrossRef]
  6. Seigler, D.S. Chemistry and mechanisms of allelopathic interactions. Agron. J. 1996, 88, 876–886. [Google Scholar] [CrossRef]
  7. Kesselmeier, J.; Staudt, M. Biogenic volatile organic compounds (VOC): An overview on emission, physiology and ecology. J. Atmos. Chem. 1999, 33, 23–88. [Google Scholar] [CrossRef]
  8. Penuelas, J.; Llusia, J. The complexity of factors driving volatile organic compound emissions by plants. Biol. Plant. 2001, 44, 481–487. [Google Scholar] [CrossRef]
  9. Guenther, A. Biological and chemical diversity of biogenic volatile organic emissions into the atmosphere. ISRN Atmos. Sci. 2013, 2013, 1–27. [Google Scholar] [CrossRef]
  10. Williams, J.; Brune, W. A roadmap for OH reactivity research. Atmos. Environ. 2015, 106, 371–372. [Google Scholar] [CrossRef]
  11. Fuchs, H.; Novelli, A.; Rolletter, M.; Hofzumahaus, A.; Pfannerstill, E.Y.; Kessel, S.; Edtbauer, A.; Williams, J.; Michoud, V.; Dusanter, S.; et al. Comparison of OH reactivity measurements in the atmospheric simulation chamber SAPHIR. Atmos. Meas. Tech. 2017, 10, 4023–4053. [Google Scholar] [CrossRef] [Green Version]
  12. Yang, Y.; Shao, M.; Wang, X.; Nölscher, A.C.; Kessel, S.; Guenther, A.; Williams, J. Towards a quantitative understanding of total OH reactivity: A review. Atmos. Environ. 2016, 134, 147–161. [Google Scholar] [CrossRef]
  13. Karl, M.; Guenther, A.; Köble, R.; Seufert, G.; Leip, A.; Seufert, G. A new European plant-specific emission inventory of biogenic volatile organic compounds for use in atmospheric transport models. Biogeosciences Discuss. 2009, 5, 4993–5059. [Google Scholar] [CrossRef] [Green Version]
  14. Ren, X.; Brune, W.H.; Cantrell, C.A.; Edwards, G.D.; Shirley, T.; Metcalf, A.R.; Lesher, R.L. Hydroxyl and peroxy radical chemistry in a rural area of Central Pennsylvania: Observations and model comparisons. J. Atmos. Chem. 2005, 52, 231–257. [Google Scholar] [CrossRef]
  15. Lou, S.; Holland, F.; Rohrer, F.; Lu, K.; Bohn, B.; Brauers, T.; Chang, C.C.; Fuchs, H.; Häseler, R.; Kita, K.; et al. Atmospheric OH reactivities in the Pearl River Delta-China in summer 2006: Measurement and model results. Atmos. Chem. Phys. 2010, 10, 11243–11260. [Google Scholar] [CrossRef] [Green Version]
  16. Chameides, W.; Lindsay, R.W.; Richardson, J.; Kiang, C.S. The role of biogenic hydrocarbons in urban photochemical smog: Atlanta as a case study. Science 1988, 1473–1475. [Google Scholar] [CrossRef]
  17. Kim, S.; Guenther, A.; Karl, T.; Greenberg, J. Contributions of primary and secondary biogenic VOC tototal OH reactivity during the CABINEX (Community Atmosphere-Biosphere INteractions Experiments)-09 field campaign. Atmos. Chem. Phys. 2011, 11, 8613–8623. [Google Scholar] [CrossRef] [Green Version]
  18. Nölscher, A.C.; Bourtsoukidis, E.; Bonn, B.; Kesselmeier, J.; Lelieveld, J.; Williams, J. Seasonal measurements of total OH reactivity emission rates from Norway spruce in 2011. Biogeosciences 2013, 10, 4241–4257. [Google Scholar] [CrossRef] [Green Version]
  19. FAOSTAT. Available online: http://www.fao.org/faostat/en/#data/EL/visualize (accessed on 4 December 2020).
  20. Tilman, D.; Balzer, C.; Hill, J.; Befort, B.L. Global food demand and the sustainable intensification of agriculture. Proc. Natl. Acad. Sci. USA 2011, 108, 20260–20264. [Google Scholar] [CrossRef] [Green Version]
  21. Rodionova, M.V.; Poudyal, R.S.; Tiwari, I.; Voloshin, R.A.; Zharmukhamedov, S.K.; Nam, H.G.; Zayadan, B.K.; Bruce, B.D.; Hou, H.J.M.; Allakhverdiev, S.I. Biofuel production: Challenges and opportunities. Int. J. Hydrogen Energy 2017, 42, 8450–8461. [Google Scholar] [CrossRef]
  22. De Bouille, P.; Sotta, B.; Miginiac, E.; Merrien, A. Hormones and pod development in oilseed rape (brassica napus). Plant. Physiol. 1989, 90, 876–880. [Google Scholar] [CrossRef] [Green Version]
  23. McEwan, M.; Macfarlane Smith, W.H. Identification of volatile organic compounds emitted in the field by oilseed rape (Brassica napus ssp. oleifera) over the growing season. Clin. Exp. Allergy 1998, 28, 332–338. [Google Scholar] [CrossRef]
  24. Agreste, La Statistique, L’évaluation et la Prospective Agricole du Ministère de L’agriculture et de L’alimentation, Produits Agroalimentaires. Available online: https://agreste.agriculture.gouv.fr/agreste-web/download/publication/publie/GraFraChap12.1/Graf1941%20-%20COP.pdf (accessed on 4 December 2020).
  25. Müller, K.; Pelzing, M.; Gnauk, T.; Kappe, A.; Teichmann, U.; Spindler, G.; Haferkorn, S.; Jahn, Y.; Herrmann, H. Monoterpene emissions and carbonyl compound air concentrations during the blooming period of rape (Brassica napus). Chemosphere 2002, 49, 1247–1256. [Google Scholar] [CrossRef]
  26. Parratt, D.; Smith, W.M.; Thomson, G.; Cameron, L.A.; Butcher, R.D. Evidence that oilseed rape (brassica napus ssp. oleifera) causes respiratory illness in rural dwellers. Scottich Med. J. 1995, 40, 74–76. [Google Scholar] [CrossRef]
  27. Gomez, L.G.; Loubet, B.; Lafouge, F.; Ciuraru, R.; Buysse, P.; Durand, B.; Gueudet, J.C.; Fanucci, O.; Fortineau, A.; Zurfluh, O.; et al. Comparative study of biogenic volatile organic compounds fluxes by wheat, maize and rapeseed with dynamic chambers over a short period in northern France. Atmos. Environ. 2019, 214, 116855. [Google Scholar] [CrossRef]
  28. Vuolo, M.R.; Loubet, B.; Mascher, N.; Gueudet, J.C.; Durand, B.; Laville, P.; Zurfluh, O.; Ciuraru, R.; Stella, P.; Trebs, I. Nitrogen oxides and ozone fluxes from an oilseed-rape management cycle: The influence of cattle slurry application. Biogeosciences 2017, 14, 2225–2244. [Google Scholar] [CrossRef] [Green Version]
  29. Loubet, B.; Decuq, C.; Personne, E.; Massad, R.S.; Flechard, C.; Fanucci, O.; Mascher, N.; Gueudet, J.C.; Masson, S.; Durand, B.; et al. Investigating the stomatal, cuticular and soil ammonia fluxes over a growing tritical crop under high acidic loads. Biogeosciences 2012, 9, 1537–1552. [Google Scholar] [CrossRef] [Green Version]
  30. Laufs, S.; Cazaunau, M.; Stella, P.; Kurtenbach, R.; Cellier, P.; Mellouki, A.; Loubet, B.; Kleffmann, J. Diurnal fluxes of HONO above a crop rotation. Atmos. Chem. Phys. 2017, 17, 6907–6923. [Google Scholar] [CrossRef] [Green Version]
  31. Genard-Zielinski, A.C.; Boissard, C.; Fernandez, C.; Kalogridis, C.; Lathière, J.; Gros, V.; Bonnaire, N.; Ormeño, E. Variability of BVOC emissions from a Mediterranean mixed forest in southern France with a focus on Quercus pubescens. Atmos. Chem. Phys. 2015, 15, 431–446. [Google Scholar] [CrossRef] [Green Version]
  32. ICOS. Ecosystem Thematic Center, Documents. Available online: http://www.icos-etc.eu/icos/documents/ (accessed on 4 December 2020).
  33. Sinha, V.; Williams, J.; Crowley, J.N.; Lelieveld, J. The comparative reactivity method-A new tool to measure total OH Reactivity in ambient air. Atmos. Chem. Phys. 2008, 8, 2213–2227. [Google Scholar] [CrossRef] [Green Version]
  34. Atkinson, R. Kinetics and mechanisms of the gas-phase reactions of the hydroxyl radical with organic compounds under atmospheric conditions. Chem. Rev. 1985, 85, 69–201. [Google Scholar] [CrossRef]
  35. Michoud, V.; Hansen, R.F.; Locoge, N.; Stevens, P.S.; Dusanter, S. Detailed characterizations of the new Mines Douai comparative reactivity method instrument via laboratory experiments and modeling. Atmos. Meas. Tech. 2015, 8, 3537–3553. [Google Scholar] [CrossRef] [Green Version]
  36. Praplan, A.P.; Pfannerstill, E.Y.; Williams, J.; Hellén, H. OH reactivity of the urban air in Helsinki, Finland, during winter. Atmos. Environ. 2017, 169, 150–161. [Google Scholar] [CrossRef]
  37. Zannoni, N.; Dusanter, S.; Gros, V.; Sarda Esteve, R.; Michoud, V.; Sinha, V.; Locoge, N.; Bonsang, B. Intercomparison of two comparative reactivity method instruments in the Mediterranean basin during summer 2013. Atmos. Meas. Tech. 2015, 8, 3851–3865. [Google Scholar] [CrossRef] [Green Version]
  38. Zannoni, N. OH Reactivity Measurements in the Mediterranean Region. Ph.D. Thesis, Paris-Saclay University, Paris, Ile-de-France, France, 2015. [Google Scholar]
  39. Abis, L.; Loubet, B.; Ciuraru, R.; Lafouge, F.; Dequiedt, S.; Houot, S.; Maron, P.A.; Bourgeteau-Sadet, S. Profiles of volatile organic compound emissions from soils amended with organic waste products. Sci. Total Environ. 2018, 636, 1333–1343. [Google Scholar] [CrossRef]
  40. Sulzer, P.; Hartungen, E.; Hanel, G.; Feil, S.; Winkler, K.; Mutschlechner, P.; Haidacher, S.; Schottkowsky, R.; Gunsch, D.; Seehauser, H.; et al. A proton transfer reaction-quadrupole interface time-of-flight mass spectrometer (PTR-QiTOF): High speed due to extreme sensitivity. Int. J. Mass Spectrom. 2014, 368, 1–5. [Google Scholar] [CrossRef]
  41. Pang, X. Biogenic volatile organic compound analyses by PTR-TOF-MS: Calibration, humidity effect and reduced electric field dependency. J. Environ. Sci. (China) 2015, 32, 196–206. [Google Scholar] [CrossRef]
  42. Tani, A.; Hayward, S.; Hewitt, C.N. Measurement of monoterpenes and related compounds by proton transfer reaction-mass spectrometry (PTR-MS). Int. J. Mass Spectrom. 2003, 223, 561–578. [Google Scholar] [CrossRef]
  43. Holzinger, R.; Acton, W.J.F.; Bloss, W.J.; Breitenlechner, M.; Crilley, L.R.; Dusanter, S.; Gonin, M.; Gros, V.; Keutsch, F.N.; Kiendler-Scharr, A.; et al. Validity and limitations of simple reaction kinetics to calculate concentrations of organic compounds from ion counts in PTR-MS. Atmos. Meas. Tech. Discuss. 2019, 1, 1–29. [Google Scholar] [CrossRef] [Green Version]
  44. Gros, V.; Gaimoz, C.; Herrmann, F.; Custer, T.; Williams, J.; Bonsang, B.; Sauvage, S.; Locoge, N.; d’Argouges, O.; Sarda-Estève, R.; et al. Volatile organic compounds sources in Paris in spring 2007. Part I: Qualitative analysis. Environ. Chem. 2011, 8, 74. [Google Scholar] [CrossRef]
  45. Assan, S.; Baudic, A.; Guemri, A.; Ciais, P.; Gros, V.; Vogel, F.R. Characterization of interferences to in situ observations of δ13 CH4 and C2H6 when using a cavity ring-down spectrometer at industrial sites. Atmos. Meas. Tech. 2017, 10, 2077–2091. [Google Scholar] [CrossRef] [Green Version]
  46. Warneke, C.; Veres, P.; Holloway, J.S.; Stutz, J.; Tsai, C.; Alvarez, S.; Rappenglueck, B.; Fehsenfeld, F.C.; Graus, M.; Gilman, J.B.; et al. Airborne formaldehyde measurements using PTR-MS: Calibration, humidity dependence, inter-comparison and initial results. Atmos. Meas. Tech. Discuss. 2011, 4, 4631–4665. [Google Scholar] [CrossRef]
  47. Atkinson, R.; Aschmann, S.M.; Arey, J. Rate constants for the gas-phase reactions of OH and NO3 radicals and O3 with sabinene and camphene at 296 ± 2 K. Atmos. Environ. Part. A, Gen. Top. 1990, 24, 2647–2654. [Google Scholar] [CrossRef]
  48. Atkinson, R.; Aschmann, S.M.; Pitts Jr, J.N. Rate constants for the gas-phase reactions of the OH radical with a series of monoterpenes at 294 ± 1 K. Int. J. Chem. Kinet. 1986, 18, 287–299. [Google Scholar] [CrossRef]
  49. Scala, A.; Allmann, S.; Mirabella, R.; Haring, M.A.; Schuurink, R.C. Green leaf volatiles: A plant’s multifunctional weapon against herbivores and pathogens. Int. J. Mol. Sci. 2013, 14, 17781–17811. [Google Scholar] [CrossRef] [PubMed] [Green Version]
  50. Atkinson, R.; Baulch, D.L.; Cox, R.A.; Crowley, J.N.; Hampson, R.F.; Hynes, R.G.; Jenkin, M.E.; Rossi, M.J.; Troe, J. Evaluated kinetic and photochemical data for atmospheric chemistry: Volume II–gas phase reactions of organic species. Atmos. Chem. Phys. 2006, 6, 3625–4055. [Google Scholar] [CrossRef] [Green Version]
  51. Atkinson, R.; Baulch, D.L.; Cox, R.A.; Crowley, J.N.; Hampson, R.F.; Hynes, R.G.; Jenkin, M.E.; Rossi, M.J.; Troe, J. Evaluated kinetic and photochemical data for atmospheric chemistry: Part 1–gas phase reactions of Ox, HOx, NOx and SOx species. Atmos. Chem. Phys. Discuss. 2003, 3, 6179–6699. [Google Scholar] [CrossRef] [Green Version]
  52. Peeters, J.; Boullart, W.; Pultau, V.; Vandenberk, S.; Vereecken, L. Structure-activity relationship for the addition of OH to (poly)alkenes: Site-specific and total rate constants. J. Phys. Chem. A 2007, 111, 1618–1631. [Google Scholar] [CrossRef]
  53. Bignozzi, C.A.; Maldotti, A.; Chiorboli, C.; Bartocci, C.; Carassiti, V. Kinetics and mechanism of reactions between aromatic olefins and hydroxyl radicals. Int. J. Chem. Kinet. 1981, 13, 1235–1242. [Google Scholar] [CrossRef]
  54. Wilson, W.A.; Hamilton, H.R.; Kennington, B.; Evans, N.W.S.; Demore, W.B. Measurement and estimation of rate constants for the reactions of hydroxyl radical with several alkanes and cycloalkanes. J. Phys. Chem. A 2006, 110, 3593–3604. [Google Scholar] [CrossRef]
  55. Sivaramakrishnan, R.; Michael, J.V. Rate constants for OH with selected large alkanes: Shock-tube measurements and an improved group scheme. J. Phys. Chem. A 2009, 113, 5047–5060. [Google Scholar] [CrossRef] [PubMed]
  56. Grosjean, D.; William, L.E. Environmental persistence of organic compounds estimated from structure-reactivity and linear free-energy relationships. Unsaturated aliphatics. Atmos. Environ. Part. A Gen. Top. 1992, 26, 1395–1405. [Google Scholar] [CrossRef]
  57. Atkinson, R.; Arey, J. Gas-phase tropospheric chemistry of biogenic volatile organic compounds: A review. Atmos. Environ. 2003, 37, 197–219. [Google Scholar] [CrossRef]
  58. Bsaibes, S.; Al Ajami, M.; Mermet, K.; Truong, F.; Batut, S.; Hecquet, C.; Dusanter, S.; Léornadis, T.; Sauvage, S.; Kammer, J.; et al. Variability of hydroxyl radical (OH) reactivity in the Landes maritime pine forest: Results from the LANDEX campaign 2017. Atmos. Chem. Phys. 2020, 20, 1277–1300. [Google Scholar] [CrossRef] [Green Version]
  59. Edwards, P.M.; Evans, M.J.; Furneaux, K.L.; Hopkins, J.; Ingham, T.; Jones, C.; Lee, J.D.; Lewis, A.C.; Moller, S.J.; Stone, D.; et al. OH reactivity in a South East Asian tropical rainforest during the oxidant and particle photochemical processes (OP3) project. Atmos. Chem. Phys. 2013, 13, 9497–9514. [Google Scholar] [CrossRef] [Green Version]
  60. Ingham, T.; Goddard, A.; Whalley, L.K.; Furneaux, K.L.; Edwards, P.M.; Seal, C.P.; Self, D.E.; Johnson, G.P.; Read, K.A.; Lee, J.D.; et al. A flow-tube based laser-induced fluorescence instrument to measure OH reactivity in the troposphere. Atmos. Meas. Tech. 2009, 2, 465–477. [Google Scholar] [CrossRef] [Green Version]
  61. Font, X.; Artola, A.; Sánchez, A. Detection, composition and treatment of volatile organic compounds from waste treatment plants. Sensors 2011, 11, 4043–4059. [Google Scholar] [CrossRef] [Green Version]
  62. König, G.; Brunda, M.; Puxbaum, H.; Hewitt, C.N.; Duckham, S.C.; Rudolph, J. Relative contribution of oxygenated hydrocarbons to the total biogenic VOC emissions of selected mid-European agricultural and natural plant species. Atmos. Environ. 1995, 29, 861–874. [Google Scholar] [CrossRef]
  63. Di Carlo, P.; Brune, W.H.; Martinez, M.; Harder, H.; Lesher, R.; Ren, X.; Thornberry, T.; Carroll, M.A.; Young, V.; Shepson, P.B.; et al. Missing OH Reactivity in a Forest: Evidence for Unknown Reactive Biogenic VOCs. Science 2004, 304, 722–725. [Google Scholar] [CrossRef]
  64. Guenther, A.B.; Zimmerman, P.R.; Harley, P.C.; Monson, R.K.; Fall, R. Isoprene and monoterpene emission rate variability: Model evaluations and sensitivity analyses. J. Geophys. Res. 1993, 98, 12609. [Google Scholar] [CrossRef] [Green Version]
  65. D’Anna, B.; Andresen; Gefen, Z.; Nielsen, C.J. Kinetic study of OH and NO3 radical reactions with 14 aliphatic aldehydes. Phys. Chem. Chem. Phys. 2001, 3, 3057–3063. [Google Scholar]
  66. Darnall, R.K.; Winer, A.M.; Lloyd, A.C.; Pitts, J.N. Relative rate constants for the reaction of OH radicals with selected C6 and C7 alkanes and alkenes at 305 ± 2 K. Chem. Phys. Lett. 1976, 44, 415–418. [Google Scholar] [CrossRef]
  67. Kwok, E.S.C.; Atkinson, R.; Arey, J. Kinetics of the gas-phase reactions of indan, indene, fluorene, and 9, 10-dihydroanthracene with OH radicals, NO3 radicals, and O3. Int. J. Chem. Kinet. 1997, 29, 299–308. [Google Scholar] [CrossRef]
  68. Chiorboll, C.A.; Bignozzi, A.; Maldotti, P.F.; Giardini, A.R. Rate constants for the gas-phase reactions of OH radicals with β-dimethylstyrene and acetone. Mechanism of β-dimethylstyrene NOx-air photooxidation. Int. J. Chem. Kinet. 1983, 15, 579–586. [Google Scholar] [CrossRef]
  69. Phousongphouang, P.T.; Arey, J. Rate constants for the gas-phase reactions of a series of alkylnaphthalenes with the OH radical. Environ. Sci. Technol. 2002, 36, 1947–1952. [Google Scholar] [CrossRef] [PubMed]
  70. Atkinson, R.; Tuazon, E.; Aschmann, S. Atmospheric chemistry of 2-Pentanone and 2-Heptanone. Environ. Sci. Technol. 2000, 34, 623–631. [Google Scholar] [CrossRef]
  71. Veromann, E.; Toome, M.; Kännaste, A.; Kaasik, R.; Copolovici, L.; Flink, J.; Kovács, G.; Narits, L.; Luik, A.; Niinemets, Ü. Effects of nitrogen fertilization on insect pests, their parasitoids, plant diseases and volatile organic compounds in Brassica napus. Crop. Prot. 2013, 43, 79–88. [Google Scholar] [CrossRef]
  72. Morrison, E.C.; Drewer, J.; Heal, M.R. A comparison of isoprene and monoterpene emission rates from the perennial bioenergy crops short-rotation coppice willow and Miscanthus and the annual arable crops wheat and oilseed rape. GCB Bioenergy 2016, 8, 211–225. [Google Scholar] [CrossRef] [Green Version]
  73. Kammer, J.; Décuq, C.; Baisnée, D.; Ciuraru, R.; Lafouge, F.; Buysse, P.; Bsaibes, S.; Henderson, B.; Cristescu, S.M.; Benabdallah, R.; et al. Characterization of the particle and gaseous pollutants emissions from a French dairy and sheep farm. Sci. Total Environ. 2019, 712, 135598. [Google Scholar] [CrossRef]
Figure 1. Satellite image of Grignon farm, the surrounding area and the chamber used for this study.
Atmosphere 11 00261 g001
Figure 2. Schematic representation of the system used for the measurements in the incoming and the outgoing chamber air. mROHambient and mROHchamber stand for measured OH reactivity in the incoming and the outgoing air, respectively. cROHambient and cROHchamber represent the calculated OH reactivity in the incoming and the outgoing chamber air, respectively. cROHrapeseed is calculated using VOCsrapeseed, determined from VOCschamber − VOCsambient (both measured with the PTRQi-ToFMS).
Atmosphere 11 00261 g002
Figure 3. Variability of (a) ΔmROH = mROHchamber − mROHambient and (b) total mROHchamber (blue dots represent the original OH reactivity data and black dots represent the trend obtained after smoothing the original data) and total mROHambient (red dots) from the 20th to the 23rd April 2017 with temperature (T (°C), yellow), (c) photosynthetic active radiation (PAR μmol m−2 s−1, purple) and relative humidity (RH%, light blue), all three parameters measured inside the chamber.
Atmosphere 11 00261 g003
Figure 4. Averaged diurnal variation of (a) the mixing ratio of each biogenic volatile organic compound (BVOC) measured with the PTRQi-ToFMS (ppbv) and (b) their contribution to OH reactivity (s−1).
Atmosphere 11 00261 g004
Figure 5. mROHchamber and cROHchamber from individual calculated ROH of VOCs (PTR-MS), VOCs (GC-FID), NOx, CH4 and CO summed up and the resulting missing ROH.
Atmosphere 11 00261 g005
Figure 6. Variability of missing OH reactivity as function of air temperature in the chamber. The regression curve equation is ROHmissing = 0.23exp(0.14(T)) (R2 = 0.8).
Atmosphere 11 00261 g006
Figure 7. Summed calculated OH reactivity of the 9 additionally selected compounds. The mixing ratios used for the calculation correspond to the ones from the rapeseed branch (VOCsrapeseed) and the ki-OH are the ones mentioned in Table 4.
Atmosphere 11 00261 g007
Figure 8. (a) Variability of relative missing OH reactivity (ROHmissing/mROHchamber) with (b) Isoprene (rapeseed), (c) Acetic acid (rapeseed) and (d) Benzene (orange) and Benzaldehyde (blue) in ambient air. Green areas indicate missing OH reactivity mainly due to biogenic emissions and grey areas indicate missing OH mainly linked to anthropogenic emissions.
Atmosphere 11 00261 g008
Table 1. Instruments deployed in the campaign and used for data analysis.
TechniqueMeasurementTime Resolution
CRMTotal OH Reactivity (ROH)10 min
PTRQi-ToFMSVOCs
Formaldehyde, Methanol, Acetaldehyde, Butanol, Acetone, Acetic acid, Isoprene, MethylEthylKetone (MEK), Hexadiene/ GLV, Styrene, Monoterpenes
0.1 s
GC-FIDC2–C6 HCs
Alkanes: Ethane, Propane, i-butane, n-butane, i-pentane, n-pentane, 2-methylpentane, n-hexane
Alkenes: Ethene, Propene, Trans-2-butene, 1-butene, i-butene, Cis-2-butene, 1,3-butadiene, Trans-2-pentene, 1-pentene
Alkynes: Acetylene
30 min
NO-NO2-NOx chemiluminescence analyzerNO, NO21 min
G2201-i PicarroCH41 min
48i-TL, thermo-EnvironnementCO1 min
Table 2. List of selected compounds used for OH reactivity calculations with their respective ki-OH at 298 K and 1 atm.
MeasurementsProtonated Theoretical MassChemical CompoundNameRate Constant (× 10−12 cm3 molecule−1 s−1)Ref.
PTRQi-ToFMS protonated massesm31.018(CH2O)H+Formaldehyde8.5[50]
m33.033(CH3OH)H+Methanol0.9[50]
m45.033(CH3CHO)H+Acetaldehyde15[50]
m57.069(C4H8)H+Butanol fragment8.5[50]
m59.049(C3H6O)H+Acetone0.18[50]
m61.029(C2H4O2)H+Acetic Acid0.74[50]
m69.070(C5H8)H+Isoprene100[50]
m73.064(C4H8O)H+Butanone/ MEK1.2[50]
m81.068(C6H8)H+MTs fragment165[51]
m83.084(C6H10)H+Hexadiene/C6 GLV69.1[52]
m105.066(C8H8)H+Styrene53[53]
m137.129(C10H16)H+Monoterpenes (MTs)165[51]
GC-FID C2H6Ethane0.24[50]
C2H4Ethene7.9[50]
C3H8Propane1.1[50]
C3H6Propene29[50]
C4H10i-butane2.35[51]
C4H10n-butane2.35[51]
C2H2Acetylene0.75[51]
(E)-2-C4H8Trans-2-butene63.7[34]
1- C4H81-butene31.5[34]
I- C4H8i-butene51.5[34]
(Z)-2-C4H8Cis-2-butene56[34]
iso-C5H12i-pentane3.65[54]
n-C5H12n-pentane3.92[55]
CH2=CH-CH=CH21,3-butadiene58[56]
2- (E)- C5H10Trans-2-pentene57.1[56]
1-C5H101-pentene35[56]
(CH3)2CH(CH2)2CH32-Me-pentane5.2[57]
C6H14n-hexane5.38[55]
Other compounds COCarbon monoxide0.228[51]
CH4Methane0.0064[51]
NONitrogen oxide9.7[51]
NO2Nitrogen dioxide11.3[51]
Table 3. Summary of the mean contribution of all the measured species (same time step) in the incoming and the outgoing chamber air to mROHchamber and the resulting missing OH fraction.
ROH and ROHmissingDaytime
Avg ± STD
Night-time
Avg ± STD
cROH NOx (s−1)3.6 ± 2.23.8 ± 0.9
cROH HCs C2- C6 (s−1)0.4 ± 0.20.5 ± 0.2
cROH CO (s−1)0.8 ± 0.10.9 ± 0.1
cROH CH4 (s−1)0.3 ± 0.010.3 ± 0.07
cROH VOCambient (s−1)0.8 ± 0.71.5 ± 1.0
cROH VOCrapeseed (s−1)1.9 ± 1.7<LOD ± 0.7
Mean cROHchamber (s−1)7.8 ± 2.67.0 ± 1.5
Mean mROHchamber (s−1)14.4 ± 7.08.0 ± 2.6
Mean missing ROH (s−1)6.6 ± 5.01.0 ± 1.7
Mean relative missing ROH (%)4613
Table 4. List of the 9 selected masses which presented a correlation of 80% and more with isoprene (m/z 69.070).
Protonated Theoretical MassChemical FormulaChemical CompoundRate Constant (× 10−12 cm3 Molecule−1 s−1)Max Mixing Ratio (ppbv)Max Calculated ROH (s−1)Reference
57.033C3H4OPropenal19.60.230.11[34]
85.064C5H8OEthylvinylketone36 a0.060.06[56]
85.1C6H12Hexene37 a0.180.17[56]
87.078C5H10O2-Methylbutanal b32.8 c0.060.05[65]
97.098C7H12Methylcyclohexene96.1 d0.30.66[66]
109.1C8H124-Ethenylcyclohexene63.9 a0.230.36[56]
119.082C9H10Indan19.1 e0.020.01[67]
133.098C10H12Benzene, (2-methyl−1-propenyl)-330.010.01[68]
157.105C12H12Dimethylnaphtalene74.9 f0.030.06[69]
a: Theoretical rate constant at 298 K and 1 atm; b: Other compounds may exist, 3-Methylbutanal and 2-pentanone; c: The rate coefficient of the reaction of sec-C4H9CHO (2-Methylbutanal) was considered and this rate constant is higher than that of 2-pentanone (kOH = 4.56 × 10⁻¹² cm3 molecule−1 s−1 [70]); d: Rate constant at 305 K; e: Rate constant at 297 K; f: Rate constant of 1,3-dimethylnaphtalene, which is the highest among the rate constants of dimethylnaphtalene isomers with OH and which range between 57.9 × 10⁻¹² cm3 molecule−1 s−1 and 74.9 × 10⁻¹² cm3 molecule−1 s−1.

