Abstract
The Tibetan Plateau (TP) has been experiencing warming and wetting since the 1980s. Under such circumstances, we estimated the summer latent heat flux (LE) using the maximum entropy production model driven by the net radiation, surface temperature, and soil moisture of three reanalysis datasets (ERA5, JRA-55, and MERRA-2) at the Ali site over the western TP during 1980–2018. Compared with the observed LE of the Third Tibetan Plateau Atmospheric Scientific Experiment, the coefficient of determination, root-mean-square error, and mean bias error of the estimated summer LE are 0.57, 9.3 W m−2, and −2.25 W m−2 during 2014–2016, respectively, which are better than those of LE of the reanalysis datasets. The estimated long-term summer LE presents a decreasing (an increasing) trend of −7.4 (1.8) W m−2 decade−1 during 1980–1991 (1992–2018). The LE variation is closely associated with the local soil moisture influenced by precipitation, glacier, and near-surface water conditions at the Ali site. The summer soil moisture also presents a decreasing (an increasing) trend of −0.082 (0.022) decade−1 during 1980–1991 (1992–2018). The normalized difference vegetation index generally shows the consistent trend with LE at the Ali site.
1. Introduction
The Tibetan Plateau (TP), with an average elevation of 4500 m, is the highest plateau in the world. It plays an important role in elevating the heat sources into the middle troposphere over the Eurasian continent in summer, and profoundly influences the Asian summer monsoon, regional energy and water cycles, and environment changes [1]. The TP has been experiencing warming and wetting since the mid-1950s, which has led to an array of complex meteorological, hydrological, and ecological changes [2,3,4,5,6]. Therefore, to better understand the land-atmosphere interactions underlying regional and global climate pattern, the reliable estimations of surface thermal effects of the TP are essential. One component of the surface energy balance is the surface latent heat flux (LE). It represents the heat flux from the Earth’s surface to the atmosphere associated with the surface evaporation or water [7,8]. Several intensive field experiments have been conducted off and on to measure LE over the TP since the 1970s [9,10,11,12]. However, the field experiments sites on the TP cannot cover the entire TP region; in particular, the sites are mainly distributed over the central-eastern TP, sparse in the western TP.
Considering the limited spatio-temporal coverage of the field experiments observations, the high spatio-temporal LE over the TP have been estimated using observational station data collected by the China Meteorological Administration (CMA, Beijing), satellite remote sensing data, and reanalysis data [13,14]. The long-term routine meteorological data provided by CMA (i.e., wind speed, air temperature, humidity, and so on) have been used to estimate LE via the bulk transfer method in previous studies [15,16]. However, these results are insufficiently representative due to the relatively sparse CMA observation networks in the TP. Besides, it is also a challenge to estimate the moisture transfer coefficient. Because of the high spatio-temporal resolution of remote sensing and reanalysis datasets, some studies applied them to investigate the energy budget and the climatology and variability of LE over the TP [17,18]. Han et al. (2017) concluded that LE over the entire TP increased from 2001 to 2012. Song et al. (2017) presented that the actual evaporation estimated with meteorological observation and satellite remote sensing data decreased during 2000–2010. Even so, their study periods are too short to reveal long-term variations of LE well. The results reported in Han et al. (2017) and Song et al. (2017) are also contradictory to each other. In addition, climatic and environmental factors affecting the long-term change of LE in the western TP are still unclear.
Besides the LE estimation methods described above, a new approach, the maximum entropy production (MEP) model, has been developed to estimate the surface heat fluxes on bare soil, vegetation, water/snow/ice, and ocean surfaces [19]. The MEP model has been successfully applied to estimate the surface heat fluxes over the alpine steppe terrain of the central TP [20]. However, the MEP model has not yet been applied to estimate LE in the bare soil condition over the western TP.
Therefore, the objective of this study is to reveal the climatological variations of LE at the Ali site over the western TP in the warming and wetting climate of TP during 1980–2018 and the main factors associated with these variations. The applicability of the MEP model in estimating LE at the Ali site is validated based on the intensive field experimental data of the Third Tibetan Plateau Atmospheric Scientific Experiment (TIPEX-III) covering summers during 2014–2016.
2. Materials and Methods
2.1. Materials
The Ali site selected for this study is located at the western TP (32.49° N, 80.10° E) and covered with bare soil, with an elevation of 4255 m (Figure 1a). To validate the MEP model, we downloaded the TIPEX-III observed sensible heat flux (SH) and LE data at the Ali site from August 2014 to January 2017 from the website (http://data.cma.cn/tipex). They were measured by eddy covariance and hereafter referred to as SHEC and LEEC, respectively. Following Li et al. (2019), the quality of the half-hourly SHEC and LEEC at the Ali site was controlled. We processed the half-hourly flux observations into daily values. The monthly SHEC and LEEC for the period from August 2014 to January 2017 are presented in Table 1. It is seen that the values of LEEC in summer (June through September) are greater than those in the other seasons. Therefore, we focused on summer in this study. The energy balance ratio, that is, EBR = (SH + LE)/(Rn − G), was evaluated to ensure the usability of observations for the study site and period, in which is the net radiation and G is the ground heat flux. In the absence of the observed G, it is estimated using the method of Li et al. (2019). Our result shows that the mean value of EBR is 0.90 in summers during 2014–2016, thereby indicating the reliability of the TIPEX-III summer surface heat fluxes at the Ali site. Moreover, the daily observed air temperature () and precipitation at the Ali site in summers from 1980 to 2018 were also used in this study.
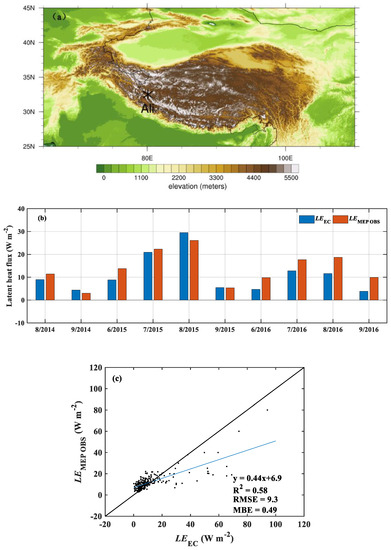
Figure 1.
(a) The Ali location over the Tibetan Plateau (TP). Colors show the topographic elevation (m); (b) the monthly means of the observed latent heat flux (LEEC) and the latent heat flux (LEMEP OBS) modeled by the maximum entropy production (MEP) model and observations at the Ali site; (c) the comparison between LEEC and LEMEP OBS at the Ali site in summers from 2014 to 2016. In Figure 1c, the number of samples is 245, the blue line represents slope, and x and y represent LEEC and LEMEP OBS, respectively.

Table 1.
The monthly averages of the observed sensible heat flux () and latent heat flux () at the Ali site from August 2014 to January 2017.
The summer daily (monthly) , skin temperature ), soil moisture () in the top layer, and LE provided by the six reanalysis datasets were used in this study during 2014–2016 (1980–2018). The six datasets are the ECMWF ERA5 reanalysis (hereafter ERA5; [21]), the ECMWF interim reanalysis (hereafter ERA-Interim; [22]), the Japanese 55-Year Reanalysis (hereafter JRA-55; [23]), the Modern-Era Retrospective Analysis for Research and Application version 2 (hereafter MERRA-2; [24]), the NCEP/NCAR Reanalysis 1 (hereafter NCEP-I; [25]), and the NCEP-DOE Reanalysis 2 (hereafter NCEP-II; [26]). These reanalysis datasets were also applied to the MEP-based estimations on a daily/monthly scale during 2014–2016/1980–2018. We used the normalized difference vegetation index (NDVI) of Advanced Very High Resolution Radiometer-Based Global Inventory Modelling and Mapping Studies (GIMMS3g) during 1981–2015 and the Moderate Resolution Imaging Spectroradiometer/Terra Vegetation Indices (MODIS) 16-Day L3 Global 250 m SIN Grid V006 from 2000 to 2018. These NDVI datasets have been widely used to indicate the variation of vegetation [27]. The bilinear interpolation method was adopted to interpolate the regular grid data to the appropriate point at the Ali site.
2.2. Methods
In this study, the MEP model was used to calculate LE. The equations are as follows.
The nonlinear algebraic Equation (1) has a unique solution of LE through an implicit iterative method. (= ) is the thermal inertia of the surface layer material (), the bulk density of the surface layer material (kg m−3), the specific heat of the surface layer material (), and the thermal conductivity of the surface layer material (W m−1 K−1). is recognized as the reciprocal Bowen ratio expressed in terms of a dimensionless parameter μ, characterizing the relative role of surface temperature ((K)) and surface (skin) specific humidity ( (kg kg−1)) on the surface energy budget. The “apparent thermal inertia of the air” , characterizing the boundary-layer turbulence based on the Monin-Obukhov similarity theory, is given as follows [28].
where is the air density (kg m−3), the von Kármán constant ~0.4, the gravitational acceleration (m s−2), the representative environment temperature (~300 K), the vertical distance (m) from the material surface above, the specific heat of air under constant pressure (103 J kg−1 K−1), and the parameters related to the universal constant in the empirical functions characterizing the atmospheric stability of the surface layer, the latent heat of vaporization of liquid water (2.5 × 10⁶ J kg−1), and the gas constant of water vapor (461 J kg−1 K−1).
The value in Equation (2) can be parameterized in terms of and .
where is the saturation specific humidity at , the ratio of molecular weight of water vapor to dry air (0.622), the standard atmospheric pressure (~1000 hPa), the saturation vapor pressure of water at (11.6 hPa), and the coefficient characterizing the water transport from inner soil pores to the soil surface. We used an alternative parameterization of based on an analogy to surface dependence on the ratio of actual evapotranspiration to potential evapotranspiration. Thus,
where is the porosity of the soil (m3 m−3; at Ali site) and is a soil texture-dependent empirical parameter. Equation (6) represents determining the corresponding deduction of from saturation condition . Parameterization of as in Equation (6) satisfies the physical constraints of (i.e., reaches its upper limit when soil is saturated ( = ) and becomes zero when soil is completely dry) [29]. In this study, is estimated using Equation (6) by fitting the MEP modeled LE to the observed LEEC with the minimum root-mean-square error (RMSE).
3. Results
3.1. Estimation of LE by the MEP Model and Observational Data
The daily observed at the depth of 5 cm, , and are applied in the estimation of LE (hereafter LEMEP OBS) at the Ali site with the MEP model () in summers from 2014 to 2016, in which is determined using Equation (6). The monthly values of LEMEP OBS and LEEC are given in Figure 1b. The coefficient of determination (R2) and RMSE between LEMEP OBS and LEEC are 0.58 and 9.3 W m−2 in summers, respectively (Figure 1c). From August 2014 to January 2017, the R2 and RMSE between LEMEP OBS and LEEC are 0.64 and 6.6 W m−2, respectively. Previous studies showed that the LE estimations with the RMSE values between 4.7 and 23.8 W m−2 may be used to reveal the features of LE over the TP [3,13]. Thus, our resulting LE is acceptable, which implies that the MEP model can be used to estimate LE over the western TP.
3.2. LE Estimated by the MEP Model and Reanalysis Data and Its Long-Term Variation
Based on the daily , , and of the six reanalysis datasets in summers from 2014 to 2016, LE was estimated using the MEP model at the Ali site; hereafter referred to as the MEP and reanalysis (MR) LE and called LEMEP ERA5, LEMEP ERA-Interim, LEMEP JRA-55, LEMEP MERRA-2, LEMEP NCEP-I, and LEMEP NCEP-II, respectively. The value in the MEP model (Table 2) is calibrated using Equation (6) by fitting the MEP-estimated LE to LEEC for each reanalysis dataset. Figure 2 shows the monthly MR LE. The monthly average value of LEEC is 11.1 W m−2 in summers from 2014 to 2016. For MR LE, the monthly average values of LEMEP ERA5, LEMEP ERA-Interim, LEMEP JRA-55, LEMEP MERRA-2, LEMEP NCEP-I, and LEMEP NCEP-II are 9.2, 14.2, 16.5, 10.8, 12.0, and 8.7 W m−2, respectively. The R2 values of LEMEP ERA5, LEMEP JRA-55, and LEMEP MERRA-2 are 0.43, 0.34, and 0.54, respectively (Table 3). These high correlations imply the consistency between the three MR LE and LEEC, especially for LEMEP MERRA-2. The R2 values of LEMEP ERA-Interim, LEMEP NCEP-I, and LEMEP NCEP-II are between 0.11 and 0.15, which show relatively poor correlations between these three MR LE and LEEC. It is evident that the LEMEP MERRA-2 RMSE (10.1 W m−2) and mean bias error (MBE) (−0.34 W m−2) are smallest among the six MR LE values.
Table 2.
The values of in the maximum entropy production model for six reanalysis datasets at the Ali site in summers from 2014 to 2016.
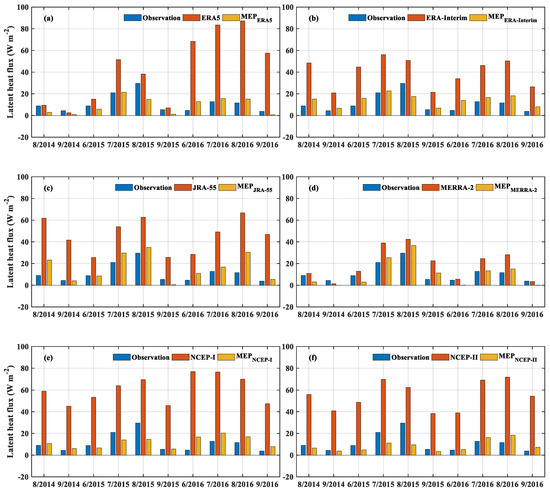
Figure 2.
The summer monthly values of the observed latent heat flux (LEEC), the latent heat flux (LE) of the reanalysis datasets (reanalysis LE), and LE estimated by the maximum entropy production (MEP) model and the reanalysis datasets (MR LE) at the Ali site from 2014 to 2016 ((a) ERA5, (b) ERA-Interim, (c) JRA-55, (d) MERRA-2, (e) NCEP-I, and (f) NCEP-II).
Table 3.
The coefficient of determination (R2), the root-mean-square error (RMSE), and the mean bias error (MBE) of latent heat flux (LE) estimated by reanalysis datasets (reanalysis LE) and LE estimated from the maximum entropy production model and the reanalysis datasets (MR LE) at the Ali site in summers from 2014 to 2016.
Based on the above statistical indices, LEMEP ERA5, LEMEP JRA-55, and LEMEP MERRA-2 perform better than the other three MR LE. Xie and Wang (2019) suggested that merging data through various data sources can reduce the uncertainties of data. Therefore, to achieve a better LE estimation, we used the averages of daily , , and of ERA5, JRA-55, and MERRA-2 as a new merged dataset for re-estimating the LE with the MEP model (hereafter referred to as LE-merged). Here, the value of is equal to 3.4, which is calibrated using Equation (6) by fitting LE-merged to LEEC. The R2, RMSE, and MBE values of LE-merged are 0.57, 9.3 W m−2, and −2.25 W m−2, respectively. This result indicates that LE-merged is a better estimation compared with the LE estimation using the single reanalysis data source and the MEP model.
The MR LE is further compared with LE provided by the six reanalysis datasets (hereafter referred to as LEERA5, LEERA-Interim, LEJRA-55, LEMERRA-2, LENCEP-I, and LENCEP-II, respectively). The monthly values of LEERA5, LEERA-Interim, LEJRA-55, LEMERRA-2, LENCEP-I, and LENCEP-II are 42.0, 39.9, 46.3, 19.1, 60.8, and 55.1 W m−2, respectively, and are significantly greater than those of the MR LE and LEEC (Figure 2). Clearly, the RMSE values of the six MR LE are reduced (Table 3). LE-merged performs best compared with the MR LE and the reanalysis LE. Hence, , , and of ERA5, JRA-55, and MERRA-2 can be applied in driving the MEP model to estimate LE at the Ali site over the western TP.
To explore the variability of LE at the Ali site, the long-term series of LE-merged is analyzed in this study. In Figure 3, LE-merged generally fluctuates between 1.8 and 18.1 W m−2, with the mean value of 7.4 W m−2, and showing a decreasing trend of −7.4 W m−2 decade−1 during 1980–1991 and an increasing trend of 1.8 W m−2 decade−1 during 1992–2018. For the whole period 1980–2018, LE-merged generally presents an increasing trend of 0.3 W m−2 decade−1. The MR LE and the reanalysis LE of ERA5, JRA-55, MERRA-2, and NCEP-I show the similar variations to LE-merged, with the decreasing trend during 1980–1991 and the increasing trend during 1992–2018 (Figure 4a,c–e), especially for both LEMEP MERRA-2 and LEMERRA-2 (Figure 4d). But the features of the ERA-Interim and NCEP-II MR LE and reanalysis LE series are quite different from those of LE-merged (Figure 4b,f).
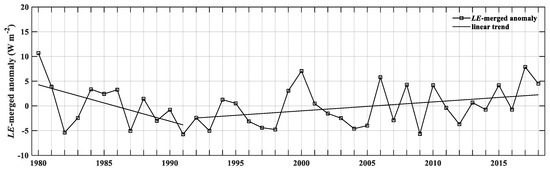
Figure 3.
The temporal series of the summer latent heat flux anomaly estimated by the maximum entropy production model and the merged dataset (LE-merged) at the Ali site from 1980 to 2018 and its linear trends.
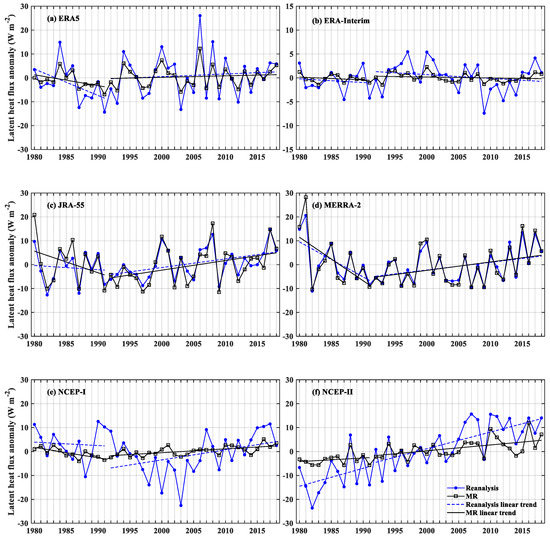
Figure 4.
The temporal series of the summer reanalysis LE and MR LE anomalies at the Ali site from 1980 to 2018 and their linear trends.
4. Discussion
Previous studies indicated that surface energy fluxes during summer are mainly affected by precipitation, especially in arid regions [30,31,32]. To explore the reasons for the difference in LE of the six reanalysis datasets, we analyzed the summer reanalysis precipitation. The varying features of the summer reanalysis precipitation are generally similar to that of the observed precipitation during 2014–2016, with the maximum precipitation occurring in July-August (Figure 5). However, the summer-averaged precipitation values of the six reanalysis datasets are generally greater than the observation (0.64 mm), especially for JRA-55 (1.7 mm), NCEP-I (5.6 mm), and NCEP-II (7.1 mm). The summer-averaged precipitation values of ERA5, ERA-Interim, and MERRA-2 are 1.0, 0.83, and 0.65 mm, respectively. The RMSE values of the precipitation of ERA5, ERA-Interim, JRA-55, MERRA-2, NCEP-I, and NCEP-II are 2.4, 2.3, 2.6, 2.2, 5.9, and 7.4 mm, respectively. The RMSE of MERRA-2 precipitation is smallest. Based on the above analysis, the MERRA-2 LE and precipitation perform best among the six reanalysis datasets. Therefore, the errors in precipitation may lead to a large uncertainty in the reanalysis LE. In addition, the difference in the parameterization of the moisture transfer coefficient, surface roughness lengths, and wind speed may also lead to the conspicuous differences among the six reanalysis LE data [33,34,35].Since the parameterization scheme of the MEP model may be able to reflect the surface humidity condition, the uncertainties of the estimated LE using the MEP model can be substantially reduced compared with the reanalysis LE [20,29].
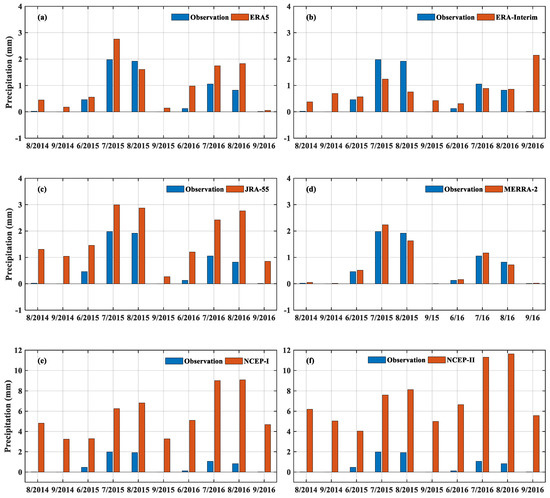
Figure 5.
The observed and reanalysis monthly precipitation values in summers at the Ali site from 2014 to 2016.
The LE-merged presents a significant variation from 1980 to 2018. Han et al. (2017) reported that LE presented an upward trend between 0 and 2 W m−2 year−1 from 2001 to 2012. During this period, LE-merged also shows an upward trend of 0.8 W m−2 decade−1. It is evident that LE over the western TP shows a complicated feature during a long period under the influence of climatic and environmental factors.
Previous studies showed that the increased could lead to an increase of LE [36,37,38]. The increase (decrease) of may bring high (low) potential evaporation, leading to the increase (decrease) in LE. Figure 6a shows the time series of summer averaged over the ERA5, JRA-55, and MERRA-2 reanalysis datasets at the Ali site during 1980–2018. It is seen that summer at the Ali site presents an overall increasing trend of 0.06 decade−1 during 1980–2018, which may contribute to the increase of LE-merged during this period. Moreover, also presents a decreasing trend of −0.082 decade−1 from 1980 to 1991 (corresponding to the decreasing trend of LE-merged) and an increasing trend of 0.022 decade−1 from 1992 to the 2018 (corresponding to the increasing trend of LE-merged). The R2 value between and LE-merged is 0.96. The minimum (maximum) values of both LE-merged and occur in 1991 (1980). Therefore, the high correlation between and LE-merged implies that the long-term variation of LE-merged may be mainly controlled by the local .
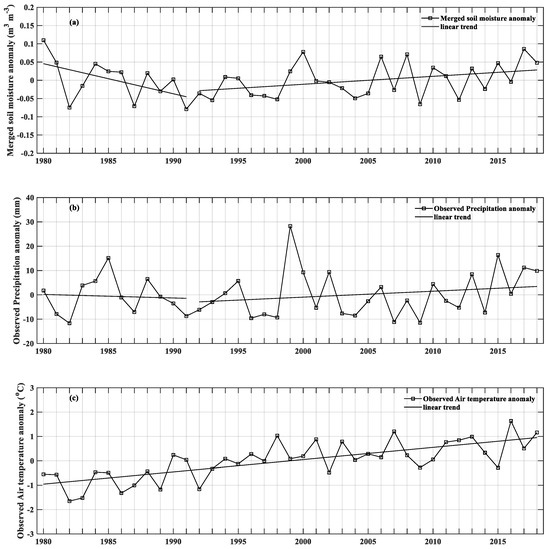
Figure 6.
The temporal series of (a) the summer soil moisture () anomaly of the merged dataset at the Ali site during 1980–2018; (b) same as in (a) but for the summer observed precipitation; (c) same as in (a) but for the summer observed air temperature.
The variation of is dramatically influenced by groundwater cycles such as precipitation, lake, and glacier [39]. Our result shows that the summer precipitation at the Ali site presents a decreasing trend of −1.5 mm decade−1 during 1980–1991 and an upward trend of 2.4 mm decade−1 during 1992–2018, with an overall increasing trend of 1.1 mm decade−1 during 1980–2018 (Figure 6b). This variation of precipitation is consistent with that of . The summer presents an upward trend of 0.5 °C decade−1 during 1980–2018 (Figure 6c). In addition to the decrease of precipitation, the lake area had also decreased near the Ali site from the early 1980s to the early 1990s [40]. This may be mainly caused by the combination effects of , precipitation, and groundwater cycles during this period. Afterwards, under the background of the warming and wetting climate of TP, the retreat amplitudes of most of glaciers over the TP and surrounding regions appear to be accelerating and reach a maximum in the 1990s [41,42]. Yao et al. (2007) reported that the magnitude of glacial retreat is largest in the Karakorum Mountains (near the Ali site) in the 1990s. At the same time, the runoff of some rivers in this region had also increased due to the glacial melting. Zhang et al. (2019) further showed that the total lake area had been increasing near the Ali site since the mid-1990s as a response to a hydrological cycle intensified by climate changes. Although and LE-merged have been increasing during this period (which may cause the decrease in lake area), the effects of the increasing precipitation and accelerating glacial retreat possibly still dominate the expansion of the local lake area. Therefore, the increasing precipitation and accelerating glacial retreat may result in the increase of at the Ali site after the 1990s. On the whole, the increase of at the Ali site during 1980–2018 may be mainly caused by the increase of summer precipitation.
Moreover, a warmer and wetter environment may help vegetation growth. Figure 7 shows the summer NDVI values during 1981–2018, in which the NDVI values during 1981–2015 are obtained from GIMMS3g and those during 2000–2018 are obtained from MODIS. Both of GIMMS3g and MODIS NDVI show increasing trends during 2000–2015. GIMMS3g NDVI shows a decreasing (an increasing) trend during 1981–1991 (1992–2015). It is evident that corresponding to the increasing trend of and the decreasing trend of precipitation during 1981–1991, NDVI presents a decreasing trend. While corresponding to the increasing trends of both and precipitation during 1992–2018, NDVI shows a general increasing trend. NDVI may affect variations of LE through modulating surface vegetation evapotranspiration and surface roughness, and is positively correlated with the land surface energy and water cycles [43,44]. Therefore, the consistent trends of LE-merged and NDVI (shown in Figure 3 and Figure 7) suggest a possible effect of NDVI on LE at the Ali site.
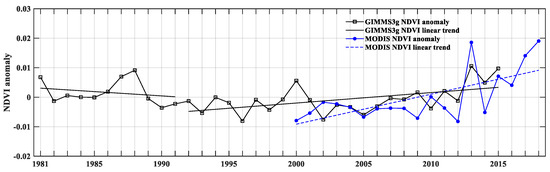
Figure 7.
The temporal series of the summer normalized difference vegetation index (NDVI) at the Ali site during 1981–2018 and its linear trends.
5. Conclusions
In this study, we applied the MEP model and the ensemble average of , , and of the ERA5, JRA-55, and MERRA-2 reanalysis datasets to re-estimate summer LE at the Ali site over the western TP. During 1980–2018, the variation of LE is consistent with that of . The latter is influenced by climatic and environmental factors, such as precipitation, glaciers, and near-surface water conditions. LE generally shows a consistent trend with NDVI. Our study not only tends to agree with the increasing trends of LE in previous studies at the Ali site, but also reveals the long-term variation of LE and its relationship to the climatic and environmental factors. However, we explore only one site of the western TP in this study. The LE-merged should be further extended to more sites for a longer period, in combination with other surface heat sources, to investigate the intraseasonal variability of LE [45] and its association with the climate and environment in the future studies.
Author Contributions
Methodology, J.W. and Y.D.; supervision, P.Z., J.W. and Y.D.; writing—original draft, N.L.; writing—review and editing, P.Z. All authors have read and agreed to the published version of the manuscript.
Funding
This research was funded by the National Key Research and Development Plan Project (2018YFC1505700) and NSFC (91637312).
Acknowledgments
This work is jointly sponsored by the National Key research and Development Plan Project (2018YFC1505700) and NSFC (91637312). The TIPEX-III datasets come from the website (http://data.cma.cn/tipex). The normalized difference vegetation index of the MODIS/Terra Vegetation Indices can be obtained from the website (https://e4ftl01.cr.usgs.gov/MOLT/MOD13Q1.006/). The normalized difference vegetation index of Advanced Very High Resolution Radiometer-Based Global Inventory Modelling and Mapping Studies can be downloaded from the website (https://ecocast.arc.nasa.gov/data/pub/gimms/3g.v1/). The ERA5, ERA-Interim, JRA-55, MERRA-2, NCEP-I, and NCEP-II reanalysis datasets come from their websites.
Conflicts of Interest
The authors declare no conflict of interest.
References
- Wu, G.X.; Zhang, Y.S. Tibetan plateau forcing and the timing of the monsoon onset over south asia and the south china sea. Mon. Weather Rev. 1998, 126, 913–927. [Google Scholar] [CrossRef]
- Zhao, P.; Chen, L.X. Interannual variability of atmospheric heat source/sink over the Qinghai—Xizang (Tibetan) Plateau and its relation to circulation. Adv. Atmos. Sci. 2001, 18, 106–116. [Google Scholar] [CrossRef]
- Xie, Z.; Wang, B. Summer atmospheric heat sources over the western-central tibetan plateau: An integrated analysis of multiple reanalysis and satellite datasets. J. Clim. 2019, 32, 1181–1202. [Google Scholar] [CrossRef]
- You, Q.; Min, J.; Zhang, W.; Pepin, N.; Kang, S. Comparison of multiple datasets with gridded precipitation observations over the Tibetan Plateau. Clim. Dyn. 2015, 45, 791–806. [Google Scholar] [CrossRef]
- Yang, K.; Wu, H.; Qin, J.; Lin, C.; Tang, W.; Chen, Y. Recent climate changes over the Tibetan Plateau and their impacts on energy and water cycle: A review. Glob. Planet. Chang. 2014, 112, 79–91. [Google Scholar] [CrossRef]
- Fang, Q.L.; Zhou, L.X.; Zhu, L.P.; Zhang, X.J.; Yang, J.; Zhou, J.; Song, W.W.; Yu, X.J.; Luo, Z.H. Spatiotemporal variation of vegetation dynamics and correlations with climatic factors in the Tibetan Plateau, China. IOP Conf. Ser. Earth Environ. Sci. 2019, 346, 012015. [Google Scholar] [CrossRef]
- Song, L.; Zhuang, Q.; Yin, Y.; Zhu, X.; Wu, S. Spatio-temporal dynamics of evapotranspiration on the Tibetan Plateau from 2000 to 2010. Environ. Res. Lett. 2017, 12, 014011. [Google Scholar] [CrossRef]
- Ma, Y.; Ma, W.; Zhong, L.; Hu, Z.; Li, J.; Zhu, Z.; Han, C.; Wang, B.; Liu, X. Monitoring and modeling the Tibetan Plateau’s climate system and its impact on East Asia. Sci. Rep. 2017, 7, 44574. [Google Scholar] [CrossRef]
- Yang, Y.; Liu, Y.; Li, M.; Hu, Z.; Ding, Z. Assessment of reanalysis flux products based on eddy covariance observations over the Tibetan Plateau. Theor. Appl. Climatol. 2019, 138, 275–292. [Google Scholar] [CrossRef]
- Wang, Y.; Xu, X.; Liu, H.; Li, Y.; Li, Y.; Hu, Z.; Gao, X.; Ma, Y.; Sun, J.; Lenschow, D.H.; et al. Analysis of land surface parameters and turbulence characteristics over the Tibetan Plateau and surrounding region. J. Geophys. Res. Atmos. 2016, 121, 9540–9560. [Google Scholar] [CrossRef]
- Xin, Y.F.; Chen, F.; Zhao, P.; Barlage, M.; Blanken, P.; Chen, Y.L.; Chen, B.; Wang, Y.J. Surface energy balance closure at ten sites over the Tibetan plateau. Agric. For. Meteorol. 2018, 259, 317–328. [Google Scholar] [CrossRef]
- Zhao, P.; Xu, X.; Chen, F.; Guo, X.; Zheng, X.; Liu, L.; Hong, Y.; Li, Y.; La, Z.; Peng, H.; et al. The third atmospheric scientific experiment for understanding the earth-atmosphere coupled system over the tibetan plateau and its effects. Bull. Am. Meteorol. Soc. 2018, 99, 757–776. [Google Scholar] [CrossRef]
- Shi, Q.; Liang, S. Surface-sensible and latent heat fluxes over the Tibetan Plateau from ground measurements, reanalysis, and satellite data. Atmos. Chem. Phys. 2014, 14, 5659–5677. [Google Scholar] [CrossRef]
- Ma, Y.; Su, Z.; Koike, T.; Yao, T.; Ishikawa, H.; Ueno, K.i.; Menenti, M. On measuring and remote sensing surface energy partitioning over the Tibetan Plateau—From GAME/Tibet to CAMP/Tibet. Phys. Chem. Earth Parts A B C 2003, 28, 63–74. [Google Scholar] [CrossRef]
- Zhao, P.; Chen, L. Study on climatic features of surface turbulent heat exchange coefficients and surface thermal sources over the Qinghai-Xizang Plateau. Acta Meteorol. Sin. 2000, 2000, 13–29. [Google Scholar]
- Ma, Y.; Fan, S.; Ishikawa, H.; Tsukamoto, O.; Yao, T.; Koike, T.; Zuo, H.; Hu, Z.; Su, Z. Diurnal and inter-monthly variation of land surface heat fluxes over the central Tibetan Plateau area. Theor. Appl. Climatol. 2004, 80, 259–273. [Google Scholar] [CrossRef]
- Ma, Y.; Zhong, L.; Wang, B.; Ma, W.; Chen, X.; Li, M. Determination of land surface heat fluxes over heterogeneous landscape of the Tibetan Plateau by using the MODIS and in situ data. Atmos. Chem. Phys. 2011, 11, 10461–10469. [Google Scholar] [CrossRef]
- Han, C.; Ma, Y.; Chen, X.; Su, Z. Estimates of land surface heat fluxes of the Mt. Everest region over the Tibetan Plateau utilizing ASTER data. Atmos. Res. 2016, 168, 180–190. [Google Scholar] [CrossRef]
- Huang, S.; Deng, Y.; Wang, J. Revisiting the global surface energy budgets with maximum-entropy-production model of surface heat fluxes. Clim. Dyn. 2016, 49, 1531–1545. [Google Scholar] [CrossRef]
- Li, N.; Zhao, P.; Wang, J.; Deng, Y. Estimation of surface heat fluxes over the central tibetan plateau using the maximum entropy production model. J. Geophys. Res. Atmos. 2019, 124, 6827–6840. [Google Scholar] [CrossRef]
- Olauson, J. ERA5: The new champion of wind power modelling? Renew. Energy 2018, 126, S0960148118303677. [Google Scholar] [CrossRef]
- Dee, D.P.; Uppala, S.M.; Simmons, A.J.; Berrisford, P.; Poli, P.; Kobayashi, S.; Andrae, U.; Balmaseda, M.A.; Balsamo, G.; Bauer, P.; et al. The ERA-interim reanalysis: Configuration and performance of the data assimilation system. Q. J. R. Meteorol. Soc. 2011, 137, 553–597. [Google Scholar] [CrossRef]
- Kobayashi, S.; Ota, Y.; Harada, Y.; Ebita, A.; Moriya, M.; Onoda, H.; Onogi, K.; Kamahori, H.; Kobayashi, C.; Endo, H.; et al. The JRA-55 Reanalysis: General specifications and basic characteristics. J. Meteorol. Soc. Jpn. Ser. II 2015, 93, 5–48. [Google Scholar] [CrossRef]
- Gelaro, R.; McCarty, W.; Suárez, M.J.; Todling, R.; Molod, A.; Takacs, L.; Randles, C.A.; Darmenov, A.; Bosilovich, M.G.; Reichle, R.; et al. The Modern-Era Retrospective Analysis for Research and Applications, Version 2 (MERRA-2). J. Clim. 2017, 30, 5419–5454. [Google Scholar] [CrossRef] [PubMed]
- Kistler, R.; Kalnay, E.; Woollen, J.; Chelliah, M.; Ebisuzaki, W.; Kousky, V.; Dool, H.V.D.; Collins, W.; Saha, S.; White, G.; et al. The NCEP-NCAR 50-year reanalysis: Monthly means CD-ROM and documentation. Bull. Am. Meteorol. Soc. 2001, 82, 247–268. [Google Scholar] [CrossRef]
- Kanamitsu, M.; Ebisuzaki, W.; Woollen, J. NCEP–DOE AMIP-II reanalysis (R-2). Bull. Am. Meteorol. Soc. 2002, 83, 1631–1643. [Google Scholar] [CrossRef]
- Fensholt, R.; Proud, S. Evaluation of Earth Observation based global long term vegetation trends—Comparing GIMMS and MODIS global NDVI time series. Remote Sens. Environ. 2012, 119, 131–147. [Google Scholar] [CrossRef]
- Wang, J.; Bras, R.L. A model of evapotranspiration based on the theory of maximum entropy production. Water Resour. Res. 2011, 47, W03521. [Google Scholar] [CrossRef]
- Huang, S.; Wang, J. A coupled force-restore model of surface temperature and soil moisture using the maximum entropy production model of heat fluxes. J. Geophys. Res. Atmos. 2016, 121, 7528–7547. [Google Scholar] [CrossRef]
- Ge, F.; Sielmann, F.; Zhu, X.H.; Fraedrich, K.; Zhi, X.F.; Peng, T.; Wang, L. The link between Tibetan Plateau monsoon and Indian summer precipitation: A linear diagnostic perspective. Clim. Dyn. 2017, 49, 4201–4215. [Google Scholar] [CrossRef]
- Koster, R.D.; Dirmeyer, P.A.; Guo, Z.; Bonan, G.; Chan, E.; Cox, P.; Gordon, C.T.; Kanae, S.; Kowalczyk, E.; Lawrence, D.; et al. Regions of strong coupling between soil moisture and precipitation. Science 2004, 305, 1138–1140. [Google Scholar] [CrossRef] [PubMed]
- Coronato, F.R.; Bertiller, M.B. Precipitation and landscape related effects on soil moisture in semi-arid rangelands of Patagonia. J. Arid Environ. 1996, 34, 1–9. [Google Scholar] [CrossRef]
- Yang, K.; Qin, J.; Guo, X.; Zhou, D.; Ma, Y. method development for estimating sensible heat flux over the Tibetan Plateau from CMA Data. J. Appl. Meteorol. Climatol. 2009, 48, 2474–2486. [Google Scholar] [CrossRef]
- Brunke, M.A.; Wang, Z.; Zeng, X.; Bosilovich, M.; Shie, C.L. An assessment of the uncertainties in ocean surface turbulent fluxes in 11 reanalysis, satellite-derived, and combined global datasets. J. Clim. 2011, 24, 5469–5493. [Google Scholar] [CrossRef]
- Xie, J.; Yu, Y.; Li, J.; Ge, J.; Liu, C. Comparison of surface sensible and latent heat fluxes over the Tibetan Plateau from reanalysis and observations. Meteorol. Atmos. Phys. 2018, 131, 567–584. [Google Scholar] [CrossRef]
- Han, C.; Ma, Y.; Chen, X.; Su, Z. Trends of land surface heat fluxes on the Tibetan Plateau from 2001 to 2012. Int. J. Climatol. 2017, 37, 4757–4767. [Google Scholar] [CrossRef]
- Guo, D.; Yang, M.; Wang, H. Sensible and latent heat flux response to diurnal variation in soil surface temperature and moisture under different freeze/thaw soil conditions in the seasonal frozen soil region of the central Tibetan Plateau. Environ. Earth Sci. 2011, 63, 97–107. [Google Scholar] [CrossRef]
- Wu, S.; Yin, Y.; Du, Z.; Yang, Q.J. Climatic trends over the Tibetan Plateau during 1971–2000. J. Geogr. Sci. 2007, 17, 141–151. [Google Scholar] [CrossRef]
- Bibi, S.; Wang, L.; Li, X.; Zhou, J.; Chen, D.; Yao, T. Climatic and associated cryospheric, biospheric, and hydrological changes on the Tibetan Plateau: A review: Review on climate change and its effects on spheres on Tibetan Plateau. Int. J. Climatol. 2018, 38, e1–e17. [Google Scholar] [CrossRef]
- Zhang, G.; Luo, W.; Chen, W.; Zheng, G. A robust but variable lake expansion on the Tibetan Plateau. Sci. Bull. 2019, 64, 1306–1309. [Google Scholar] [CrossRef]
- Yao, T.; Pu, J.; Lu, A.; Wang, Y.; Yu, W. Recent glacial retreat and its impact on hydrological processes on the Tibetan Plateau, china, and surrounding regions. Arct. Antarct. Alp. Res. 2007, 39, 642–650. [Google Scholar] [CrossRef]
- Sun, J.; Zhou, T.; Liu, M.; Chen, Y.; Shang, H.; Zhu, L.; Shedayi, A.A.; Yu, H.; Cheng, G.; Liu, G.; et al. Linkages of the dynamics of glaciers and lakes with the climate elements over the Tibetan Plateau. Earth Sci. Rev. 2018, 185, 308–324. [Google Scholar] [CrossRef]
- Ma, W.; Ma, Y. Modeling the influence of land surface flux on the regional climate of the Tibetan Plateau. Theor. Appl. Climatol. 2016, 125, 45–52. [Google Scholar] [CrossRef]
- Zhang, H.; Chang, J.; Zhang, L.; Wang, Y.; Li, Y.; Wang, X. NDVI dynamic changes and their relationship with meteorological factors and soil moisture. Environ. Earth Sci. 2018, 77, 582. [Google Scholar] [CrossRef]
- Li, W.K.; Qiu, B.; Guo, W.D.; Zhu, Z.W.; Hsu, P.C. Intraseasonal variability of Tibetan Plateau snow cover. Int. J. Climatol. 2019, 1–16. [Google Scholar] [CrossRef]
© 2020 by the authors. Licensee MDPI, Basel, Switzerland. This article is an open access article distributed under the terms and conditions of the Creative Commons Attribution (CC BY) license (http://creativecommons.org/licenses/by/4.0/).