Article

Effect of a New Manure Amendment on Ammonia Emissions from Poultry Litter

1
Crop, Soil, and Environmental Sciences, Plant Sciences 115, University of Arkansas, Fayetteville, AR 72701, USA
2
USDA-ARS, Plant Sciences 115, University of Arkansas, Fayetteville, AR 72701, USA
*
Author to whom correspondence should be addressed.
Atmosphere 2020, 11(3), 257; https://doi.org/10.3390/atmos11030257
Submission received: 17 January 2020 / Revised: 29 February 2020 / Accepted: 1 March 2020 / Published: 5 March 2020
(This article belongs to the Special Issue Livestock Odor and Air Quality)

Abstract

:
Treating manure with aluminum sulfate (alum) is a best management practice (BMP) which reduces ammonia (NH3) emissions and phosphorus (P) runoff from poultry litter. However, the price of alum has increased markedly in recent years, creating a need for less expensive products to control NH3 volatilization. The objective of this study was to evaluate the effects of a new litter amendment made from alum mud, bauxite, and sulfuric acid (alum mud litter amendment or AMLA) on NH3 emissions, litter chemistry, and poultry production in a pen trial. Three separate flocks of 1000 broilers were used for this study. The first flock of birds was used to produce the poultry litter needed for the experiment. The second and third flocks of birds were allocated to 20 pens in a randomized block design with four replicates of five treatments: (1) control, (2) 49 kg AMLA/100 m2 incorporated, (3) 98 kg AMLA/100 m2 incorporated, (4) 98 kg AMLA/100 m2 surface applied, and (5) 98 kg alum/100 m2 incorporated. Ammonia flux measurements and litter samples were collected from each pen at day 0, 7, 14, 21, 28, 35, and 42. The average litter pH for both flocks was higher in untreated litter (7.92) compared to incorporating alum (7.32) or AMLA (7.18). The two flocks’ average NH4-N concentrations at day 42 were 38% and 30% higher for the high rates of incorporated alum and AMLA compared to the untreated litter. Compared with untreated litter, AMLA reduced overall NH3 emissions by 27% to 52% which was not significantly different from reductions in emissions by alum (35%). Alum mud litter amendment reduced cumulative NH3 losses from litter as much as, and in some cases more than, alum applied at the same rate. These data indicate that AMLA, which can be manufactured for lower price than alum, is an effective alternative litter amendment for reducing NH3 emissions from poultry litter.

1. Introduction

Ammonia (NH3) emissions originating from poultry litter account for 27% of the total atmospheric NH3 emissions in the United States [1]. The United States produces approximately 12.6 tons of poultry litter every year, assuming 1.4 tons of litter is produced per 1,000 birds [2,3]. Moore et al. [4] estimated the total NH3 loss from poultry production to be 46 g NH3 per broiler. With more than nine billion broilers produced every year in the United States [5] approximately 414 million kg of NH3 are being lost by volatilization every year from the poultry industry. Moore et al. [4] found that half of the N excreted by broilers is lost through NH3 emissions from the manure before the litter is cleaned from the barns. Ammonia losses from broiler production in the United States are higher than in Europe because the litter is cleaned out and replaced with each flock of birds in Europe, while in the United States the litter is only removed once a year, with some parts of the country cleaning out once every 3 to 5 years [6,7].
Ammonia emissions from poultry litter can have a negative impact on broiler production [8,9,10]. High levels of NH3 in poultry houses have been shown to cause respiratory problems in broilers, as well as in poultry workers [11,12]. When NH3 levels were elevated in poultry houses an increase in the number of broilers with airsaculitis was observed by Kling and Quarles [13]. Anderson et al. [14] found that exposure to elevated NH3 concentrations also affects the broilers immune system, making them more susceptible to diseases. Increased levels of NH3 has also caused poor feed conversion and weight gains, along with blindness from ocular damage [8,9,10]. Several environmental issues have been linked to NH3 emissions as well, including eutrophication resulting from N depositions into aquatic systems [15,16] and soil acidification [17,18]. The formation of fine particulate matter (ammonium nitrate or ammonium sulfate) in the atmosphere occurs when NH3 reacts with NOx or SOx compounds, leading to potential respiratory health problems in humans [19,20].
Due to the production, health, and environmental concerns associated with NH3 several methods for the control of NH3 in poultry production have been used including ventilation, dietary manipulation, manure management, and litter amendments. Increasing ventilation rates in poultry houses leads to substantial decreases in NH3 concentrations within the house but translates directly to higher NH3 emissions [21]. Ammonia scrubbers (bioscrubbers, biofilters, or chemical scrubbers) on the exhaust fans of poultry building can reduce the emission of NH3 being vented into the atmosphere, but normally does not reduce NH3 levels inside the facility [22,23]. Dietary strategies, such as lowering the amount of crude protein in broilers diets, or reducing manure pH, have also been observed to reduce NH3 volatilization [24,25]. Proper management of litter after poultry production is also essential in reducing NH3 volatilization. Once the litter is removed from the house it is typically stored for some period of time before being used as a fertilizer source. During storage covers made of various materials (metal, wood, plastic, straw, peat, etc.) can be used to create a barrier that retains N reducing NH3 emission to the atmosphere [26]. Besides being used as fertilizer, another use for poultry litter waste is as an energy source since it is rich in volatile materials [27]. Recent research investigating the combustion process of poultry litter has found that combusting biomass waste (poultry litter) with fossil fuels (coal, natural gas etc.) known as co-combustion, can reduce emissions [2,28,29].
The method most commonly used in the United States to reduce NH3 volatilization from poultry litter is addition of chemical amendments, such as alum, aluminum chloride, sodium bisulfate, and ferric sulfate or by-products containing Al, Ca, or Fe [30,31,32,33,34,35,36]. Treating poultry litter with alum was first done as a method to reduce soluble P in the litter and P runoff from fields fertilized with litter [37,38]. However, the greatest benefit of alum to the poultry industry is its ability to lower litter pH, converting NH3 to the less volatile ammonium (NH4+) form, greatly reducing NH3 emissions [30,31,32,39]. Lower NH3 concentrations in poultry houses due to the alum applications have been shown to increase poultry performance, including higher broiler weight gains, better feed conversion, less diseases, and lower mortality rates; resulting in higher profits for poultry producers [40,41]. Another economic benefit of using alum to lower NH3 emissions within poultry houses is the reduced amount of electricity and propane needed for ventilation in the winter months [32,39,42,43], which leads to lower carbon dioxide (CO2) emissions. Shreve et al. [37] found that alum-treated litter increased forage yields by 28% compared to untreated litter and indicated that this increase was due to increased N availability. Laboratory studies by Moore et al. [30,31] showed that additions of alum to litter resulted in a much higher litter N content, suggesting litter treated with alum increases its value as a fertilizer source.
The production and environmental benefits of alum are the reason why over one billion broilers are being grown each year in the United States with alum additions [41]. In recent years, however, the price of alum has increased substantially. Two decades ago, Moore et al. [32] calculated the benefit/cost ratio of using alum application to be 1.96, making alum cost effect. At the time the cost of alum was around $220 Mg−1. However, Moore [44] reported that the cost of alum had increased to at least $440 Mg−1. The increased cost in alum has facilitated the need to find alternative litter amendments that are as effective in reducing NH3 emissions as alum, but at a lower cost to farmers.
Alum mud litter amendment (AMLA) is a litter amendment made from alum mud, bauxite, and sulfuric acid [44] which was patented by Moore [45] in 2016. Alum mud is an acidic solid residue formed as a byproduct during the manufacture of alum [46]. Adak et al. [46] stated that “alum mud can be characterized as an acidic slurry of very fine particles of aluminum oxide, iron oxide, silica, titanium dioxide, etc., and/or mineralogy of different phases like biotite, mullite, quartz, hematite, and rutile”. Alum manufacturers in the United States pay around $33 Mg−1, plus transportation costs to landfill the alum mud byproduct [44]. Laboratory studies conducted by Moore [44,45], have shown that this new litter amendment was comparable to liquid or dry alum in reducing NH3 volatilization. In these studies, Moore [44,45] found the most promising mixtures of alum mud, bauxite, and sulfuric acid reduced NH3 losses by 62% to 73% compared to untreated litter, which was not significantly different from litter treated with alum.
The objective of this study was to evaluate the effects of AMLA on NH3 emissions, litter chemistry, and poultry production in a poultry rearing environment. Pen trials are also needed to ascertain there are no negative effects on poultry production prior to testing in commercial broiler houses.

2. Materials and Methods

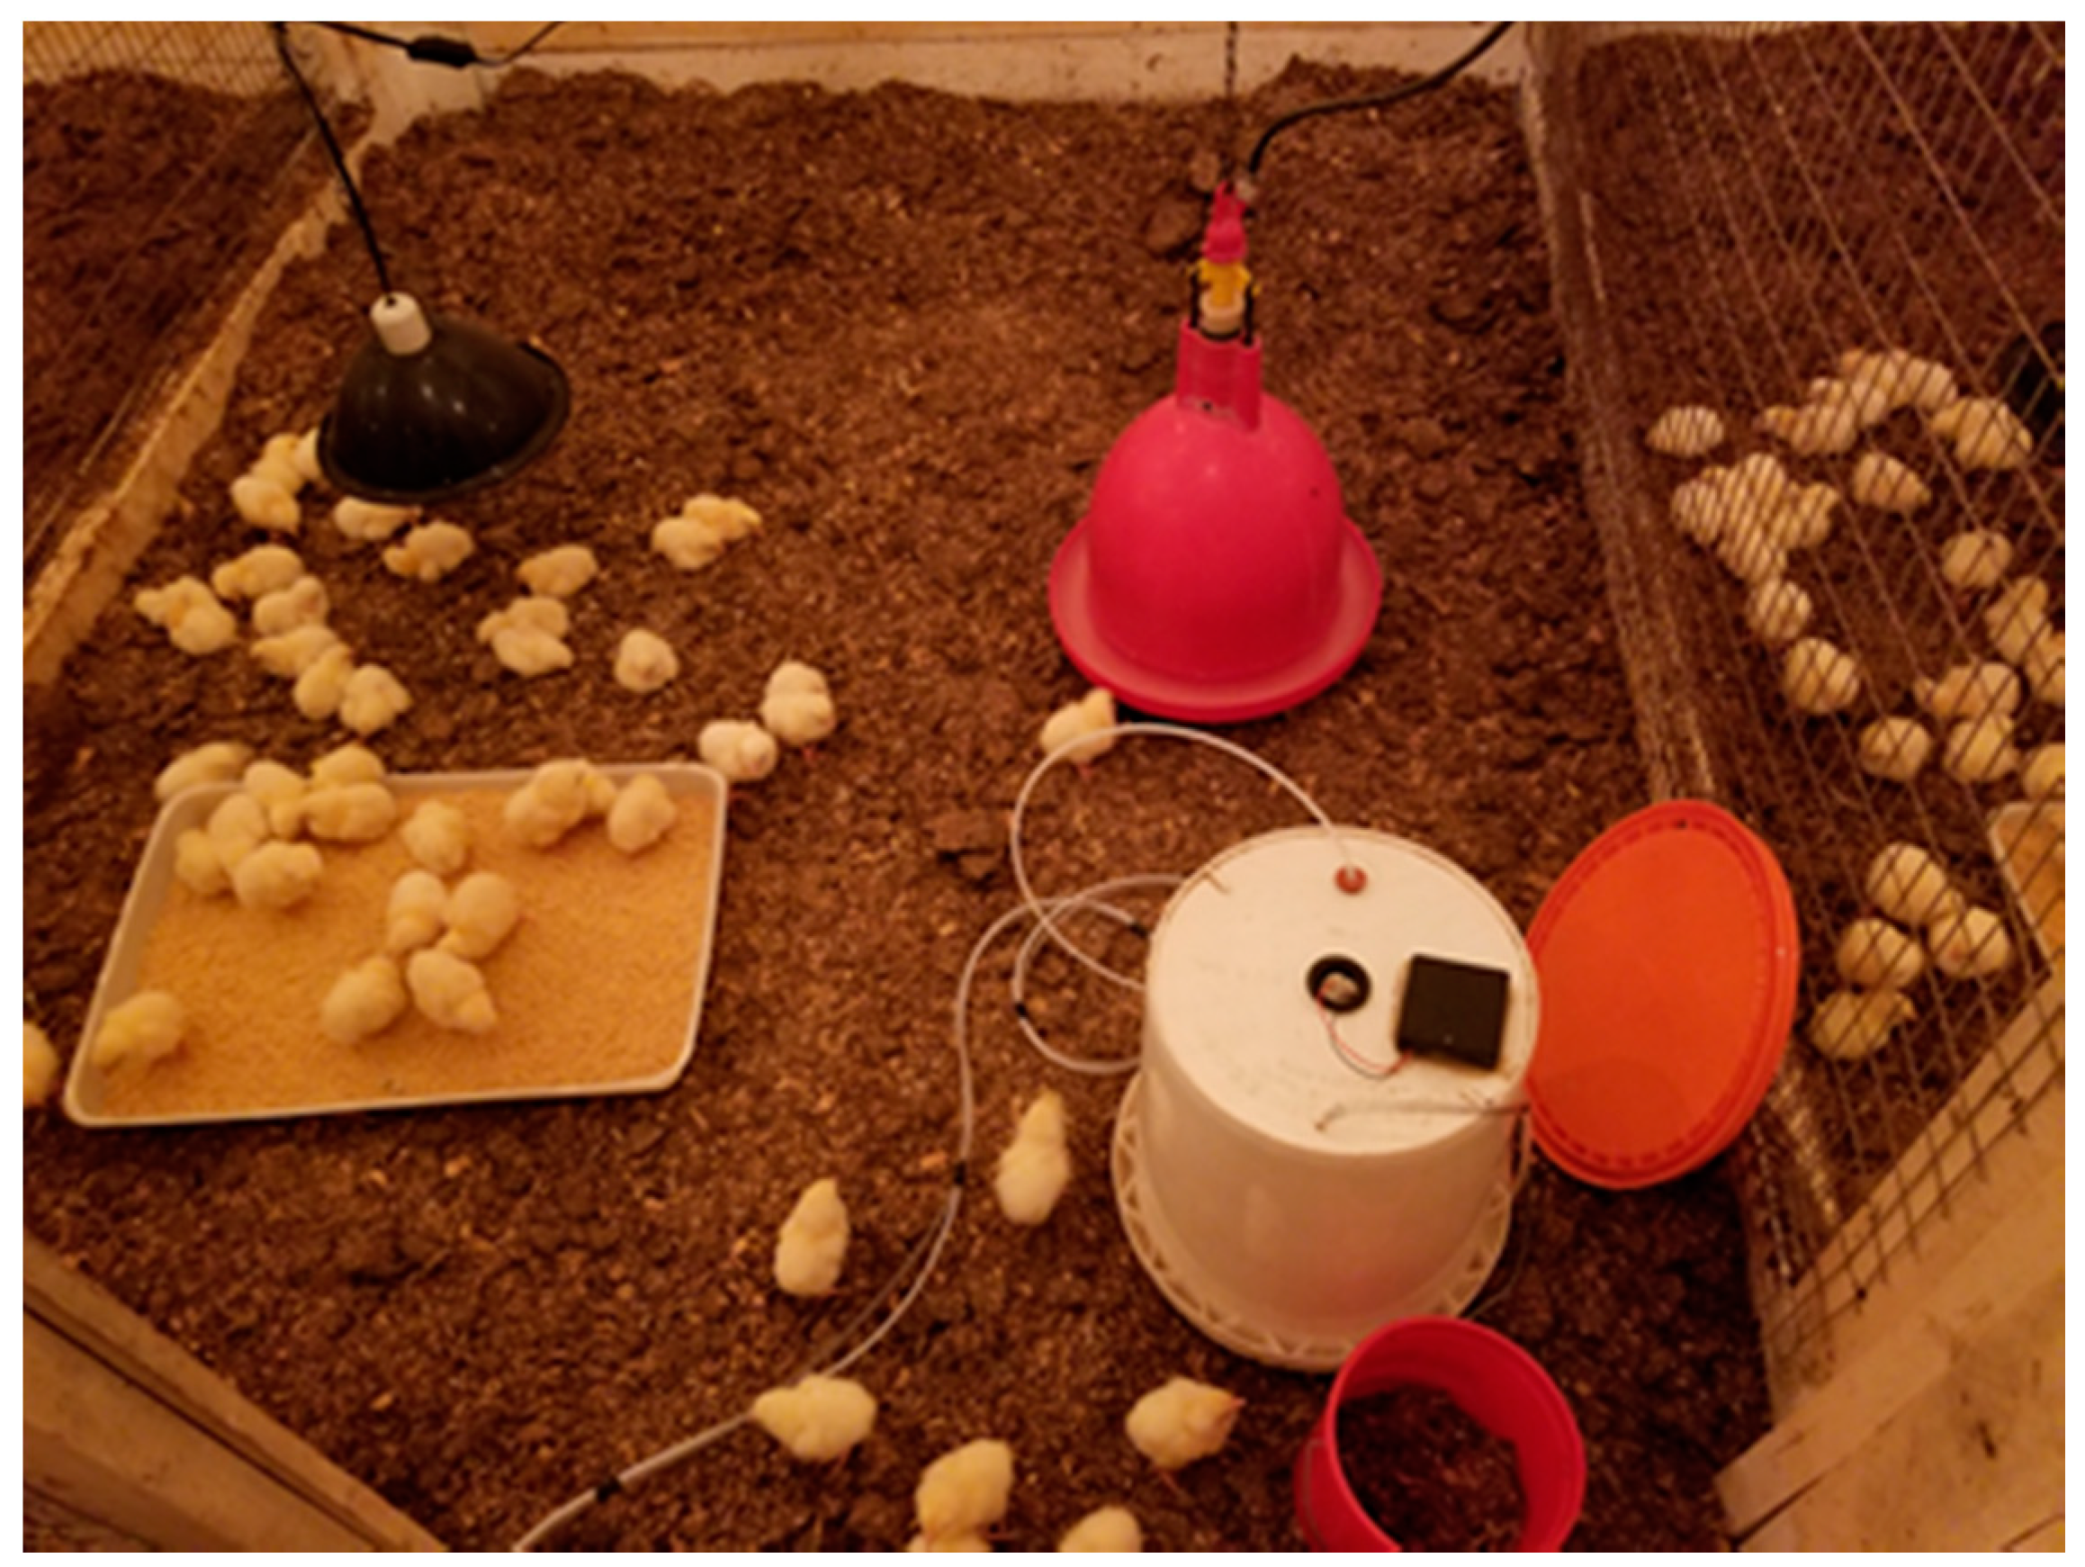
2.1. Design and Treatments

This study took place at the Poultry Farm at the University of Arkansas Agricultural Research Station in Fayetteville, Arkansas, using methods similar to those reported by Choi and Moore [47] in 2008. Three separate flocks of 500 male and 500 female Cobb × Cobb 1-d-old broiler chicks were obtained from a commercial hatchery. Each flock of chicks was randomly allocated to 20 pens (2.1 × 1.8 m, 50 birds per pen) in a single room where the atmosphere was mixed (Figure 1). The flocks were each raised for 42 d. An area of approximately 0.08 m2 was allotted for each bird. Ventilation consisted of a single fan producing negative pressure in the house. Pens were equipped with one tube feeder and an automatic bell drinker. Chicks were fed starter diets from days 0 to 14, grower diets from days 14 to 35, and finisher diets from days 35 to 42. The first flock of birds was placed on 5 cm of clean wood shaving bedding (17.2 kg per pen). The purpose of the first flock of birds was to produce the poultry litter needed for the experiment. The second flock was place one week after the removal of the first flock. Due to the longest government shutdown in U.S. history and the fear of another shutdown the third flock of birds was not placed until one year after the removal of the second flock. In between each flock the litter was tilled to break up any cake (hard layer of moist manure) that formed. Weekly feed intake, weight gains, and feed:gain were determined for each pen during the second and third flocks, as described in Borges et al. [25]. Feed intake was determined by taking the difference between feed supplied and leftover feed from each pen. Weight gain was calculated as the difference between initial weight and final weight for each pen. Both feed intake and weight gain were converted to a per bird basis by dividing the total pen value by the number of birds remaining in each pen after each week. Feed:gain was calculated as a ratio between feed intake and weight gain. Mortalities were recorded daily and were calculated by dividing the number of birds that died by the initial number of birds placed in each pen and multiplying by 100 [30]. The treatments were chosen for each of the 20 pens in a randomized block design with four replicates of five experimental treatments. The five treatments used in this study were: (1) control, (2) 49 kg AMLA/100 m2 incorporated, (3) 98 kg AMLA/100 m2 incorporated, (4) 98 kg AMLA/100 m2 surface applied, and (5) 98 kg alum/100 m2 incorporated. Litter amendments were added to the designated pens three days prior to the placing of the second and third flocks. For the surface applied treatment, amendments were evenly spread on the litter surface, whereas amendments were mixed into the top 2–3 cm of the litter for incorporated treatments.

2.2. Flux Measurements and Litter Collection

Ammonia flux measurements and litter samples were collected from each pen at days 0, 7, 14, 21, 28, 35, and 42. Gas emissions from the litter were measured within each pen at three random locations using a plastic flux chamber attached to an Innova 1512 Photo-acoustic Multi-gas Analyzer (Innova AirTech Instruments, Ballerup, Denmark) according to the method of Miles et al. [48] (Figure 1). The flux chamber was a cylindrical plastic container with a radius of 14.5 cm and height of 35 cm, which was equipped with a battery-operated fan to stir the air. Ammonia, CO2, methane (CH4), and nitrous oxide (N2O) were measured above the litter surface before placing the chamber (time zero) and at 60, 120, and 180 s as was done by Choi and Moore [47]. The difference between the concentrations at time zero and 60 s was used in conjunction with the ideal gas law to estimate NH3 flux from the litter. Flux measurements were converted to an aerial basis (mg NH3-N m−2 hr−1). Moore et al. [49] found that although NH3 fluxes (mg NH3 m−2 hr−1) measured using a small chamber were highly correlated to measured NH3 emissions (mg NH3 m−2 hr−1) in a study conducted in commercial broiler houses, flux measurements tended to be somewhat higher than the actual emissions. Moore et al. [49] speculated that the higher NH3 values observed are caused by the disturbance of the litter surface when placing the flux chamber. Atmospheric NH3 was not measured in this study since the air from the 20 pens was mixed. Litter samples were collected from the same three locations in the pen where fluxes were measured and mixed thoroughly in a plastic bucket. A small sub-sample of this litter was placed in a plastic bag and kept refrigerated until analyzed; the excess litter was returned to the pen.

2.3. Litter Analysis

Litter samples were analyzed for moisture content, pH, electrical conductivity (EC), soluble and total metals, NH4-N, nitrate-N (NO3-N), and total N (TN). Ammonium-N and NO3-N are reported on an N basis, which allows for a better comparison of the different N forms. Moisture content of litter was determined by oven drying a subsample of litter at 65 °C for 1 week. Soluble metals and NO3-N were determined using a 1:10 (litter:water) extraction ratio according to Self-Davis and Moore [50] using fresh litter. Ammonium was determined using a 1:10 (litter: 1N KCl) extraction ratio according to Choi and Moore [51] using fresh litter. Soluble metals in the water extract were analyzed by inductively coupled plasma optical emission spectroscopy (ICP-OES) on an Agilent 5110 ICP-OES (Agilent Technologies, Santa Clara, CA, USA). Both NH4-N and NO3-N were analyzed colorimetrically on a Skalar auto-analyzer (Skalar, Buford, GA, USA); using the salicylate-nitroprusside USEPA Method 351.2 [52] for NH4-N and the Cd-reduction method according to American Public Health Association Method 418-F [53] for NO3-N. A subsample of the 1:10 (litter:water) water extraction was used to measure pH and EC. Total metals were determined by digesting oven-dried, ground litter samples with nitric acid and hydrogen peroxide according to the method by Zarcinas et al. [54] followed by ICP-OES analysis. Total N was determined by dry combustion of fresh litter using an Elementar Vario Max Analyzer (Elementar Americas, Ronkonkoma, NY, USA).

2.4. Data Analysis

Analysis of variance (ANOVA) was performed to evaluate litter amendments effect on NH3 flux and litter characteristics using the GLIMMIX procedure in SAS 9.4 [55,56]. A randomized block design was used for the experimental design with a one-factor factorially arranged treatment design. The five different treatment levels that were evaluated included: (1) a control, (2) 49 kg AMLA/100 m2 incorporated, (3) 98 kg AMLA/100 m2 incorporated, (4) 98 kg AMLA/100 m2 surface applied, and (5) 98 kg alum/100 m2 incorporated and were considered fixed effects. Blocks and replicates within pens were considered random effects. Mean separations were performed using Fisher’s LSD test at the 0.05 probability level. Statistics for each flock were done separately.

3. Results and Discussion

3.1. Broiler Performance

The only significant difference observed in feed intake, weight gain, feed conversion (feed:gain), and mortality during this study was in feed intake for flock 2 (Table 1). For feed intake during flock 2, the high rate of alum and low rate of incorporated AMLA were significantly higher compared to the high rate of incorporated AMLA. The mortality tended to be greater for the alum and untreated control treatments during both flocks, however high variability between pens within the same treatments caused no significant differences to be observed.
Similar to the finding in the study conducted by Choi and Moore [47] the problem with having all of the treatments in the same building is the atmospheres of the various pens were mixed; therefore, the effect of atmospheric NH3 concentration on broiler performance was not observed. Studies by Moore et al. [44] and McWard and Taylor [40] reported that broiler performance (weight gain and feed conversion) was significantly better when grown on alum-treated litter. Although the amendments did not improve broiler performance in this study, they did not have any negative impacts either.

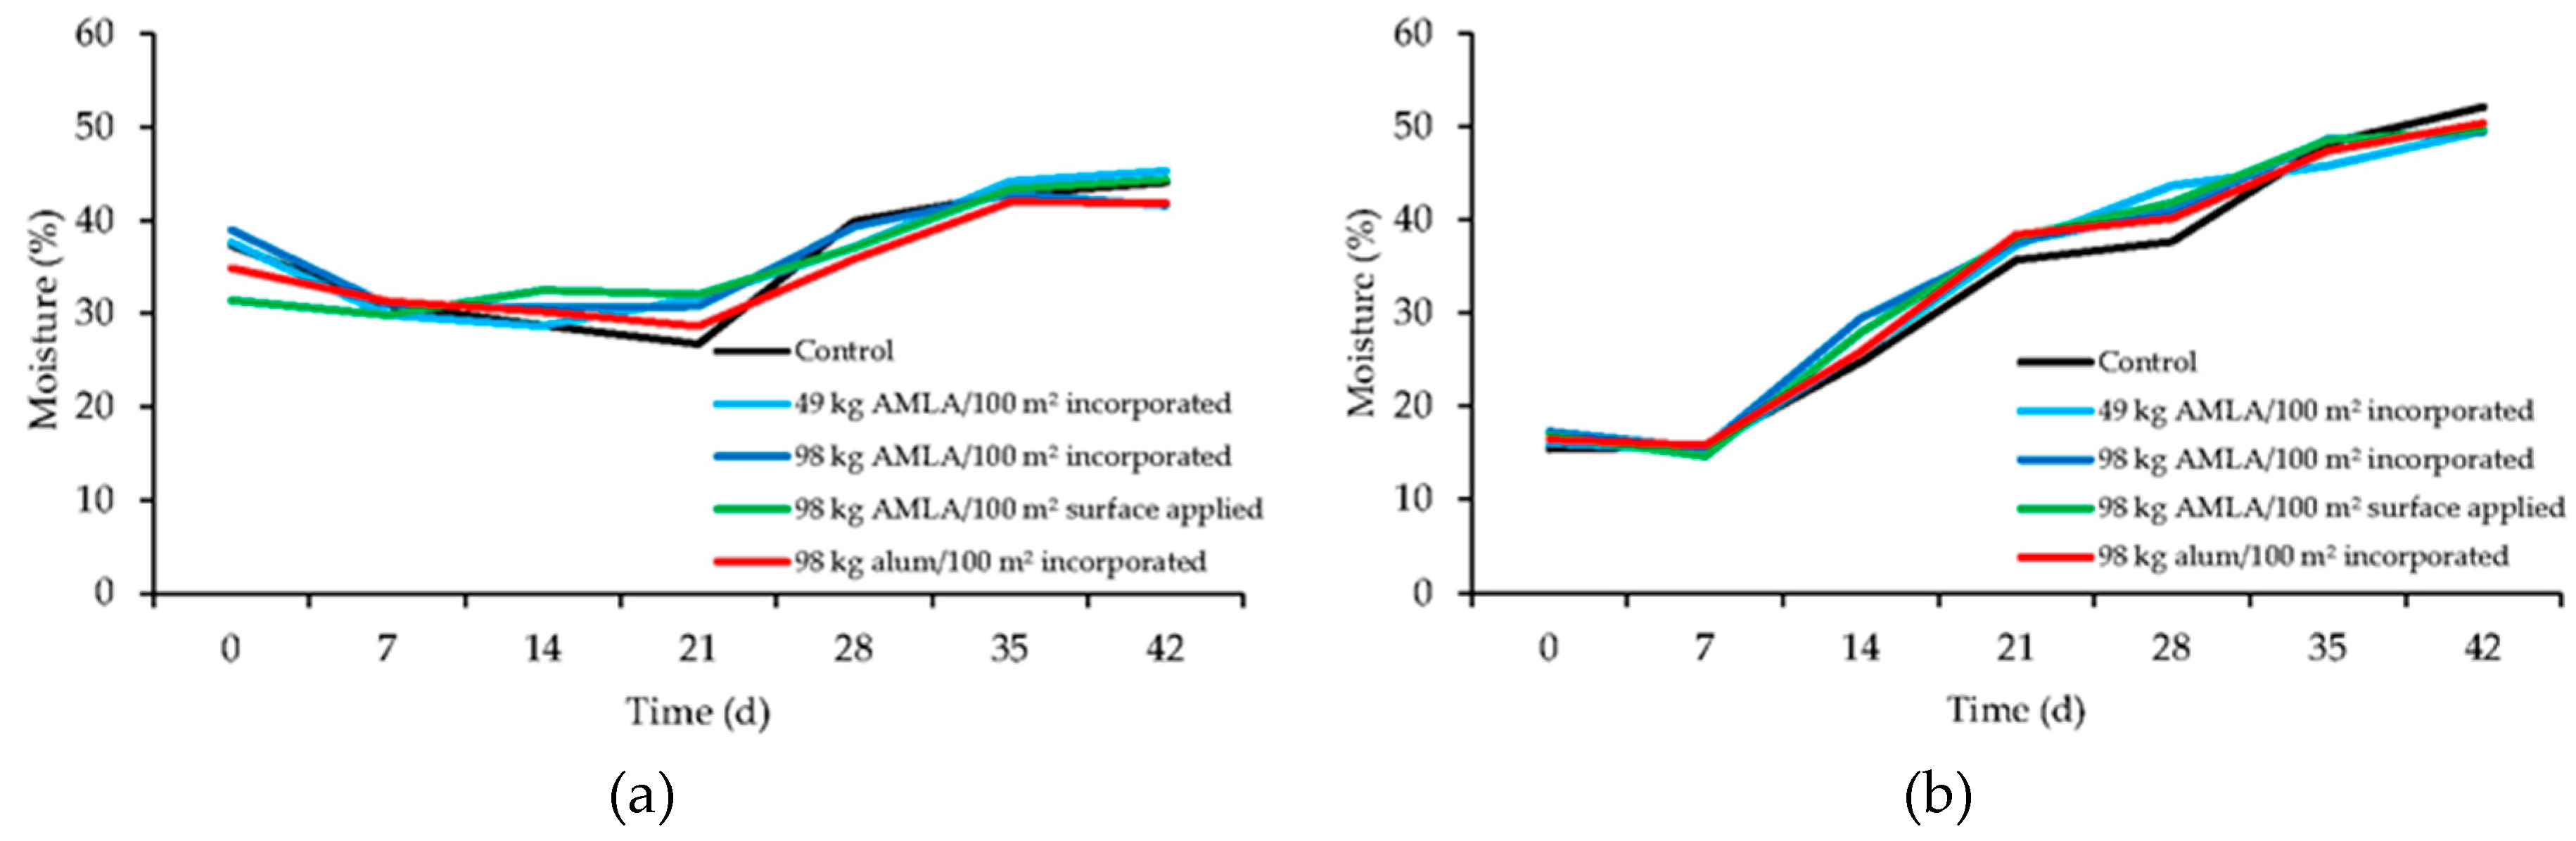
3.2. Litter Properties
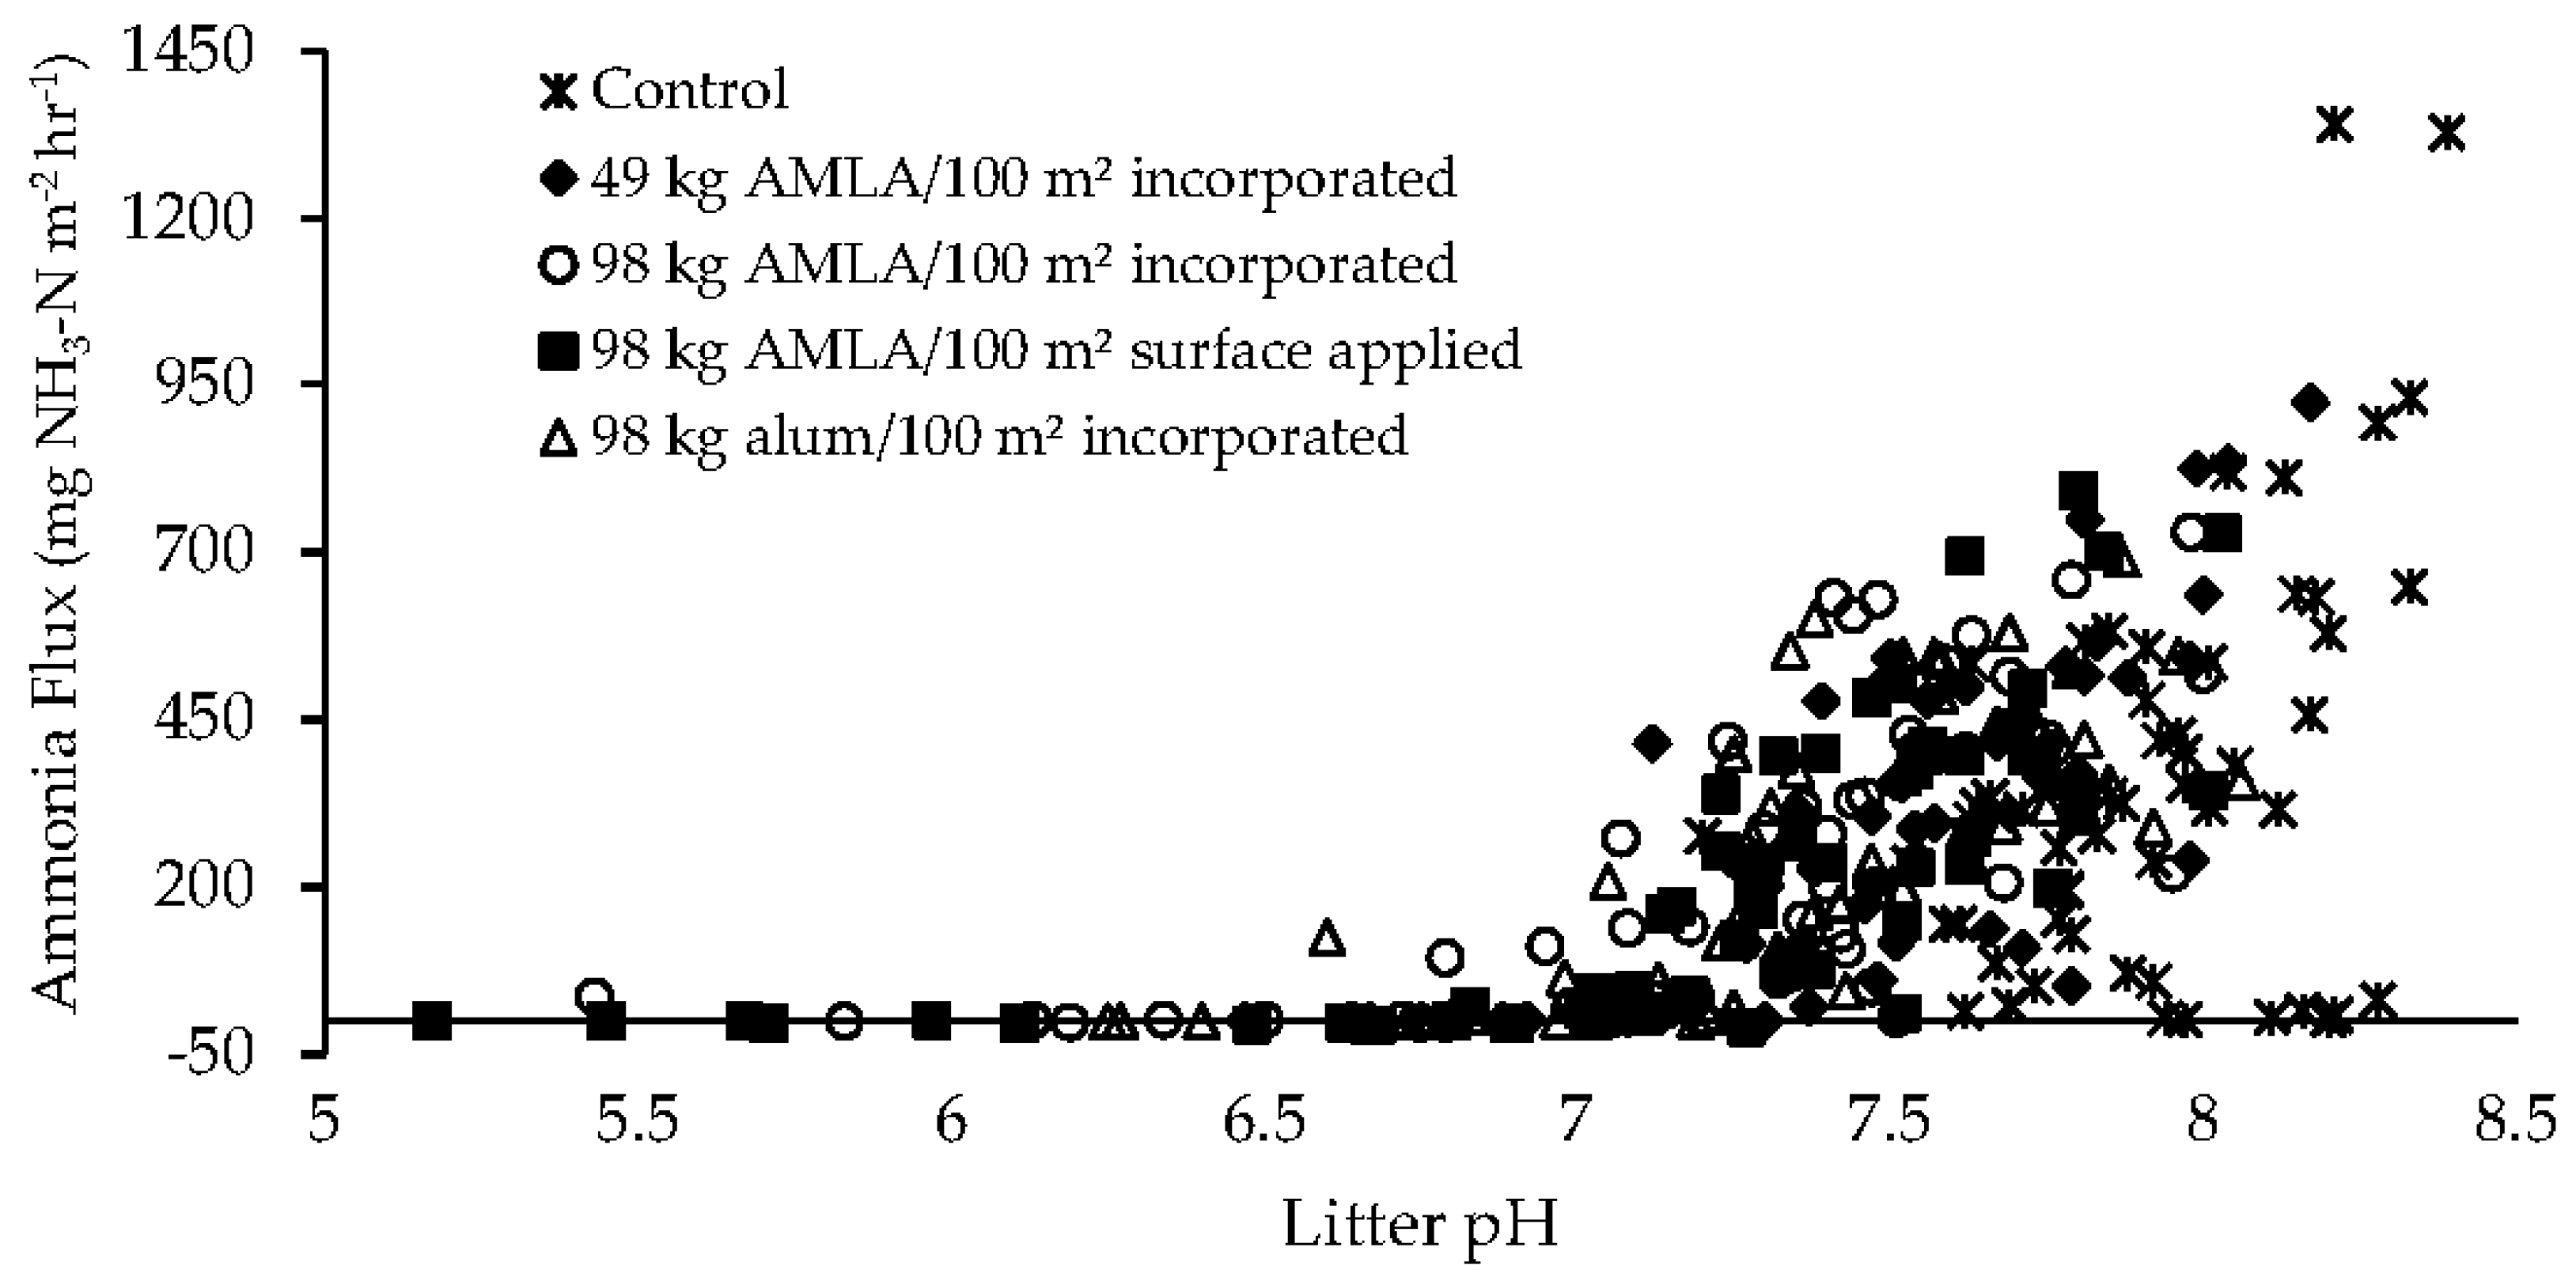
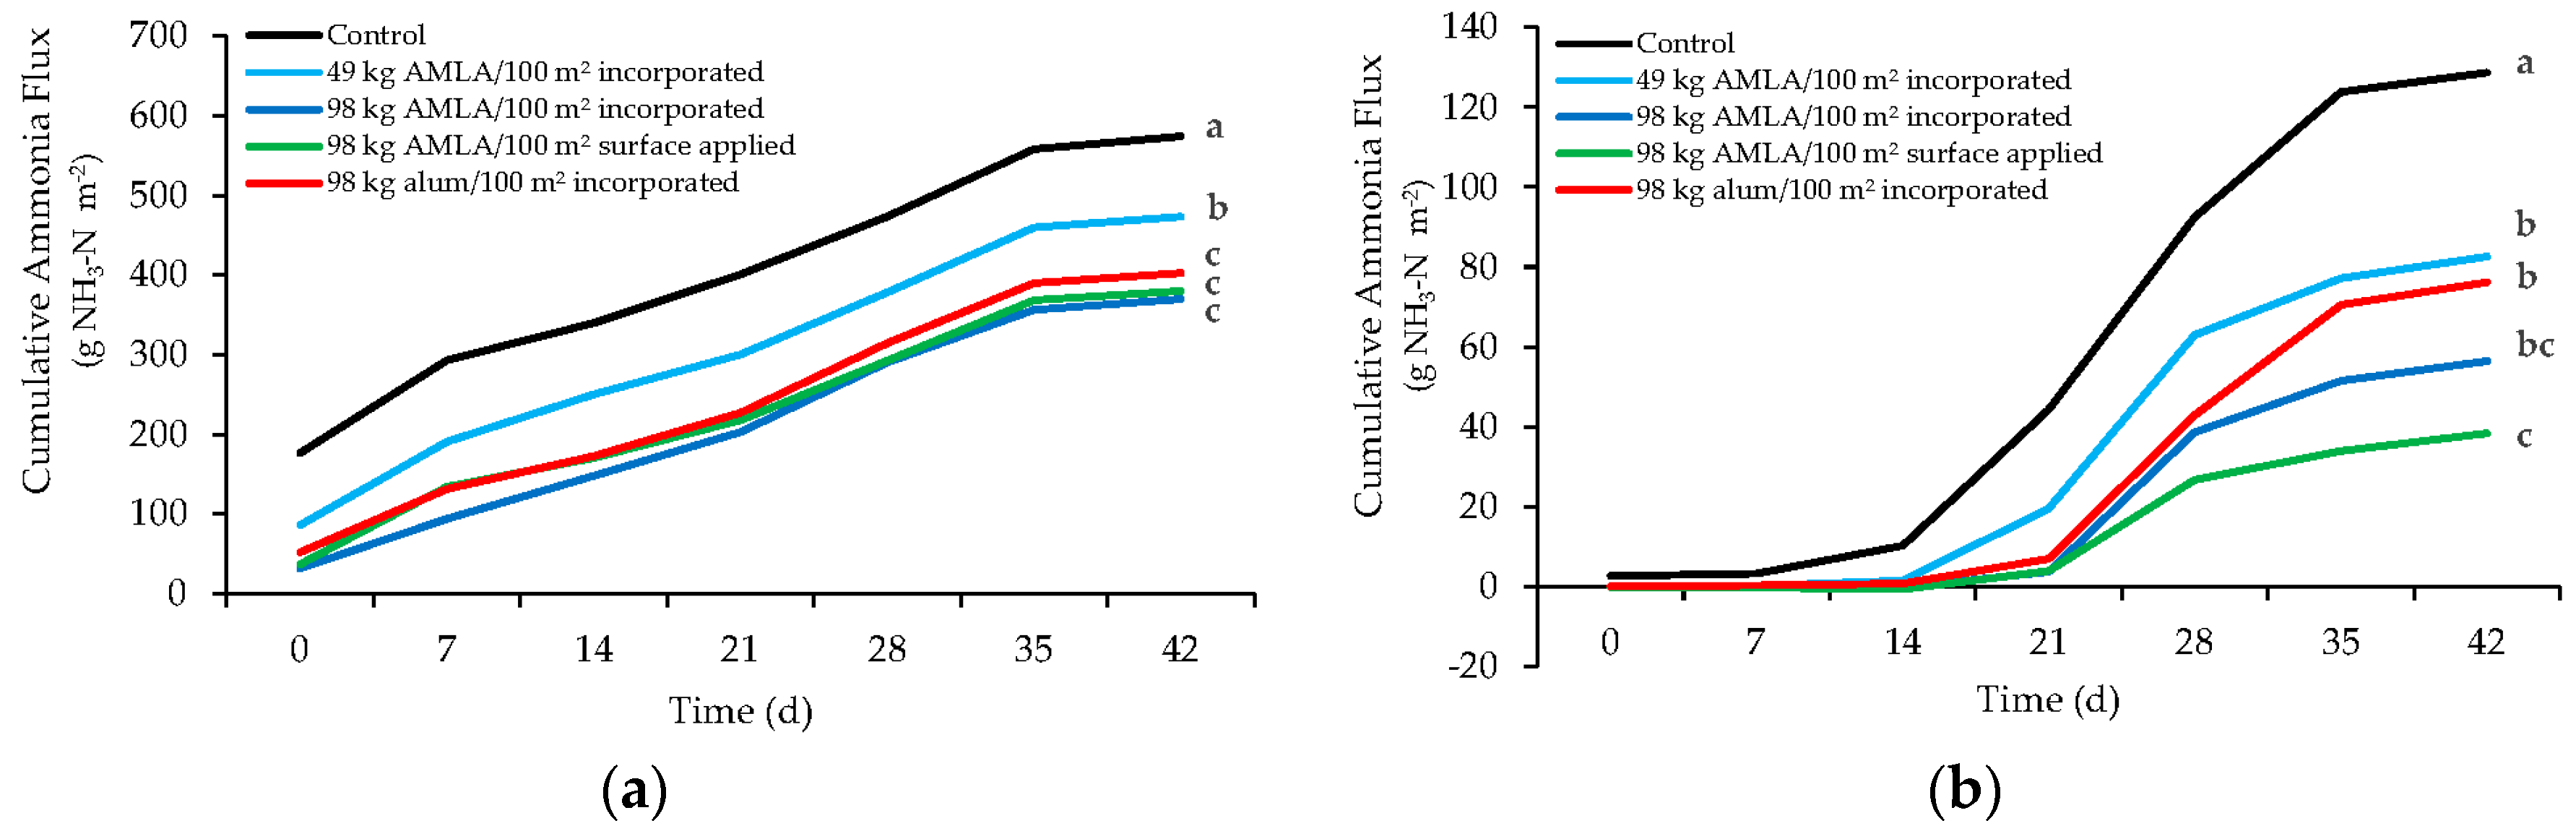
Litter properties such as moisture and pH have been recognized as major factors affecting NH3 volatilization from litter [57,58]. Litter moisture data for flock 2 and 3 are shown below in Figure 2a,b, respectively. There were no treatment effects on the moisture content of litter for either flock. The average litter moisture over the 42 days for both flock 2 and 3 were similar (36 and 34%, respectively). However, while the litter moisture increased by 21% during flock 2, it increased by 206% during flock 3. The moisture content at the beginning of flock 3 was very low (16%) compared to flock 2 (36%) due to increased time between the flocks, which would inhibit NH3 volatilization. Flock 2 birds were placed one week after flock 1, while flock 3 birds were placed on 1-yr-old litter, which had dried out over time. During flock 3 the very moist conditions towards the end of the flock led to the formation of a thick layer of cake, which likely lowered NH3 emissions, but also increased the variability in emissions.
Alum mud litter amendment and alum additions reduced the pH of the litter as expected (Table 2). During flock 2 the average pH was lower when incorporating the high rate of alum (7.58) and AMLA (7.45) compared to the untreated litter (7.99). Likewise, during flock 3, the average pH for the high rate of incorporated alum (7.06) and AMLA (6.91) was also lower than untreated litter (7.85). In fact, the pH of the treated litter was lower compared to the untreated litter for 5 of the 7 weeks during flock 2 and for all 7 weeks during flock 3. In general, the treatments lowered the pH of flock 3 more than flock 2 (Table 2). Choi and Moore [47] found that dry alum reduced the pH of litter by 0.86 units compared to the untreated litter, which is slightly lower than the change observed for day 0 to day 42 during flock 3 of this study (0.96 units), but higher than the average change between the 2 flocks (0.53 units). The lower pH in the treated litter shifts the NH3/NH4 equilibrium towards the less volatile NH4 –N form. However, with time, as the birds produced more manure, the pH of the treated litter increased. The average pH for the two flocks increased from day 0 to day 42 by 1.07 and 1.02 units for both incorporated and surface applied AMLA, respectively, and by 0.53 units for incorporated alum. Moore et al. [33] found that when litter pH exceeds 7, the NH3 volatilization rate increases rapidly. This study showed similar results, with NH3-N flux (mg NH3-N m−2 hr−1) rapidly increasing once litter pH increased above 7 (Figure 3). The volatilization of NH3 has been shown to be very dependent on litter pH, with NH3 volatilization increasing as pH increases [57].
Electrical conductivity ranged from 5.46 to 8.97 mS cm−1 during flock 2 and from 6.84 to 11.63 mS cm−1 during flock 3 (data not shown). Average EC in litter for both flock 2 and flock 3 was greater when incorporating high rates of alum and AMLA as well as when surface applying AMLA compared to untreated litter. The higher EC in the treated litter is associated with sulfate salts such as, ammonium sulfate, calcium sulfate, and potassium sulfate which are added from alum and AMLA [33,51].
Litter NH4-N concentrations as a function of time are shown in Table 3 for flocks 2 and 3. As expected a buildup of NH4-N in litter occurred over time with all treatments for both flocks, as the amount of manure produced by the birds increased. During both flocks the untreated litter had lower NH4-N concentrations for all 7 weeks compared to litter with high rates of alum and AMLA additions. The highest NH4-N concentrations were typically observed in the high rates of incorporated alum and AMLA for both flocks. At day 42, the NH4-N concentrations for flock 2 were 37.5% and 25.2% higher for litter incorporated with high rates of alum and AMLA, respectively, compared to untreated litter. During flock 3 the NH4-N concentrations found with high rates of incorporated alum and AMLA were significantly higher (38.4% and 33.9%, respectively) at day 42 compared to untreated litter. The differences observed in NH4-N concentrations between the alum and AMLA treated litter and the untreated litter are due to a reduction in NH3 emissions from the alum and AMLA (see ammonia flux). The effects of alum treatments on NH4-N are consistent with those observed by Choi and Moore [47] and Moore et al. [30,32]. These studies showed that the higher rates of alum resulted in a significant increase in NH4-N concentrations within the litter. In a laboratory study conducted by Moore [44], litter amended with mixtures of alum mud, bauxite, and sulfuric acid resulted in approximately 45% increase in NH4-N concentrations of the litter compared to the untreated control. These results are higher than the change in NH4-N for AMLA treatments observed in this study, however, the study by Moore [44] was done in a controlled laboratory.
Alum mud litter amendment and alum additions to the litter also resulted in higher TN litter concentrations for both flocks (Table 4). The TN concentrations were significantly different at days 0, 7, and 14 during flock 2 and days 14, 21, 28, and 35 during flock 3. Total N in litter tended to increase over time for both flocks and was on average higher for litter incorporated with alum (23.0 g kg−1) and AMLA (21.8 g kg−1) compared to untreated litter (19.9 g kg−1). As N is typically the limiting nutrient for most crops the higher concentrations of NH4-N and TN observed in the alum and AMLA treated litter would be expected to increase yields [33]. A long-term alum study conducted by Moore and Edwards [59] reported a 6% increase in tall fescue yields when alum-treated litter was applied to plots compared to plots with applications of untreated litter, suggesting greater N availability in litter treated with alum.

3.3. Ammonia Flux

The highest NH3 flux measured in this study (1052 mg NH3-N m−2 hr−1) was measured in the control treatment at day 0 of flock 2 (Table 5), which was likely due to the buildup of NH4-N from flock 1. One of the most important times to have low NH3 concentrations in poultry rearing facilities is at the beginning of a flock, since 1-d-old chicks, which are very susceptible to high NH3 levels are placed in the chicken houses [30]. Alum mud litter amendments and alum during day 0 reduced NH3 emissions by 51–82% for flock 2, with the high rate alum by 71% and AMLA by 82%. At day 7, the high rate of incorporated AMLA (370 mg NH3-N m−2 hr−1) was statistically lower than the untreated litter (694 mg NH3-N m−2 hr −1), whereas alum was not. There were no statistical differences between treatments observed in NH3 emission for the remaining five weeks (days 14 to 42) in flock 2. The overall cumulative emissions (Figure 4a) were significantly lower compared to untreated litter (574 g NH3-N m−2) for the high rate of incorporated and surface applied AMLA (370 and 380 g NH3-N m−2, respectively). These were not significantly different from incorporated alum (403 g NH3-N m−2). This represents a 36%, 34%, and 30% reduction in NH3 volatilization for high rates of incorporated AMLA, surface applied AMLA, and incorporated alum, respectively, during flock 2. The higher litter moisture at the start of this flock may potentially have caused rapid dissolution of alum and AMLA. This could cause the acidity from the amendments to be neutralized relatively early on in the flock.
At the start of flock 3 the majority of the NH3-N present at the end of flock 2 had volatilized from the litter, which was not surprising, since almost one year elapsed between these flocks (Table 5). Additions of alum and AMLA amendments significantly reduced NH3 fluxes from the litter for the first three weeks (days 0 to 21) of flock 3, which was probably due to lower litter pH and drier litter. In fact, negative NH3 fluxes were observed for the alum and AMLA treated litter during the first three weeks. On day zero the high rate of incorporated AMLA and alum reduced NH3 emissions by 99 and 104%, respectively, compared to untreated litter. By day 21 the high rate of incorporated alum and AMLA reduced NH3 emissions by 81% and 89%, respectively. On days 28 and 35 the NH3 emissions from alum and AMLA were not significantly lower than the controls. This may have been due to the tremendous variability within the pens, which was caused by thick cake formed under the moist litter conditions. Cumulative NH3 emissions from the high rates of incorporated alum (76 g NH3-N m−2) and AMLA (57 g NH3-N m−2) were reduced by 41% and 56%, respectively, compared to untreated litter (129 g NH3-N m−2) (Figure 4b). During this flock (flock 3) the high rate of surface applied AMLA, had the greatest effect on NH3 emissions, significantly reducing them by 70%.
The overall NH3 reduction from the additions of alum from both flock 2 (30%) and flock 3 (41%) of this study was less than that found in laboratory studies conducted by Choi and Moore [51] and Moore [31]. In those studies, the additions of dry alum reduced NH3 losses by 77% [51] and 86% [44]. It is important to note that the presence of broiler chickens, which are continually adding water and manure, does not occur with laboratory studies. In an on-farm comparison of alum, Moore et al. [33] reported additions of alum to litter significantly reduced the flux of NH3 from litter by 99% during the first four weeks. Those results were similar to the results observed during flock 2 of this study where alum-treated litter reduced NH3 emissions by 81% in the first three weeks.
This was the first pen trial evaluating the effects of AMLA on NH3 emissions. In the laboratory study Moore [44] found mixtures of alum mud, bauxite, and sulfuric acid dramatically decreased NH3 volatilization from litter. These results were not significantly different from litter treated with alum. The results from this pen trial also showed no significant difference between AMLA and alum. The data from this study indicates that AMLA, which can be manufactured for a much lower price than alum, is an effective litter amendment for reducing NH3 emissions from poultry litter.

4. Conclusions

Litter characteristics (pH, EC, NH4-N, and TN) for both the high rates of incorporated alum and AMLA were very similar in this study. The average litter pH for both flocks was higher in untreated (control) litter (7.92) compared to incorporating alum (7.32) and AMLA (7.18). The two flocks’ average NH4-N concentrations at day 42 were 38% and 30% higher for high rates of incorporated alum and AMLA, respectively, compared to untreated litter. The higher N content of treated litter observed in this study suggests that poultry litter treated with alum and AMLA may have higher value as a fertilizer source.
Alum mud litter amendment reduced NH3 emissions equivalent to, and in some cases greater than, alum. Average NH3 emissions over two flocks were reduced 35% when incorporating alum and 46% when incorporating AMLA. Hence, alum mud litter amendment can be considered a cheaper and effective alternative for alum for reducing NH3 emissions in a poultry rearing environment. Future research evaluating the effects of this new litter amendment on broiler production and NH3 emissions in commercial houses is planned.

Author Contributions

Conceptualization, P.A.M.J.; methodology, P.A.M.J.; validation, P.A.M.J.; formal analysis, K.A.; investigation, K.A., J.M., and P.A.M.J.; resources, P.A.M.J.; data curation, K.A. and J.M.; writing—original draft preparation, K.A.; writing—review and editing, P.A.M.J., K.A., J.M., and A.J.A.; supervision, P.A.M.J.; project administration, P.A.M.J.; funding acquisition, P.A.M.J. All authors have read and agreed to the published version of the manuscript.

Funding

This research received no external funding.

Acknowledgments

The authors would like to thank Wally McDonner, Caleb Miller, and Scott Zornes, whose assistance at the farm was invaluable.

Conflicts of Interest

The authors declare no conflict of interest. Mention of a trade name, proprietary product, or specific equipment does not constitute a guarantee or warranty by the USDA and does not imply its approval to the exclusion of other products that may be suitable.

References

  1. Battye, R.; Battye, W.; Overcash, C.; Fudge, S. Development and Selection of Ammonia Emission Factors; Final Report; EC/R Inc.: Durham, NC, USA, 1994. [Google Scholar]
  2. Qian, X.; Lee, S.; Chandrasekaran, R.; Yang, Y.; Caballes, M.; Alamu, O.; Chen, G. Electricity evaluation and emission characteristics of poultry litter co-combustion process. Appl. Sci. 2019, 9, 4116. [Google Scholar] [CrossRef] [Green Version]
  3. Lynch, D.; Henihan, A.M.; Bowen, B.; Lynch, D.; McDonnell, K.; Kwapinski, W.; Leahy, J.J. Utilisation of poultry litter as an energy feedstock. Biomass Bioenergy 2013, 49, 197–204. [Google Scholar] [CrossRef] [Green Version]
  4. Moore, P.A., Jr.; Miles, D.; Burns, R.; Pote, D.; Berg, K.; Choi, I. Ammonia emission factors from broiler litter in barns, in storage, and after land application. J. Environ. Qual. 2011, 40, 1395–1404. [Google Scholar] [CrossRef] [PubMed]
  5. National Chicken Council. Broiler Chicken Industry Key Facts 2019. Available online: https://www.nationalchickencouncil.org/about-the-industry/statistics/broiler-chicken-industry-key-facts/ (accessed on 10 January 2020).
  6. Nagaraj, M.; Wilson, C.P.; Saenmahayak, B.; Hess, J.B.; Bilgili, S.F. Efficacy of litter amendment to reduce pododermatitis in broiler chickens. J. Appl. Poult. Res. 2007, 16, 255–261. [Google Scholar] [CrossRef]
  7. Wheeler, E.; Casey, K.; Gates, R.; Xin, H.; Liang, Y.; Topper, P. Litter management strategies in relation to ammonia emissions from floor-raised birds. In Proceedings of the Mitigating Air Emissions from Animal Feeding Operations Conference, Iowa State University, Ames, IA, USA, 19–21 May 2008; pp. 99–103. [Google Scholar]
  8. Carlile, F.S. Ammonia in poultry houses: A literature review. Worlds Poult. Sci. J. 1984, 40, 99–113. [Google Scholar] [CrossRef]
  9. Miles, D.M.; Branton, S.L.; Lott, B.D. Atmospheric ammonia is detrimental to the performance of modern commercial broilers. Poult. Sci. 2004, 83, 1650–1654. [Google Scholar] [CrossRef]
  10. Miles, D.M.; Miller, W.W.; Branton, S.L.; Maslin, W.R.; Lott, B.D. Ocular responses to ammonia in broiler chickens. Avian Dis. 2006, 50, 45–49. [Google Scholar] [CrossRef]
  11. Donham, K.J. Air Quality Relationships to Occupational Health in the Poultry Industry. In Proceedings of the 1996 National Waste Management, Auburn, AL, USA, 21–23 October 1996; Blake, J.P., Patterson, P.H., Eds.; Auburn University Press: Auburn, AL, USA, 1996; pp. 24–28. [Google Scholar]
  12. Donham, K.J. Occupational Health Hazards and Recommended Exposure Limits for Workers in Poultry Buildings. In Proceedings of the 2000 National Waste Management, Auburn, AL, USA, 2000; Blake, J.P., Patterson, P.H., Eds.; Auburn University Press: Auburn, AL, USA, 2000; pp. 92–109. [Google Scholar]
  13. Kling, H.F.; Quarles, C.L. Effect of atmospheric ammonia and the stress of infectious bronchitis vaccination on Leghorn males. Poult. Sci. 1974, 53, 1161–1167. [Google Scholar] [CrossRef]
  14. Anderson, D.P.; Beard, C.W.; Hanson, R.P. The adverse effects of ammonia on chickens including resistance to infection with Newcastle Disease virus. Avian Dis. 1964, 8, 369–379. [Google Scholar] [CrossRef]
  15. Hutchinson, G.L.; Viets, F.G., Jr. Nitrogen enrichment of surface water by absorption of ammonia volatilized from cattle feedlots. Science 1969, 166, 514–515. [Google Scholar] [CrossRef]
  16. Schroder, H. Nitrogen losses from Danish agriculture-trends and consequences. Agric. Ecosyst. Environ. 1985, 17, 279–289. [Google Scholar] [CrossRef]
  17. ApSimon, H.M.; Kruse, M.; Bell, J.N. Ammonia emissions and their role in acid deposition. Atmos. Environ. 1987, 21, 1939–1946. [Google Scholar] [CrossRef]
  18. van Breemen, N.; Burrough, P.A.; Velthorst, E.J.; van Dobben, H.F.; de Wit, T.; Ridder, T.B.; Reijinders, H.F.R. Soil acidification from atmospheric ammonium sulphate in forest canopy through fall. Nature 1982, 299, 548–550. [Google Scholar] [CrossRef]
  19. Barthelmie, R.J.; Pryor, S.C. Implications of ammonia emissions for fine aerosol formation and visibility impairment: A case study from the Lower Fraser Valley, British Columbia. Atmos. Environ. 1998, 32, 345–352. [Google Scholar] [CrossRef]
  20. McCubbin, D.R.; Apelberg, B.J.; Roe, S.; Divita, F., Jr. Livestock ammonia management and particulate-related health benefits. Environ. Sci. Technol. 2002, 36, 1141–1146. [Google Scholar] [CrossRef] [Green Version]
  21. Elliot, H.A.; Collins, N.E. Factors affecting ammonia release in broiler houses. Trans. ASAE 1982, 25, 413–418, 424. [Google Scholar] [CrossRef]
  22. Arogo, J.; Westerman, P.W.; Herber, A.J.; Robarge, W.P.; Classen, J.J. Ammonia emissions from animal feeding operations. In Animal Agriculture and the Environment: National Center for Manure and Animal Waste Management White Papers; Rice, J.M., Caldwell, D.F., Humenik, F.J., Eds.; ASABE: St. Joseph, MI, USA, 2006; pp. 41–88. [Google Scholar]
  23. Sajeev, E.P.M.; Winiwarter, W.; Amon, B. Greenhouse gas and ammonia emissions from different stages of liquid manure management changes: Abatement options and emission interactions. J. Environ. Qual. 2017, 47, 30–41. [Google Scholar] [CrossRef] [Green Version]
  24. Sutton, A.L.; Applegate, T.; Hankins, S.; Hill, B.; Allee, G.; Greene, W.; Kohn, R.; Meyer, D.; Powers, W.; van Kempen, T. Manipulation of animal diets to affect manure production, composition and odors: State of the science. In Animal Agriculture and the Environment: National Center for Manure and Animal Waste Management White Papers; Rice, J.M., Caldwell, D.F., Humenik, F.J., Eds.; ASABE: St. Joseph, MI, USA, 2006; pp. 377–408. [Google Scholar] [CrossRef]
  25. Borges, S.A.; Fisher da Silva, A.V.; Ariki, J.; Hooge, D.A.; Cummings, K.R. Dietary electrolyte balance for broiler chickens under moderately high ambient temperatures and relative humidities. Poult. Sci. 2003, 82, 301–308. [Google Scholar] [CrossRef]
  26. Puumala, M. Storage of manure in heaps. In Sustainable Handling and Utilization of Livestock Manure from Animals to Plants. In Proceedings of the NJF Seminar No. 320, Horsens, Denmark, 16–19 January 2001; p. 202. [Google Scholar]
  27. Dalólio, F.S.; da Silva, J.N.; de Oliveira, A.C.C.; Tinôco, I.D.F.F.; Barbosa, R.C.; de Oliveira Resende, M.; Albino, L.F.T.; Coelho, S.T. Poultry litter as biomass energy: A review and future perspectives. Renew. Sustain. Energy Rev. 2017, 76, 941–949. [Google Scholar] [CrossRef]
  28. Zhu, S.; Lee, S.W. Co-combustion performance of poultry wastes and natural gas in the advanced Swirling Fluidized Bed Combustor (SFBC). Waste Manag. 2005, 25, 511–518. [Google Scholar] [CrossRef]
  29. Atimtay, A.; Yurdakul, S. Combustion and co-combustion characteristics of torrefied poultry litter with lignite. Renew. Energy 2020, 148, 1292–1301. [Google Scholar] [CrossRef]
  30. Moore, P.A., Jr.; Daniel, T.C.; Edwards, D.R.; Miller, D.M. Effect of chemical amendments on ammonia volatilization from poultry litter. J. Environ. Qual. 1995, 24, 293–300. [Google Scholar] [CrossRef] [Green Version]
  31. Moore, P.A., Jr.; Daniel, T.C.; Edwards, D.R.; Miller, D.M. Evaluation of chemical amendments to reduce ammonia volatilization from poultry litter. Poult. Sci. 1996, 75, 315–320. [Google Scholar] [CrossRef] [PubMed]
  32. Moore, P.A., Jr.; Daniel, T.C.; Edwards, D.R. Reducing phosphorus runoff and improving poultry production with alum. Poult. Sci. 1999, 78, 692–698. [Google Scholar] [CrossRef]
  33. Moore, P.A., Jr.; Daniel, T.C.; Edwards, D.R. Reducing phosphorus runoff and inhibiting ammonia loss from poultry manure with aluminum sulfate. J. Environ. Qual. 2000, 29, 37–49. [Google Scholar] [CrossRef] [Green Version]
  34. Smith, D.R.; Moore, P.A., Jr.; Haggard, B.E.; Maxwell, C.V.; Daniel, T.C.; VanDevander, K.; Davis, M.E. Effect of aluminum chloride and dietary phytase on relative ammonia losses from swine manure. J. Anim. Sci. 2004, 82, 605–611. [Google Scholar] [CrossRef]
  35. Li, H.; Xin, H.; Liang, Y.; Burns, R.T. Reduction of ammonia emissions from stored laying hen manure through topical application of zeolite, Al+ Clear, Ferix-3, or poultry litter treatment. J. Appl. Poult. Res. 2008, 17, 421–431. [Google Scholar] [CrossRef]
  36. Terzich, M.; Quarles, C.; Brown, J.; Goodwin, M.A. Effect of Poultry Litter Treatment (PLT) on the development of respiratory tract lesions in broilers. Avian Pathol. 1998, 27, 566–569. [Google Scholar] [CrossRef]
  37. Shreve, B.R.; Moore, P.A., Jr.; Daniel, T.C.; Edwards, D.R. Reduction of phosphorus in run-off from field-applied poultry litter using chemical amendment. J. Environ. Qual. 1995, 24, 106–111. [Google Scholar] [CrossRef]
  38. Moore, P.A., Jr.; Miller, D.M. Reducing phosphorus solubility in poultry litter with aluminum, calcium, and iron amendments. J. Environ. Qual. 1994, 23, 325–330. [Google Scholar] [CrossRef] [Green Version]
  39. Eugene, B.; Moore, P.A., Jr.; Li, H.; Miles, D.; Trabue, S.; Burns, R.; Buser, M. Effects of alum additions to poultry litter on in-house ammonia and greenhouse gas concentrations and emissions. J. Environ. Qual. 2015, 44, 1530–1540. [Google Scholar] [CrossRef] [PubMed]
  40. McWard, G.W.; Taylor, D.R. Acidified clay litter amendment. J. Appl. Poult. Res. 2000, 9, 518–529. [Google Scholar] [CrossRef]
  41. Moore, P.A., Jr. Improving the sustainability of animal agriculture by treating manure with alum. In Environmental Chemistry of Animal Manure; He, Z., Ed.; Nova Science: Hauppauge, NY, USA, 2011; pp. 349–381. ISBN 1-62808-641-6. [Google Scholar]
  42. Worley, J.W.; Risse, L.M.; Cabrera, M.L.; Nolan, M.P. Bedding for broiler chickens: Two alternative systems. Appl. Eng. Agric. 1999, 15, 687–693. [Google Scholar] [CrossRef]
  43. Worley, J.W.; Cabrera, M.L.; Risse, L.M. Reduced levels of alum to amend broiler litter. Appl. Eng. Agric. 2000, 16, 441–444. [Google Scholar] [CrossRef]
  44. Moore, P.A., Jr. Development of a new manure amendment for reducing ammonia volatilization and phosphorus runoff from poultry litter. J. Environ. Qual. 2016, 45, 1412–1429. [Google Scholar] [CrossRef]
  45. Moore, P.A., Jr. Composition and Methods of Treating Animal Manure. US Patent 9,301,440, 5 April 2016. [Google Scholar]
  46. Adak, A.; Mallik, D.; Chaudhuri, S.K. Alum mud: Phase identification and catalytic potential for aquepis-phase decomposition of hydrogen peroxide. Clays Clay Miner. 1999, 47, 234–238. [Google Scholar] [CrossRef]
  47. Choi, I.H.; Moore, P.A., Jr. Effects of liquid aluminum chloride additions to poultry litter on broiler performance, ammonia emissions, soluble phosphorus, total volatile fatty acids, and nitrogen contents of litter. Poult. Sci. 2008, 87, 1955–1963. [Google Scholar] [CrossRef]
  48. Miles, D.M.; Owens, P.R.; Rowe, D.E. Spatial variability of litter gaseous flux within a commercial broiler house: Ammonia, nitrous oxide, carbon dioxide, and methane. Poult. Sci. 2006, 85, 167–172. [Google Scholar] [CrossRef]
  49. Moore, P.A.; Miles, D.M.; Burns, R.; Pote, D.; Berg, K. Evaluation and Management of Ammonia Emissions from Poultry Litter. In Best Management Practices. In Proceedings of the Workshop on Agricultural Air Quality: State of Science, Potomac, MA, USA, 5–8 June 2006; pp. 304–310. [Google Scholar]
  50. Self-Davis, M.L.; Moore, P.A., Jr. Method of determining water soluble phosphorus in animal manure. In Methods of Phosphorus Analysis for Soils, Sediments, Residuals, and Water; Southern Cooperative Series Bulletin No. 396, SERA-IEG 17; Pierzynski, G.M., Ed.; North Carolina State University: Raleigh, NC, USA, 2000; pp. 74–77. ISBN 1-58161-396-2. [Google Scholar]
  51. Choi, I.H.; Moore, P.A., Jr. Effect of various litter amendments on ammonia volatilization and nitrogen content of poultry litter. J. Appl. Poult. Res. 2008, 17, 454–462. [Google Scholar] [CrossRef]
  52. USEPA. Methods for Chemical Analysis of Water and Wastes; USEPA Rep. 600/4-79-020. USEPA, Environ; Monitoring and Support Lab.: Cincinnati, OH, USA, 1983.
  53. APHA; AWWA; WEF. Standard Methods for the Examination of Water and Wastewater, 19th ed.; Eaton, A., Clesceri, L., Greenberg, A., Franson, M., Eds.; Am. Public Health Assoc.: Washington, DC, USA, 1995; ISBN 0-87553-223-3. [Google Scholar]
  54. Zarcinas, B.A.; Cartwright, B.; Spouncer, L.R. Nitric acid digestion and multi-element analysis of plant material by inductively coupled plasma spectrometry. Soil Sci. Plant Anal. 1987, 18, 131–146. [Google Scholar] [CrossRef]
  55. SAS Institute. SAS User’s Guide: Statistics; SAS Inst.: Cary, NC, USA, 2014. [Google Scholar]
  56. Schabenberger, O. Introducing the GLIMMIX Procedure for Generalized Linear Mixed Models; Proceedings SUGI 30; SAS Institute Inc.: Cary, NC, USA, 2005. [Google Scholar]
  57. Carr, L.E.; Wheaton, F.W.; Douglass, L.W. Empirical models to determine ammonia concentrations from broiler chicken litter. Trans. ASAE 1990, 33, 1337–1342. [Google Scholar] [CrossRef]
  58. Reddy, K.R.; Khaleel, R.; Overcash, M.R.; Westerman, P.W. A nonpoint source model for land areas receiving animal wastes: II. Ammonia volatilization. Trans. ASAE 1979, 22, 1398–1405. [Google Scholar] [CrossRef]
  59. Moore, P.A., Jr.; Edwards, D.R. Long-term effects of poultry litter, alum-treated litter, and ammonium nitrate on aluminum availability in soils. J. Environ. Qual. 2005, 34, 2104–2111. [Google Scholar] [CrossRef] [PubMed] [Green Version]
Figure 1. Photograph showing one of the pens used in the study.
Atmosphere 11 00257 g001
Figure 2. Litter moistures for (a) flock 2 and (b) flock 3 as a function of time.
Atmosphere 11 00257 g002
Figure 3. Ammonia flux (mg NH3-N m−2 hr−1) as a function of litter pH.
Atmosphere 11 00257 g003
Figure 4. Cumulative ammonia flux (mg NH3-N m−2) for (a) flock 2 and (b) flock 3 as a function of time. Treatments on day 42 not sharing a common letter are significantly different (p < 0.05).
Atmosphere 11 00257 g004
Table 1. Effect of amendments on broiler performance during flock 2 and 3.
TreatmentFeed Intake (kg)Weight Gain
(kg)
Feed:Gain
(kg:kg)
Mortality
(%)
Flock 2
Control3.87ab 2.12a1.83a7.00a
49 kg AMLA/100 m2 incorporated3.98a2.18a1.83a3.00a
98 kg AMLA/100 m2 incorporated3.77b2.08a1.81a5.50a
98 kg AMLA/100 m2 surface applied3.86ab2.15a1.80a4.00a
98 kg alum/100 m2 incorporated3.95a2.21a1.79a8.00a
Flock 3
Control4.14a2.59a1.62a8.50a
49 kg AMLA/100 m2 incorporated4.11a2.53a1.63a5.50a
98 kg AMLA/100 m2 incorporated3.97a2.51a1.58a4.50a
98 kg AMLA/100 m2 surface applied4.07a2.53a1.62a5.00a
98 kg alum/100 m2 incorporated4.00a2.45a1.64a7.50a
† Values in columns followed by different letters indicate significant (p < 0.05) differences in means within each flock.
Table 2. Litter pH for flock 2 and 3 by treatment by day.
TreatmentDayAvg.
071421283542
Flock 2
Control8.30a 8.21a7.72a7.99a7.76a7.92a8.06a7.99a
49 kg AMLA/100 m2 incorporated7.76ab7.92ab7.46a7.57b7.62b7.81ab7.91a7.72b
98 kg AMLA/100 m2 incorporated6.83c7.52c7.53a7.38b7.42c7.68b7.80a7.45c
98 kg AMLA/100 m2 surface applied7.41bc7.72bc7.52a7.45b7.48c7.75b7.77a7.58bc
98 kg alum/100 m2 incorporated7.76ab7.66bc7.22a7.50b7.45c7.66b7.83a7.58bc
Flock 3
Control8.19a8.08a7.78a7.83a7.67a7.77a7.62a7.85a
49 kg AMLA/100 m2 incorporated6.87b6.93b7.11b7.34b7.45b7.62ab7.45ab7.25b
98 kg AMLA/100 m2 incorporated6.09cd6.54b6.73cd7.07c7.34bc7.36c7.26b6.91cd
98 kg AMLA/100 m2 surface applied5.63d6.49b6.53d7.03c7.17d7.33c7.31b6.78d
98 kg alum/100 m2 incorporated6.41bc6.98b6.81c7.14c7.22cd7.51bc7.37b7.06bc
† Values in columns followed by different letters indicate significant (p < 0.05) differences in means within each flock.
Table 3. Litter ammonium (g NH4-N kg−1) for flock 2 and 3 by treatment by day.
TreatmentDayAvg.
071421283542
Flock 2
Control2.79b 2.29c2.14d2.17c2.24c3.73d4.64b2.86c
49 kg AMLA/100 m2 incorporated4.51a3.87b3.78c3.42b3.47b4.76c5.93a4.25b
98 kg AMLA/100 m2 incorporated5.45a6.72a6.27a5.11a4.38a5.18bc5.81a5.56a
98 kg AMLA/100 m2 surface applied5.21a5.79a4.73b4.70a4.15a5.34ab6.46a5.20a
98 kg alum/100 m2 incorporated4.99a5.73a5.46ab4.94a4.37a5.64a6.38a5.36a
Flock 3
Control1.30c1.14d1.55c2.52c3.27c4.52b6.67b2.99b
49 kg AMLA/100 m2 incorporated2.76b2.86c2.83b3.66b4.42b5.10b8.44a4.29a
98 kg AMLA/100 m2 incorporated3.90a3.90a3.60a4.44a5.42a6.91a8.93a5.30a
98 kg AMLA/100 m2 surface applied3.80a3.68ab3.42a4.04ab5.07a6.49a8.93a5.06a
98 kg alum/100 m2 incorporated3.83a3.50b3.34a3.93ab5.12a6.66a9.23a5.09a
† Values in columns followed by different letters indicate significant (p < 0.05) differences in means within each flock.
Table 4. Litter total N (g TN kg−1) for flock 2 and 3 by treatment by day.
TreatmentDayAvg.
071421283542
Flock 2
Control13.3c 15.4b18.4c18.2a19.6a19.2a21.3a17.9b
49 kg AMLA/100 m2 incorporated17.7ab19.4a21.3ab21.0a20.5a20.5a22.1a20.3a
98 kg AMLA/100 m2 incorporated16.4b19.4a22.2a21.3a20.7a20.9a22.5a20.5a
98 kg AMLA/100 m2 surface applied18.8a19.8a19.4bc20.0a21.9a21.0a22.5a20.5a
98 kg alum/100 m2 incorporated17.2ab21.1a21.9a22.2a22.6a22.3a23.2a21.5a
Flock 3
Control22.1a22.3a22.3b19.7b20.7d20.3b24.8a21.8c
49 kg AMLA/100 m2 incorporated22.7a22.1a24.0b21.2ab21.9bc22.4ab25.6a22.9b
98 kg AMLA/100 m2 incorporated22.8a21.7a22.7ab23.0a23.0b22.9a25.4a23.1b
98 kg AMLA/100 m2 surface applied20.8a23.4a23.7ab23.2a23.2c23.7a25.1a23.3b
98 kg alum/100 m2 incorporated21.8a25.1a25.0a23.7a24.5a24.2a26.3a24.4a
† Values in columns followed by different letters indicate significant (p < 0.05) differences in means within each flock.
Table 5. Average ammonia flux (mg NH3-N m-2 hr-1) for flock 2 and 3 by treatment by day.
TreatmentDayAvg.
071421283542
Flock 2
Control1052a 694a277a363a435a502a668a570a
49 kg AMLA/100 m2 incorporated513b623a354a299a464a484a573a473b
98 kg AMLA/100 m2 incorporated189c370b321a328a521a394a559a383c
98 kg AMLA/100 m2 surface applied220c578ab218a282a446a452a469a381c
98 kg alum/100 m2 incorporated310bc472ab246a324a521a450a516a406bc
Flock 3
Control15.7a3.68a41.9a202a286a187a200a134a
49 kg AMLA/100 m2 incorporated0.13b1.27b7.60b107b258a84.7a225a97.9ab
98 kg AMLA/100 m2 incorporated−0.64b1.71b−2.35b23.0c208a76.1a205a73.2b
98 kg AMLA/100 m2 surface applied−1.09b−0.23b−2.84b27.2c136a43.0a183a55.2b
98 kg alum/100 m2 incorporated0.22b1.30b2.67b37.5c213a164 a236a93.8ab
† Values in columns followed by different letters indicate significant (p < 0.05) differences in means within each flock.

