Abstract
Estimating and measuring the occurrence of a sensation, odor, around livestock facilities is challenging. This research compares the estimated frequency of odor nuisance with measured hydrogen sulfide (H2S) concentrations at various distances around a swine and a dairy operation, and discusses the results based on time of day, weather conditions, distance, and topography. The estimated odor annoyance-free and odor annoyance frequencies were based on a publically available calculator of odor impact derived from average odor emission rates, historical, and regional weather patterns, and dispersion modeling. Continuous monitoring of H2S was by single point monitors (SPM) at locations around the operations. Time-weighted average H2S concentrations were less than 10 ppb for odor annoyance-free frequencies, and less than 10 to at least 73 ppb for odor-annoyance frequencies. Verifying a proxy odor indicator can help update odor annoyance models and respond to site-specific concerns for existing facilities.
1. Introduction
Odor emissions from livestock and poultry farms can create annoyances among neighbors, while producers or farmers consider odors as an unavoidable consequence of their livelihood [1,2,3,4,5,6]. For established facilities, odor nuisance and complaints cause community tension and in some situations, lead to legal proceedings. The potential for odor nuisance is often an argument against livestock development or the expansion for existing facilities. Historical odor emission and downwind impact estimates have proven useful in discussions for current and potential livestock facilities. However, updates to odor emission rates and impact estimates have not kept pace with changes in the size and types of livestock production systems in the US.
The South Dakota Odor Footprint Tool (SDOFT) [7] is one of many publically available calculation tools that estimate odor annoyance from livestock housing and manure storage. Other examples are the Odor from Feedlots Setback Estimation Tool (OFFSET) [8], Nebraska Odor Footprint Tool (NOFT) [9] and Purdue Setback Model (PSM) [10]. The SDOFT combines odor emission rates for a variety of livestock species and common housing and manure storage types, odor mitigation technologies (if applicable), historical weather patterns for regions of South Dakota, and AERMOD dispersion modeling system (US Environmental Protection Agency, Durham, NC, USA) estimates to predict odor annoyance-free frequencies as a function of distance around an odor source. The SDOFT is promoted as a “starting point for discussion” about odor impact around proposed livestock facilities. However, within SDOFT and other examples, there is opportunity to evaluate and update (where necessary) odor emission rates to better reflect current housing, manure storage, management practices, and mitigation technologies. Furthermore, validation of downwind impacts serves to increase trust and continuously improve these estimation tools.
Triangular, forced-choice olfactometry is a standard lab-based method for quantifying odor concentration using a panel of human noses. The human nose is most sensitive to the combination of often low-level compounds that contribute to livestock odor sensations compared to electronic sensors [11,12,13]. However, olfactometry has potential to give biased and highly variable results as it involves the evaluation by one or more persons [12,14], and requires air samples be brought from the point of measurement to a lab—thus, odor is assessed through periodic versus continuous sampling [15]. In situ odor concentration measurements are possible with or without equipment, but the measurements still are considered periodic, and subject to the variability between human noses.
Establishing a reliable indicator gas to quantify and characterize odor around livestock farms is a popular solution to resolve the complexity of odor measurements [16,17,18,19,20,21,22,23,24,25,26]. Among 113 identified odorous compounds, Filipy et al. [25] found volatile organic compounds were highest in concentration near the feedlot and lagoon. Barth et al. [17] identified hydrogen sulfide (H2S) as the second best among three odorants (volatile organic acids, H2S and ammonia) near stored manure. Guo et al. [26] indicated H2S as a good odor indicator for some animal facilities with a coefficient of determination of 0.569 for air samples collected from various sources on 80 different farms including swine, cattle and poultry facilities. Akdeniz et al. [16] measured a significant correlation between H2S concentration and odor from two free stall dairy (coefficient of determination = 0.30 and 0.21 respectively), a swine finishing site (coefficient of determination = 0.61), and at a farrowing site with a 0.10 coefficient of determination. Some researchers found little or no correlation between odor and H2S concentration [27,28]. These previous studies focused on relating source odor and gas concentrations, which are typically higher in concentration than those experienced at downwind receptor points.
Hydrogen sulfide is the indicator gas typically chosen for regulatory purposes. Some U.S. states including Minnesota, Nebraska, Missouri, California, and Iowa have established standards for H2S emissions for property lines. The standards typically consider both concentration and duration. For example, Minnesota’s standard is a 30-min average of 30 ppb found twice in five days, or a 30-min average of 50 ppb twice per year [29]. South Dakota does not have a property-line standard.
This paper presents an exploratory project to relate hydrogen sulfide concentrations to simulated odor nuisance around livestock facilities. The frequencies of hydrogen sulfide concentration data collected around a dairy farm and swine farm in South Dakota are compared to odor annoyance frequencies estimated by SDOFT. The paper also provides recommendations for future efforts to improve odor emission rate and/or downwind impact estimation methods.
2. Experiments
This research uses two datasets presented as case studies, namely, the dairy case study and the swine case study. The dairy case study data were novel data collected for the purpose of this research. The swine case study dataset is derived from Hofer [30]. The swine farm data were collected during a project to evaluate the effect of vegetative buffers; the data used in this study was collected prior to installation of the vegetative buffers.
2.1. Farms
Table 1 provides general descriptive data for the case study farms, located in Eastern South Dakota, USA.

Table 1.
General description of the sites.
At the dairy (Figure 1), manure was pumped from the barns to a small out-building (pumphouse) with a holding pit before transferring to the manure storage, and the manure transfer coincided with a three-times per day milking schedule. The out-building was 102 m from the manure storage, but not included as an explicit odor source in Table 1. The two-stage earthen manure storage was emptied and land applied shortly after (but not during) the monitoring period for the dairy case study. Table 1 shows the total area for the two-stage storage.
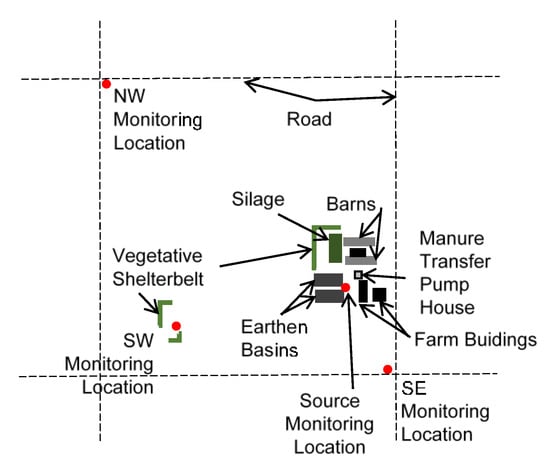
Figure 1.
Layout and monitoring locations around a dairy facility for the dairy case study (not to scale).
The swine barns for the swine case study (Figure 2) had deep pit manure storage under the floor of the barns. There were no significant animal or manure management activities noted by Hofer [30] during the monitoring period for the swine case study.
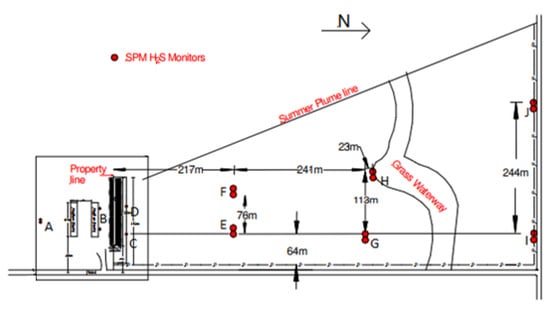
Figure 2.
Monitoring locations around a swine facility for the swine case study (adapted from Hofer, 2009). Point B is next to the barn. The shelterbelts were planted on the property line between monitoring location B and D, but the data used in case study 2 were collected before the trees were planted.
2.2. Monitoring Approach
For both case studies, single point monitors (SPMs; Zellweger Analytics, Inc., Lincolnshire, IL, USA), using chemcassette tapes with a dry reagent medium, detected and reported H2S concentrations based on a rate of color change of the tape. This change of color was proportional to the concentration of the exposure of the target gas. The chemcassette tapes were designed to measure H2S concentration between 1 and 90 ppb. Each SPM output a 4–20 mA signal to an Eltek 1000 series data loggers (Eltek Ltd., Haslingfield, Cambridge, UK), which recorded the SPM signal every 17 min. During data analysis, the mA signal was converted to ppb.
Continuous sampling of H2S occurred at four locations near the Dairy (Figure 1): (1) near the manure storage (we considered the manure storage the primary odor/H2S Source); (2) in a clearing of a neighbor’s yard southwest (SW) of the farm (827 m from the manure storage); (3) the southeast (SE) corner of the section (542 m from the manure storage); (4) and the northwest (NW) corner of the section (1666 m from the manure storage). Data collection was over 25 days in August and September 2016.
For the swine farm, there were ten monitoring points in the north and northwest directions relative to the barns (Figure 2). Hofer [30] designed this monitoring scheme based on regional prevailing summer winds from the south and southeast, and the resulting summer plume area downwind of the barn. At each of the monitoring locations, there were two monitors at 1 m (low) and 5.5 m (high) heights. Monitoring point B was considered indicative of the source concentration. Point A was considered an upwind measurement. Data were collected in the month of July 2007. However, data processing by Hofer [30] for the original project limited the data available for the present study to periods with south to southeast winds only. The monitoring data, therefore, represented 29% of the total monitored period.
For the dairy, weather data were obtained from a local weather station from the South Dakota Climate Office. For the Swine site, an on-site weather tower and data logging system (Campbell Scientific Inc., Logan, UT, USA) recorded wind direction, wind speed, humidity and solar radiation every eight minutes.
2.3. Odor Annoyance Frequency
The SDOFT calculation of odor annoyance-free frequencies is a two-step process. First, the odor emission factor for a site is based on user-specified housing and manure storage sources, source area(s), and odor emission numbers for various source types. Second, the calculator references curves relating odor emission factors and distance for odor annoyance-free frequencies from 91% to 99%. The curves are not visible to the user on the excel-based calculation tool (Supplementary Material S1). Odor intensity less than 2 on a scale of 0–5 is considered not annoying. With respect to time, the annoyance frequency in percent is 100 minus the annoyance-free frequency. Therefore, 91% odor annoyance-free frequency corresponds to 66 h per month when odor would be considered annoying.
Jacobson et al. [31] describe the concept and development of odor annoyance-free frequency curves. In short, the frequency is a reflection of the weather conditions that favor odor transport (i.e. 6% of the time). Dispersion modeling estimates downwind odor detection threshold concentrations, and Jacobson et al. [31] also developed and tested a relationship between odor detection threshold concentrations to odor intensity (or annoyance). For the weather conditions of interest, dispersion model setback distances to odor intensities less than 2 for varying odor emission numbers formed a curve. Odor annoyance-free frequency curve development for SDOFT (and NOFT) mirrored that of OFFSET [31,32,33], with two exceptions. First, SDOFT and NOFT used the dispersion model AERMOD in place of INPUFF 2. Thus the odor emission numbers, while derived from the same literature as OFFSET [34], use different scaling factors to compensate for the different dispersion models. Second, historical weather data for South Dakota regions between April and October were used in dispersion modeling, whereas OFFSET and NOFT use data from Minnesota and Nebraska, respectively. Thus, SDOFT is specifically designed for application in South Dakota, but uses a premise and method used elsewhere.
The SDOFT calculator outputs for the dairy and swine case studies are shown as Supplementary Materials S2 and S3. Using Table 1 data, the SDOFT-specific, unit-less, total odor emitting factors for the dairy and swine case studies were 3,884 and 257, respectively. The SDOFT estimates are based on historical weather conditions for South Dakota regions between April and October, which coincides with the monitoring periods for both case studies. However, SDOFT assumes flat terrain around a farm. There were buildings between the source and SE monitoring point on the Dairy.
2.4. Analysis and Comparison Methods
Wind and H2S concentration conditions are discussed relative to hour of day and atmospheric stability conditions. The stability conditions were grouped Pasquil–Gifford (PG) stability classes [35]. Unstable refers to PG classes A and B, neutral refers to PG classes C and D, and stable refers to PG classes E and F. The stability classes were estimated with the turbulence-based σA method [36] which uses the standard deviation of the wind direction in combination with the scalar mean wind speed.
The continuous H2S data for each monitoring site were grouped in 10 ppb concentration ranges for simplicity. Because the range of the SPM was 90 ppb H2S, concentrations of 90 ppb and above are considered a separate range. The proportion of H2S measurements at each monitored location that fell within a 10 ppb concentration range was considered indicative of the percent time, or frequency of that concentration range during the monitoring period. Assuming that low concentration H2S ranges are “annoyance-free”, the cumulative frequency of low to high H2S ranges for the monitored period are compared to the odor annoyance-free frequencies estimated by SDOFT, and vice versa for the odor annoyance frequencies with high to low ranges. Using the midpoint concentration of each range, time (or frequency)-weighted average concentrations were calculated. In the case where concentrations were 90 ppb or above, the weighted average is likely a low estimate of the actual weighted average concentration.
3. Results
3.1. Dairy Case Study
3.1.1. Weather Conditions
The average daily temperature varied between 14 and 28 °C during the monitoring period, which corresponds to the normal daily temperature range (9–28 °C) for the local weather station. Total precipitation during the monitoring period was 177 mm, greater than the normal monthly precipitation of 70–77 mm for August and September in this region [37].
The stability conditions neutral and stable accounted for at least 73% of the study period. Unstable conditions were approximately 50% of the daylight hour measurements (Figure 3a). Approximately 35% of the winds were from the S–SE direction during the monitoring period (Figure 3b), blowing towards the NW monitoring location.
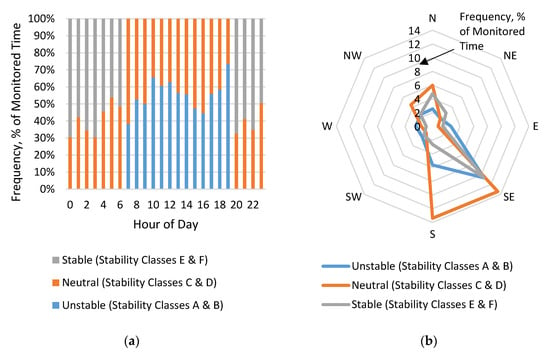
Figure 3.
Frequency (% of measurement period) of wind measurements for the dairy case study, classified by: (a) hour of day and Pasquill–Gifford stability classes; and (b) wind direction and stability class.
3.1.2. Hydrogen Sulfide Concentrations
Figure 4 shows the range and distribution of H2S concentrations at the source and three receptor points based on time of day. Near the manure storage (Source), 86% of the measurements were below 20 ppb. However, concentration levels greater than 20 ppb occurred more frequently between 5 h and 15 h compared to the receptor sites. This time period coincides with higher daytime temperatures and on-farm manure transfer activities.
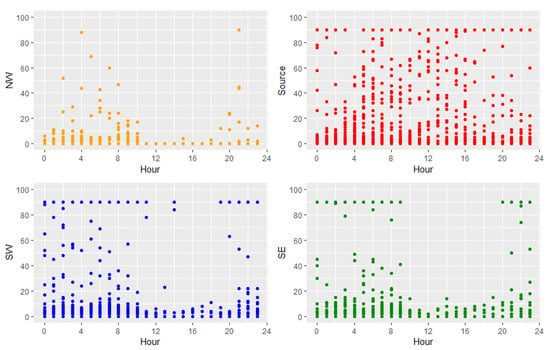
Figure 4.
Hydrogen sulfide concentration measurements (ppb) based on time of day during the monitoring period for the dairy case study at monitoring points NW of the dairy (upper left); near the manure storage of the dairy (upper right); SW of the dairy (lower left); and SE of the dairy (lower right).
More than 90% of the H2S concentration measurements at the three receptors were less than 20 ppb. The H2S concentrations tended to exceed 20 ppb overnight between 20:00 and 08:00. Neutral and stable wind conditions during this time (Figure 3) reduce mixing and dilution of gases, enabling plumes to travel further downwind. There were occasions at the SW location of H2S greater than 20 ppb between 08:00 and 20:00. The SW location was further from the source than the SE location; however, there were fewer topographical obstructions. Distance and topography between the source and receptors can partially explain the differences in concentration measurements for each receptor.
Figure 5 shows the cumulative frequencies of H2S concentration measurements in 10 ppb ranges (greater than or equal to 10 ppb) with respect to the corresponding wind direction. There were limited wind direction conditions contributing to high concentration occurrences at the NW (Figure 5a) and SE (Figure 5d) receptor sites. For the SE receptor site, the buildings between the source and receptor may have contributed to the stronger effect by north winds. The SW receptor measurements corresponded with winds from the north through southeast direction (Figure 5c). Again, distance, topography, and microclimate differences between the source and receptors may help explain he occurrence of higher concentrations where wind direction cannot.
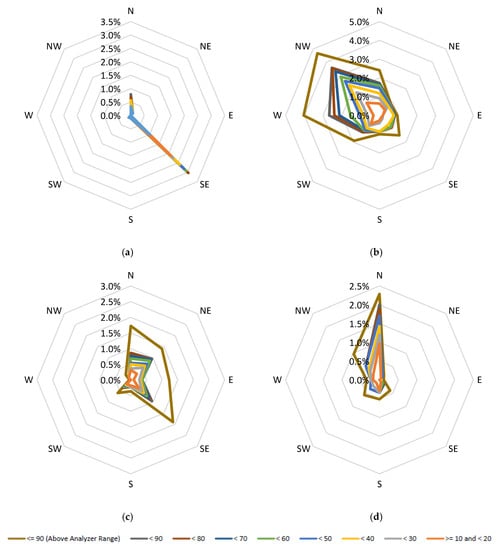
Figure 5.
Cumulative frequency (% of monitored time) that hydrogen sulfide concentration measurements (ppb) were greater than or equal to 10 ppb and less than the upper ranges specified in the legend, at the monitoring locations for the dairy case study: (a) NW of the dairy; (b) near the manure storage of the dairy; (c) SW of the dairy; and (d) SE of the dairy. Note: Hydrogen sulfide concentrations less than 10 ppb are excluded from this figure to highlight the patterns for higher concentration measurements, more likely to trigger odor annoyance.
3.1.3. Comparison to Odor Annoyance Frequencies
Table 2 summarizes simulated odor annoyance frequencies for the receptors estimated using SDOFT.

Table 2.
Odor annoyance estimated by SDOFT for the dairy case study based on distance from the source.
Figure 6 is the summary of frequencies for all measurements, regardless of wind direction shown in Figure 5. The SDOFT estimated odor annoyance 6–9% of the time at the SW receptor site based on the odor sources at the dairy (Table 1). Using cumulative frequencies, the onset of odor annoyance coincides with measurements between 0 and 20 ppb. The weighted average concentrations for the 6–9% of time with “annoying odor” were at least 73 and 45 ppb, respectively. For the SE receptor site, the estimated onset of odor annoyance coincides with H2S concentrations less than 10 ppb, and weighted average concentrations for the highest 6–9% of time were 43 and 30 ppb, respectively. For the NW receptor site, located further from the dairy, the onset of annoyance frequency aligns with the proportion of measurements in the 10–20 ppb range, and 37 and 31 ppb are weighted averages for the highest 3% and 4% frequencies, respectively. The average concentrations corresponding to the annoyance-free frequencies are less than 10 ppb for the NW, SE and SW locations.
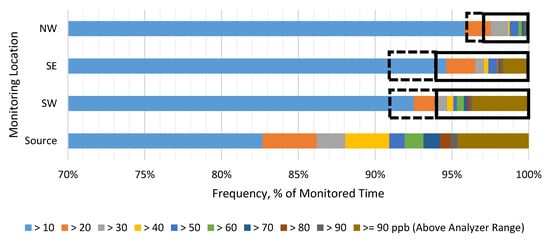
Figure 6.
Cumulative frequency of hydrogen sulfide concentration measurement ranges from low to high (in 10 ppb increments) at the monitoring locations for the dairy case study. The dashed black boxes indicate the range of time when the South Dakota Odor Footprint Tool estimates the onset of odor annoyance for the distance away from the source (dairy farm), and the black boxes indicates the remainder of the range of time of odor annoyance from onset.
3.2. Swine Case Study
3.2.1. Weather Conditions
The average daily temperature during the monitoring period varied between 15 and 29 °C, similar to the normal daily high (28 °C) and low (15 °C) of the nearest weather station [37]. Precipitation was lower than the normal precipitation during this time of the year. The normal monthly precipitation during September is 83 mm, but during the case study period it was only 3.5 mm [37].
For the swine case study, Hofer [30] only reported data when wind was blowing from S to SE direction, which accounted for 29% of the monitoring period. The majority of the S–SE winds were neutral (Figure 7). Approximately 10% of the nighttime winds were stable and 11% of the daytime winds were unstable.
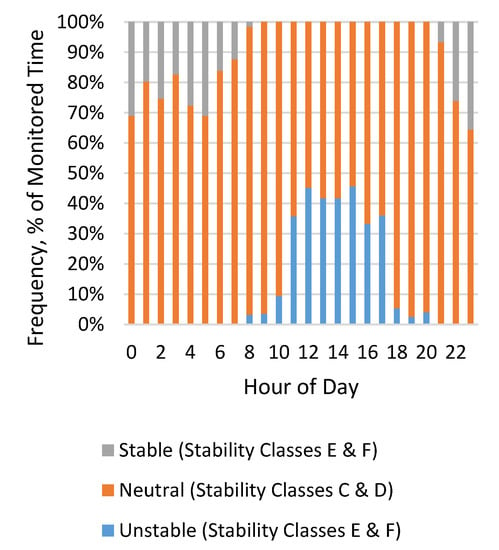
Figure 7.
Frequency (% of monitoring period when the wind was in the direction of the downwind sensors—28.5% of the total monitored period) of wind measurements at the swine site, classified by hour of day and Pasquill–Gifford stability classes.
3.2.2. Hydrogen Sulfide Concentrations
The occurrence of higher H2S concentrations near the source (B) was more frequent between 08:00 and 20:00 (Figure 8), similar to the dairy case study (Figure 4). At the upwind location (A), the highest reported H2S concentration was 3.5 ppb. Generally, the frequency and magnitude of H2S concentration measurements decreased with increasing distance away from the source, and occurred during nighttime hours. Location I deviated from this general pattern compared to F, G, and H. Although the manure management activity is less at nighttime, the calm and stable condition from midnight till early morning helped H2S spread towards the receptors from the source.
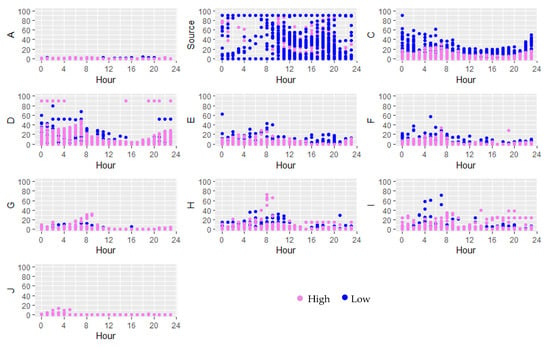
Figure 8.
Hydrogen sulfide concentration (ppb) measurements based on time of day during the monitoring period (when the wind was in the direction of the downwind sensors—29% of the total monitored period) for the swine case study at monitoring locations A (upwind of barns), Source (B), and C–J (increasing downwind distance from barns). High and low points are indicative of the concentration data collected by the monitors at 5.5 m and 1 m heights, respectively.
3.2.3. Comparison to Odor Annoyance Frequencies
According to SDOFT estimates, odor annoyance frequencies greater than 9% were likely for monitoring points A, C, D, E, and F (Table 3). The SDOFT-estimated frequencies decreased with increasing distance from the site.

Table 3.
Odor annoyance calculated by SDOFT for case study 2.
The onset of odor annoyance for monitoring locations F and further from the source coincide with concentrations less than 10 ppb (Figure 9). The odor annoyance free frequencies correspond to average concentrations less than 10 ppb for all locations G and further from the source. The weighted average concentrations for the “annoying” frequencies were also less than 10 ppb with the exception of monitoring locations IL and JH. At IL, the 3–4% “annoying” average concentrations are 17 and 14 ppb, respectively. At JH, the average concentrations for the highest 2–3% of measurements were 13 and 10 ppb, respectively. The exclusion of data when wind was not in the direction of the sensors may distort the data and reduce the frequency of higher concentrations; the SW monitoring location for the dairy case study (Figure 5) suggests dispersion may not always follow wind direction during neutral and stable wind conditions. It is also possible the odor and/or H2S emission from the swine farm were lower than average emission rates used in SDOFT estimates.
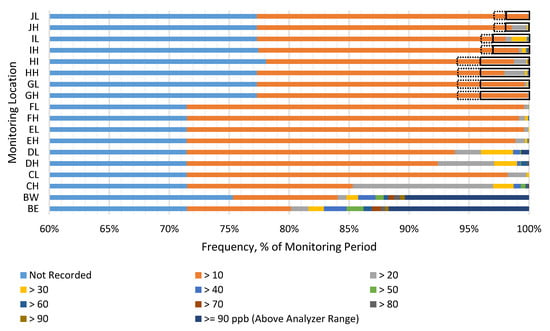
Figure 9.
Cumulative frequency of hydrogen sulfide concentration measurement ranges from low to high (in 10 ppb increments) at the monitoring locations for the swine case study, or unknown (Not Recorded because wind was not blowing in the direction of the sensors). The dashed black boxes indicate the range of time when the South Dakota Odor Footprint tool estimates the onset of odor annoyance for the distance away from the source (swine farm), and the black boxes indicate the remainder of the range of time of odor annoyance from onset.
4. Discussion
Simultaneous and continuous hydrogen sulfide concentration monitoring at the source and downwind locations demonstrated the influence of time of day and wind stability. While concentrations tended to be higher during the day near the source for both case studies, peak concentrations tended to occur during nighttime hours for the receptor points. Near the source, concentrations are not directly indicative of emissions, though gas and odor production are generally greater during warmer daytime temperature conditions and with animal activity. Greater mixing with unstable wind conditions would lessen downwind impacts.
Many gas and odor studies relating source emissions and/or concentration and downwind concentrations relied on periodic daytime measurements [22,38,39,40]. Based on the dairy and swine case studies, periodic daytime sampling is more likely to capture maximum gas and odor emission rates but does not capture the peak downwind concentrations—more likely to cause annoyance. Unfortunately, olfactometry methods for odor analysis are not conducive to continuous or long-term sampling. Collected samples can be modified during the storage period. Additionally, there is a risk of diffusion of collected samples through the bag [41]. The SW receptor for the dairy case study suggest higher H2S concentrations are not solely limited to those periods with a direct wind from the source to the receptor (Figure 4 lower left).
Odor annoyance estimates consider both an odor intensity and frequency of occurrence for a location. In the dairy case study, the estimated odor annoyance onset occurred in 0–20 ppb H2S ranges for receptors with no obstructions between the source and receptor (NW and SW), but the 0–10 ppb range for the receptor site with a lot of obstructions (SE). For the swine case study, the onset of odor annoyance was between 0 and 10 ppb. The odor annoyance-free frequency periods corresponded to average H2S concentrations less than 10 ppb for both case studies. The average H2S concentrations for odor annoyance frequency periods ranged from 31 to 73 ppb for the dairy case study, and less than 10–17 ppb for the swine case study.
There are many assumptions in this comparison. First are the assumptions associated with SDOFT. This comparison assumes the average odor emission rates built into SDOFT (Table 1) reflect the true emissions for the sources. The short-term weather patterns for the monitoring periods at the case studies also influence the comparison, though the temperature and wind direction patterns were consistent with historical conditions. The SDOFT also assumes flat terrain between source and receptor, which was not the case for all receptor points. The second assumption was that H2S is an appropriate proxy gas. While some studies show a strong correlation between odor and H2S, this relationship is not consistent. The time of day sampling occurred may be part of this discrepancy, as well as correlating source versus downwind concentrations. As an individual gas, H2S has a very low odor detection threshold, 0.41 ppb [42]. In the range of 0–100 ppb, an odor or sensation of this gas is detectable, though the nose may desensitize. Finally, SDOFT and this research relates odor annoyance to odor intensity, but individual persons may experience discomfort at varying levels of odor and gas.
This research highlights future directions for monitoring downwind odor/gas concentration impacts.
- Continuous H2S (or other appropriate gas) sampling can help establish dispersion conditions and patterns for specific sources and receptors. Time-consuming and costly odor sampling points and times then can be judiciously chosen.
- Additional case studies may strengthen the relationship for the onset of estimated odor annoyance with hydrogen sulfide concentration ranges.
5. Conclusions
An indicator gas for odor intensity and frequency can support odor monitoring needs for current and potential livestock farms. Continuous hydrogen sulfide concentration data collected for dairy and swine case study farms near the source and receptor sites showed:
- The H2S concentrations near the source were higher during the day, whereas H2S concentrations near downwind receptors were higher during stable and neutral nighttime conditions.
- The H2S concentrations were generally related to proximity to the source and a lack of topographical obstructions.
The SDOFT-estimates for odor annoyance frequency were compared with H2S concentration frequencies, and the onset of odor annoyance coincided with concentration bins of 0–10 ppb or 10–20 ppb. Time-weighted average H2S concentrations were less than 10 ppb for odor annoyance-free frequencies, and less than 10 to at least 73 ppb for odor-annoyance frequencies. Additional refinement of the bins or onset concentration are possible with more data.
Supplementary Materials
The following are available online at https://www.mdpi.com/2073-4433/11/3/249/s1, Spreadsheet S1. South Dakota Odor Footprint Tool with example data entries, Figure S2. South Dakota Odor Footprint tool report for the dairy case study, Figure S3. South Dakota Odor Footprint tool report for the swine case study.
Author Contributions
Conceptualization, E.L.C.; methodology, E.L.C.; investigation, S.A.; analysis, S.A.; writing—original draft preparation, S.A.; writing—review and editing, E.L.C. All authors have read and agreed to the published version of the manuscript.
Funding
The dairy farm financially supported the purchase of disposable monitoring supplies (i.e., chemcassettes) and travel to the dairy case study research site. Otherwise, this research received no external funding and used existing data sources.
Acknowledgments
South Dakota State University contributed to this research through general faculty and graduate research assistance support. B. Siverling and M. Mehata assisted with data collection. The cooperating farms and neighbors that allowed on-farm measurements are appreciated.
Conflicts of Interest
The authors declare no conflict of interest. The participating farms and neighbors had no role in the design of the study; in the collection, analyses, or interpretation of data; in the writing of the manuscript; or in the decision to publish the results.
References
- Schauberger, G.; Piringer, M.; Petz, E. Separation distance to avoid odour nuisance due to livestock calculated by the Austrian odour dispersion model (AODM). Agric. Ecosyst. Environ. 2001, 87, 13–28. [Google Scholar] [CrossRef]
- Von Essen, S.G.; Auvermann, B.W. Health effects from breathing air near CAFOs for feeder cattle or hogs. J. Agromedicine 2005, 10, 55–64. [Google Scholar] [CrossRef] [PubMed]
- Starmer, E. Environmental and Health Problems in Livestcok Production. Available online: http://www.ase.tufts.edu/gdae/Pubs/rp/AAI_Issue_Brief_2_1.pdf (accessed on 12 October 2019).
- Pennsylvania State University. Odor Management in Agriculture and Food Processing; Pennsylvania State University: State College, PA, USA, 2002. [Google Scholar]
- Anderson-Bereznicki, S.D. Development of a Multiple-Source Odor Setback Model for Livestock Production Systems; Purdue University: West Lafayette, IN, USA, 2009. [Google Scholar]
- Watts, P.; Sweeten, J. Toward a better regulatory model for odour. In Proceedings of the Feedlot Waste Management Conference, Queensland, Australia, 12 June 2005. [Google Scholar]
- South Dakota State University. South Dakota Odor Footprint Tool. Available online: https://www.sdstate.edu/agricultural-and-biosystems-engineering/south-dakota-odor-footprint-tool (accessed on 12 October 2019).
- Jacobson, L.; Schmidt, D.R. Odor from Feedlots Setback Estimation Tool—OFFSET. Available online: http://www.milkproduction.com/Library/Scientific-articles/Housing/OFFSET-Odor-From-Feedlots-Setback-Estimation-Tool/ (accessed on 12 October 2019).
- University of Nebraska-Lincoln. Odor Footprint Tool. Available online: https://water.unl.edu/manure/odor-footprint-tool (accessed on 2 December 2019).
- Purdue University. Livestock Odor Setback Model—Purdue University. Available online: https://engineering.purdue.edu/~odor/setback.htm (accessed on 2 December 2019).
- Brewer, M.S.; Cadwallader, K.R. Overview of Odor Measurement Techniques; University of Illinois, Department of Food Science & Human Nutrition: Urbana, IL, USA, 2004; p. 61801. [Google Scholar]
- Nicolai, R.E.; Pohl, S.H. Understanding Livestock Odors. Available online: https://www.sdstate.edu/sites/default/files/abe/research/structures/upload/FS925-A.pdf (accessed on 10 May 2017).
- Parker, D.B. Reduction of Odor and Voc Emissions from a Dairy Lagoon. Appl. Eng. Agric. 2008, 24, 647–655. [Google Scholar] [CrossRef]
- Guo, H.; Jacobson, L.; Schmidt, D.; Nicolai, R. Evaluation of the influence of atmospheric conditions on odor dispersion from animal production sites. Trans. ASAE 2003, 46, 461. [Google Scholar]
- Maurer, D.L.; Bragdon, A.M.; Short, B.C.; Ahn, H.; Koziel, J.A. Improving environmental odor measurements: Comparison of lab-based standard method and portable odor measurement technology. Arch. Environ. Prot. 2018, 44, 100–107. [Google Scholar] [CrossRef]
- Akdeniz, N.; Jacobson, L.D.; Hetchler, B.P.; Bereznicki, S.D.; Heber, A.J.; Koziel, J.A.; Cai, L.; Zhang, S.; Parker, D.B. Odor and odorous chemical emissions from animal buildings: Part 4. Correlations between sensory and chemical measurements. Trans. ASABE 2012, 55, 2347–2356. [Google Scholar] [CrossRef]
- Barth, C.; Hill, D.; Polkowski, L. Correlating odor intensity index and odorous components in stored dairy manure. Trans. ASAE 1974, 17, 742–0744. [Google Scholar] [CrossRef]
- Lu, P.; Su, Z.; Wang, G.; Dai, Z.; Zhang, Z.; Yu, C.; Liu, J.; Wang, Z.; Qin, L.; Nie, Z. VOCs analyzing and odor indicator selecting in ambient air of landfill area. Huan Jing Ke Xue Huanjing Kexue 2011, 32, 936–942. [Google Scholar]
- Lunn, F.; Van De Vyver, J. Sampling and analysis of air in pig houses. Agric. Environ. 1977, 3, 159–169. [Google Scholar] [CrossRef]
- Ostojic, N.; O’Brien, M.; Schmidt, C.E. Relationship between odor and hydrogen sulfide emissions at a water pollution control plant in New York city. In Proceedings of the Water Environment Federation, Alexandria, VA, USA, 14–18 October 2000; pp. 8–21. [Google Scholar]
- Qamaruz-Zaman, N.; Milke, M. VFA and ammonia from residential food waste as indicators of odor potential. Waste Manag. 2012, 32, 2426–2430. [Google Scholar] [CrossRef]
- Riskowski, G.; Chang, A.; Steinberg, M.; Day, D. Methods for evaluating odor from swine manure. Appl. Eng. Agric. 1991, 7, 248–253. [Google Scholar] [CrossRef]
- Zhu, J.; Jacobson, L.D. Correlating microbes to major odorous compounds in swine manure. J. Environ. Qual. 1999, 28, 737–744. [Google Scholar] [CrossRef]
- Zhu, J.; Riskowski, G.; Torremorell, M. Volatile fatty acids as odor indicators in swine manure—A critical review. Trans. ASAE 1999, 42, 175. [Google Scholar] [CrossRef]
- Filipy, J.; Rumburg, B.; Mount, G.; Westberg, H.; Lamb, B. Identification and quantification of volatile organic compounds from a dairy. Atmos. Environ. 2006, 40, 1480–1494. [Google Scholar] [CrossRef]
- Guo, H.; Jacobson, L.D.; Schmidt, D.R.; Nicolai, R.E. Correlation of odor dilution threshold and H2S and NH3 concentrations for animal feedlots. In Proceedings of the 2000 ASAE Annual International Meeting, Milwaukee, WI, USA, 7 September–7 December 2000; pp. 4085–4095. [Google Scholar]
- Hobbs, P.; Misselbrook, T.; Pain, B. Assessment of odours from livestock wastes by a photoionization detector, an electronic nose, olfactometry and gas chromatography-mass spectrometry. J. Agric. Eng. Res. 1995, 60, 137–144. [Google Scholar] [CrossRef]
- Williams, A. Indicators of piggery slurry odour offensiveness. Agric. Wastes 1984, 10, 15–36. [Google Scholar] [CrossRef]
- Minnesota Office of the Revisor of Statutes. 7009.0080 Minnesota Ambient Air Quality Standards. Available online: https://www.revisor.mn.gov/rules/7009.0080/ (accessed on 30 December 2019).
- Hofer, B.J. Effect of a Shelterbelt on H2S Concentrations from Swine Barns; South Dakota State University: Brookings, SD, USA, 2009. [Google Scholar]
- Jacobson, L.D.; Guo, H.; Schmidt, D.R.; Nicolai, R.E.; Zhu, J.; Janni, K.A. Development of the OFFSET model for determination of odor-annoyance-free setback distances from animal production sites: Part I. Review and experiment. Trans. ASAE 2005, 48, 2259–2268. [Google Scholar] [CrossRef]
- Guo, H.; Jacobson, L.D.; Schmidt, D.R.; Nicolai, R.E.; Zhu, J.; Janni, K.A. Development of the OFFSET model for determination of odor-annoyance-free setback distances from animal production sites: Part II. Model devlopment and evaluations. Trans. ASAE 2005, 48, 2269–2276. [Google Scholar] [CrossRef]
- Nimmermark, S.A.; Jacobson, L.D.; Schmidt, D.R.; Gay, S.W. Predictions by the Odor From Feedlots, Setback Estimation Tool (OFFSET) compared with observations by neighborhood monitors. J. Air Waste Manag. Assoc. 2005, 55, 1306–1314. [Google Scholar] [CrossRef]
- Gay, S.W.; Schmidt, D.R.; Clanton, C.J.; Janni, K.A.; Jacobson, L.D.; Weisberg, S. Odor, total reduced sulfur, and ammonia emissions from animal housing facilities and manure storage units in Minnesota. Appl. Eng. Agric. 2003, 19, 347–360. [Google Scholar]
- Hunter, C. A Recommended Pasquill-Gifford Stability Classification Method for Safety Basis Atmospheric Dispersion Modeling at SRS; United States Department of Energy, Savannah River Site: Aiken, SC, USA, 2012. [Google Scholar]
- Bailey, D.T. Meteorological Monitoring Guidance for Regulatory Modeling Applications; DIANE Publishing: Darby, PA, USA, 2000. [Google Scholar]
- U.S. Climate Data. Climate South Dakota. Available online: https://www.usclimatedata.com/climate/brookings/south-dakota/united-states/ussd0041/2016/9 (accessed on 10 November 2019).
- Huang, D.; Guo, H. Diurnal and seasonal variations of odor and gas emissions from a naturally ventilated free-stall dairy barn on the Canadian prairies. J. Air Waste Manag. Assoc. 2017, 67, 1092–1105. [Google Scholar] [CrossRef] [PubMed]
- Kim, K.Y.; Ko, H.J.; Kim, H.T.; Kim, Y.S.; Roh, Y.M.; Lee, C.M.; Kim, C.N. Quantification of ammonia and hydrogen sulfide emitted from pig buildings in Korea. J. Environ. Manag. 2008, 88, 195–202. [Google Scholar] [CrossRef] [PubMed]
- Hayes, E.T.; Curran, T.P.; Dodd, V. Odour and ammonia emissions from intensive pig units in Ireland. Bioresour. Technol. 2006, 97, 940–948. [Google Scholar] [CrossRef] [PubMed]
- Capelli, L.; Sironi, S.; Del Rosso, R. Odor sampling: Techniques and strategies for the estimation of odor emission rates from different source types. Sensors 2013, 13, 938–955. [Google Scholar] [CrossRef] [PubMed]
- Nagata, Y.; Takeuchi, N. Measurement of Odor Threshold by Triangle Odor Bag Method. Available online: http://www.env.go.jp/en/air/odor/olfactory_mm/04ref_2.pdf (accessed on 12 February 2019).
© 2020 by the authors. Licensee MDPI, Basel, Switzerland. This article is an open access article distributed under the terms and conditions of the Creative Commons Attribution (CC BY) license (http://creativecommons.org/licenses/by/4.0/).