Article

Fog Droplet Size Distribution and the Interaction between Fog Droplets and Fine Particles during Dense Fog in Tianjin, China

1
Tianjin Weather Modification Office, Tianjin 300074, China
2
Tianjin Key laboratory of Marine Meteorology, Tianjin 300074, China
3
Key Laboratory for Cloud Physics of China Meteorological Administration, Beijing 100081, China
4
Tianjin Meteorology Bureau, Tianjin 300074, China
*
Author to whom correspondence should be addressed.
Atmosphere 2020, 11(3), 258; https://doi.org/10.3390/atmos11030258
Submission received: 6 January 2020 / Revised: 29 February 2020 / Accepted: 2 March 2020 / Published: 5 March 2020
(This article belongs to the Special Issue Observation, Simulation and Predictability of Fog )

Abstract

:
From November 2016 to January 2017, there were large-scale dense fog processes in Tianjin area on the west coast of Bohai Bay, China, even strong dense fog with visibility less than 50 m occurred. Based on the observation data of fog droplet spectrum monitor, visibility sensor, environmental particle monitoring equipment and meteorological automatic station, the characteristics of fog droplet size distribution and the interaction between the fog droplets and fine particles during dense fog events were analyzed. The results show following characteristics: (1) The average concentration of fog droplets (Na), the average liquid water content (La) and the maximum liquid water content (Lmax) in the strong dense fog process are larger than those in the dense fog. The average spectrum of fog droplet size distribution conforms to Junge distribution, and they are all broad-spectrum fog with a spectrum width of about 45 μm. The average spectrum is similar to the dense fog of heavily industrialized inland in the world. (2) The maximum of fog droplet diameter during the formation stage have a good indication for the outbreak of strong dense fog. (3) The mass concentration of PM2.5 (CPM2.5) is ranged from 121–375 μg/m3, and the interaction between fog droplets and fine particles is analyzed. During the formation, development and maturity stages, fog process can scavenge atmospheric fine particles, and the scavenging efficiency of PM2.5 is more remarkable than PM10. When CPM2.5 does not exceed 350 μg/m3, the increase in the concentration of fine particles is conducive to the rapid growth of fog droplets and the sharp drop of visibility. However, when CPM2.5 exceeds the critical value, the increase has a negative feedback effect on the development of the fog process. More investigations and cases are necessary to fully assess the mechanisms related to the dense fog events in Tianjin area and further analysis will be done.

1. Introduction

The evolution from fog to dense fog is very rapid and difficult to predict, the sudden low visibility phenomenon is very easy to lead to sudden safety accidents [1]. Fog droplet microphysical parameters, such as number concentration (N), liquid water content (L), diameter (D), fog droplet size distribution and atmospheric fine particle concentration directly affect visibility (Vis) in fog [2] and determine the formation and dissipation of fog. Clarifying the distribution characteristics and the rules of microphysical parameter changes at various stages of the fog life cycle can help improve forecasts of dense fog and strong dense fog [3], and provide a theoretical basis for fog modification [4].
In the past 30 years, more and more attention had been paid to the study of the microphysical characteristics of dense fog, and continuous progress had been made in the development and application of observation instruments of fog microphysical parameters. From the early “optical-electrical particle counter” and “three-purpose droplet spectrometer” to the widely used “FM-100” and “FM-120” fog monitor [5,6], the understanding of the microphysical characteristics of fog had been deepened. The formation of dense fog was accompanied by the broadening of the fog droplet size distribution in Alaska, USA [7]. British scholars analyzed the droplet size changes in the process of dense fog in Cardington, Bedfordshire, and found that the average droplet diameter in the early stage of fog outbreak was about 15–20 μm, so the starting signal of dense fog explosion may be clarified from the perspective of microphysics [8]. To some extent, numerical model skill also depends on the adjustment of microphysical parameters scheme. Moroccan scholars improved the skill of coastal fogs by adjusting the microphysics scheme of Casablanca area based on the droplet size distribution analysis [9,10]. If models could predict the N and L at each time step using a detailed microphysics parameterization, visibility could be calculated for warm fog conditions [11]. Early studies on the microphysical parameters of dense fog showed obvious regional differences in China. The N decreased while the L increased in order in urban areas (such as Nanjing and Chongqing), mountainous areas (such as Nanling and Lushan) and coastal areas (such as Zhoushan and Bohe). Many studies proved the D and the L are the main factors leading to low visibility in fog [12]. The N had a negative correlation with Vis. However the L of droplets had a positive correlation with the average diameter (Da) [13].
In addition, atmospheric fine particles have a complex interaction with the growth of dense fog droplets in recent studies. The increase in the concentration of hygroscopic atmospheric particles can promote the formation of fog droplets even in unsaturated conditions, and the thickness of the fog layer will also increase with the increase of the concentration of atmospheric particles [14]. The intensity of fog will decrease with the decrease of aerosol concentration [15]. The hygroscopicity of atmospheric particles has a high dependence on particle size distribution and chemical composition, which changes with different conditions of relative humidity. So the growth process of fog droplets could be changed by the atmospheric hygroscopic aerosol [16]. For inland cities, the fine particles number concentration ranged from 5000 to 15,000 cm−3 during Paris fog event, and the number concentration exerted a higher influence on the fog microphysical characteristics than chemistry (solubility) did [17,18]. A large amount of aerosol particles could act as condensation nuclei to enhance the formation of fog droplets in North China Plain [19]. For coastal cities, most aerosols (include PM2.5) were effectively scavenged by fog water, while sulfur species could not be easily and effectively scavenged near the industrialized coastal area in Japan [20,21]. Deposition of fog droplets was the most important process for the evolution of the size distribution of aerosols in San Joaquin Valley fog in California [22].
In view of the frequent dense fog weather in North China in recent years [23,24,25], which has seriously affected aviation takeoff and landing. In order to improve the ability of fog modification, Tianjin Weather Modification Office introduced fog monitor equipment and environmental particle monitoring equipment to carry out microphysical observation experiments in the winter dense fog process in Tianjin, China, for the first time. It is hoped that this experiment can clarify the characteristics of fog droplet generation and the interaction between fine particles and droplet growth during the dense fog in Tianjin in winter, and provide a basis for future fog modification.

2. Measurement and Data Processing

The observation site is located at the Tianjin atmospheric boundary layer observation station [26] (39°04′ N, 117°12′ E) from November 2016–January 2017, which is located in the central part of the North China Plain, with the Taihang Mountains to the west, the Yanshan Mountains to the north, and the Bohai Sea to the east, at a distance of 50 km from its west coast. The geographical location of the observation station, designated Tianjin (TJ), is shown in Figure 1. The characteristics of the fog droplet size spectrum from this observation station were compared with those from the observation stations in other areas of China, also shown in Figure 1. Specifically, these stations comprised: NJBJ (32°12′ N, 118°42′ E) in the northern suburbs of Nanjing [27,28]; GDZJ (21°1′ N, 110°32′ E) in Zhanjiang, Guangdong Province [29,30,31]; BJ (39°29′ N, 115°58′ E) in Beijing [32].
The data of fog droplet size distribution were obtained from an FM-120 fog monitor. The droplet diameter (D), liquid water content (L), number concentration (N) data were obtained with the trimmed-mean method [33]. This method follows this equation:
X k ¯ = X ( [ n k ¯ ] + 1 ) + X ( [ n k ¯ ] + 2 ) + + X ( n [ n k ¯ ] ) n 2   [ nk ]
where n is the number of observations, k is a coefficient determined by people from 0 to 0.5 (0 ≤ k < 0.5), [   ] means to get integer, X represents sequential microphysical statistics. Because the amount of data is very large (time resolution is 1s) and the scientific value of the data must be guaranteed, we set k as 0.25 in this research. The visibility data were obtained from the MODEL 6000 forward scattering visibility meter, using minute-scale measurement data. The mass concentration of PM2.5/PM10 (CPM2.5/CPM10) were obtained from a TEOM (RP1405D) device, using hourly average mass concentration data. The wind speed data captured with the DZZ5 automatic weather station. The instrument specifications are listed in Table 1.
During the intensive measurement period, Tianjin experienced several fog events. Jointed to the weather phenomena and visibility data from the Meteorological Information Service System database of the China Meteorological Administration (CIMISS), every fog process was accompanied by large-scale haze conditions, we called the weather phenomena as fog-haze processes. For all the fog-haze processes, individual (strong) dense fog event screening was performed based on the following three visibility levels: (1) Vis is not greater than 1500 m; (2) Vis first drops below 1000 m, then rises above 1000 m; (3) Vis stays less than 1000 m for more than 30 min. Six fog events were screened that met the above conditions.
Based on the grade of fog forecast in the national standard of the People’s Republic of China (GB/T 27964-2011) [34], fog with Vis ≥ 50 m and < 500 m is classified as dense fog, fog with Vis < 50 m is classified as strong dense fog. Based on this classification, Case 1, 3, 4, 5, and 6 were dense fog events, and Case 2 was a strong dense fog event. Using the visibility as the criterion, the fog process can be divided into the four stages, the formation stage (when the Vis drops from 1500 m to 1000 m), the development stage (between the fog formation and the maturation stages), the maturation stage (after the Vis drops to its lowest level and remains basically constant for more than 30 min), and the dissipation stage (when the Vis increases noticeably from the lowest value to 1000 m).
Because this research mainly focuses on the changes of fog droplets and fine particles during the dense fog processes whose existing background is weak horizontal wind speed (Figure 2) and vertical wind [8], the changes of advection of fine particles could be ignored. The vertical transport may obviously affect the concentration of fog droplets and fine particles during the fog dissipation stage, while every continuous fog case was considered without any interruption, so the variation of fog spectrum originated from vertical movement is also neglected before fog dissipation. Moreover, being lack of vertical data of fog droplets and fine particles, following discussions about the characteristics and interactions of the droplet spectrum and fine particles at various stages of fog processes, were also based on the assumption that the variation of fog spectrum was only affected by local radiative cooling and the interaction of fine particles.

3. Characteristics of Fog Droplet Size Distribution and Fine Particle

3.1. Evolution Characteristics of the Fog Droplet Size Distribution and Fine Particle

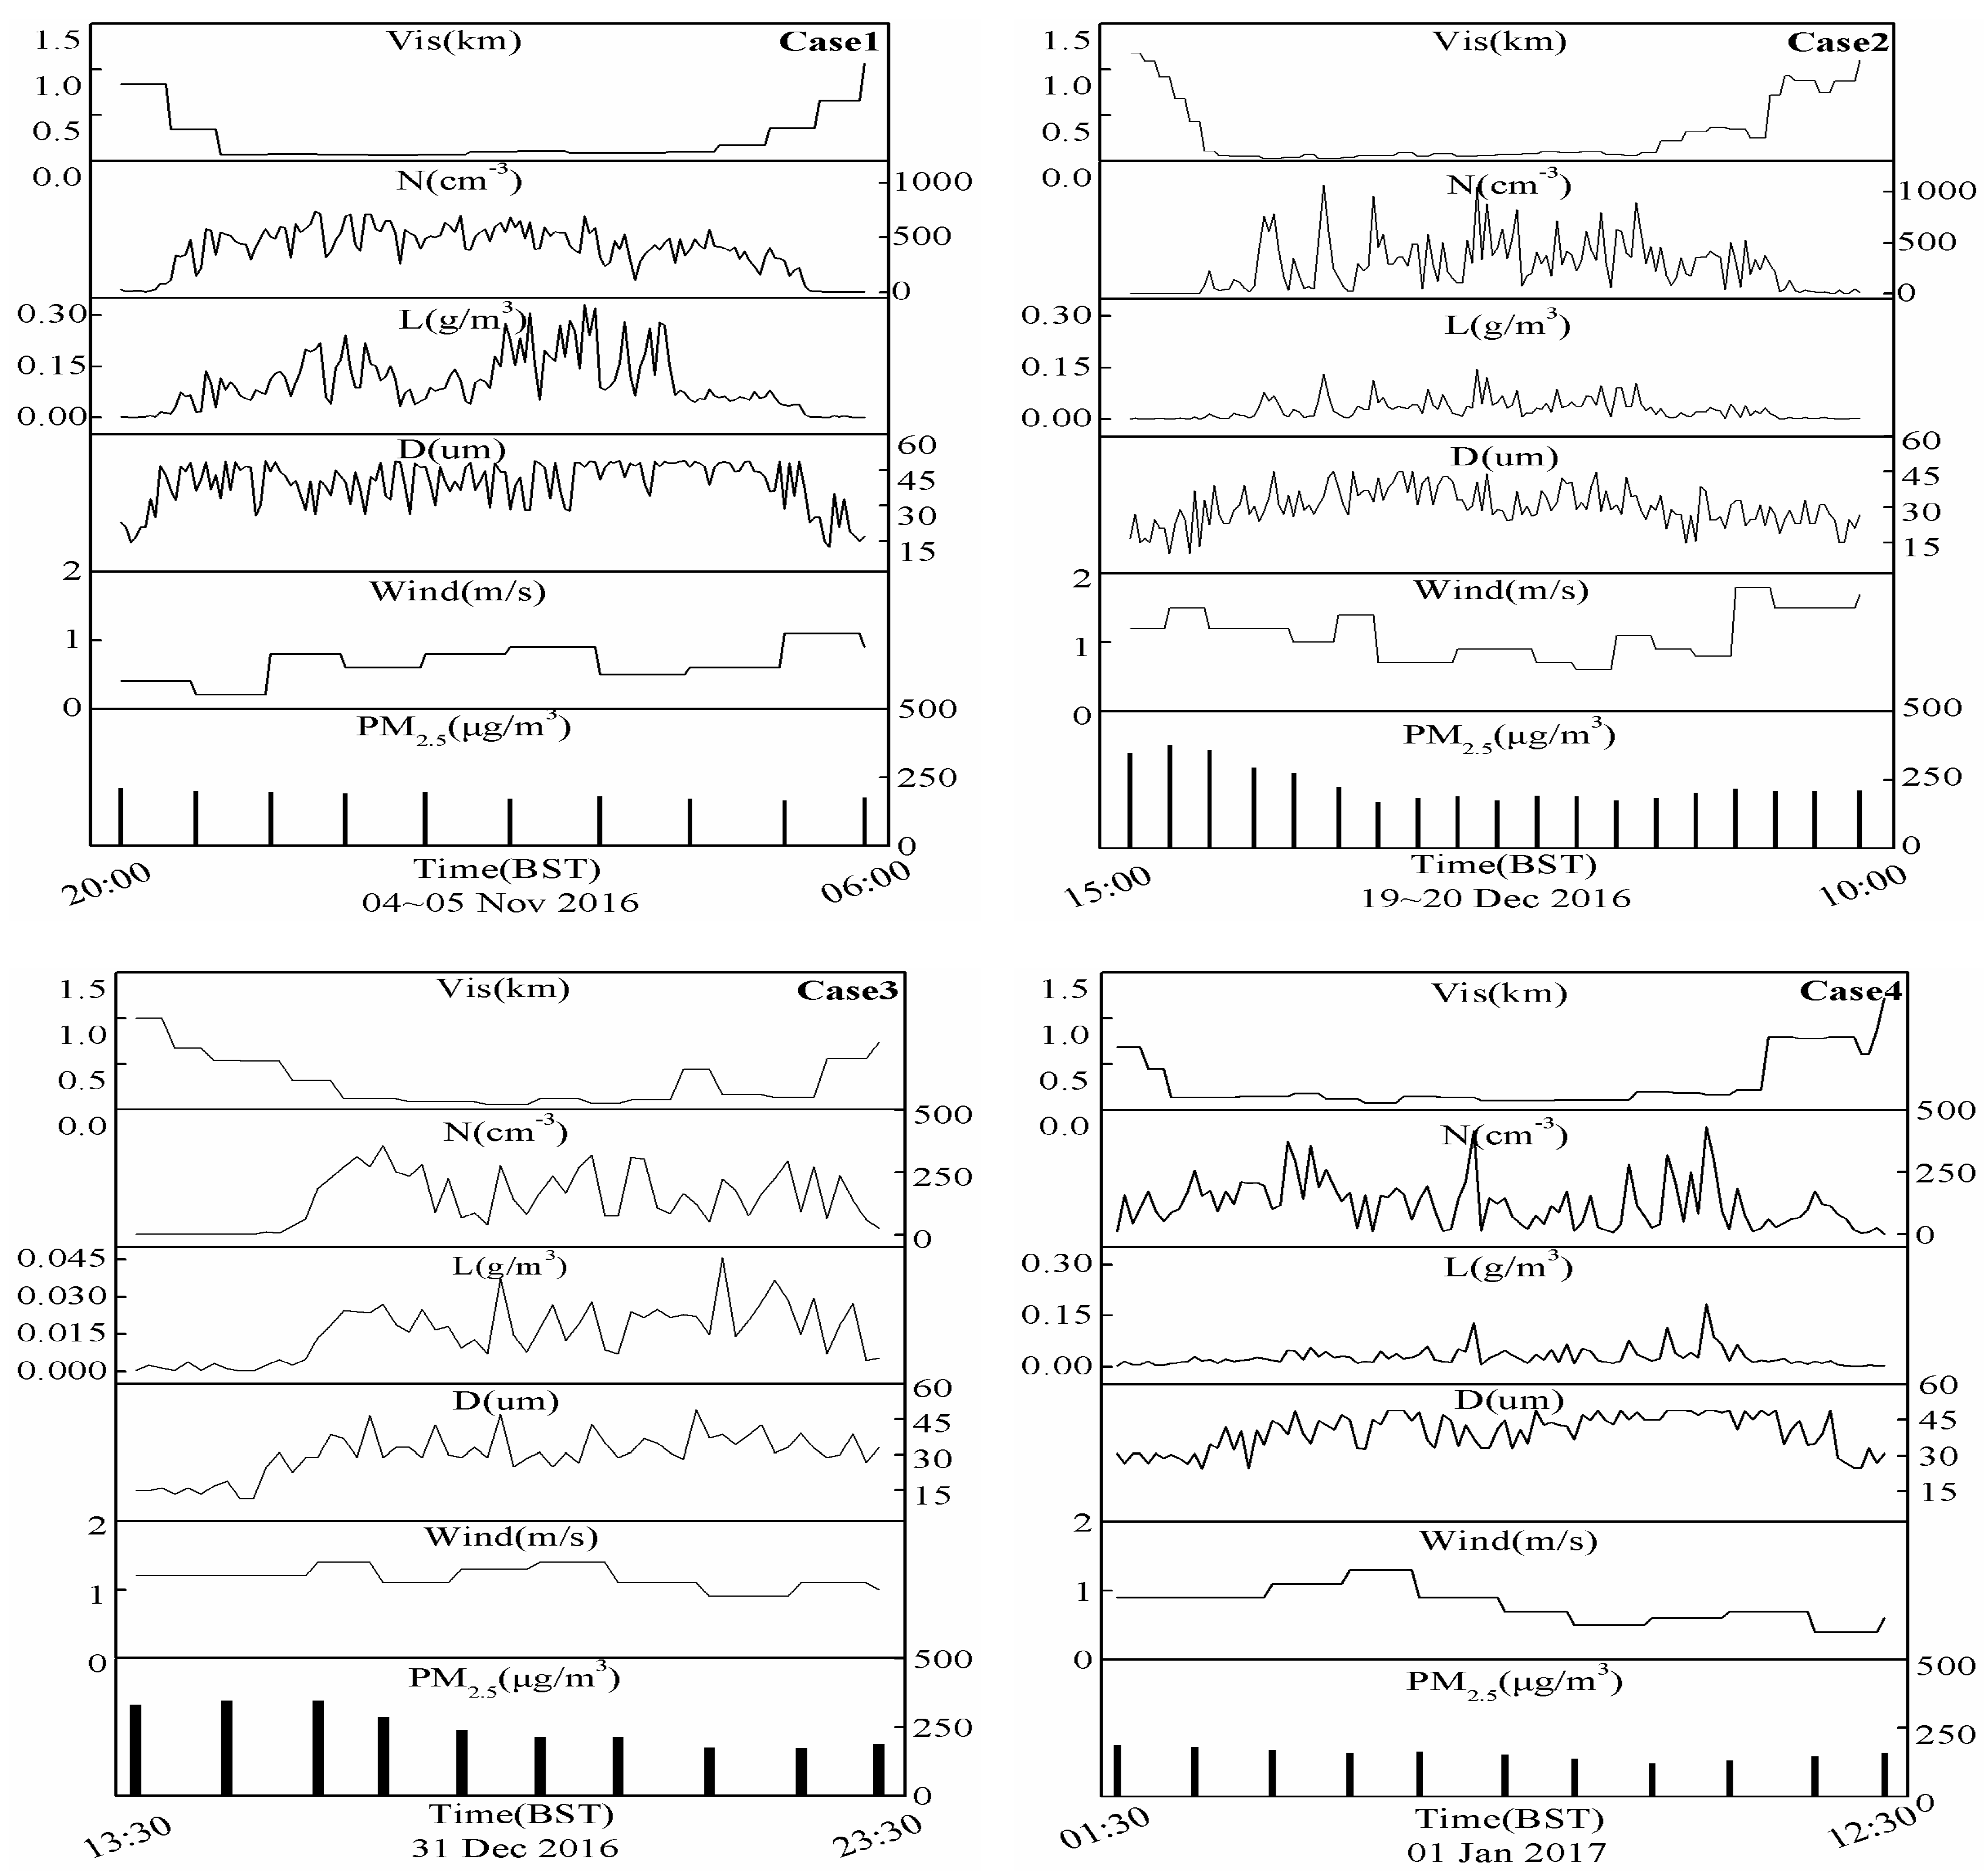
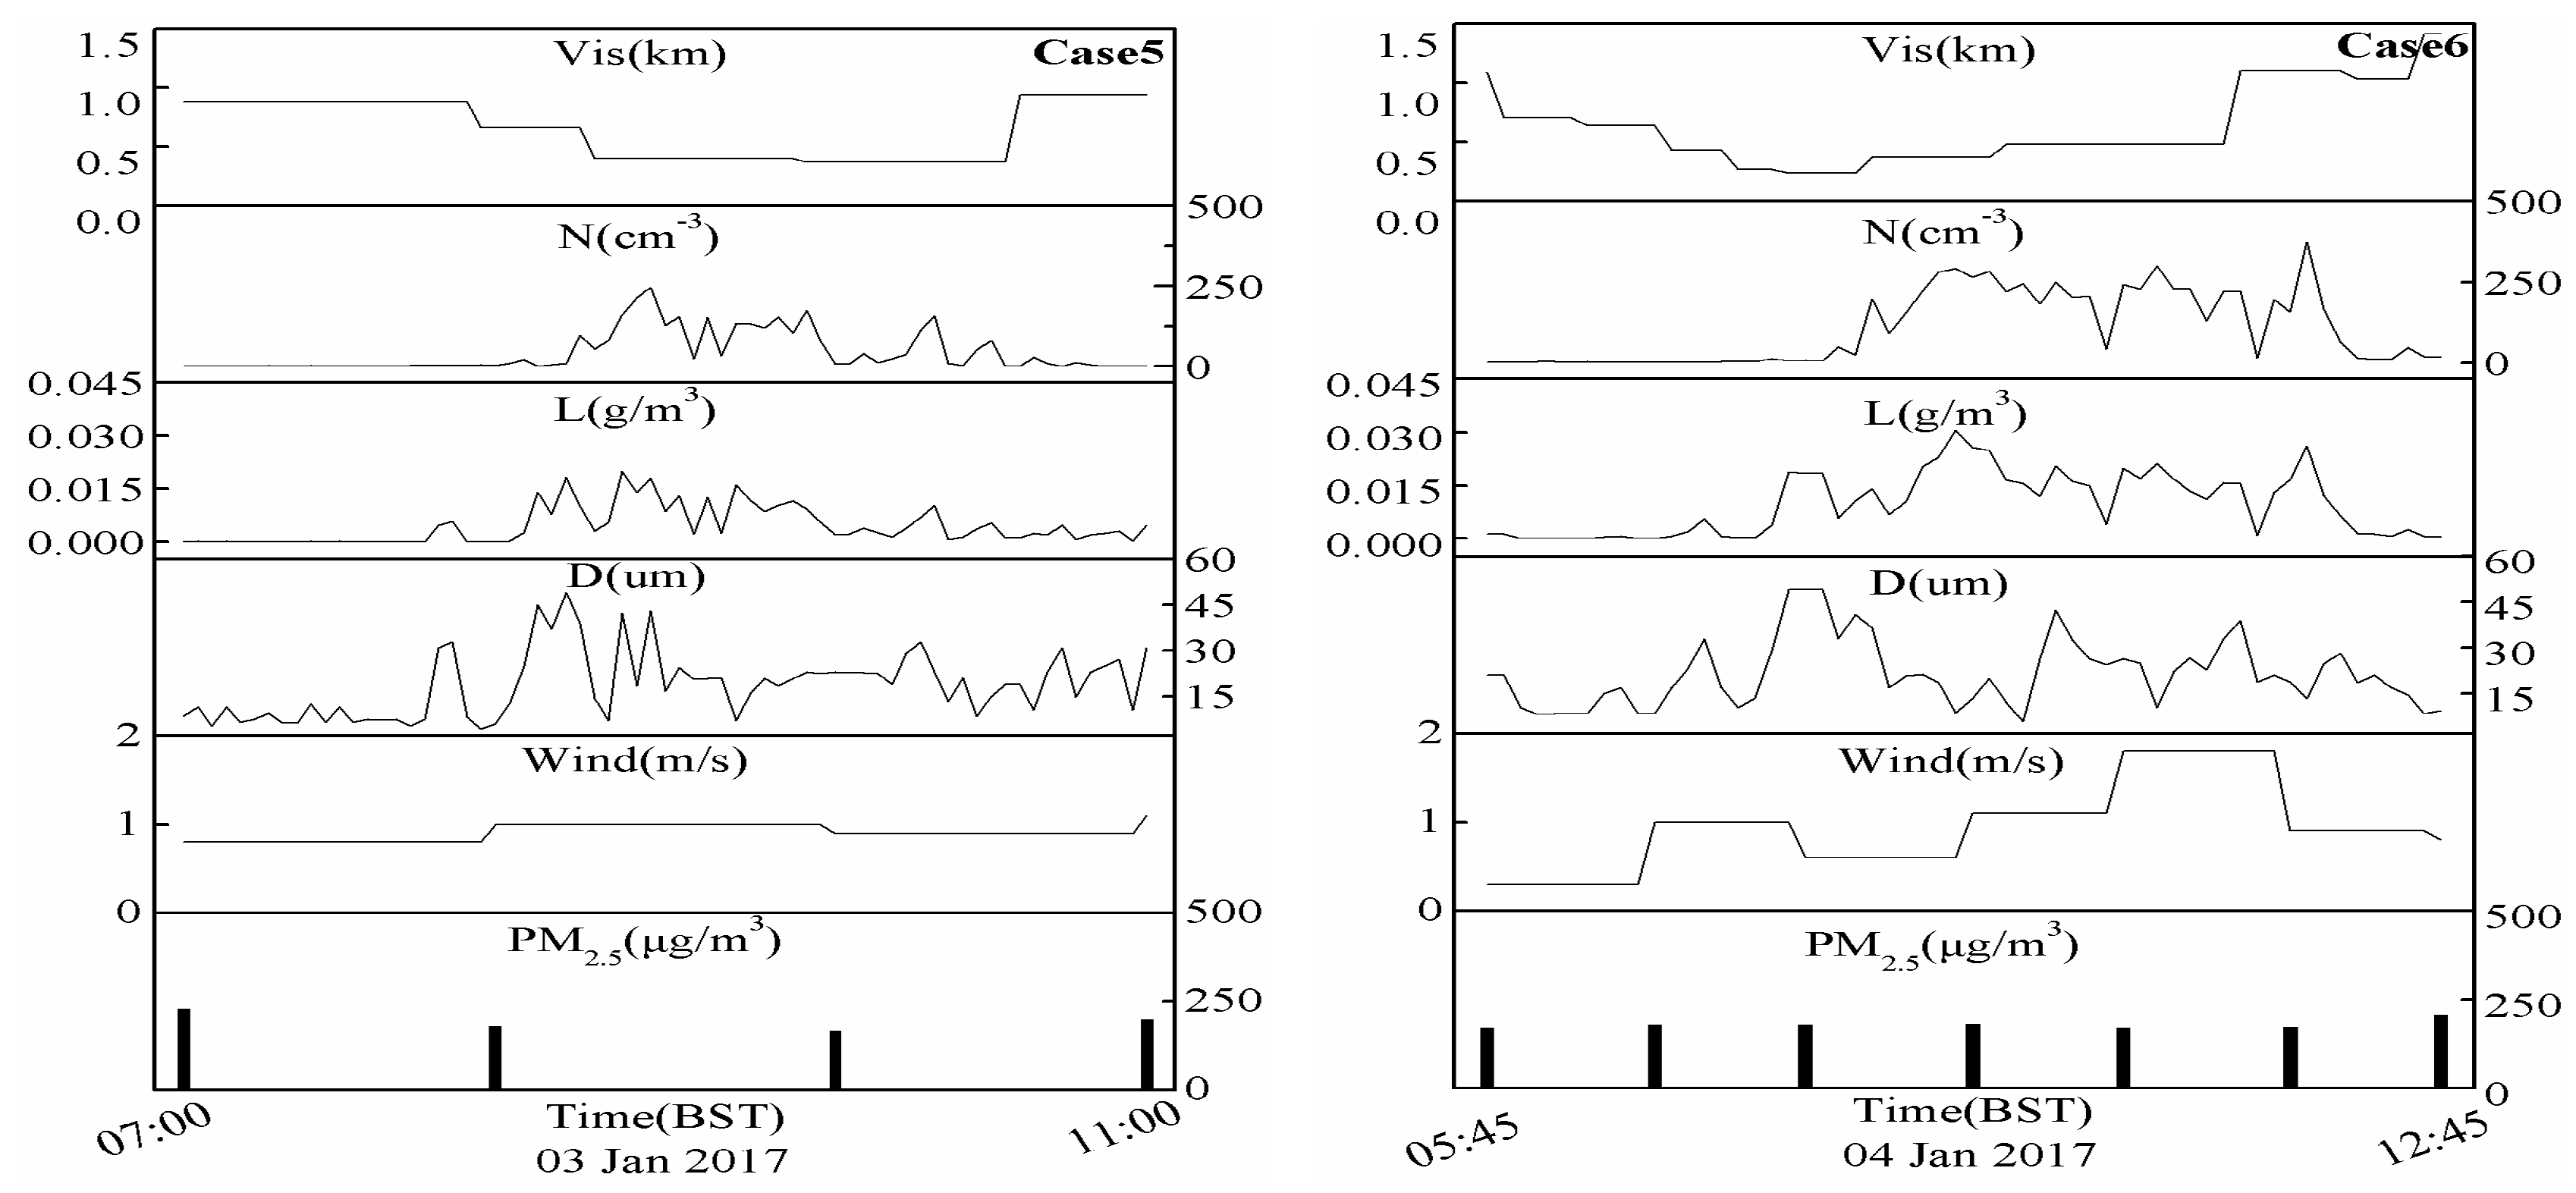
Table 2 lists the duration of Vis < 1000 m (Dr), the duration of the maturation stage (Drma), the maximum/average concentration (Nmax/Na), the maximum/average liquid water content (Lmax/La), and the maximum droplet diameter (Dmax), as well as the range of visibility change (Visma) during the maturation stage, and the maximum/minimum mass concentration of PM2.5 (CPM2.5max/CPM2.5min). Figure 2 and Figure 3 shows the change trend of D, L, N, Vis, Wind speed and CPM2.5, we can find the following characteristics.
First of all, it can be seen from Figure 2 that the L, N, and D of Tianjin (strong) dense fog display good positive correlation relationships. This is consistent with the research results for Nanjing winter fog [27,28] and Zhanjiang coastal fog [29,30,31]. In terms of the spectral width characteristics of fog droplets, in the six fog processes, the spectral widths are at approximately 45 μm. It can be considered that the winter (strong) dense fog in Tianjin is a broad-spectrum fog based on suggestion of Niu et al. [35].
Furthermore, during the (strong) dense fog processes in Tianjin, CPM2.5max ranges from 188–375 μg/m3, CPM2.5min ranges from 121–173 μg/m3 (Table 2). Figure 3 and Table 2 reveal that CPM2.5max always appears in the formation stage (Case 1, 2, 3, 4 and 5) or the dissipation stage (Case 6). The trend of the decrease in the concentration of fine particles is basically consistent in each process, but the decline is slightly different, indicating that the fog droplets scavenge the fine particles during the development and maturation stages, and CPM2.5 decreases significantly. Especially an “upturned tail” appears at the end of the temporal variations of hourly averages of CPM2.5 in each process (Figure 3), which means the removal efficiency of fine particles in fog process is significantly reduced during the dissipation stage.
Over and above that, Table 2 reveals that the Na, La, and Lmax of the strong dense fog (Case 2) are larger than those of dense fog. Na, La, and Lmax of Case 2 are 596 particles/cm3, 0.041 g/m3, and 0.145 g/m3, respectively, but they are 184 particles/cm3, 0.036 g/m3, and 0.122 g/m3 in the dense fog cases, respectively. The calculation values of Na, La, and Dmax of the (strong) dense fog cases in Tianjin, and the comparison of these values with the respective values of dense fog processes in several coastal and inland cities worldwide are listed Table 3. The La in Tianjin is 0.037 g/m3, which is very close to the La in Nanjing [27,28], but it is significantly lower than that in Zhanjiang Coast [29,30,31], Nova Scotia [36,37] and Japan’s Yodogawa Basin [20,38]. Moreover, Baoding’s La is the smallest [23,39]. Although Tianjin is also a coastal city, the La during the (strong) dense fog process is more similar to the values found in inland areas. Comparing the main chemical composition of fog water and the concentrations of the main aerosols with several coastal and inland cities around the world (Table 3), we found that CPM2.5 or CPM1 are about 200 μg/m3 in heavily industrialized inland area (Nanjing [27,28], Baoding [23,39], Kanpur [40,41]), as well as that in Tianjin. However, the concentrations of the main aerosols in several coastal areas (Nova Scotia [36,37], Yodogawa Basin [20,38], Fairbanks [42,43]) are much lower. The lower La in Tianjin is due to the fact that under certain water vapor conditions, high CPM2.5 will capture water vapor and form a large number of haze droplets, while high liquid water content is mainly contributed by large fog droplets [44]. Moreover, the main chemical composition of fog water in Tianjin is similar to those of inland cities without obvious sea salt particles [45], which is significant difference from those of other typical coastal areas, maybe because of the observation spot being 50 km far away from Bohai Sea with the addition of its almost inland sea. Large-sized sea salt particles have strong hygroscopic growth capacity to form large fog droplets containing salt ions Na+, and to supplement the liquid water content in the fog process. This may be the reason why CPM2.5 is also large in Zhanjiang, La is still greater than that in Tianjin.

3.2. Statistical Characteristics of the Fog Droplet Size Distribution

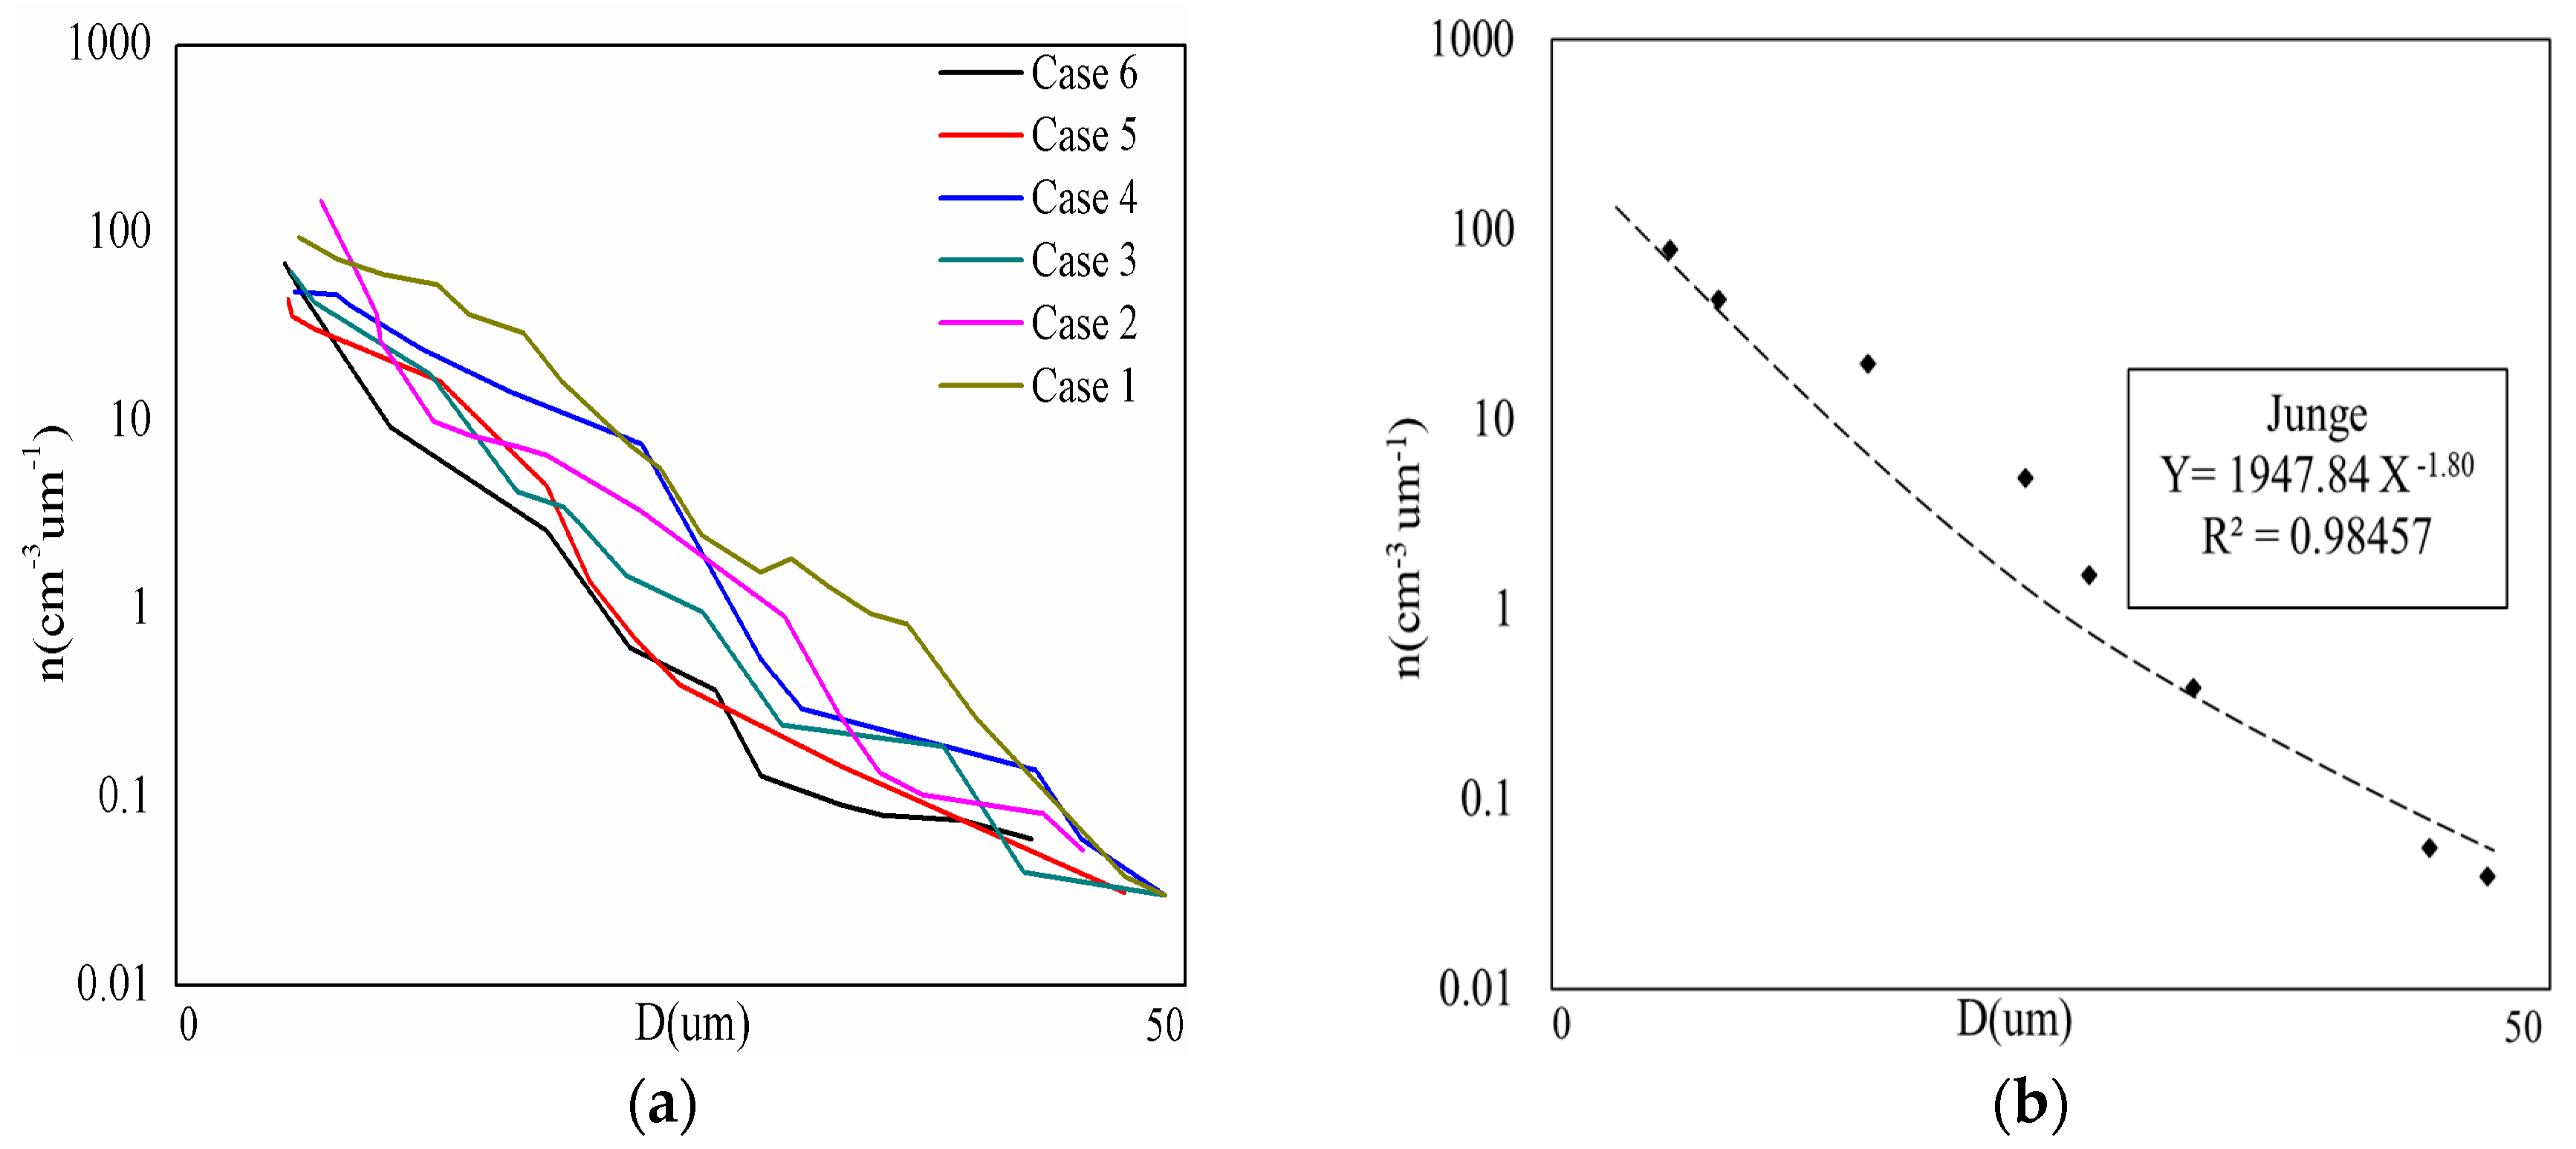
Figure 4a shows the spectrum of fog droplet size distributions in the six cases. The spectrum exhibit exponentially decreasing trends. The distributions are skewed toward the small droplet side, with the peak appearing in the small-droplet range of 5.4–7.2 µm in diameter. The peak diameter variation range of the droplets in the five dense fog processes is 5.4–6.1 µm, while the peak diameter in the strong dense fog process is 7.2 μm. These results indicate that the peak diameters of the spectrum are negatively correlated with visibility. The larger the peak diameter, the lower the visibility.
Researchers have demonstrated that the average spectral shape of fog droplet size distributions generally obeys either the Junge distribution [40] or the generalized gamma distribution [9]. The fitting form of Junge distribution follows this equation [46]:
n ( D ) = aD b
where a is the shape parameter, and b is the inverse dimension parameter. The goodness-of-fit coefficients R 2 can be determined using the following equation:
R 2 = SSR SST = i = 1 n ( n ^ i n ¯ ) 2 i = 1 n ( n i n ¯ ) 2
where SST is the total sum of squares, SSR is the sum of squares of regression, n i represents for the each observation value of N, n ^ i represents for the regression value of N, n ¯ represents the average of N. Figure 4a shows the results of fitting spectral shape of each case and Figure 4b for the average spectral shape of the whole six cases in Tianjin using the least squares method [47]. All six cases fit the Junge distribution very well. Only the average spectrum is given as following:
n ( D ) = 1947.84 D 1.80
With R 2 = 0.985. Chenjiaping of Chongqing, China, winter dense fog average spectrums also fit the Junge distribution [13], the values of a is 2590, b is 3.4. Although the average spectrum of Tianjin and Chongqing all fit the Junge distribution, the droplet spectrums are slightly different, which is determined by the difference of a and b . b determines the shape of the spectrum. When b is closer, a determines the increasing/decreasing range of n ( D ) with D . So the increasing/decreasing range of n ( D ) in Tianjin is less than that in Chongqing. The results show that the average spectrum of winter (strong) dense fog in Tianjin presents an exponentially decreasing distribution, which is consistent with the average spectral type of inland fog in some part of China (such as Chongqing).
In coastal areas such as Fairbanks [42,43], Nova Scotia [36,37], Zhanjiang coast [29,30,31], and the west coast of Casablanca [9], the average spectral shape mostly obey the generalized gamma distribution. In inland areas such as Nanjing, and Kanpur, the droplet spectra obey the Junge distribution (Table 3). Tianjin is a large city with a high population density situated on the west coast of Bohai Bay in North China Plain. Because the Bohai Sea is an inland ocean and its sea area is small, so its impact on Tianjin is smaller than that of the other open ocean. Therefore, Tianjin is still a continental climate, which is a coastal city greatly affected by industrialization and urbanization. Using Table 3 to continue to analyze the difference of the concentrations and chemical composition of hygroscopic particles in heavily industrialized inland and typical coastal areas. For the dense fog in Tianjin, fine particles have greater impacts on visibility than coarse particles, and his special chemical composition of hygroscopic particles in Tianjin (sulfate > particulate organic matter > elemental carbon > nitrate) [45] is similar to that of heavily polluted inland cities. The main chemical composition of fog water (whether it contains salt particles or not) has influence on the average spectrum. To sum up, due to its specific geographic location and chemical composition of hygroscopic particles, the fog droplet size distribution in Tianjin is similar to the distributions of heavily polluted inland cities but different from those of most coastal areas around the world.
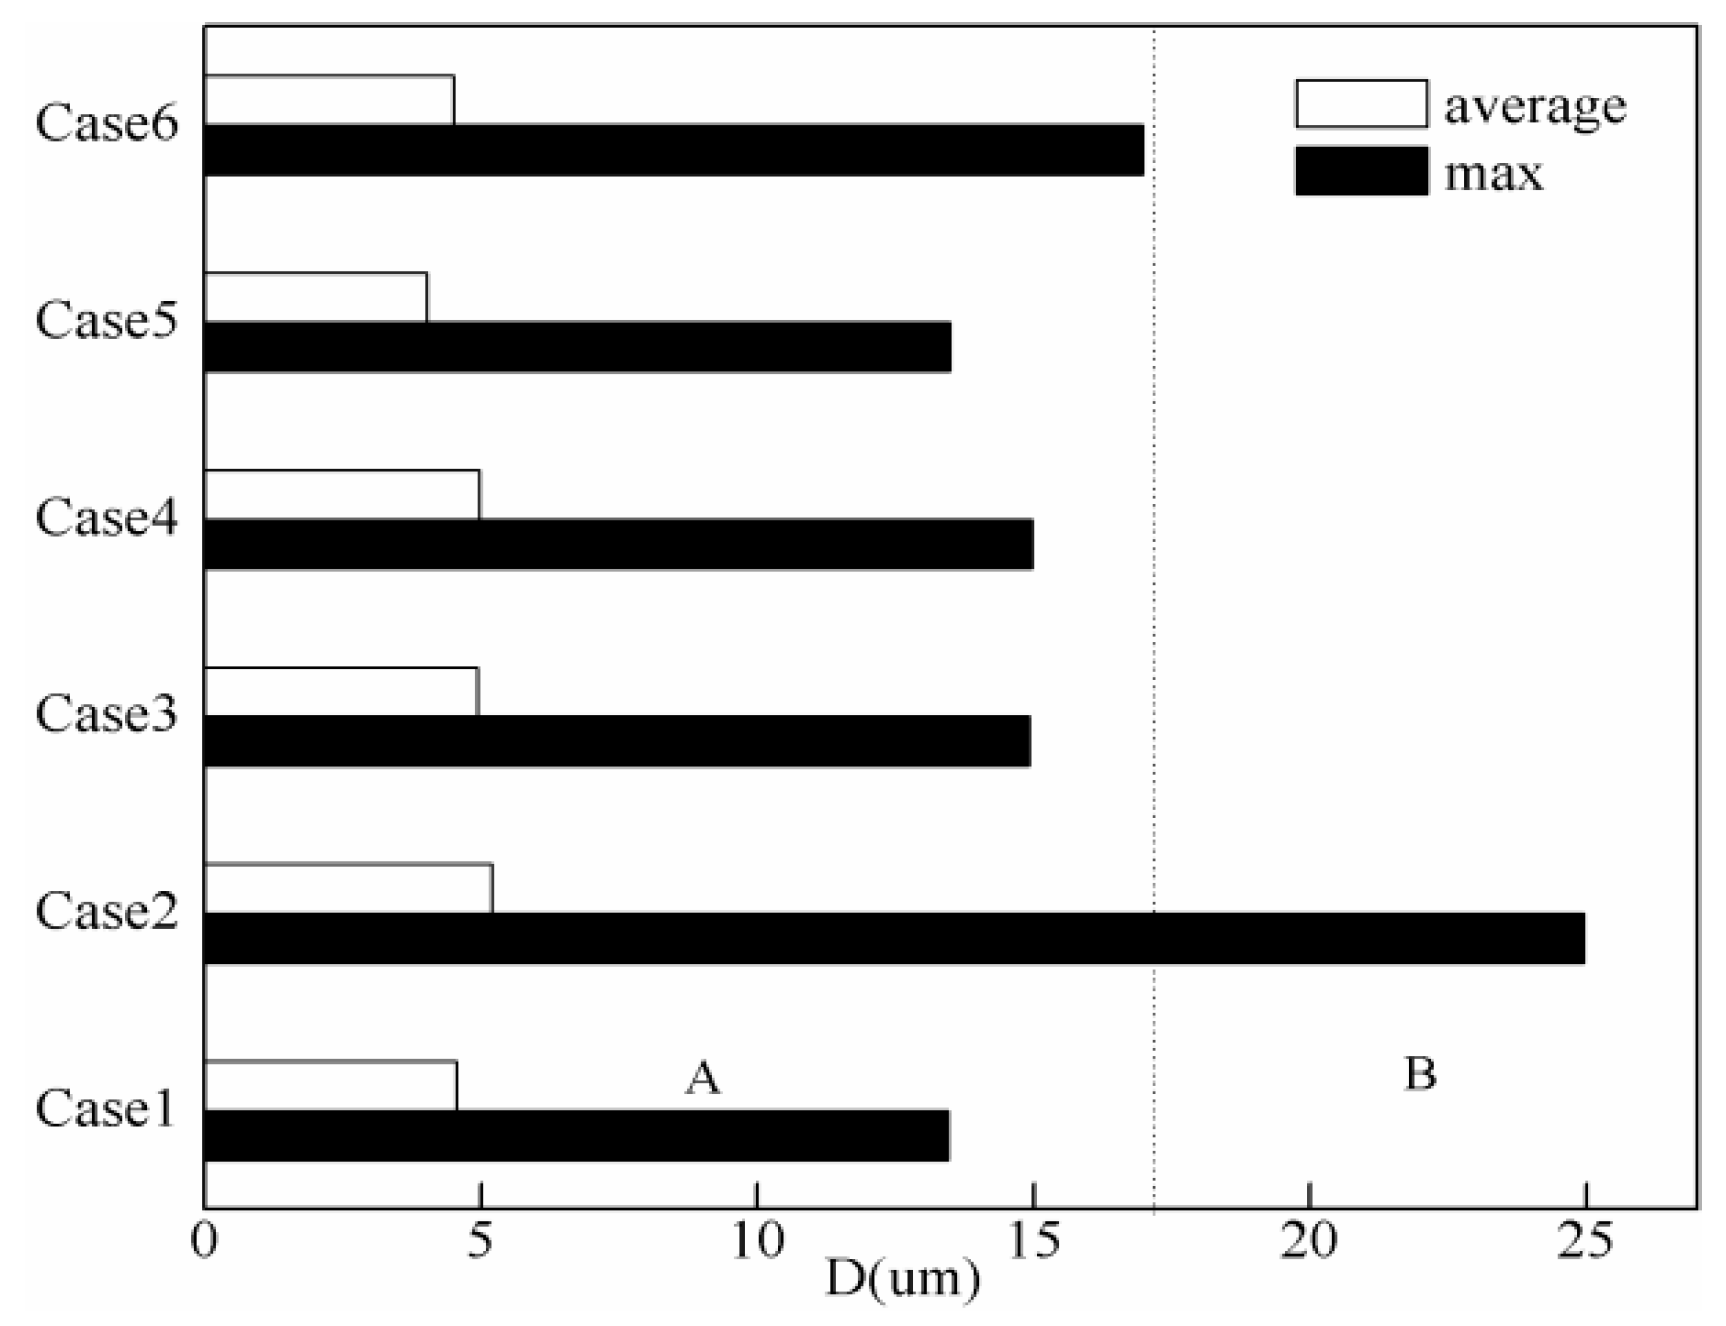
It is envisaged that if the similarities and differences of the microphysical characteristics of fog droplets in the formation stage of dense fog and strong dense fog can be clarified, it may be possible to judge the strong dense fog outbreak in advance, thereby improving the ability to predict the strong dense fog. Based on this idea, we had a comparative analysis of the characteristics of the fog droplet spectrum in the four stages of fog, and focused on the formation stage. Figure 5 shows the maximum and average particle diameters of the droplets during the formation stages of dense fog and strong dense fog. The average values of the droplet size in the six fog processes were similar, ranging from 4.02–5.20 μm. However, the maximum droplet size varies widely. Five dense fog processes droplet sizes were 13.45 μm, 14.91 μm, 14.97 μm, 11.48 μm, and 16.98 μm, respectively. In the strong dense fog process (Case 2), larger fog droplets appeared, exhibiting a maximum droplet size of 24.95 μm. Based on the maximum droplet size distribution during the formation stage, it was divided into two ranges (Figure 5), Range A (0 < Dmax ≤ 16.98 μm) and Range B (Dmax > 16.98 μm), respectively.
Figure 6 shows the size distribution characteristics of fog droplets at each stage of the six (strong) dense fog processes. For the five dense fog processes, it can be seen that during the formation stage, the droplet size spectrum were narrow and the droplet diameters were small, with an average value of 4.50 μm. Thus, the air contained mostly haze particles or small-scale fog droplets, as well as a few large droplets (indicated by the stars in the Figure 6), with N values ranging from 1–3 per cm3. The spectrum of condensation nucleus determines droplet concentration [48,49]. During the development process, the number of large particles that can act as droplet condensation nuclei increases sharply [19], the visibility quickly drops below 500 m, and the spectrum rises and noticeably widens. During the maturation stage, the number of fog droplets of all sizes reached their maximum values for the process. The range of spectrum width was 42.4–48.9 μm, which became significantly wider. The finding that N did not decrease but rather increased during this stage is different from the phenomenon that large droplets increase and small droplets decrease due to collision-coalescence summarized by Liu et al. [27].
For the strong dense fog, the spectral width during the formation phase is significantly wider than that during the dissipation phase (that is different from the five dense fog processes). A small number of fog droplet with value of 24.95 μm appear in short time (indicated by the stars in the Figure 6), which is a good indication for the eruption of strong dense fog. During the development stage, the change trend of each microphysical parameter is consistent with the dense fog processes. During the maturation stage, the maximum particle size increased to 45 μm, the spectral width increased to 38 μm, the droplet concentration increased by two orders of magnitude, and Lmax suddenly increased to 0.105 g/m3.

3.3. Interaction between Fog Droplets and Atmospheric Fine Particles

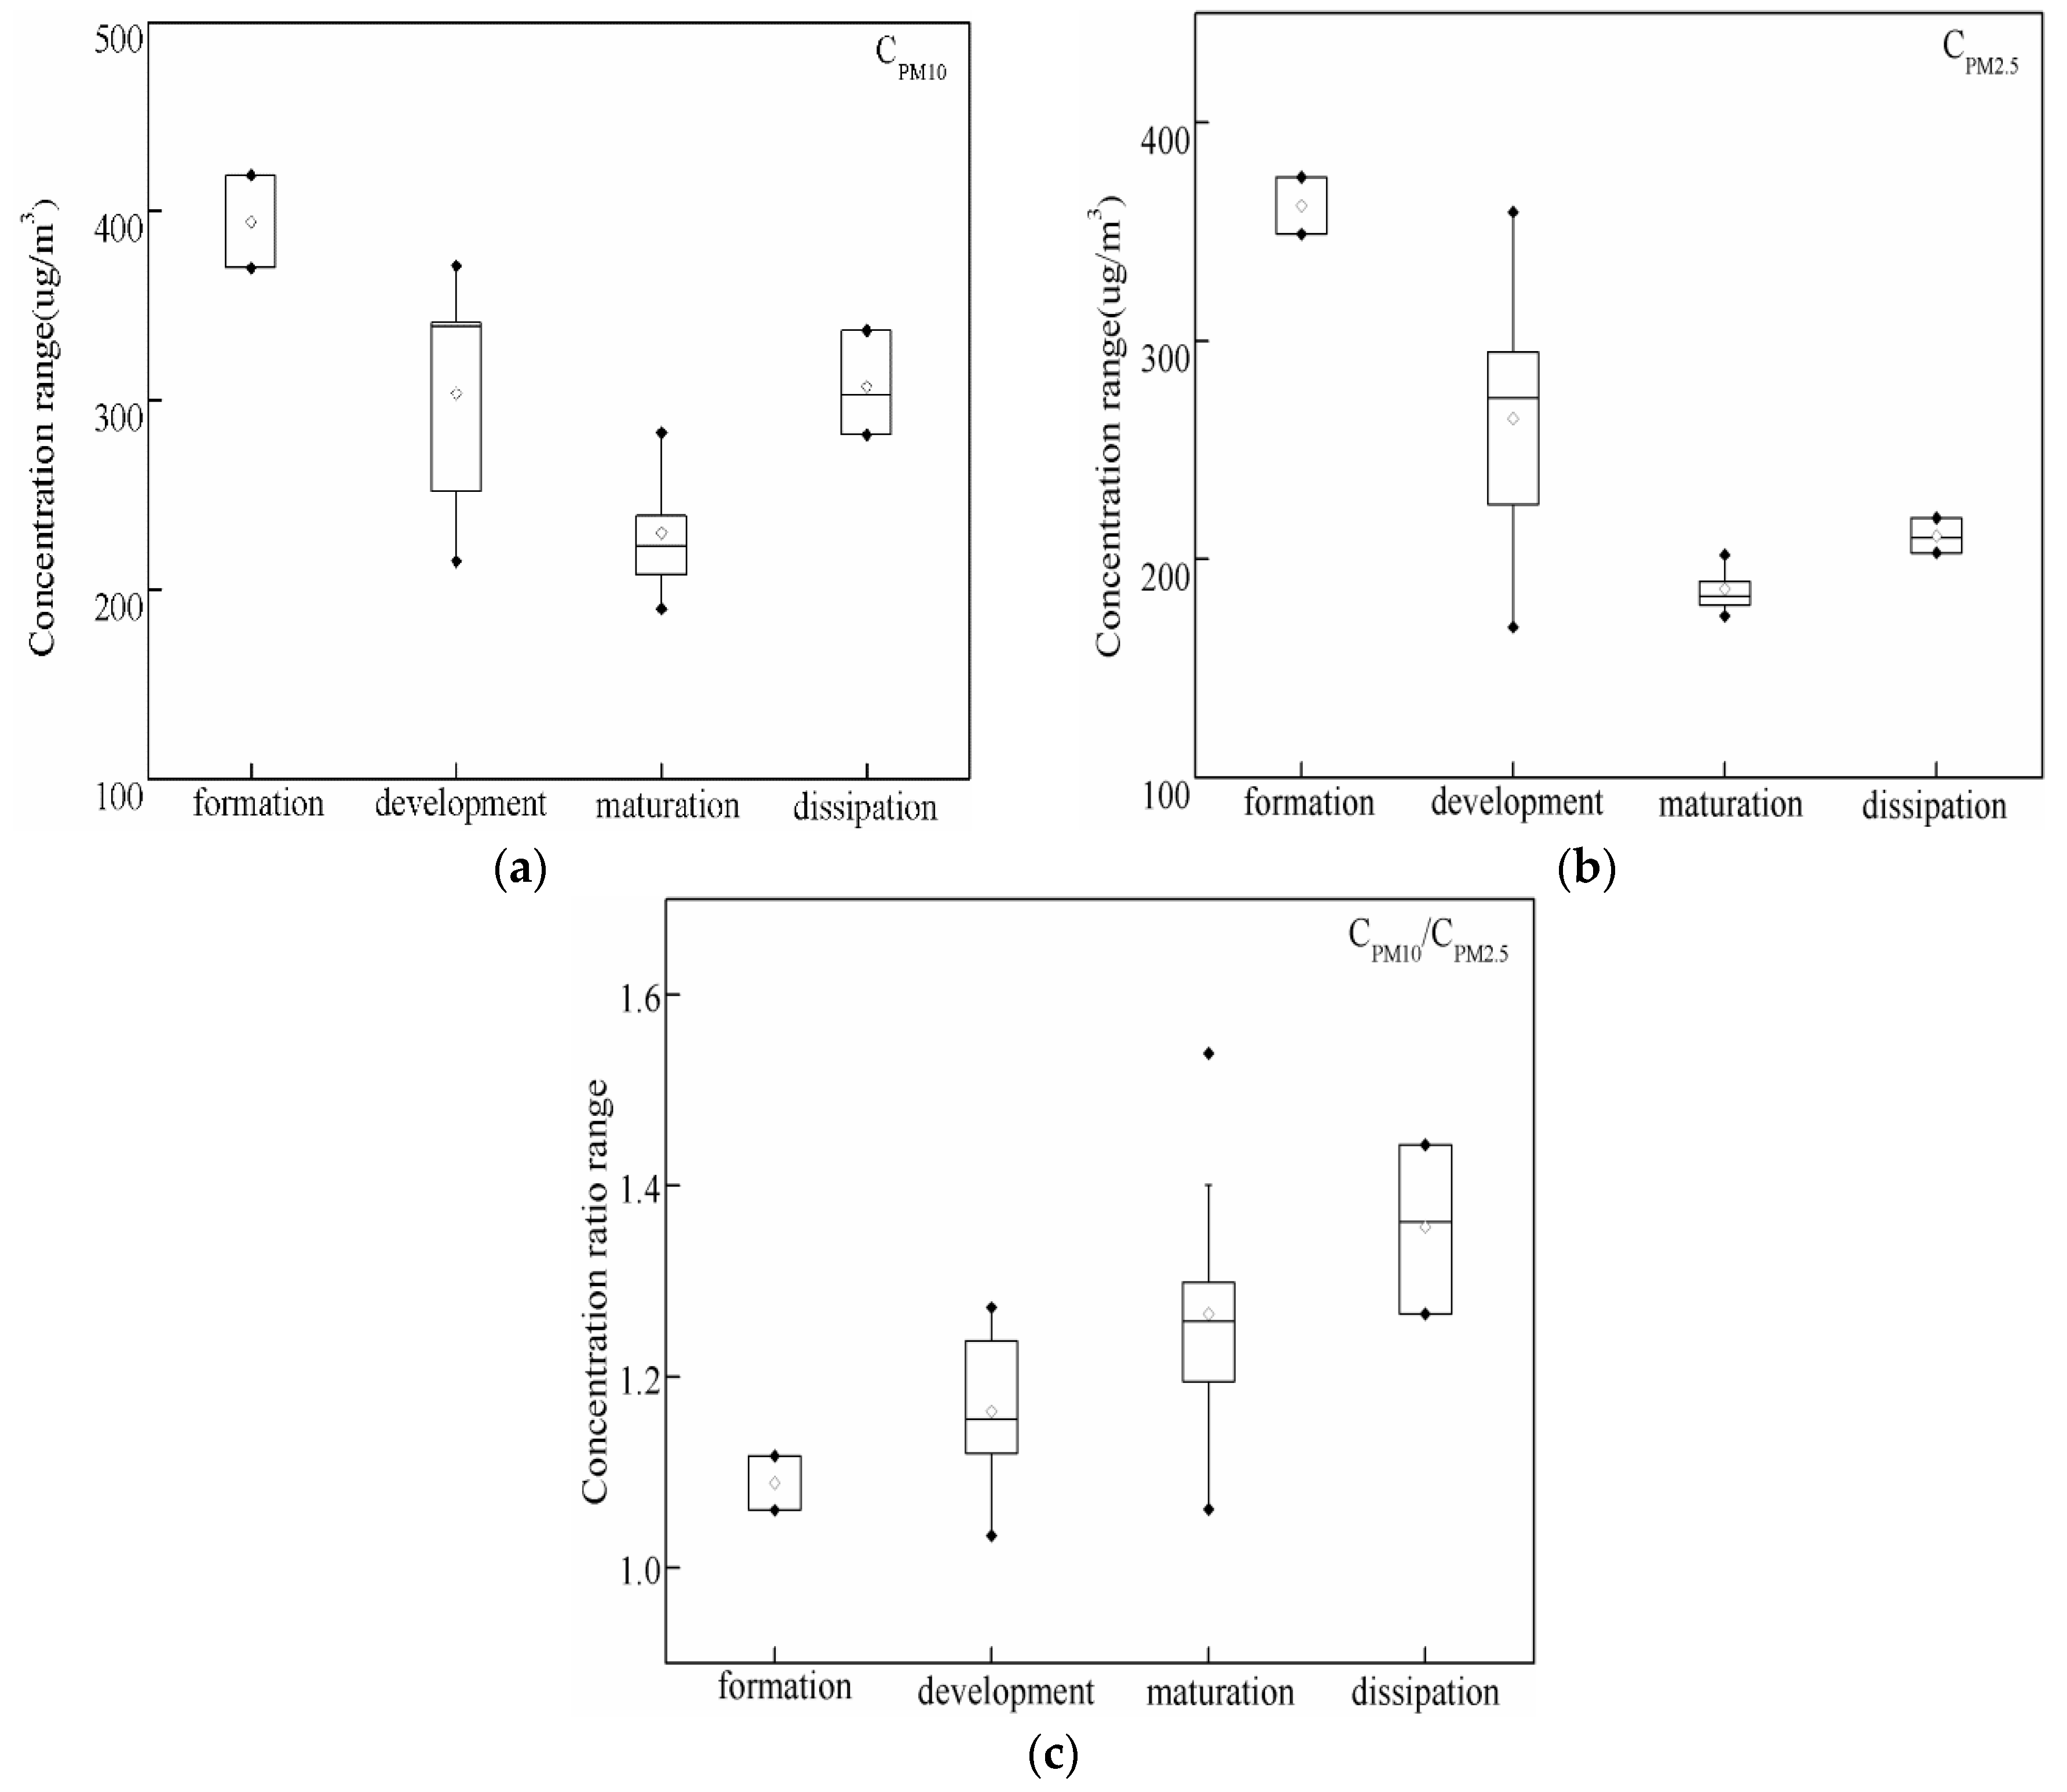
Select the strong dense fog process to further study the interaction between fog droplets and atmospheric fine particles. Case 2 was accompanied by severe haze, and the CPM2.5max and CPM10max were 375 μg/m3 and 419 μg/m3, respectively. The absolute changes of CPM10 and CPM2.5 in the four stages of fog are shown in Figure 7a,b. The maximum mass concentration of fine particles all appeared in formation stage of fog. During the stage of development and maturation, the mass concentration of fine particles show a rapid downward trend, which do not increase until the dissipation stage. Thus, the strong dense fog process in Tianjin has a strong effect on the removal of PM10 and PM2.5, which is consistent with previous studies in Tianjin [24]. The upward trend of the PM10/PM2.5, as shown in Figure 7c, obviously, after the formation stage, regardless of the median, 25% sample average, or 75% sample average, the ratio shows a steady upward trend, which fully indicates that the fog droplets are more significant clearance effect to PM2.5 than PM10. This conclusion is confirmed by the scavenging effect of water soluble aerosols by fog droplets during the dense fog in Indo Gangetic Plain [50].
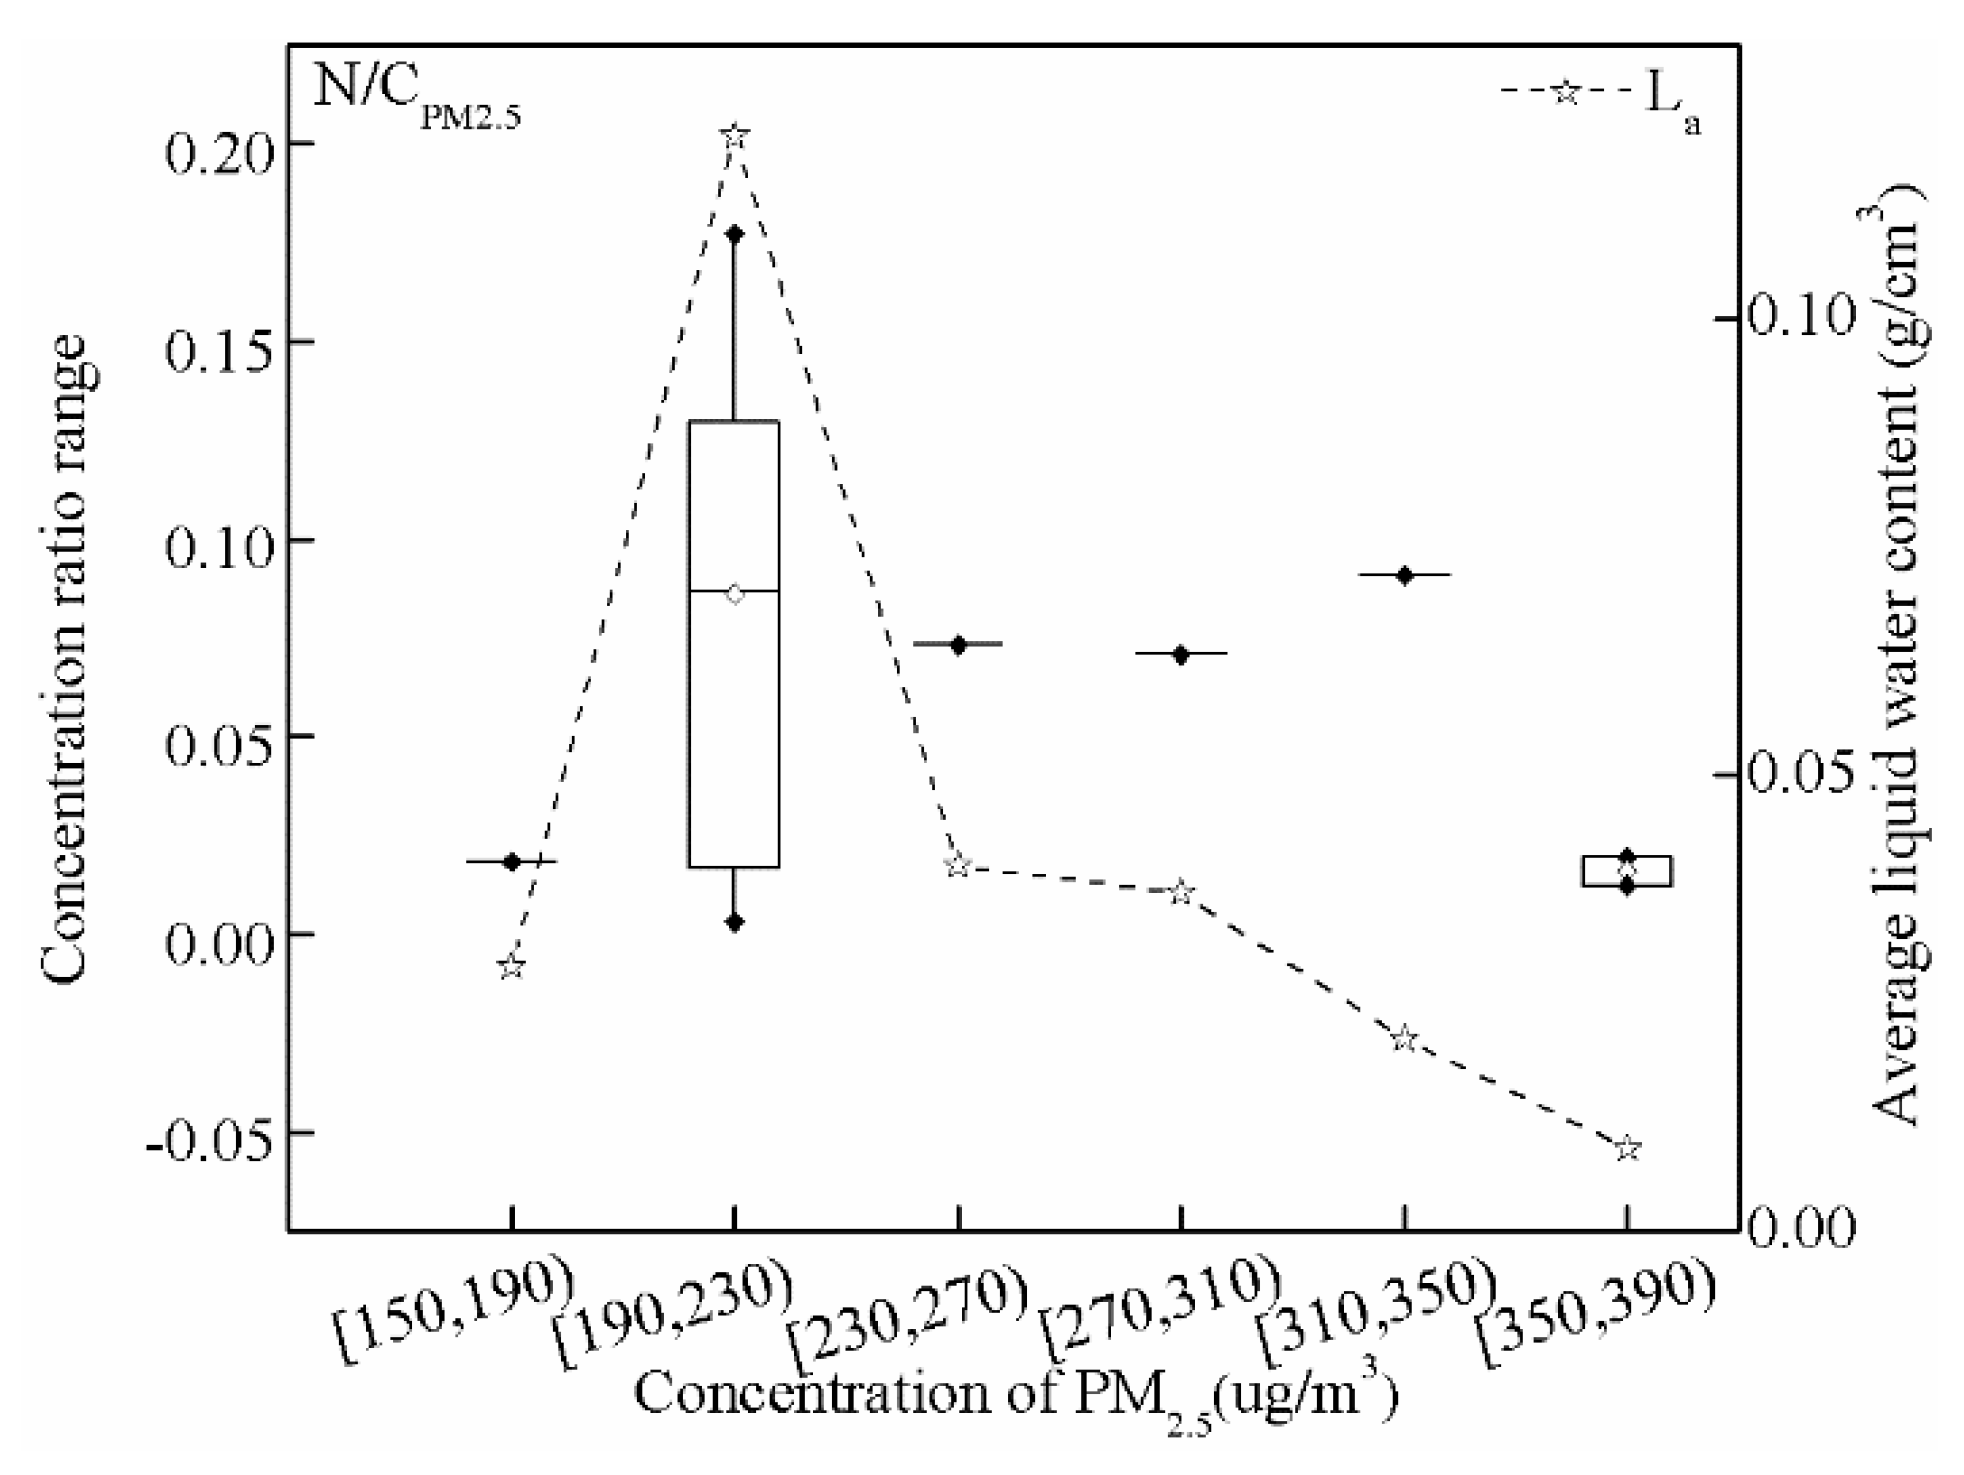
Figure 8 shows the distributions of La and N/CPM2.5 in different fine particle mass concentration intervals. For Case 2, Tian et al. [25] found that before fog appearance, the supply of exogenous water vapor was sufficient, and specific humidity rised slowly. However, after fog appearance, there was no longer the transport of exogenous water vapor, and the local water vapor content decreases slightly compared with the early stage (figure is slightly). The data selected in this paper is after fog appearance, the water vapor content no longer changes significantly. Therefore, it can be approximated that the water vapor content is nearly constant. In the course of strong dense fog, with the increase of CPM2.5, the value of N/CPM2.5 and La rapidly increased first. Especially when CPM2.5 is in the range of 190–230 μg/m3, the maximum value of N/CPM2.5 appears. It is consistent with the conclusion of Yue et al. [29] that as the L increases, the ratio of the concentration of fog droplets to fine particles will increase. N increases with the rise of CPM2.5, which indicates that when water vapor is sufficient, a large amount of PM2.5 is activated as fog droplet condensation nucleus and PM2.5 promotes the formation of fog. With the further increase of CPM2.5 to 310 μg/m3, N/CPM2.5 remain stable, but La value decrease rapidly. In other words, when CPM2.5 is in the range of 230–310 μg/m3, more PM2.5 are simultaneously activated into fog droplets. However, with the increase of N, due to the limited amount of water vapor, a large number of fog droplets rob the water vapor, so that the water vapour content decreases rapidly. When CPM2.5 is in the range of 310–350 μg/m3, the value of N/CPM2.5 rises again slightly, while the decrease trend of La is unchanged. This shows that the competition of fine particles for water vapor is up to the peak period, and more PM2.5 is activated as fog droplet condensation nucleus. As CPM2.5 continues to increase in the range of 350–390 μg/m3, the value of N/CPM2.5 decreases instead, at the same time La appears the minimum value. It is shown that excessive PM2.5 no longer promote the increase of fog droplets, but instead consumes more water vapor. When the water vapor is not enough to support the activation of a large number of fine particles to form fog droplets, the condensed liquid water content will be lower (La in the Figure 8).
Studies in Beijing, China have found that when CPM2.5 > 200 μg/m3, the aerosol concentration has a strong effect on the rapid growth of dense fog droplets and the decrease in visibility [32]. The positive feedback effect on the growth of fog droplets becomes prominent when the CPM2.5 > 230 μg/m3 in Tianjin (the CPM2.5 value is higher than that in Beijing, China). Moreover, as described above, the interaction between CPM2.5 and fog droplet growth in Tianjin is more complicated, because with the increase of CPM2.5, its positive feedback effect on droplet growth will weaken, and even inhibit the growth of fog droplets. It is found by combining Figure 7b and Figure 8, that during the development stage, the range of the CPM2.5 value is the largest (215–371 μg/m3), and only in the development stage, CPM2.5 was found to be in the range of 310–350 μg/m3. In other words, in the early stage of the development, the presence of a large number of fine particles is conducive to activation into more fog droplets, and also accelerates the condensation of liquid water content, and promotes the formation and development of strong dense fog. However, at the later stage of the development, when the CPM2.5 exceeds 350 μg/m3, the growth of fog droplets is inhibited.

4. Conclusions

Considering the fog-haze harmful effect to the important port city and the largest open coastal city in North China, field observations of fog droplet size distribution and fine particles are set to improve the ability of fog modification at Tianjin atmospheric boundary layer observation station. Based on the analysis of microphysical parameters of fog droplet and fine particles from limited six (strong) dense fog cases, which were observed during November 2016 to January 2017. Some results about the chemical composition of fog water and aerosols in coastal and inland cities were cited to explain the observation phenomena, the summary is as following.
Due to its specific geographic location and background pollution, the fog droplet size distribution in haze days in Tianjin are fitted with Junge spectrum models, which is similar to the heavily industrialized inland areas. The spectral width of (strong) dense fog are approximately 45 µm and peak diameters ranges from 5.4–7.2 µm. The Dmax up to 16.98 μm during the formation stage have a good indication to the outbreak of strong dense fog. The interaction between fog droplets and fine particles during dense Fog in Tianjin is distinctive and bidirectional. On the one hand, the strong dense fog process have a strong effect on the removal of PM10 and PM2.5, and scavenging efficiency to PM2.5 is more significant than PM10. On the other hand, fine particles have different function to fog. Fine particles are benefit to enhance the fog process when CPM2.5 is below the threshold, while showing contrary feedback effect and suppressing fog process when CPM2.5 is larger than the threshold.
It should be noted, that the effect of dynamical parameters change (such as wind, humidity or turbulence) have not been neglected in fog processes, and the conclusions of this study are only drawn from the analysis of atmospheric microphysical characteristics. In addition, the threshold quantitative analysis of large droplets size during the fog formation stage and the spectral characteristic of fog droplets from only six (strong) dense fog events, more fog cases investigation need to enhance its credibility.

Author Contributions

Methodology: B.W., Q.L. and Z.W.; Instrumentation maintenance: Z.W.; Analysis of results: B.W., Q.L. and T.H.; Writing and figures: Q.L. All authors have read and agreed to the published version of the manuscript.

Funding

This work was jointly funded by the National Natural Science Foundation of China (41675018, 41675135, and 41705045), the Natural Science Foundation of Tianjin (17JCYBJC23400), the Bohai Rim Regional Fund (QYXM201801) and the Open Project of the Key Laboratory for Cloud Physics of China Meteorological Administration (2018Z01605).

Acknowledgments

We thank Zhang Hongsheng from Peking University for his helpful comments.

Conflicts of Interest

The authors declare no conflict of interest.

References

  1. Kulkarni, R.; Jenamani, R.K.; Pithani, P.; Konwar, M.; Nigam, N.; Ghude, S.D. Loss to aviation economy due to winter fog in New Delhi during the winter of 2011–2016. Atmosphere 2019, 10, 198. [Google Scholar] [CrossRef] [Green Version]
  2. Thies, B.; Egli, S.; Bendix, J. The Influence of Drop Size Distributions on the Relationship between Liquid Water Content and Radar Reflectivity in Radiation Fogs. Atmosphere 2017, 8, 142. [Google Scholar] [CrossRef] [Green Version]
  3. Haeffelin, M.; Bergot, T.; Elias, T.; Tardif, R.; Carrer, D.; Chazette, P.; Colomb, M.; Drobinski, P.; Dupont, E.; Dupont, L.; et al. PARISFOG: Shedding new light on fog physical processes. Bull. Am. Meteorol. Soc. 2010, 91, 767–783. [Google Scholar] [CrossRef] [Green Version]
  4. Silverman, B.A.; Kunkel, B.A. A numerical model of warm fog dissipation by hygroscopic particle seeding. J. Appl. Meteorol. 1970, 9, 627–633. [Google Scholar] [CrossRef]
  5. Gultepe, I.; Fernando, H.J.S.; Pardyjak, E.R.; Hoch, S.W.; Silver, Z.; Creegan, E.; Leo, L.S.; Pu, Z.; Wekker, S.F.J.; Hang, C. An Overview of the MATERHORN Fog Project: Observations and Predictability. Pure Appl. Geophys. 2016, 173, 2983–3010. [Google Scholar] [CrossRef]
  6. Wang, J.; Daum, P.H.; Yum, S.S.; Liu, Y.; Senum, G.I.; Lu, M.-L.; Seinfeld, J.H.; Jonsson, H. Observations of marine stratocumulus microphysics and implications for processes controlling droplet spectra: Results from the Marine Stratus/Stratocumulus Experiment. J. Geophys. Res. 2009, 114, D18210. [Google Scholar] [CrossRef] [Green Version]
  7. Gerber, H.E. Microstructure of a radiation fog. J. Atmos. Sci. 1981, 38, 454–458. [Google Scholar] [CrossRef] [Green Version]
  8. Price, J. Radiation Fog. Part I: Observations of Stability and Drop Size Distributions. Bound. Layer Meteorol. 2011, 139, 167–191. [Google Scholar] [CrossRef]
  9. Bari, D.; Bergot, T.; Khlifi, M.E. Numerical study of a coastal fog event over Casablanca, Morocco. Q. J. R. Meteorol. Soc. 2015, 141, 1894–1905. [Google Scholar] [CrossRef]
  10. Bari, D. A preliminary impact study of wind on assimilation and forecast systems into the one-dimensional fog forecasting model COBEL-ISBA over Morocco. Atmosphere 2019, 10, 615. [Google Scholar] [CrossRef] [Green Version]
  11. Gultepe, I.; Milbrandt, J.A. Microphysical Observations and Mesoscale Model Simulation of a Warm Fog Case during FRAM Project. Pure Appl. Geophys. 2007, 164, 1161–1178. [Google Scholar] [CrossRef]
  12. Li, X.; Huang, J.; Shen, S.; Liu, S.; Lu, W. Evolution of liquid water content in a sea fog controlled by a high-pressure pattern. J. Trop. Meteorol. 2010, 16, 409–416. [Google Scholar] [CrossRef]
  13. Niu, S.; Lu, C.; Yu, H.; Zhao, L.; Lü, J. Fog research in China: An overview. Adv. Atmos. Sci. 2010, 27, 639–662. [Google Scholar] [CrossRef]
  14. Petters, M.D.; Kreidenweis, S.M. A single parameter representation of hygroscopic growth and cloud condensation nucleus activity. Atmos. Chem. Phys. 2007, 7, 1961–1971. [Google Scholar] [CrossRef] [Green Version]
  15. Khokhar, M.K.; Yasmin, N.; Chishtie, F.; Shahid, I. Temporal variability and characterization of aerosols across the Pakistan Region during the winter fog periods. Atmosphere 2016, 7, 67. [Google Scholar] [CrossRef] [Green Version]
  16. Zang, L.; Wang, Z.M.; Zhu, B.; Zhang, Y. Roles of relative humidity in aerosol pollution aggravation over Central China during wintertime. Int. J. Environ. Res. Public Health 2019, 16, 4422. [Google Scholar] [CrossRef] [PubMed] [Green Version]
  17. Stolaki, S.; Haeffelin, M.; Lac, C.; Dupont, J.C.; Elias, T.; Masson, V. Influence of aerosols on the life cycle of a radiation fog event. A numerical and observational study. Atmos. Res. 2015, 151, 146–161. [Google Scholar] [CrossRef]
  18. Elias, T.; Haeffelin, M.; Drobinski, P.; Gomes, L.; Rangognio, J.; Bergot, T.; Chazette, P.; Raut, J.-C.; Colomb, M. Particulate contribution to extinction of visible radiation: Pollution, haze, and fog. Atmos. Res. 2009, 92, 443–454. [Google Scholar] [CrossRef]
  19. Quan, J.; Zhang, Q.; He, H.; Liu, J.; Huang, M.; Jin, H. Analysis of the formation of fog and haze in North China Plain (NCP). Atmos. Chem. Phys. 2011, 11, 8205–8214. [Google Scholar] [CrossRef] [Green Version]
  20. Shimadera, H.; Kondo, A.; Kaga, A.; Shrestha, K.L.; Inoue, Y. Contribution of transboundary air pollution to ionic concentrations in fog in the Kinki Region of Japan. Atmos. Environ. 2009, 43, 5894–5907. [Google Scholar] [CrossRef]
  21. Aikawa, M.; Hiraki, T.; Suzuki, M.; Tamaki, M.; Kasahara, M. Separate chemical characterizations of fog water, aerosol, and gas before, during, and after fog events near an industrialized area in Japan. Atmos. Environ. 2007, 41, 1950–1959. [Google Scholar] [CrossRef]
  22. Fahey, K.M.; Pandis, S.N.; Collett, J.L.; Herckes, P. The influence of size-dependent droplet composition on pollutant processing by fogs. Atmos. Environ. 2005, 39, 4561–4574. [Google Scholar] [CrossRef]
  23. Guo, L.J.; Guo, X.L.; Fang, C.G.; Zhu, S.C. Observation analysis on characteristics of formation, evolution and transition of a long-lasting severe fog and haze episode in North China. Sci. China Earth Sci. 2015, 58, 329–344. [Google Scholar] [CrossRef]
  24. Han, S.; Wu, J.; Zhang, Y.; Cai, Z.; Feng, Y.; Yao, Q.; Li, X.; Li, Y.; Zhang, M. Characteristics and formation mechanism of a winter haze–fog episode in Tianjin, China. Atmos. Environ. 2014, 98, 323–330. [Google Scholar] [CrossRef]
  25. Tian, M.; Wu, B.; Huang, H.; Zhang, H.; Zhang, W.; Wang, Z. Impact of water vapor transfer on a Circum-Bohai-Sea heavy fog: Observation and numerical simulation. Atmos. Res. 2019, 229, 1–22. [Google Scholar] [CrossRef]
  26. Li, Q.; Wu, B.; Liu, J.; Zhang, H.; Cai, X.; Song, Y. Characteristics of the atmospheric boundary layer and its relation with PM2.5 during haze episodes in winter in the North China Plain. Atmos. Environ. 2020, 223, 117265. [Google Scholar] [CrossRef]
  27. Liu, D.; Yang, J.; Niu, S.; Li, Z. On the evolution and structure of a radiation fog event in Nanjing. Adv. Atmos. Sci. 2011, 28, 223–237. [Google Scholar] [CrossRef]
  28. Wu, D.; Zhang, F.; Ge, X.; Yang, M.; Xia, J.; Liu, G.; Li, F. Chemical and Light Extinction Characteristics of Atmospheric Aerosols in Suburban Nanjing, China. Atmosphere 2017, 8, 149. [Google Scholar] [CrossRef] [Green Version]
  29. Yue, Y.; Niu, S.; Zhang, Y.; Xu, F.; Zhao, L.; Lü, J. An observation study of sea fog in the coastal area of South China Sea. Trans. Atmos. Sci. 2015, 38, 694–702, (In Chinese with English abstract). [Google Scholar] [CrossRef]
  30. Hagler, G.S.W.; Bergin, M.H.; Salmon, L.G.; Yu, J.Z.; Wan, E.C.H.; Zheng, M.; Zeng, L.M.; Kiang, C.S.; Zhang, Y.H.; Lau, A.K.H.; et al. Source areas and chemical composition of fine particulate matter in the Pearl River Delta region of China. Atmos. Environ. 2006, 40, 3802–3815. [Google Scholar] [CrossRef]
  31. Wu, D.; Tie, X.; Li, C.; Ying, Z.; Kai-Hon Lau, A.; Huang, J.; Deng, X.; Bi, X. An extremely low visibility event over the Guangzhou region: A case study. Atmos. Environ. 2005, 39, 6568–6577. [Google Scholar] [CrossRef]
  32. Quan, J.; Tie, X.; Zhang, Q.; Liu, Q.; Li, X.; Gao, Y.; Zhao, D. Characteristics of heavy aerosol pollution during the 2012–2013 winter in Beijing, China. Atmos. Environ. 2014, 88, 83–89. [Google Scholar] [CrossRef]
  33. Rosenberger, J.L.; Gasko, M. Comparing Location Estimators: Trimmed Means, Medians, and Trimean. Understanding Robust and Exploratory Data Analysis; Wiley: New York, NY, USA, 1983; pp. 297–336. Available online: https://www.researchgate.net/publication/285809421_Comparing_location_estimators_Trimmed_means_medians_and_trimean (accessed on 4 March 2020).
  34. Grade of Fog Forecast GB/T 27964–2011. 2011. Available online: http://c.gb688.cn/bzgk/gb/showGb?type=online&hcno=F0E92BAD8204180AA7AB052A3FD73B70 (accessed on 4 March 2020). (In Chinese).
  35. Niu, S.J.; Liu, D.Y.; Zhao, L.J.; Lu, C.S.; Lü, J.J.; Yang, J. Summary of a 4-Year Fog Field Study in Northern Nanjing, Part 2: Fog Microphysics. Pure Appl. Geophys. 2011, 169, 1137–1155. [Google Scholar] [CrossRef]
  36. Fitzgerald, J.W. A Numerical Model of the Formation of Droplet Spectra in Advection Fogs at Sea and Its Applicability to Fogs off Nova Scotia. J. Atmos. Sci. 1978, 35, 1522–1535. [Google Scholar] [CrossRef] [Green Version]
  37. Dabek-Zlotorzynska, E.; Dann, T.F.; Kalyani Martinelango, P.; Celo, V.; Brook, J.R.; Mathieu, D.; Ding, L.; Austin, C.C. Canadian National Air Pollution Surveillance (NAPS) PM2.5 speciation program: Methodology and PM2.5 chemical composition for the years 2003–2008. Atmos. Environ. 2011, 45, 673–686. [Google Scholar] [CrossRef]
  38. Hikari, S.; Kundan, L.S.; Akira, K.; Akikazu, K.; YOSHIO, I. Fog simulation using a mesoscale model in and around the Yodo River Basin, Japan. J. Environ. Sci. 2008, 20, 838–845. [Google Scholar] [CrossRef]
  39. Yan, P.; Tang, J.; Huang, J.; Mao, J.T.; Zhou, X.J.; Liu, Q.; Wang, F.Z.; Zhou, H.G. The measurement of aerosol optical properties at a rural site in Northern China. Atmos. Chem. Phys. 2008, 8, 2229–2242. [Google Scholar] [CrossRef] [Green Version]
  40. Kaul, D.S.; Tripathi, S.N.; Gupta, T. Chemical and microphysical properties of the aerosol during foggy and nonfoggy episodes: A relationship between organic and inorganic content of the aerosol. Atmos. Chem. Phys. Discuss. 2012, 12, 14483–14524. [Google Scholar] [CrossRef] [Green Version]
  41. Chakraborty, A.; Gupta, T. Chemical Characterization and Source Apportionment of Submicron (PM1) Aerosol in Kanpur Region, India. Aerosol Air Qual. Res. 2010, 10, 433–445. [Google Scholar] [CrossRef]
  42. Schmitt, C.G.; Stuefer, M.; Heymsfield, A.J.; Kim, C.K. The microphysical properties of ice fog measured in urban environments of Interior Alaska. J. Geophys. Res. Atmos. 2013, 118, 11136–11147. [Google Scholar] [CrossRef]
  43. Wetzel, M.A. Physical, chemical, and ultraviolet radiative characteristics of aerosol in central Alaska. J. Geophys. Res. 2003, 108, 4418. [Google Scholar] [CrossRef] [Green Version]
  44. Eldridge, R.G. The Relationship between visibility and liquid water content in fog. J. Atmos. Sci. 1971, 28, 1183–1186. [Google Scholar] [CrossRef] [Green Version]
  45. Han, S.; Bian, H.; Zhang, Y.; Wu, J.; Wang, Y.; Tie, X.; Li, Y.; Li, X.; Yao, Q. Effect of Aerosols on Visibility and Radiation in Spring 2009 in Tianjin, China. Aerosol. Air. Qual. Res. 2012, 12, 211–217. [Google Scholar] [CrossRef] [Green Version]
  46. Cachorro, V.E.; De Frutos, A.M.; Gonzalez, M.J. Analysis of the relationships between Junge size distribution and Angstrom a turbidity parameters from spectral measurements of atmospheric aerosol extinction. Atmos. Environ. Part A Gen. Top. 1993, 27, 1585–1591. [Google Scholar] [CrossRef]
  47. Bloomfield, P.; Royle, J.A.; Steinberg, L.J.; Yang, Q. Accounting for meteorological effects in measuring urban ozone levels and trends. Atmos. Environ. 1996, 30, 3067–3077. [Google Scholar] [CrossRef]
  48. Hudson, J.G. Relationship between fog condensation nuclei and fog microstructure. J. Atmos. Sci. 1980, 37, 1854–1867. [Google Scholar] [CrossRef] [Green Version]
  49. Laj, P.; Fuzzi, S.; Lazzari, A.; Ricci, L.; Orsi, G.; Berner, A.; Dusek, U.; Schell, D.; Guenther, A.; Wendisch, M.; et al. The size dependent composition of fog droplets. Contrib. Atmos. Phys. 1998, 71, 115–130. Available online: https://www.osti.gov/etdeweb/biblio/613361 (accessed on 4 March 2020).
  50. Izhar, S.; Gupta, T.; Panday, A.K. Scavenging efficiency of water soluble inorganic and organic aerosols by fog droplets in the Indo Gangetic Plain. Atmos. Res. 2019, 235, 104767. [Google Scholar] [CrossRef]
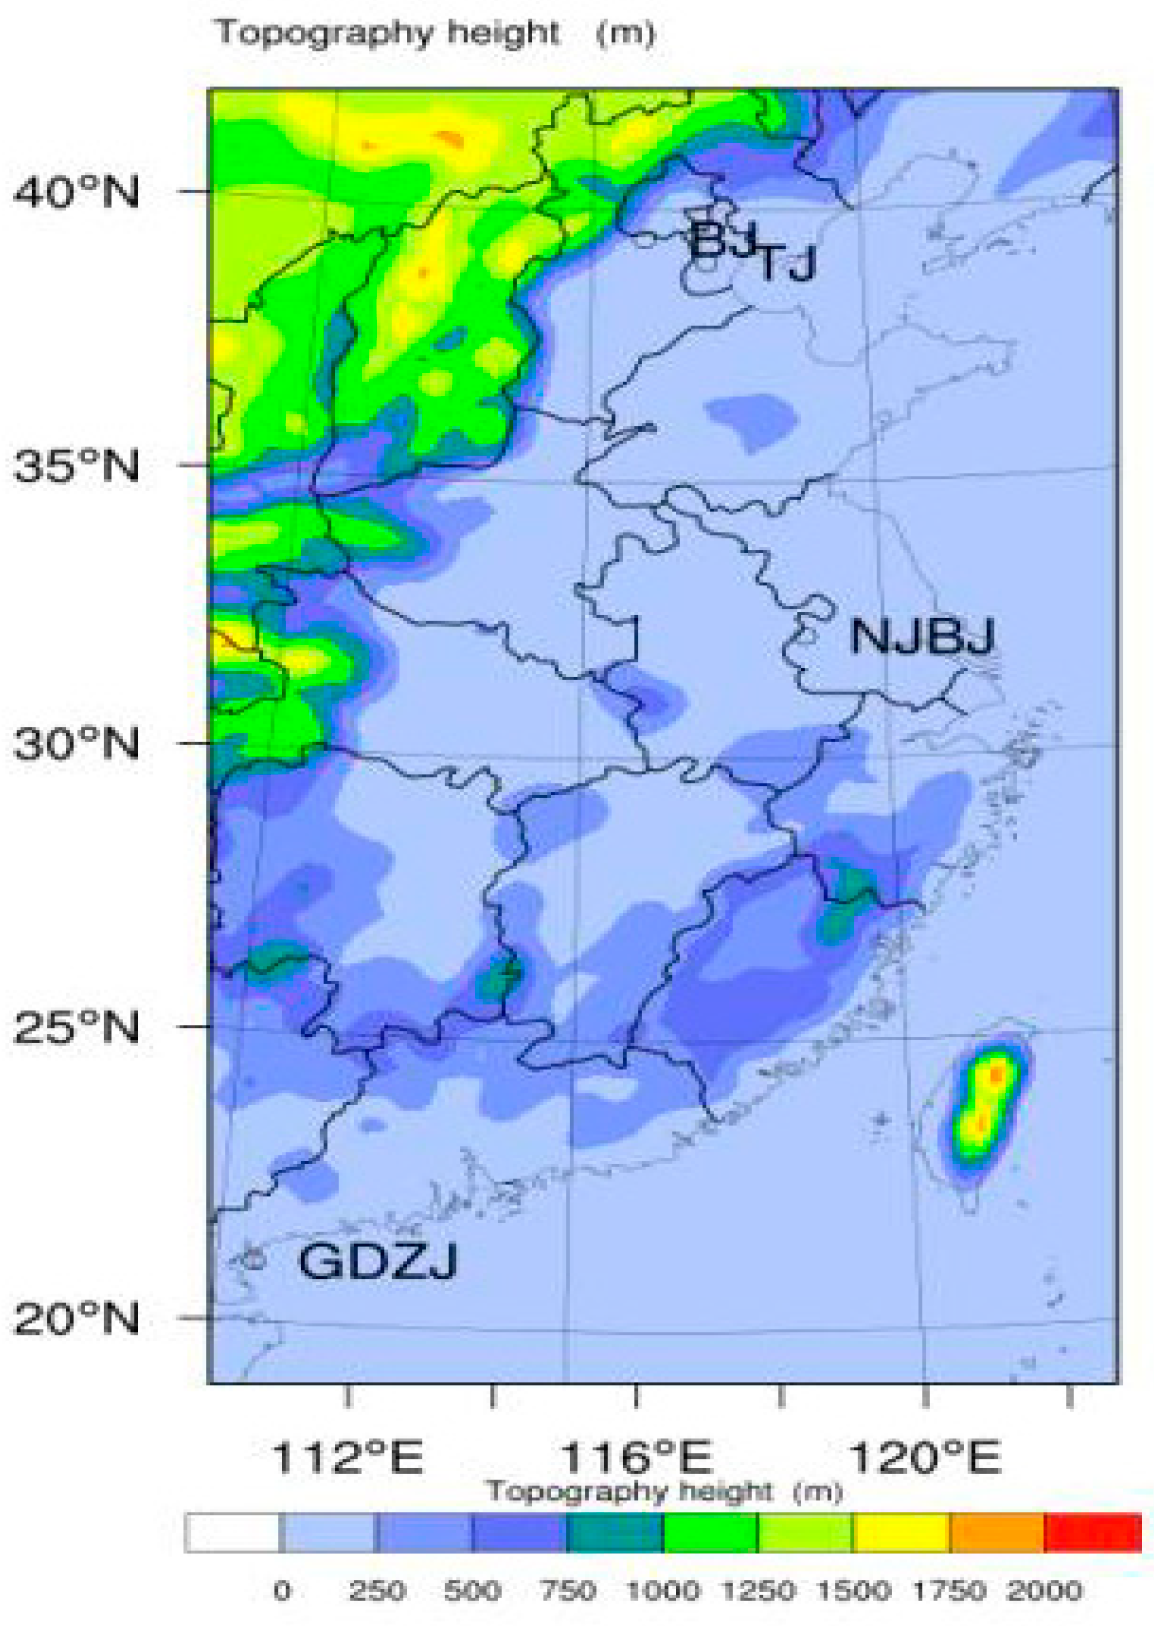
Figure 1. Tianjin test area and other mentioned fog test areas in China.
Atmosphere 11 00258 g001
Figure 2. Temporal variations of 5-min averages of D, L, and N, and hourly averages of Vis, Wind speed and CPM2.5 for the six fog processes.
Atmosphere 11 00258 g002aAtmosphere 11 00258 g002b
Figure 3. The temporal variations of CPM2.5 for the six cases.
Atmosphere 11 00258 g003
Figure 4. Fog droplet size distribution characteristics of six fog processes (a), and the average spectrum of fog droplet size distribution (b).
Atmosphere 11 00258 g004
Figure 5. The maximum and average diameter during the formation stages of dense fog and strong dense fog.
Atmosphere 11 00258 g005
Figure 6. Fog droplet size distributions of (strong) dense fog in four stages and the Dmax during the formation stage. (The four phases are formation, development, maturation and dissipation. Case1, 3, 4, 5, 6 are dense fog. Case 2 is strong dense fog. The star in each plot denotes the size of the largest droplet and the corresponding N during the formation stage for the respective fog process).
Atmosphere 11 00258 g006
Figure 7. Changes of CPM10(a), CPM2.5(b), and CPM10/CPM2.5 (c)during the four stages in Case 2.
Atmosphere 11 00258 g007
Figure 8. Changes of N/CPM2.5 and average liquid water content with CPM2.5 in Case 2.
Atmosphere 11 00258 g008
Table 1. Instrumentation and measurements for the winter fog observations in Tianjin.
InstrumentManufacturerModelTime ResolutionMeasured Parameter
Fog monitorDMT, USFM-1201 sN, L, D, size distribution
Forward scatter visibility meterBelfort, USMODEL60001 minVis
Ambient particulate monitorThermo, USTEOM (RP1405D)1 hCPM2.5, CPM10
Automatic weather stationHuayun Sounding, ChinaDZZ55 minWind, T, P, RH
Table 2. Microphysical parameters and CPM2.5 of the six fog processes in Tianjin.
CaseDateDr/Drma (h)Nmax/Na (particles/cm3)Lmax/La (g/m3)Dmax (µm)Visma (m)Classification of FogCPM2.5max (μg/m3)CPM2.5min (μg/m3)
104~05 Nov 201610/8737/3630.332/0.10548107~60Dense210164
219~20 Dec 201619/10.51070/5960.145/0.04145100~30Strong dense375169
331 Dec 201610/3.5356/1720.046/0.01849120~70Dense346173
401 Jan 201711/7.5431/1410.183/0.03548200~80Dense188121
503 Jan 20174/0.5247/1020.020/0.01049400~370Dense230167
604 Jan 20177/2.5374/1420.031/0.01342480~240Dense207171
Table 3. Microphysical characteristics of dense fog processes, the main chemical composition of fog water and the concentrations of the main aerosols in several coastal and inland cities around the world.
Observation SiteNa (particles/cm3)La (g/m3)Dmax (µm)Average SpectrumMain Chemical Composition of Fog WaterConcentrations of AerosolsTime
Tianjin, China2530.03747JungeSulfate > particulate organic matter > elemental carbon > nitrate [45]CPM2.5max
188–375 μg/m3, CPM2.5min
121–173 μg/m3
2016 (This research)
Nanjing, China [27,28]3800.0447JungeNitrate > Sulfate166 ± 96 μg/m32007
Kanpur, India [40,41]400--JungeNitrate > Sulfate > Crustal elementsCPM1
199 μg/m3
2012
Baoding, China [23]350–5000.001–0.0150-SulfateNPM2.5
104 particles/cm3
2011
Yodogawa Basin, Japan [20,38]-0.112--Nitrate > Sulfate
Ca2+, Na+, Mg2+
-2005
Fairbanks, Alaska, USA [42,43]68-60Generalized gammaSulfur > Crustal compounds
Ca2+, Na+, K+
0.3 < D < 0.5µm
10 particles/cm3
2012
Zhanjiang Coast of Guangzhou, China [29,30,31]2310.11450Generalized gammaSulfate > Nitrate > Ammonium
Na+, Cl
CPM2.5
100–200 μg/m3
2011
West coast of Casablanca, Morocco [9]---Generalized gamma--2008
Nova Scotia, Canada [36,37]780.092-Generalized gammaSulfate> Nitrate > Organic matter
Na+, Cl
CPM2.5
10 μg/m3
1975