Article

Understanding the Predictability within Convection-Allowing Ensemble Forecasts in East China: Meteorological Sensitivity, Forecast Error Growth and Associated Precipitation Uncertainties Across Spatial Scales

1
Key Laboratory of Meteorological Disaster of Ministry of Education/Collaborative Innovation Center on Forecast and Evaluation of Meteorological Disasters, Nanjing University of Information Science & Technology, Nanjing 210044, China
2
Guangdong Provincial Key Laboratory of Regional Numerical Weather Prediction, Institute of Tropical and Marine Meteorology, China Meteorological Administration, Guangzhou 510640, China
*
Author to whom correspondence should be addressed.
Atmosphere 2020, 11(3), 234; https://doi.org/10.3390/atmos11030234
Submission received: 14 January 2020 / Revised: 21 February 2020 / Accepted: 26 February 2020 / Published: 28 February 2020
(This article belongs to the Section Meteorology)

Abstract

:
This study investigates the practical predictability of two simulated mesoscale convective systems (MCS1 and MCS2) within a state-of-the-art convection-allowing ensemble forecast system. The two MCSs are both controlled by the synoptic Meiyu-front but differ in mesoscale orographic forcing. An observation system simulation experiment (OSSE) setup is first built, which includes flow-dependent multiple-scale initial and lateral boundary perturbations and a 12 h 30-member ensemble forecast is thereby created. In combination with the difference total energy, the decorrelation scale and the ensemble sensitivity analysis, both forecast error evolution, precipitation uncertainties and meteorological sensitivity that describe the practical predictability are assessed. The results show large variabilities of precipitation forecasts among ensemble members, indicative of the practical predictability limit. The study of forecast error evolution shows that the error energy in the MCS1 region in which the convection is blocked by the Dabie Mountains exhibits a simultaneous peak pattern for all spatial scales at around 6 h due to strong moist convection. On the other hand, when large-scale flow plays a more important role, the forecast error energy in the MCS2 region exhibits a stepwise increase with increasing spatial scale. As a result of error energy growth, the precipitation uncertainties evolve from small scales and gradually transfer to larger scales, implying a strong relationship between error growth and precipitation across spatial scales, thus explaining the great precipitation variability within ensemble members. These results suggest the additional forcing brought by the Dabie Mountains could regulate the predictability of Meiyu-frontal convection, which calls for a targeted perturbation design in convection-allowing ensemble forecast systems with respect to different forcing mechanisms.

1. Introduction

Forecasting warm-season convective events is a consistent important and challenging issue during the most recent decades over the Yangtze and Huai River Basin (YHRB) [1,2]. In this area, in addition to the synoptic quasi-stationary Meiyu-front which provides large-scale ascent [3], the initiation and development of convective systems are also strongly influenced by steady surface features such as complex terrain (e.g., the Dabie Mountains, Huang mountain, and Mufu mountain) through mountain-flow interaction [4,5]. Accurate prediction of time, location and intensity of extreme convective events along the Meiyu-front remains a big challenge [6,7].
Though previous studies had demonstrated the advantages of convection-allowing numerical weather prediction (NWP) models than coarser-resolution NWP in predicting convective precipitation and thunderstorms [8], the chaotic and multiscale nature of atmosphere imposes finite limits to the forecast skill of NWP and this limitation increases with decreasing spatial scales [9,10]. An approach to tackle this issue is the ensemble prediction system, which can be used to measure forecast uncertainties [11] and produce probabilistic forecasts [12]. However, the optimal design and application of convection-allowing ensembles remain largely unknown [13,14].
To understand and further construct an optimal convection-allowing ensemble prediction system, the evolution of forecast errors originated from the initial condition, lateral boundary condition or modeling procedures that are within the scope of practical predictability (defined as the ability to predict based on the procedures currently available [15]) should be first considered. Generally, the forecast error could be quantitatively represented by the difference total energy (DTE) computed from ensemble outputs [16,17,18]. Nielsen and Schumacher [19] further developed a revised form of DTE to account for the forecast error through the whole troposphere. Additionally, since the atmosphere is chaotic and multiscale in nature, the error transfer between different scales will lead to serious predictability limits [20]. Thus, the scale-dependent forecast error growth is also of great need to evaluate. Lorenz [21] examined predictability limits and error growth dynamics at different scales using a simple model and revealed the scale interaction of errors through nonlinear interactions of vortical horizontal structures. Judt et al. [10] extended the DTE into a scale-dependent manner and explored the scale-dependent predictability limit of a tropical cyclone event. Following the error growth conceptual model suggested by Zhang et al. [16], Sun and Zhang [22] revealed that the upscale growth process of small-scale DTE could control both practical and intrinsic predictability limit of convection within idealized convection-allowing simulations of a baroclinic wave.
The evolution of error energy leads to corresponding changes in diagnostic variables [23]. It’s, therefore, necessary to investigate the forecast uncertainties of such convective variables such as precipitation and identify their relationship with error energy growth. Nielsen and Schumacher [19] identified the need to investigate the relationship between error energy and precipitation uncertainties, but no direct relationship is found using the precipitation area spread metric [24]. Dey et al. [25,26] proposed a Fractions-Skill-Score-based method to calculate an ensemble agreement scale to measure the spatial predictability of precipitation. A similar spectrum method, the decorrelation scale was further suggested by Surcel et al. [27,28] and was used to investigate the precipitation predictability across spatial scales. These metrics provide quantitative ways to understand the relationship between error energy and precipitation uncertainties.
During the Meiyu-season over the YHRB, numerous mesoscale convective systems (MCS) could develop and propagate eastward along the Meiyu-front and producing large amounts of precipitation [29]. However, the presence of the Dabie Mountains, which is generally located over the low-level southwest flow, could block the eastward motion of precipitation system [6,29,30,31,32,33,34]. The interaction between the boundary layer low-level jet and the Dabie Mountains (mountain-flow interaction) was reported to have pronounced impacts on the frontal precipitation [29] and potentially regulate the predictability [35,36,37,38] of Meiyu frontal precipitation. Therefore, it’s necessary to investigate the differences between typical frontal precipitation and these influenced by terrain along the Meiyu-front. In more recent research, Zhuang et al. [12] systematically explored and compared the spatial predictability under different convective regimes (strongly- and weakly-forced regimes) over YHRB using convection-allowing ensembles produced by an observation system simulation experiment (OSSE) framework. However, they did not consider the specific condition when synoptic frontal and orographic forcing simultaneously exist.
In the present work, using the same model setup as Zhuang et al. [12], we focus on the predictability of convection dominated by the Meiyu-front. With an idealized setup for a state-of-the-art convection-allowing ensemble data assimilation and forecasting system covering the YHRB regions (Figure 1a), a specific “real simulated” case with two pre-existing MCSs along the Meiyu-front is chosen (Figure 1b), one of which (MCS1) starts upstream of the Dabie Mountains and is influenced by the mountain-flow interaction (an example of how Dabie Mountains regulate the low-level flow is shown in Figure 1c), while the other one (MCS2) locates over the downstream place of the Dabie Mountains. Since both of the two MCSs are governed by the large-scale Meiyu-front, we assume if the presence of Dabie Mountains could substantially impact the practical predictability of synoptic frontal forced precipitation, thus lead to different error growth dynamics and produces different precipitation uncertainties. To this end, three main questions are addressed: 1) what is the precipitation forecast sensitivity with respect to thermodynamic states at initial/previous times of a typical frontal precipitation system and that influenced by the Dabie Mountains; 2) considering multiple-scale errors induced from initial and lateral boundary condition, what is the evolution characteristics of forecast error? 3) how the forecast error growth influences the distribution of precipitation uncertainties across spatial scales and causing large precipitation variability within ensemble forecasts? The consideration of these issues provides insight into the forecast performance within convection-allowing ensemble forecasts system and potentially aids the optimal design for it especially when facing different types of convective events.
The outline of the article is as follows. The model and ensemble design are illustrated in Section 2, along with the details of diagnostic approaches. Section 3 gives the results including case overview, ensemble performance, sensitive analysis, error growth, and associated precipitation uncertainty analysis. Section 4 provides the summary and discussion.

2. Data and Methods

2.1. Model Configureuration

Following Zhuang et al. [12], the Advanced Research core of the Weather Research and Forecasting (WRF) Model version 3.7.1 [39] is used with an inner convection-allowing domain of 258 × 258 horizontal grid points at 3 km grid spacing, nested within an outer parameterizing domain of 180 × 180 grid points at 18 km grid spacing, and 41 terrain-following hydrostatic-pressure vertical levels are applied in all domains. The outer domain covers East China, while the inner domain targets the YHRB area, including Anhui and Jiangsu provinces and surrounding areas (Figure 1a).
The initial conditions (IC) and lateral boundary conditions (LBC) are derived from the U.S. National Center for Environmental Protection Global Forecast System (GFS) (0.5°) analysis data. The physical parameterization schemes include the WSM6 microphysics [40], Grell-3 cumulus [41] (which is only applied to the outer domain), YSU boundary layer [42], RRTM longwave radiation [43], and Goddard shortwave radiation schemes [44]. The inner domain is used as the analysis domain. These schemes were chosen for their good implements over the YHRB region [45,46].

2.2. Ensemble Generation

To generate IC and LBC perturbations in a flow-dependent manner [47], a modified version of ensemble data assimilation and forecast system is constructed based on Wang et al. [48]. The data assimilation method is based on the Ensemble Square Root Filter approach proposed by [49]. For an OSSE, a true state is first created from a 36 h nature run initialized from the GFS analysis 24 h before the analysis time for each case with a 3–km resolution over the outer domain (TRUE). Thereafter, the mesoscale sounding datasets for the outer domain are created at randomly chosen locations within China’s mainland and interpolated from TRUE with observation errors of 2.5 m/s, 1.2 K, and 0.005 kg/kg for wind velocity, temperature, and water vapor, respectively [50]. For the inner domain, TRUE is interpolated to seven real CINRAD-SA radars (see Figure 1 in Zhuang et al. [12]), a Chinese version of Weather Surveillance Radar-1988 Doppler (WSR-88D) [51], with observation errors of 2 m/s and 5 dBZ for radial velocity and reflectivity [47].
For the outer domain, the initial ensemble is initialized by adding analysis perturbations to U, V, T, Qv in IC and LBC with a supersaturation correction for Qv. The perturbations are acquired from the first 30–member European Centre for Medium-Range Weather Forecasts global ensemble prediction products (0.5°, https://apps.ecmwf.int/datasets/) that well represent the synoptic-scale uncertainty. For the present case study, a 3 h spin-up ensemble is start at 12:00 UTC (2000 LST) 6 July 2013, along with the data assimilation of conventional observation datasets in the outer domain every 3 h over a 24 h period. The analysis perturbations at the seventh cycle are downscaled to the inner domain using the WRF ndown tool [52]. For the inner domain, the radar datasets (including reflectivity and radial velocity) are assimilated for 3 h with a 10 min interval, while the outer domain provides larger-scale LBC perturbations every 15 min during the assimilation process. Details of the data assimilation parameters applied can be found in Zhuang et al. [12]. Thereafter, a 30-member 12 h ensemble forecast from 12:00 UTC 6 July 2013 to 20:00 UTC 7 July 2013 is performed with perturbed IC and LBC (CTRL).

2.3. Ensemble Sensitivity Analysis

The ensemble sensitivity analysis (ESA) proposed by Ancell and Hakim [53] is an efficient tool for estimating the meteorological forecast sensitivity to the thermodynamics variables in earlier times. Recently, studies have demonstrated that ESA could be used in convection-allowing ensemble forecast systems to estimate the sensitivity of non-gaussian distribution convective metrics such as precipitation and composite reflectivity to earlier thermodynamics variables [54,55]. In the present study, we use ESA to explore the meteorological sensitivity of Meiyu-frontal precipitation to the thermodynamic conditions at earlier forecast lead times. Details of information about ESA can be seen in Hill et al. [55].

2.4. Measurement of Forecast Error

Following Nielsen and Schumacher [19], the forecast error is quantified using a modified version of DTE. In addition to the typical DTE, a vertical function is applied to calculate the two–dimensional root mean vertically integrated DTE (RMDTE):
RMDTE i , j , t = 1 n m e m b e r s m = 1 n m e m b e r s k = 1 n l e v e l s p ( k + 1 ) p ( k ) p ( 0 ) 1 2 [ ( u i , j , k , t , m ) 2 + ( v i , j , k , t , m ) 2 + C p T r ( t i , j , k , t , m ) 2 ]
where u , v , and t are the differences of zonal wind, meridional wind, and temperature subtracted the ensemble mean from each ensemble member, respectively ( C p = 1004.9   JKg 1 K 1 and T r = 270   K ). The subscripts i, j, k, t, and m represent the x-direction, y-direction, vertical level, forecast time, and ensemble member. To further investigate the scale-dependent error energy characteristics, we decompose RMDTE into three scale ranges: the small-scale (36 km ≥ wavelength), the transition-scale (120 km ≥ wavelength > 36 km), and the larger-scale (wavelength > 120 km). The small-scale represents the flow-dependent initial errors at the convective scale and can only be resolved in the inner domain; the transition-scale encompasses the smallest scale that can be resolved by the outer domain. To obtain variable fields at different scales, the discrete cosine transform (DCT) [27] method is used. DCT is similar to the fast Fourier transform and can avoid discontinuity problems at domain boundaries. The RMDTE at different scale ranges can be acquired in two steps: 1) decomposing u , v , and t into different scale ranges u ( λ ) , v ( λ ) , and t ( λ ) ; 2) computing RMDTE ( λ ) using Equation (1).

2.5. Measurement of Precipitation Uncertainties

A novelty of this work is the detailed investigation of scale-dependent characteristics between error energy growth and associated precipitation uncertainties. Surcel et al. [27] suggested a quantitative method to evaluate the scale-dependent features of precipitation uncertainties, namely, the decorrelation scale (λ0), which allows for displacements in the forecasts. In this method, for the scale λ ≤ λ0, there is no predictability of precipitation forecasts from ensemble members. For the scale λ ≥ λ0, the ensemble members are correlated, indicative of some predictability. The power ratio in terms of decorrelation scale is defined as:
R ( λ ) = m = 1 n V a r ( p m ( λ ) ) V a r ( m = 1 n p m ( λ ) )
where V a r ( p m ( λ ) ) refers to the variance of the precipitation field p m ( m = 1 , , n ) at scale λ, R ( λ ) is the uncertainty value varying from 1/n to one, where a larger R ( λ ) corresponds to higher uncertainty and lower precipitation forecast predictability at scale λ. Theoretically, a threshold value of R ( λ ) = 1 at a given scale means the complete loss of predictability. In this study, the threshold is 0.9 to eliminate noise without introducing any significant bias [10,23,35,36].

3. Results

This section presents results on the practical predictability within convection-allowing ensembles of two MCSs along the same Meiyu-front over YHRB. We first introduce the general features of the events and analyze the ensemble performance. In a step forward, we present the scale-dependent forecast error growth and explore how error energy evolution could impact the diagnostic precipitation variable, which could explain the precipitation variability within ensemble forecasts. Finally, the forecast sensitivities for the two convective systems are analyzed and compared using subjective analysis in combination with the ESA method.

3.1. Case Overview and Ensemble Performance

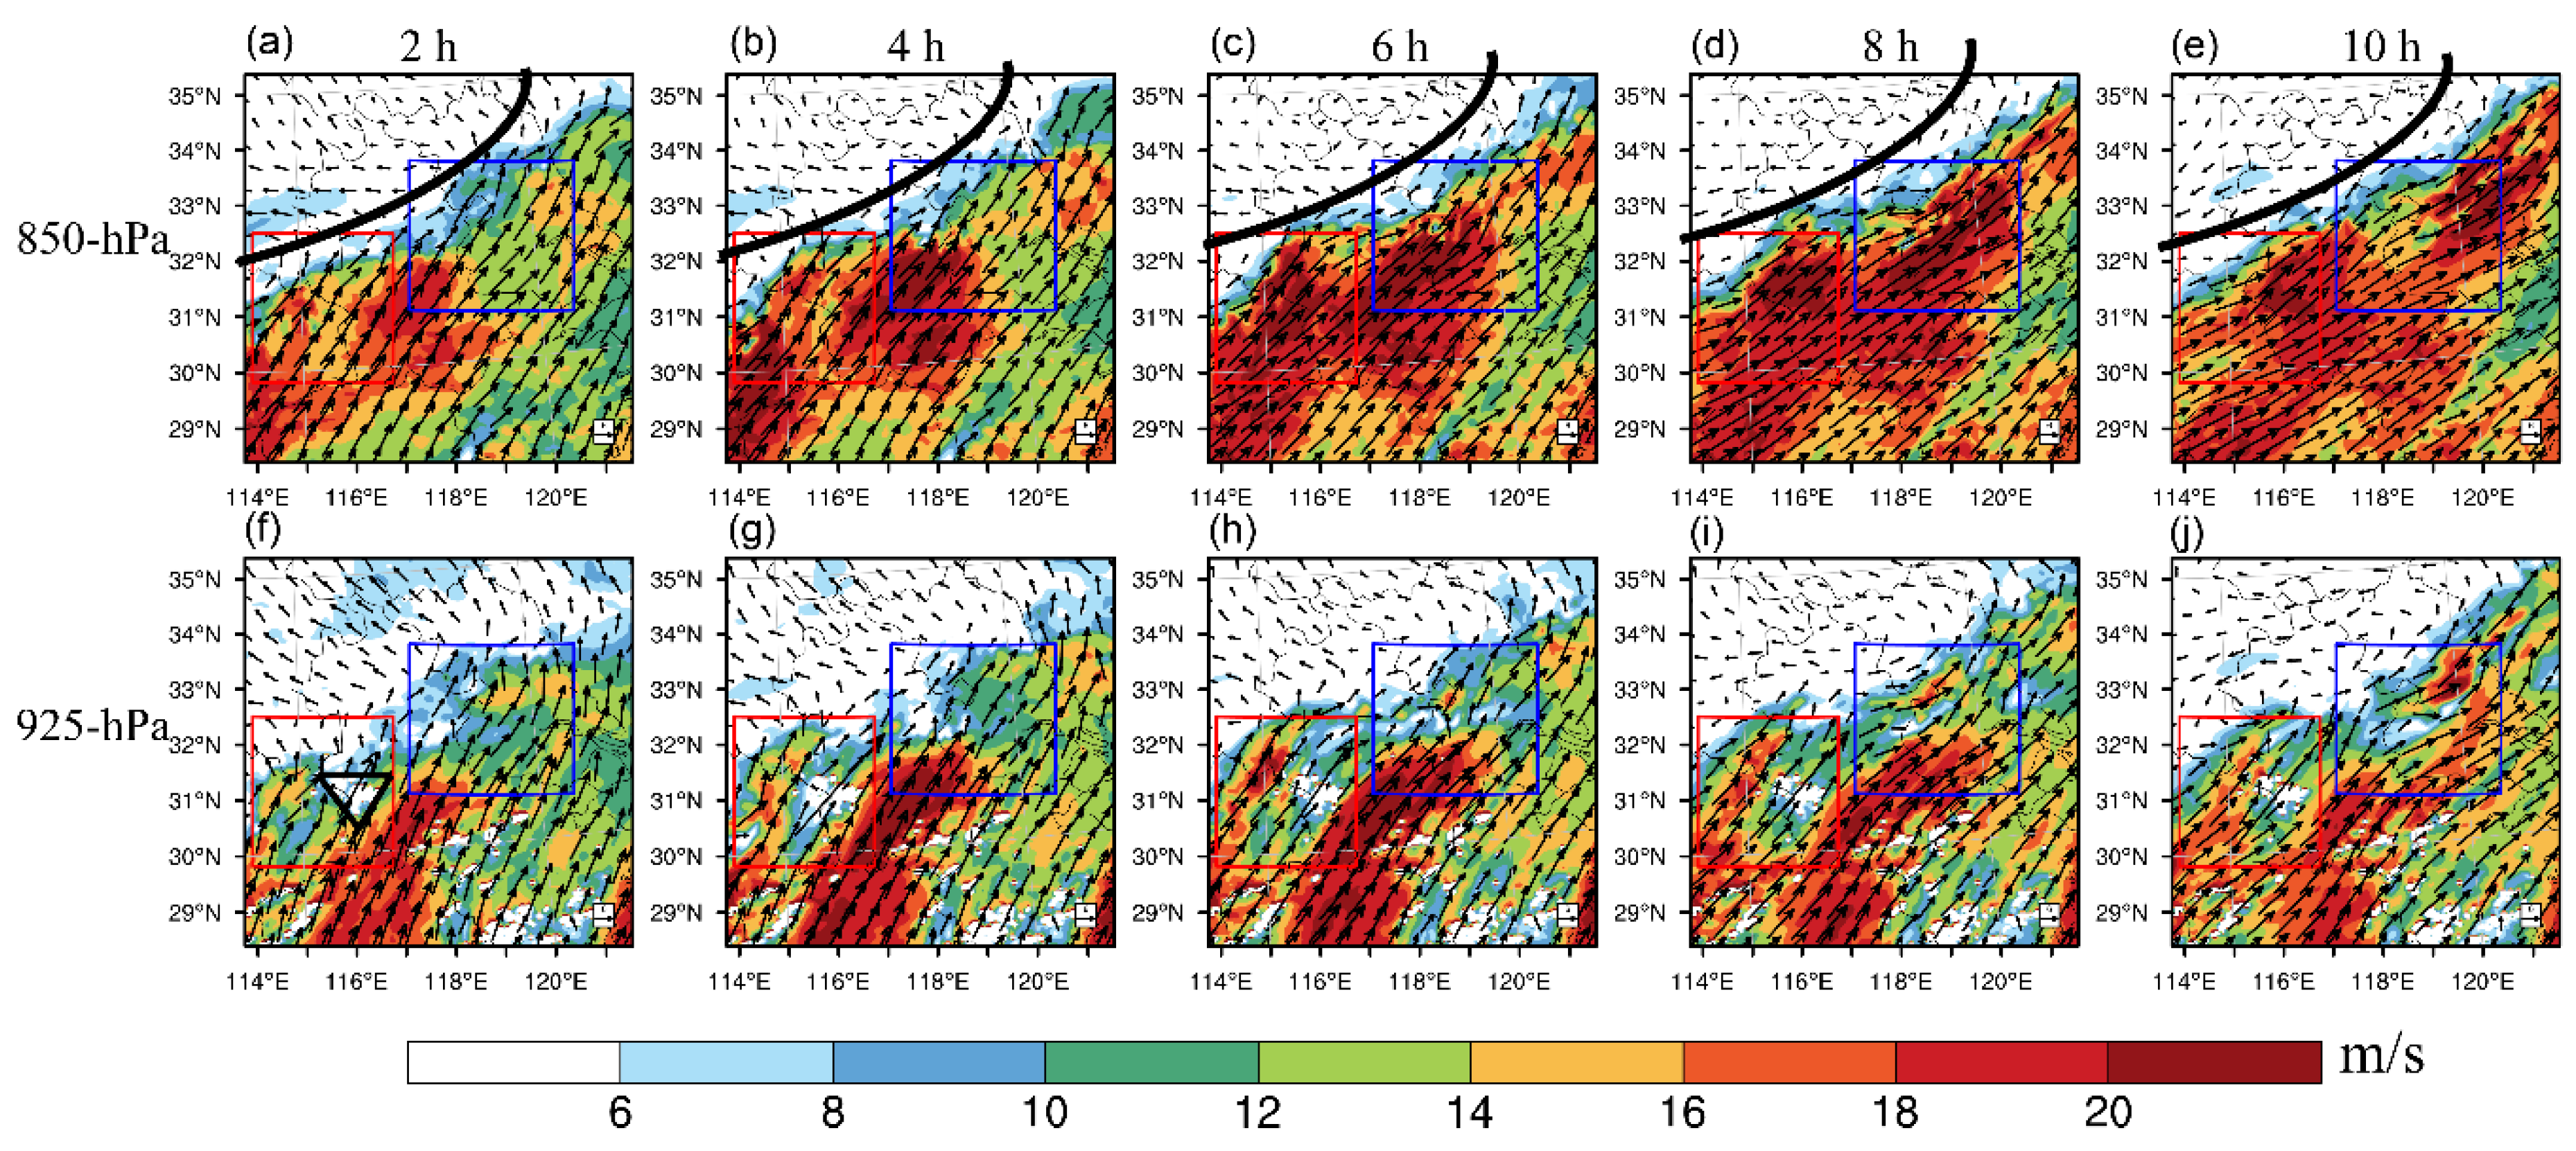
As frontal forced convections, the synoptic conditions combined to produce ingredients conducive to the formation and development of the convective events. During the study period, there is a southwest-northeast-oriented quasi-stationary synoptic cold front (indicated by the 850 hPa wind shear line in Figure 2) dominating convections in the analysis domain which is known as the Meiyu-front. A strong southwest low-level (850 hPa ≈1500 m height) jet is evident over southern Anhui, advecting moisture northward toward the frontal areas. During the mid-night (Figure 2b–d,g–i), the low-level jet gradually strengthens and sustains the development of convections (Figure 3(a1–a3). Therefore, the synoptic and subsynoptic forcing benefit the convections we focus on. Besides, for the Dabie Mountains region (red boxes), the 925 hPa boundary layer low-level (925 hPa ≈ 700 m height) jet [56] (Figure 2f–j) could interact with the Dabie Mountains [6] and impact the precipitation upstream the mountain region.
Different stages of the convective life cycle of TRUE are thereby displayed in Figure 3(a1–e1). At 14:00 UTC (corresponding to 2 h lead time, Figure 3(a1)), two main precipitation regions with centers exceeding 30 mm/h along the Meiyu-front are present, namely, the MCS1 region and MCS2 region. MCS1 locates near the western upwind side of the Dabie Mountains, while MCS2 locates downstream of the Dabie Mountains and near the border between Anhui and Jiangsu provinces. During the later hours (Figure 3(b1–e1)), MCS1 keeps a quasi-stationary feature upstream of the mountain due to the dynamical barrier effect from orographic forcing and gradually weakens at around 20:00 UTC (8 h) (Figure 3(d1)), while MCS2 keeps moving and developing eastward into central Jiangsu along the frontal zone. The time series of precipitation for TRUE are shown in Figure 4, it is clear that the area-averaged values for the MCS2 region have a more evident semidiurnal cycle than that for the MCS1 region. As a short summary, the two MCSs have similar large-scale but different mesoscale forcing mechanisms, leading to different precipitation distribution and semidiurnal features.
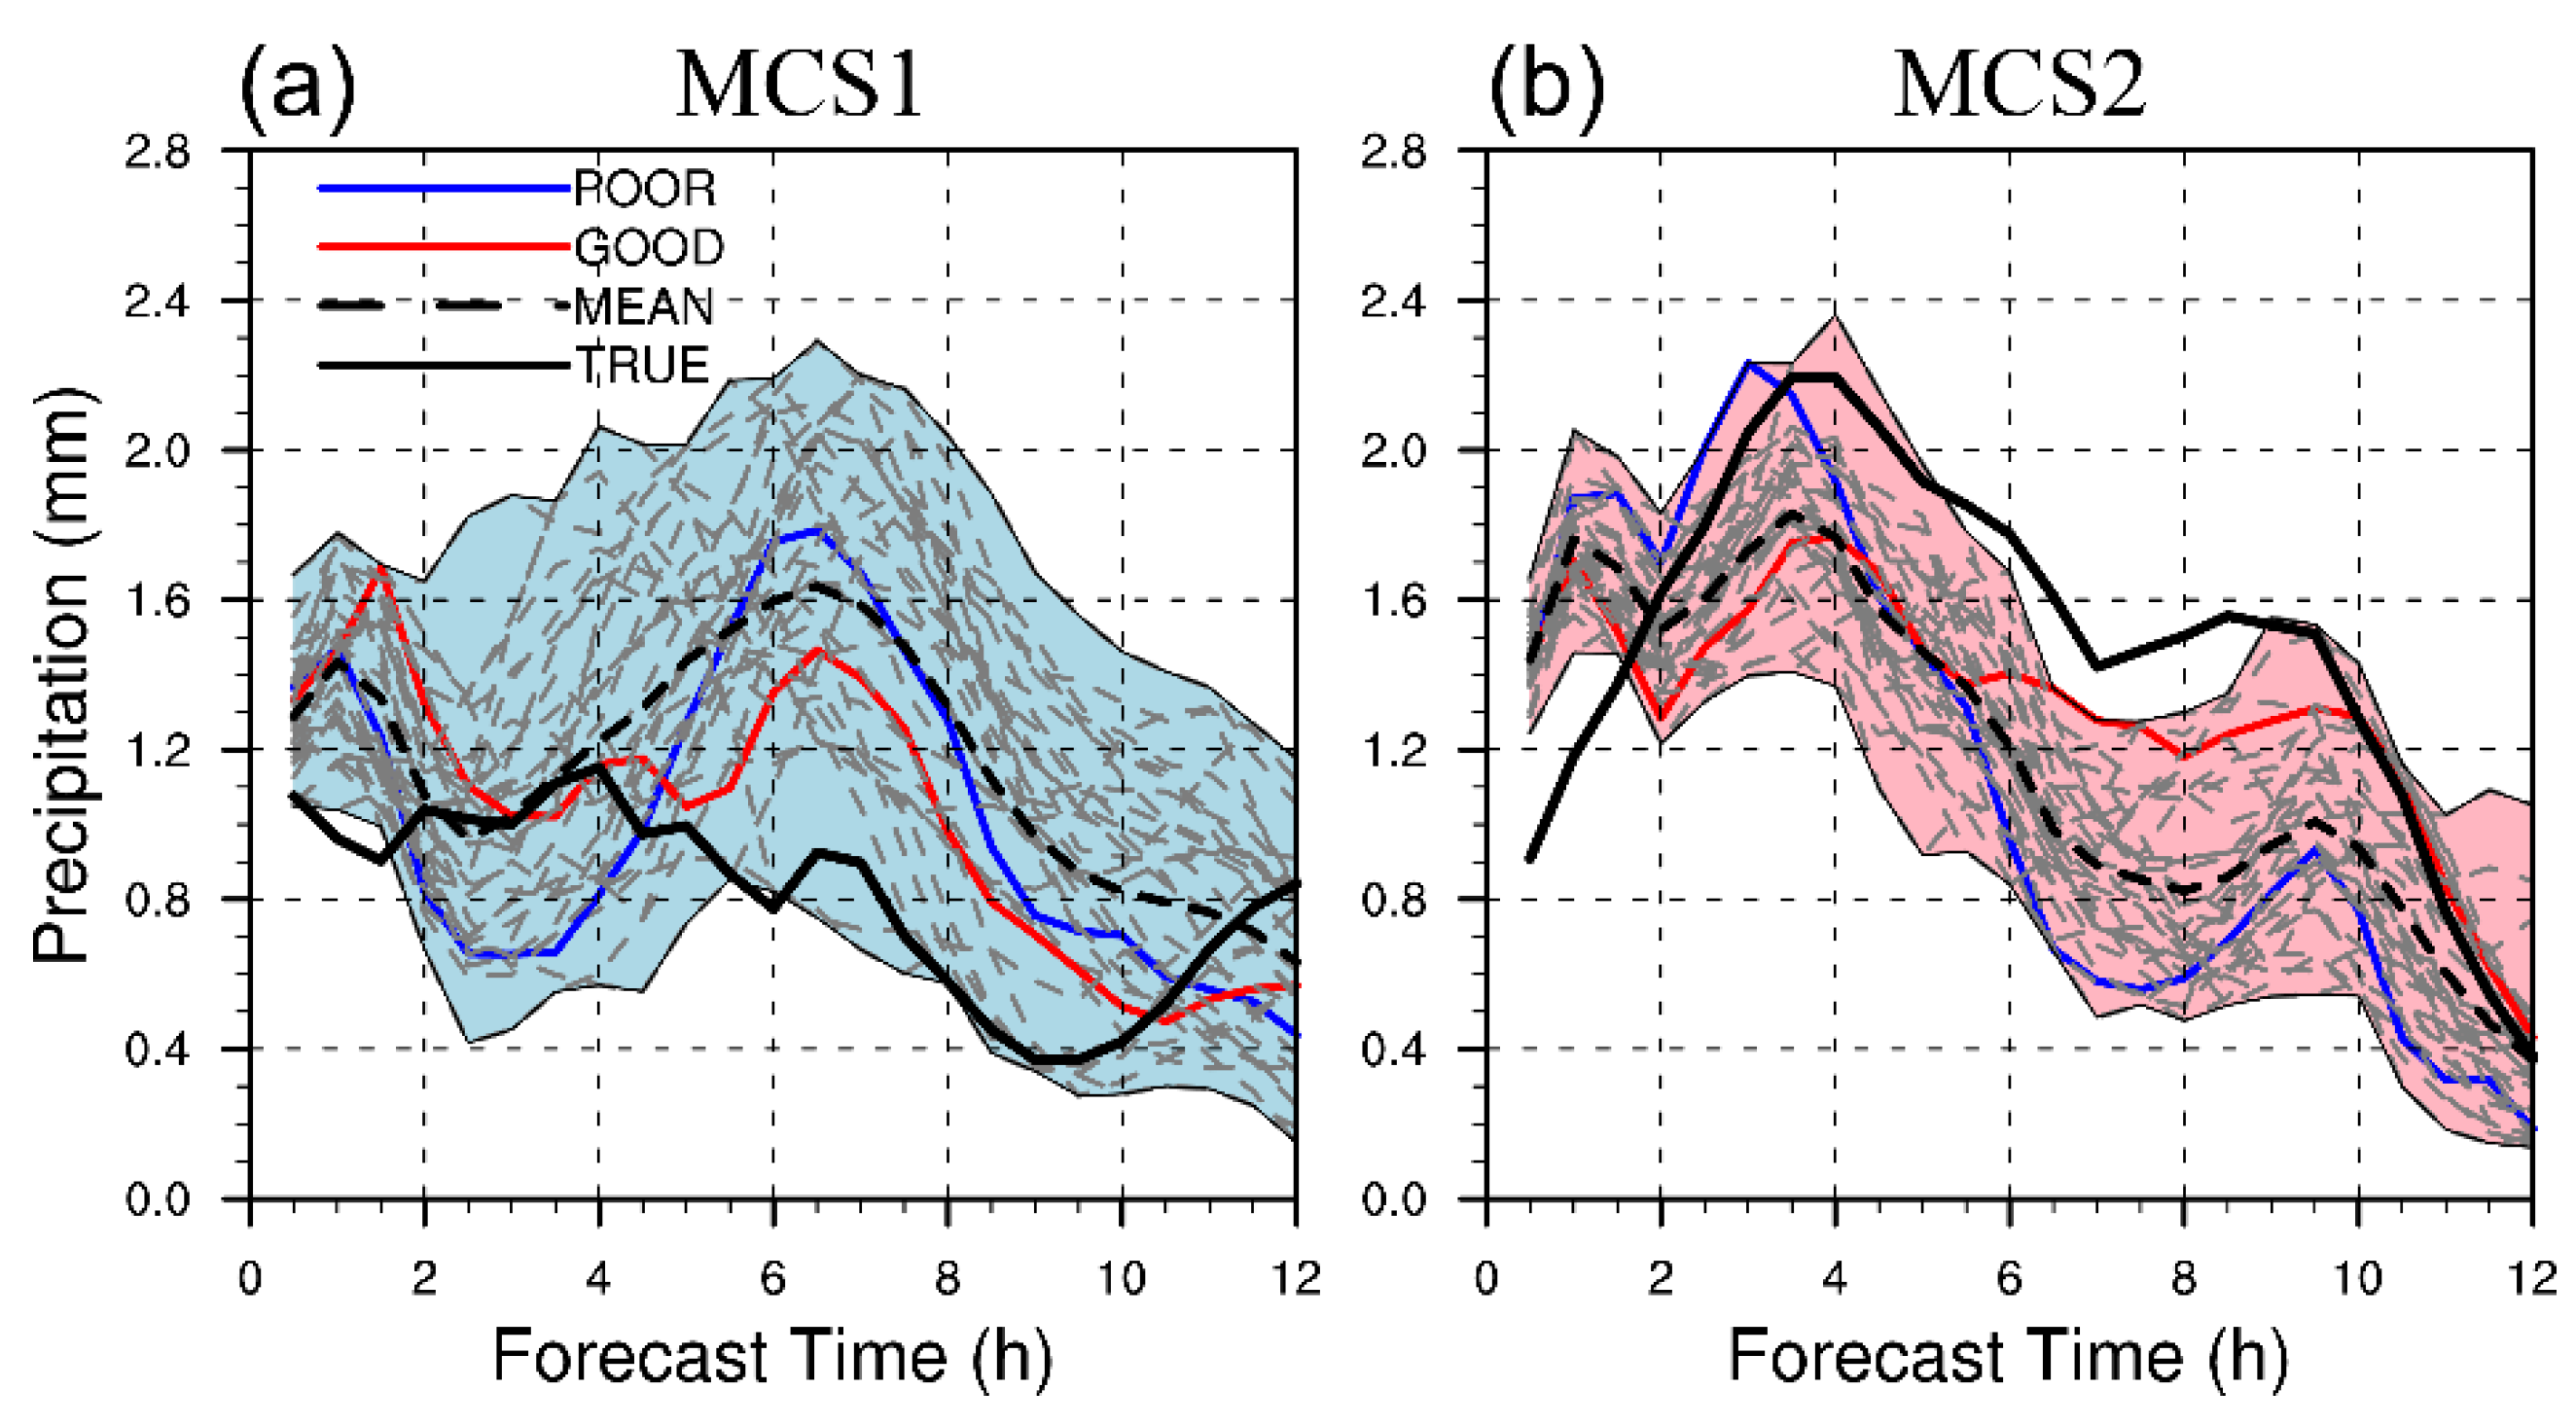
The 30-member convection-allowing ensemble forecasts (CTRL) show a great divergence of precipitation within ensemble members (Figure 4), indicative of the practical predictability limit [23,57] induced by errors originated from initial and lateral boundary conditions. Most of the members in CTRL produce rainfall of similar magnitudes to those in TRUE but have errors in location and organizational structure to different degrees (Not shown). Figure 4 shows the time evolution of area-averaged 30 min accumulated precipitation for CTRL, MEAN (the ensemble mean forecast) and TRUE. Most members reflect the semidiurnal feature of both MCS1 and MCS2. Specifically, almost all members generate a wet bias between 17:00–21:00 UTC (5–9 h) for the MCS1 region and a dry bias during 17:00–22:00 UTC (5–10 h) for the MCS2 region, highlighting a challenge for optimal ensemble design over YHRB region, especially for events controlled by different forcing mechanisms. Besides, the variability within CTRL is evident and the large values are generally corresponding to the peak pattern of precipitation (e.g., 4 h for the MCS1 region and 9 h for the MCS2 region), which potentially implies the importance of moist convection on predictability.

3.2. Spatiotemporal Characteristics of Scale-Dependent Forecast Error Growth

In a convection-allowing NWP, the IC errors could nonlinearly grow at small scales within precipitation regions and break the predictability afterward, which leads to the large precipitation variability within CTRL (Figure 4). In this subsection, we tend to understand the error growth dynamics through the scale-dependent analysis of spatiotemporal characteristics of forecast error energy evolution.
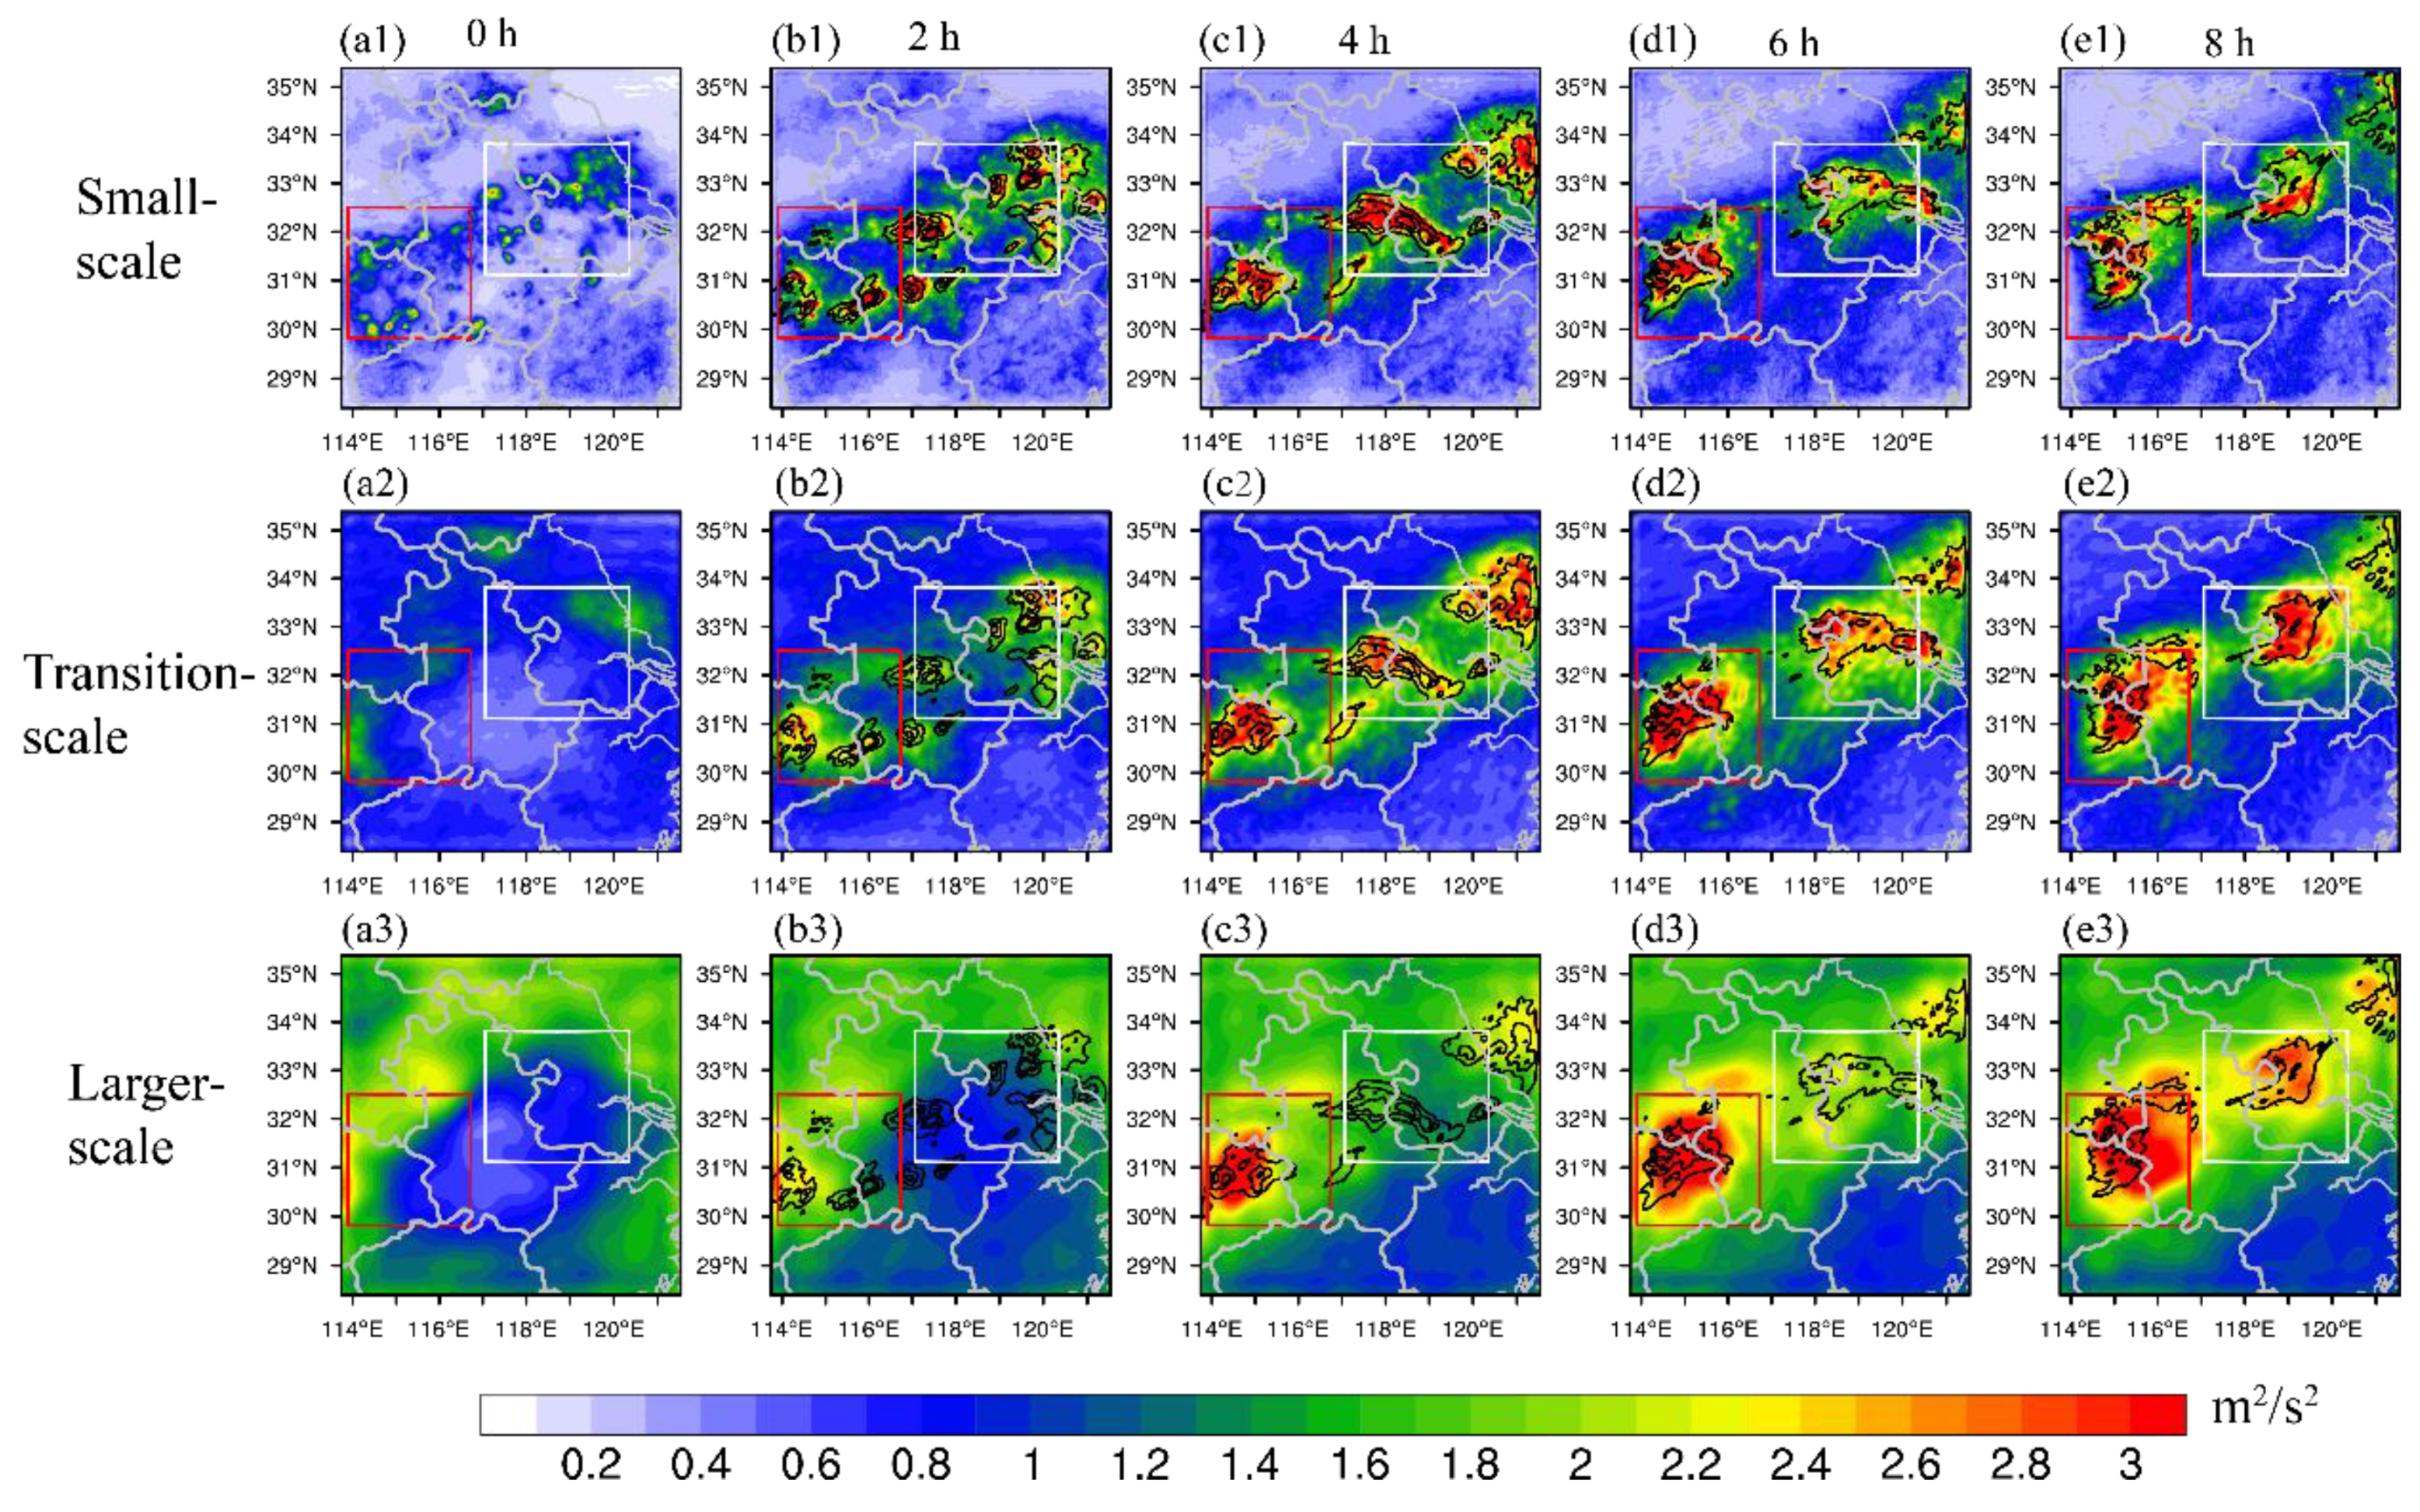
Figure 5 shows the distribution of RMDTE at different valid times across different spatial scales. As flow-dependent perturbations derived from a multiscale ensemble data assimilation and forecasting system, the initial small-scale RMDTE clearly corresponds to the precipitation areas south of the Meiyu-front (Figure 5(a1–a3)). During the next few hours, the small-scale RMDTE increases in magnitude, spreads out and keeps following the convection regions along the Meiyu-front zone. For the transition-scale (Figure 5(b1–b3)), the initial RMDTE exhibits a different pattern compared with that in the small-scale but still partly corresponds to the precipitation region. After 2 h (the second column in Figure 5(b1–b3)), the transition-scale RMDTE gradually evolves into a similar pattern as the small-scale RMDTE, albeit with a broader area, illustrating an upscale transfer of error [16,58]. For the larger-scale, the initial pattern of RMDTE (Figure 5(a3)) generally follows the synoptic shear line (Figure 1b), depicting flow-dependent uncertainties at larger scales. Similar to the transition-scale, we also find the larger-scale RMDTE gradually evolves into the precipitation zone, but with a slower speed. This feature further confirms the upscale transfer of errors is clear in this study.
Additionally, a comparison between the two MCS regions shows the RMDTEs at small- and transition-scale increase simultaneously, which is due to error growth caused by moist convection. However, for the larger-scale, the increase of error magnitude is faster in the MCS1 region (Figure 5(d3)) than that in the MCS2 region. It’s speculated this is due to the larger-scale LBC errors imposed from the western boundary which directly promotes the forecast error through regulating the westerly flow at the larger-scale and impact the practical predictability afterward. This result indirectly suggests the importance of LBC perturbations for the design of convection-allowing ensembles.
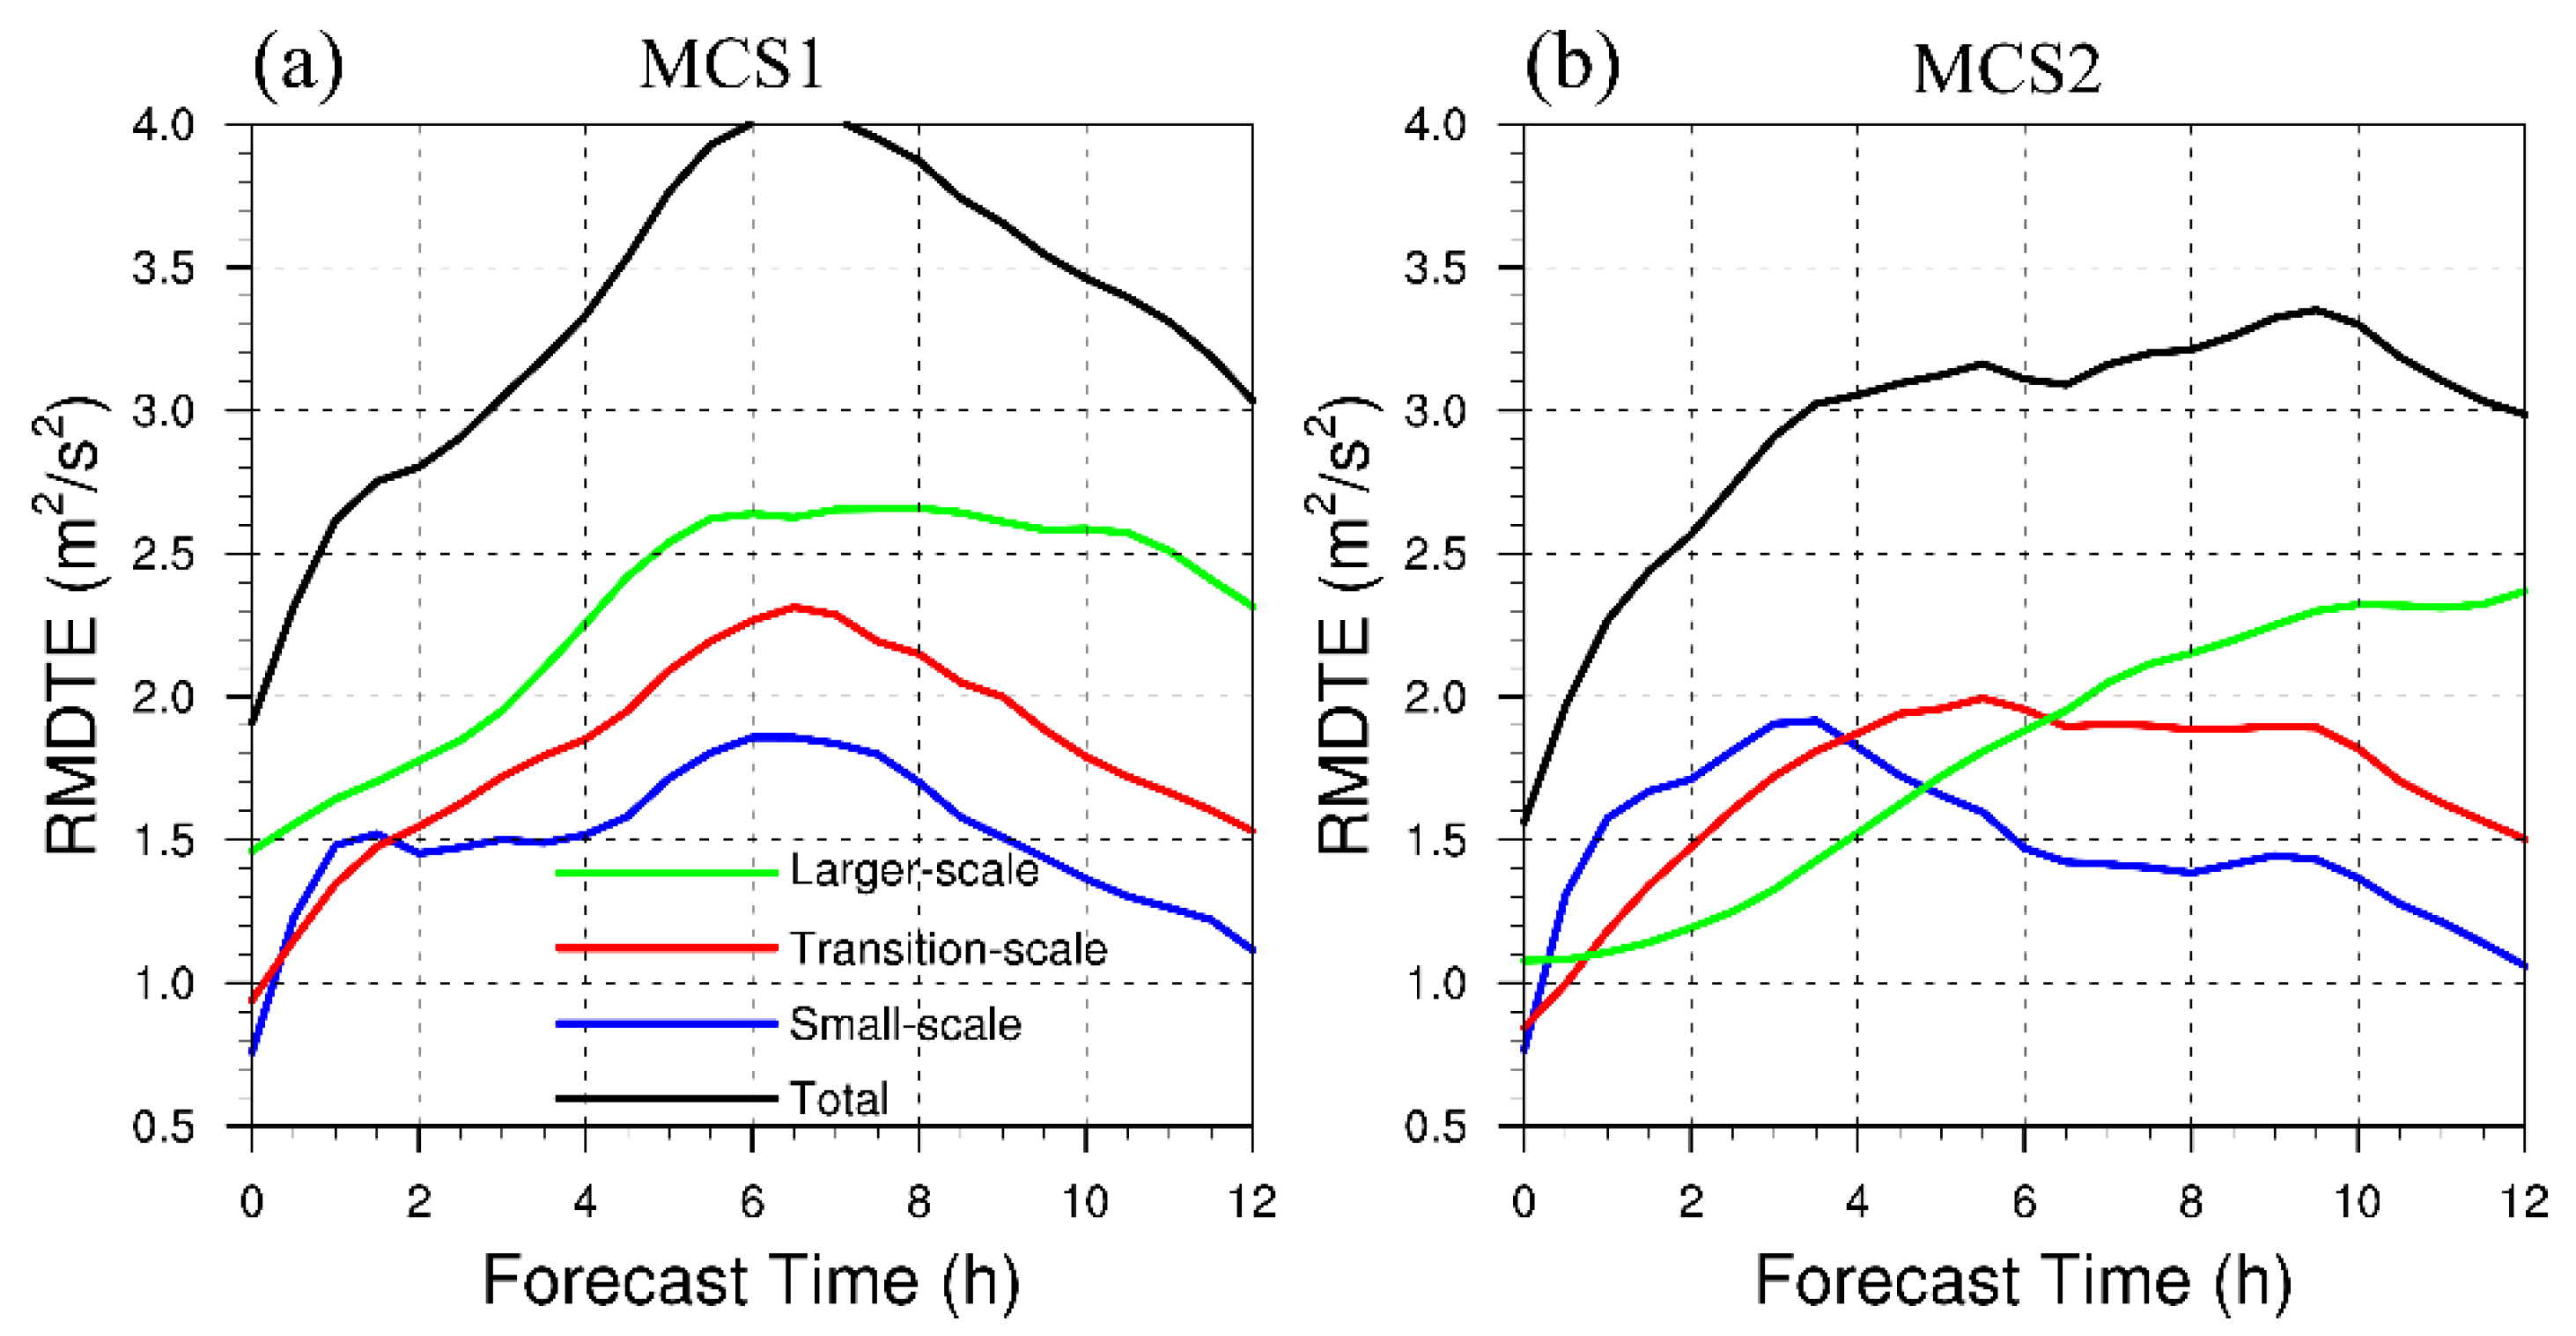
To further illustrate the error evolution characteristics for the two MCSs regions, we next perform a time series analysis of RMDTE (Figure 6). In the MCS1 region, the total RMDTE (black curve in Figure 6a) generally shows two peaks at around 1 and 7 h, while for the MCS2 region the total RMDTE (black curve in Figure 6b) exhibits a moderate trend after the rapid increase before 4 h. The difference of error energy growth between the two MCS regions suggests different predictability for these two events and thereby imply the complexity for forecasting Meiyu-front forced convective events.
We further decompose the total RMDTE into different scale ranges. The time evolution of RMDTE at different scales clearly shows the upscale transfer processes for both MCS regions. In general, the small-scale RMDTE could rapidly increase and reaches a saturation (1 h for the MCS1 region and 3 h for the MCS2 region) (blue curves in Figure 6) under the influence of moist instability and latent heat release [16,17,18,59,60,61,62], followed with lagging increase and saturation of errors at the transition- and larger-scale, respectively. This result implies that the three-stage error growth conceptual model [16,58] is generally applicable for convective events controlled by Meiyu-front.
Though followed with a similar error growth model, it is important to notice that the scale-dependent evolution trends are also different between the MCS1 and MCS2 regions. The difference can be linked to the meteorological nature (forcing mechanisms) of the two MCSs. Specifically, for the MCS2 region in which the convective system is controlled by large-scale flow and moving eastward along the frontal zone, the evolution of scale-dependent errors strictly follows the stepwise three-stage error growth mode (Figure 6b) (i.e., the errors increasingly transfer into larger scales at lagging times): first, the small-scale errors rapidly increase and reach saturation at around 3 h, after that, the transition-scale errors keep another two-hour increasing and saturate at 5.5 h, while for the larger-scale, the errors could keep a steadier increasing throughout the 12 h range. This growth mode can be explained by the displacement of individual cells driven by large-scale forced ascent [16,63,64] around the Meiyu-front. Inconsistent with MCS2, in the MCS1 region, the small-scale RMDTE performs a secondary increase within 4–6 h after the first saturation at 1 h (Figure 6a). Concurrently, the RMDTEs at transition- and larger-scale practically exhibit a simultaneously mark-up during 4–7 h which is consistent with the pronounced strengthening of precipitation (Figure 4a). According to previous work, Nielsen and Schumacher [19] proposed a theoretical assumption that the trend of error growth can be generally controlled by the large-scale flow or quasi-stationary convection diurnal cycle, while the magnitude (peak or other big fluctuations) can be modified by strong moist convection. We think this theory can be slightly extended to explain the scale-dependent error growth for the MCSs regions in this study. In other words, if the large-scale flow is more important, the error growth mode in the MCS2 region is common. For the MCS1 region in which the convection is strongly restricted by the Dabie Mountains, the forecast errors at small scales are able to grow consistently under the control of moist convection, impact larger scales via upscale transfer, and muddle the stepwise growth trend (Figure 6b). Hohenegger et al. [59] also suggested a theory if the errors could propagate against the mean flow in the unstable area, the errors may reach a sufficient amplitude and seriously disrupt predictability, which corroborates the explanation for the MCS1 region.
In conclusion, though under similar large-scale forcing mechanisms (Meiyu-front and southwest low-level jet), the additional mesoscale orographic forcing exerted by the Dabie Mountains could largely influence the atmospheric predictability of frontal precipitation. This explains the recently found challenge of convection-allowing NWP in forecasting convective events adjunct to the Dabie Mountain during Meiyu seasons [65], especially for that near the LBC of the model domain.

3.3. Relationship between Error Energy Growth and Precipitation Forecasts

A novelty of this study is to build a quantitatively and scale-dependent relationship between error energy growth and associated precipitation forecasts. Since the evolution of forecast error energy is clearly linked to the precipitation forcing mechanisms and varies between the two MCS regions, we further inspect the corresponding characteristics of precipitation uncertainties, which directly relate to the precipitation variability found in Section 3.1 (Figure 4).
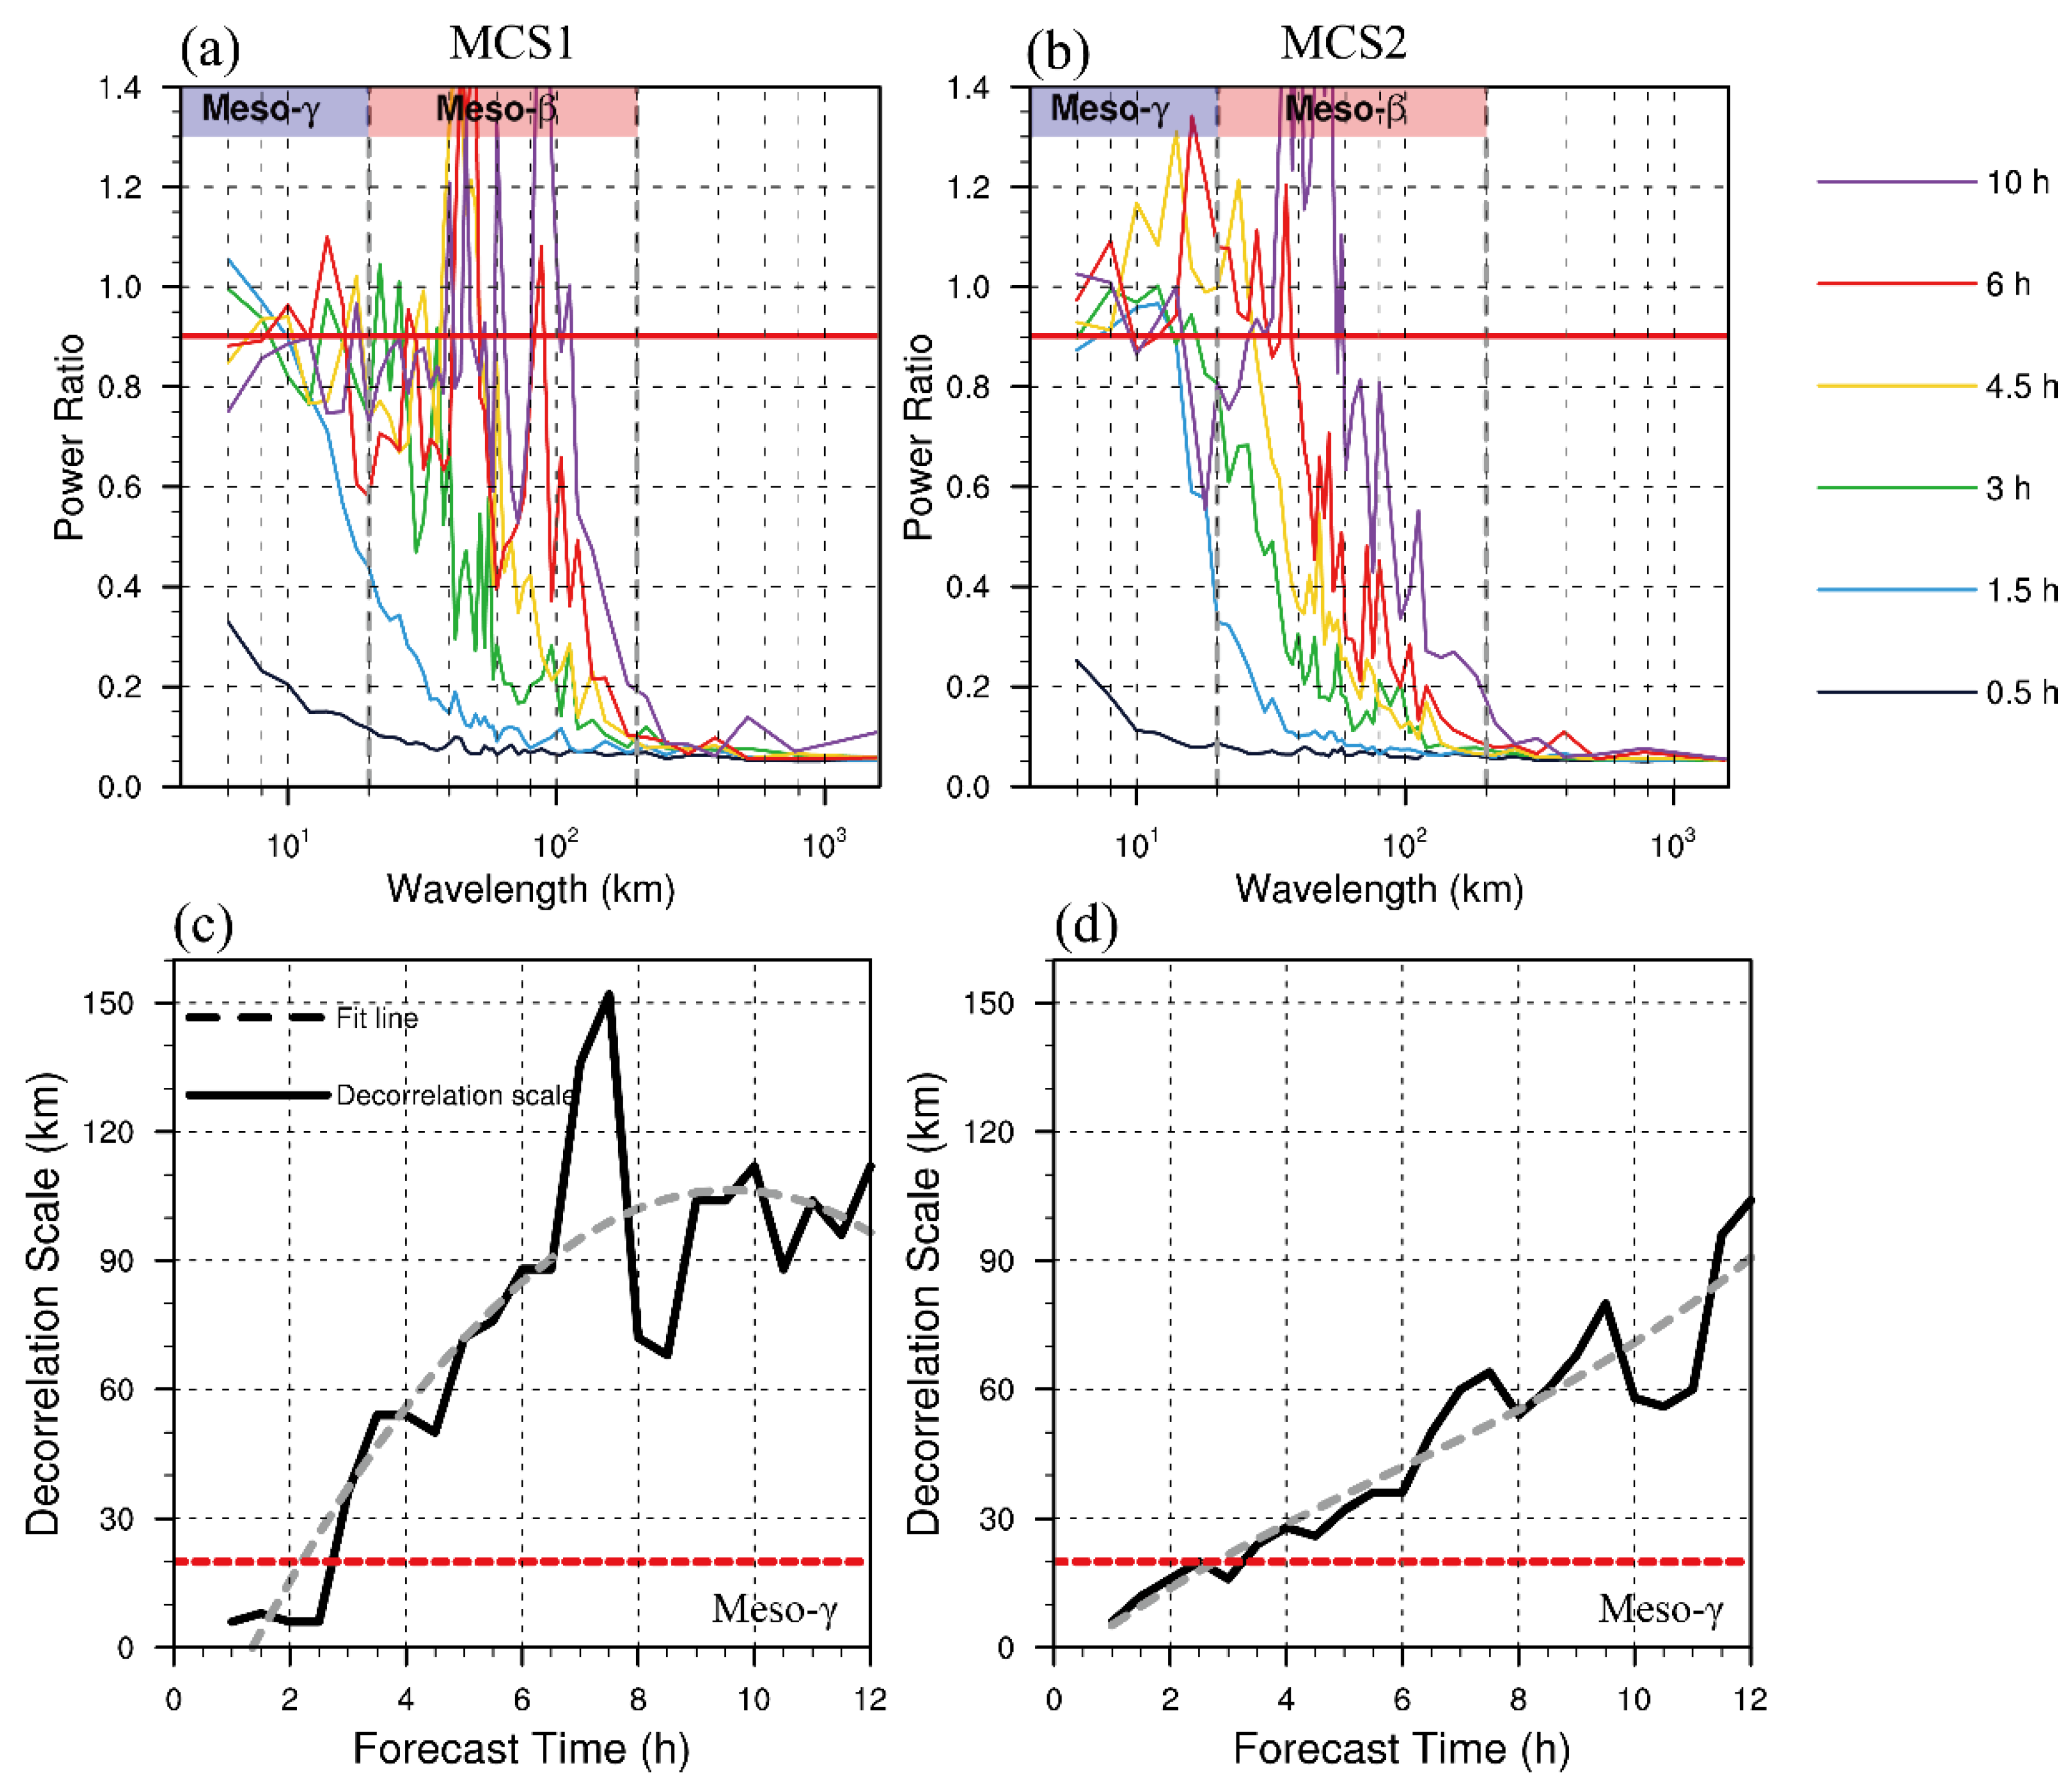
Figure 7a,b shows the power ratio (abbreviated as R) as a function of spatial scale for the two MCS regions at different lead times, which quantitatively illustrates the evolution of precipitation uncertainties in terms of spatial scales regardless of the selection of a certain threshold. It is clear that R increases at small scales and gradually transfer to larger scales with lead time, corresponding to the upscale transfer processes that revealed in the error energy growth processes (Figure 6). For both regions, with the rapid increase of small-scale error energy (Figure 6), R first increases at scales within 20 km at 0.5 h (black curves in Figure 7). This finding also indicates that the precipitation could only be monotonously influenced from small to larger scales even multiple-scale information is contained in the initial perturbations. After the first saturation of small-scale RMDTE, R exceeds the threshold 0.9 at scales within 20 km (blue curves in Figure 7), implying a full loss of predictability at the meso-γ-scale. Meanwhile, along with the upscale transfer of errors, R reflects a slower increase at larger scales at 2 h. After that, with the constant upscale error transfer from small to larger scales of RMDTE, R exhibit increases at all scales within the meso-β-scale, revealing the predictability loss of precipitation forecasts at relevant scales.
Considering the dissimilarity of RMDTE growth between the two MCS regions (Figure 6), we also find corresponding differences revealed on the precipitation uncertainties. The decorrelation scale λ0, which is further calculated based on R, is displayed in Figure 7c,d). For both MCS regions, the precipitation forecasts of ensemble members at scales less than λ0 are fully uncorrelated, indicating totally loss of predictability (i.e., untrusted forecasting results). For both MCS regions, the precipitation forecasts in CTRL are more or less correlated at all spatial scales at 0.5 h and start at 6 km at 1 h. After that, for the MCS2 region, the consistent increase of area-averaged small-scale RMDTE (1-2.5 h) leads to an earlier growth of λ0 (Figure 7b) than that in the MCS1 region. Next, along with the subsequent saturation of small-scale RMDTE, the growth rate of λ0 gradually becomes slower in the MCS2 region than that in the MCS1 region. This feature is owing to the secondary increase of small-scale RMDTE in the MCS1(Figure 6a). Besides, in the MCS1 region, λ0 reaches a peak at around 7 h, which is also consistent with the peak phase of RMDTE showed in Figure 6a. The fit lines computed with the least square regression also reveal the strong relationship between error energy growth and precipitation uncertainties.
In conclusion, the precipitation uncertainties first arise from small scales and gradually transfer to larger scales even impacted by multiscale initial errors. Specifically, the argument of small-scale error energy magnitude first improves R start from small scales and reaches a maximum (predictability loss) with the saturation of small-scale errors. Then with the upscale transfer of small-scale errors, R gradually increases from smaller to larger scales with the peak shifting to larger scales simultaneously.

3.4. Meteorological Sensitivities

Since the two MCSs are found to be different in both error energy growth and precipitation uncertainties, what are the detail meteorological forecast sensitivities that are responsible for the dissimilarity in predictability, especially for the particular time when forecast bifurcations occur? Understanding this issue could help to identify the sensitivity region and variables which in turn improve the perturbation design for the ensemble forecast system.
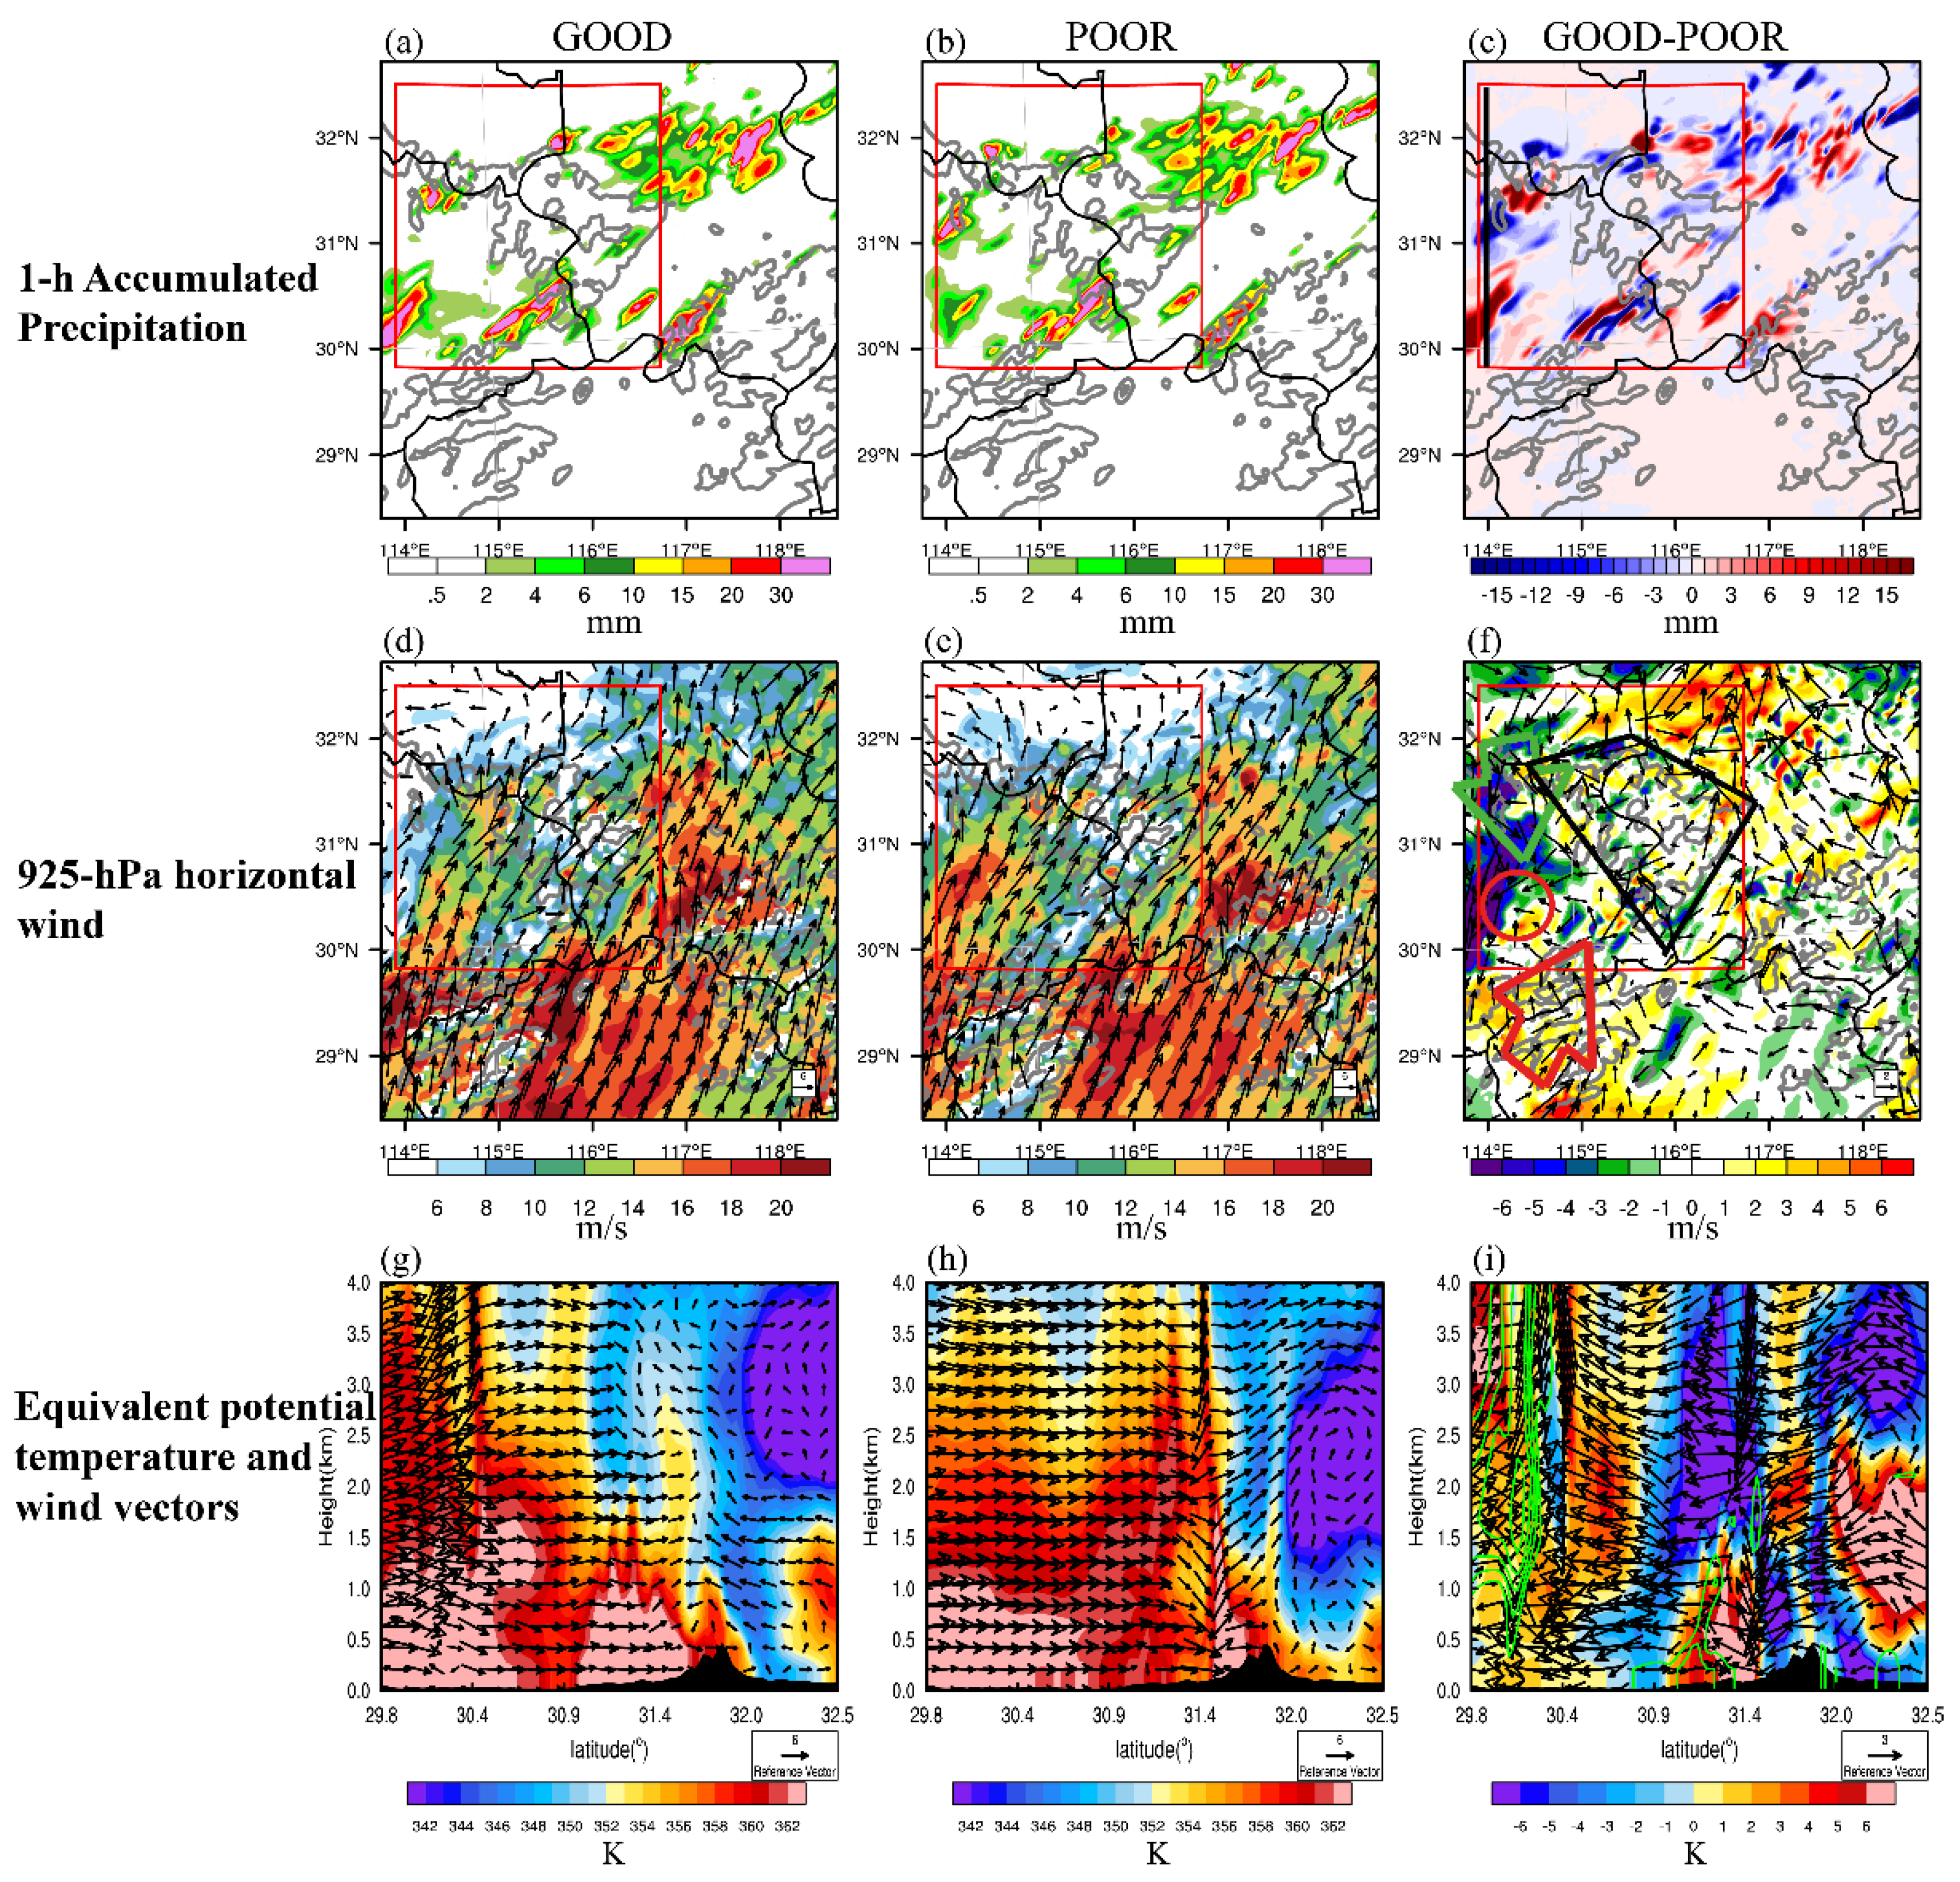
To address this issue, a subjective analysis of the ensemble members compared with TRUE is further performed with the determination of the spatial phasing and temporal phasing of the precipitation forecasts. Members 11 and 3 are then selected as representations of forecast success (GOOD) and forecast failure (POOR) for further analysis. Although there are very small differences of IC between these two representative members (e.g., T < 0.5 K; Wind-925 hPa < 0.5m/s) and very subtle difference in precipitation intensity is therefore caused within 0.5 h (compare the red curves with the blue curves in Figure 4), the precipitation location and intensity vary widely over the next few hours (compare Figure 3(a2–e2) with Figure 3(a3–e3)). The good member, member 11 (GOOD), could generally reproduce the intensity and location of the two precipitation bands in the MCS1 region. The central location and intensity for MCS2 can also be well represented by member 11 (Figure 3(a2–e2)). In contrast, in the MCS1 region, the convective systems for member 3 (POOR) only develops in the western lee of the Dabie Mountains at early 2 h lead hour (Figure 3(a3)), showing large location errors, while for the MCS2 region, POOR goes on to produce less intense, scattered precipitation in western Jiangsu (Figure 3(b3)) and then become disorganized in 22:00 UTC (Figure 3(d3)), compared with GOOD.
Next, two valid lead times when great forecast divergence initially occurs (regard as an approximately beginning of forecast bifurcation, Figure 4) in the MCS1 (2 h) and MCS2 (7 h) regions are selected, respectively. Figure 8 illustrates the precipitation and environmental conditions at 1.5 h forecast lead hour (0.5 h previous to the divergence time) for the MCS1 region. The near-boundary convection is barely decayed in POOR (Figure 8b) but evident in GOOD at this time, causing large precipitation difference (Figure 8c) and reflecting the early expansion of ensemble variability (Figure 4a). The second row in Figure 8 shows that GOOD has a stronger 925 hPa southerly wind south of the MCS1 region than that in POOR (marked by the arrows in Figure 8f), benefiting the convergence difference upstream the Dabie Mountains (marked by the red circle in Figure 8f). This finding reveals that the nighttime strengthened boundary layer low-level jet (Figure 2f–j) is important for MCS1 by bringing in more warm, moist air (larger θ se ) and causing greater upward vertical motion in GOOD (Figure 8g). We also find the convergence can be strengthened by the substantial stronger 925 hPa westerly wind that appears in POOR (Figure 8e) than GOOD (Figure 8d), resulting in the obvious precipitation location error in POOR (Figure 8b). As a short summary, the location and intensity of precipitation in the MCS1 region are closely related to the boundary layer low-level jet and the westerly wind upstream of the Dabie Mountains.
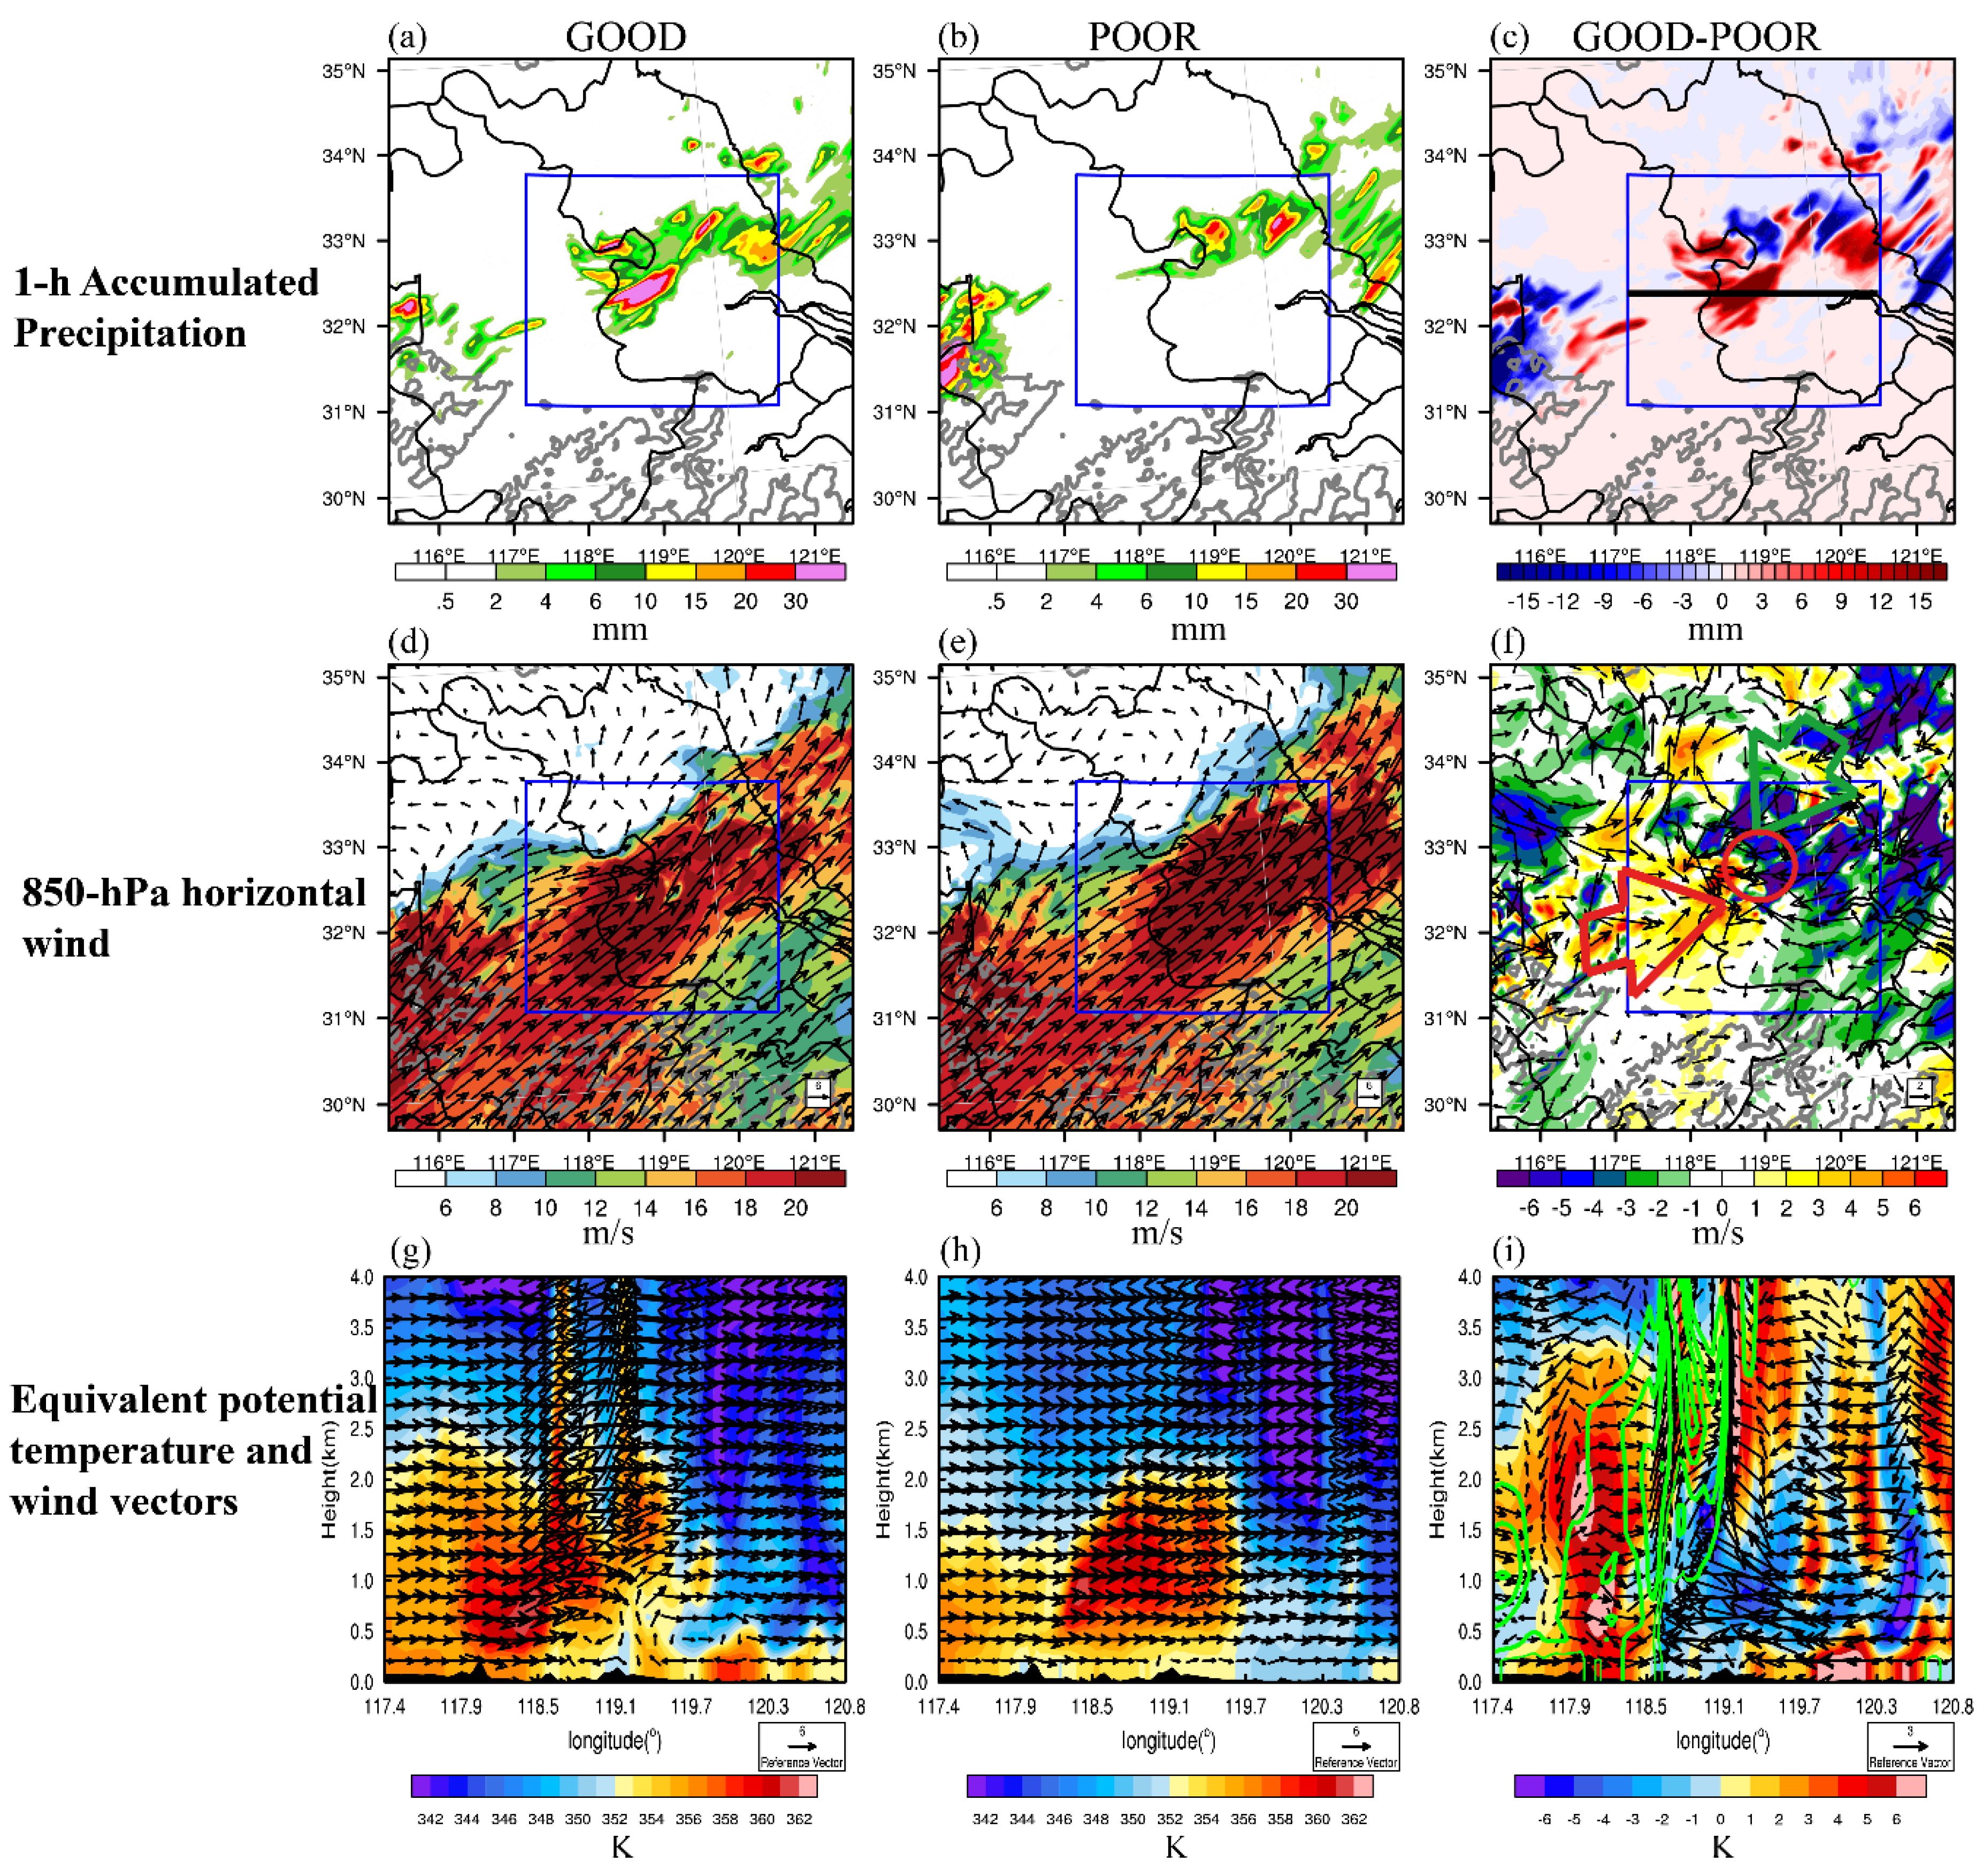
For the MCS2 region, evident expansion of ensemble variability is found to start at around 7 h (Figure 4b). Figure 9 displays the precipitation and environmental conditions for GOOD and POOR. The 1 h accumulated precipitation shows POOR is gradually becoming disorganized (Figure 9b) and has large location and intensity errors (Figure 9c) compared with GOOD. At the 850 hPa, GOOD has a stronger 850 hPa southwest wind than POOR (Figure 9f), leading to more moist and warm air (Figure 9g) from the Bay of Bengal and a local convergence difference (red circle in Figure 9f). Besides, the stronger westerly wind in GOOD is associated with warmer air that POOR at around 118.5° (Figure 9i), causing a greater upward motion accordingly. These results reveal that the accurate forecasting of the strength of the synoptic low-level jet (Figure 2a–e) is responsible for the precipitation forecast in the MCS2 region.
Note that the simulation of MCS1 could be greatly impacted by the western lateral boundary, but we mainly focus on the meteorological sensitivities themselves not that lead to the sensitivities. On the other hand, in the next sections, we care about the total error growth evolution and the associated impacts on precipitation which are comprehensive results of both initial and lateral boundary errors. Thus, the sensitivity and relative weight of errors from each source to forecast is beyond the scope and will not influence the reliability of our analysis.

3.5. Ensemble Sensitivity Analysis

In this subsection, ESA is introduced to quantitatively estimate the meteorological forecast sensitivity as a supplement of the subjective analysis in Section 3.4 and shed more light on the understanding of practical predictability of the Meiyu-frontal events. The area-averaged 1 h precipitation in each MCS region is selected as the response metric.
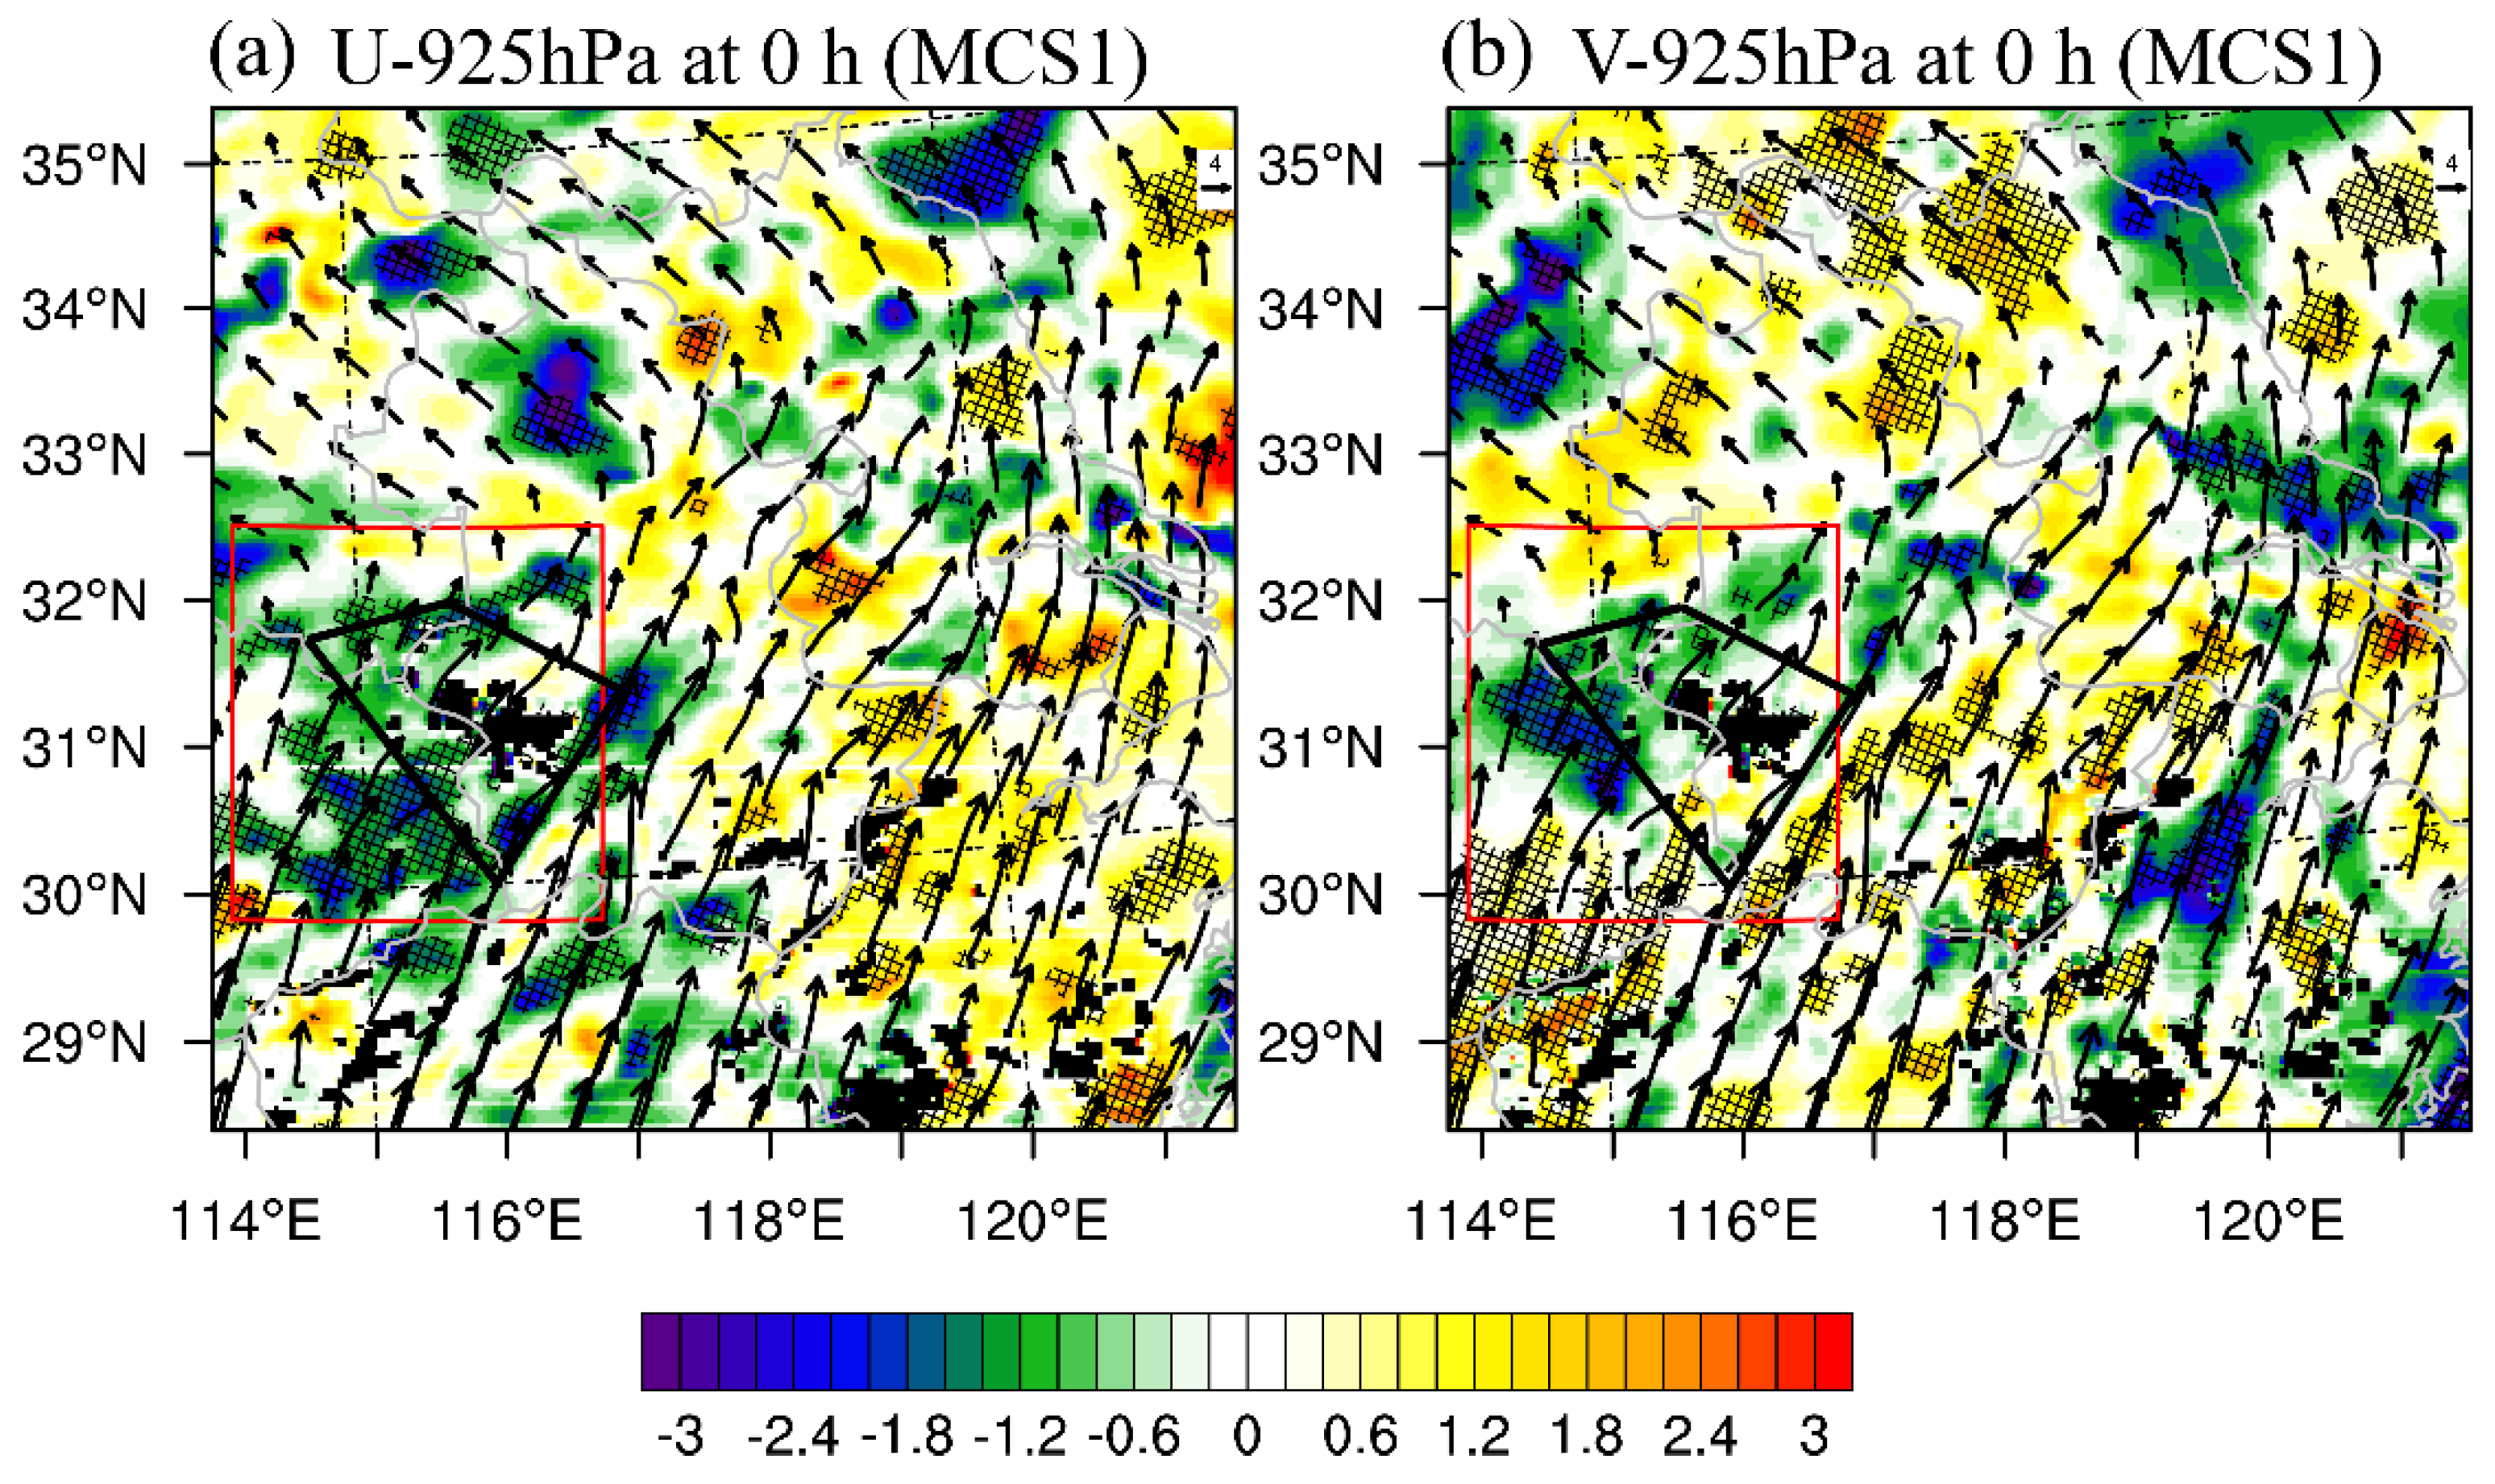
Figure 10 shows the ESA results in the MCS1 region valid at 14:00 UTC (2 h) to 925 hPa horizontal wind field at the beginning hour (12:00 UTC). The precipitation forecast is negatively sensitive to the 925 hPa (Figure 10a) zonal wind, indicating the weakening of 925 hPa westerly flow upstream the Dabie Mountains produces higher simulated precipitation in the response region. This finding also indirectly implies the Dabie Mountains can strengthen the upstream precipitation by the physical block of the westerly flow. We also find a dipolar distribution of precipitation forecast sensitivity to meridional wind (Figure 10b) at the lower-left quarter of the domain, implying a higher southerly wind speed southern of response area and a decrease of southerly wind within the response area could produce a larger precipitation amount. In short, the boundary layer low-level jet is responsible for the accuracy precipitation forecast in the MCS1 region, consistent with the subjective analysis in Section 3.4 (Figure 8).
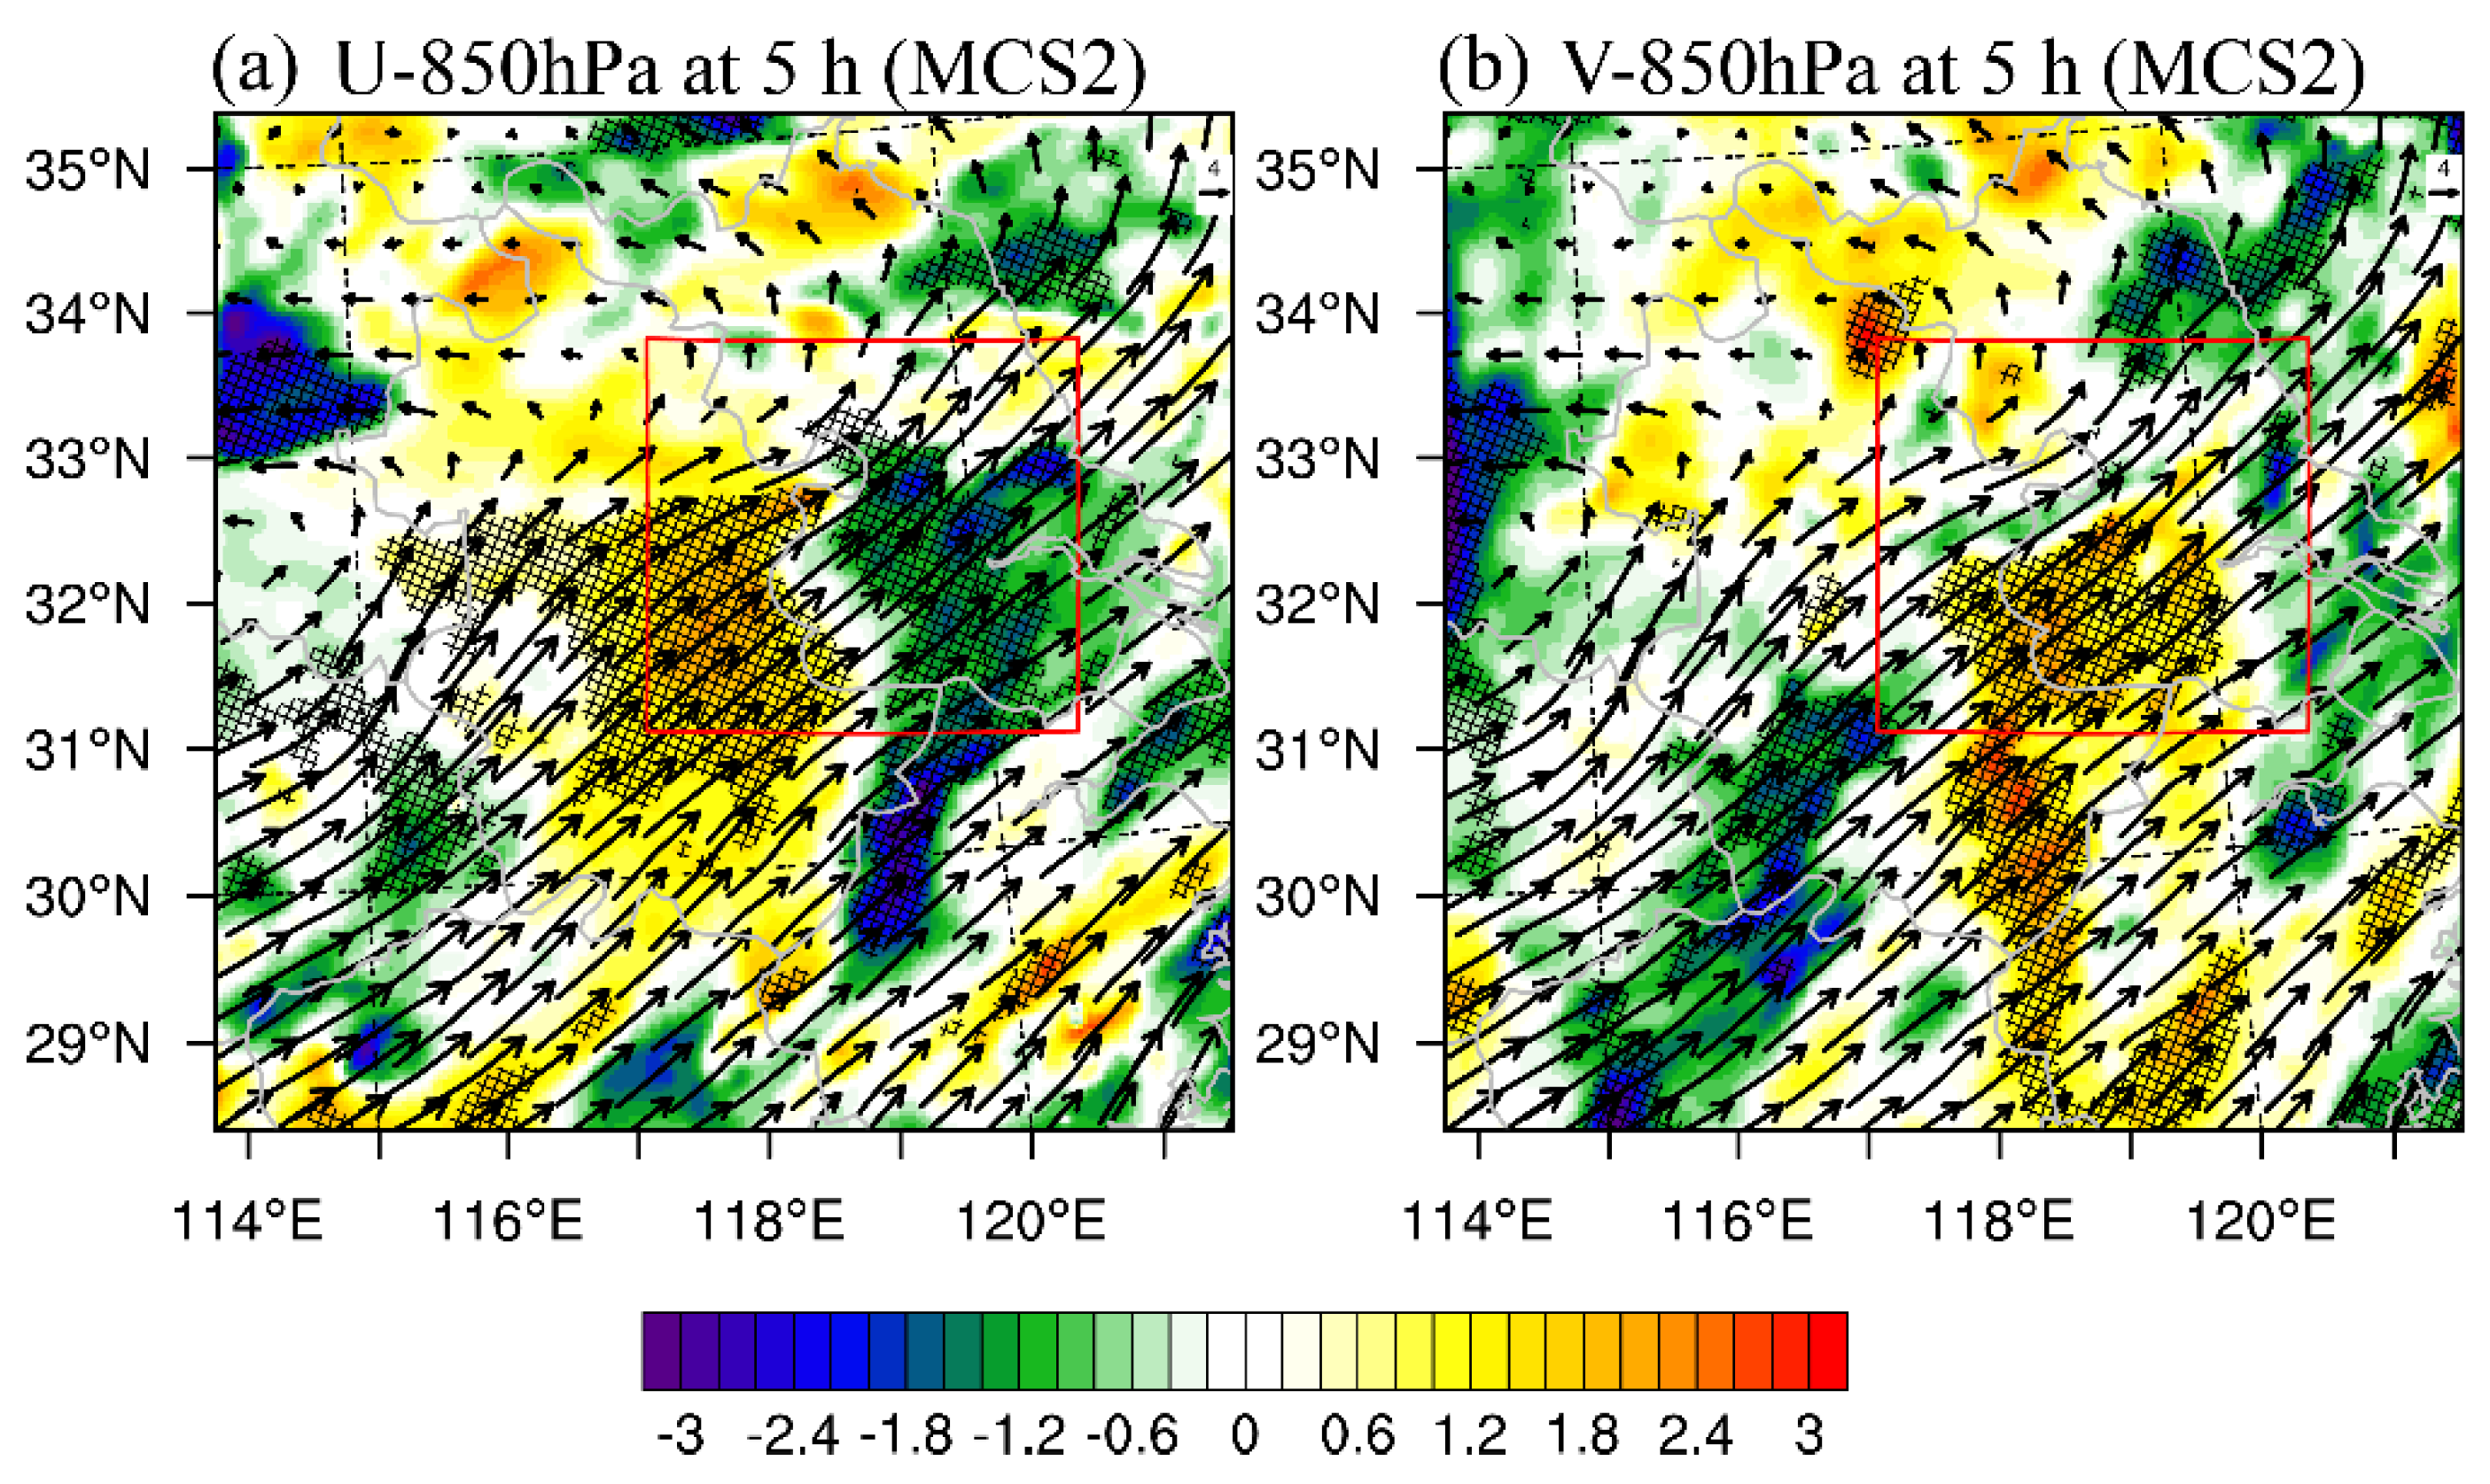
For the MCS2 region, the precipitation forecast is positively sensitive to the upstream 850 hPa zonal wind (Figure 11a) and meridional wind (Figure 11b), indicating the nighttime strengthening of the southwesterly low-level jet is clearly responsible for the simulated precipitation amount.
Therefore, the ESA results confirm the subjective GOOD versus POOR analysis shown in Section 3.4 in a more objective aspect. Improvements of the model physical processes for the nighttime strengthened (Figure 2) southwest low-level jet, boundary layer low-level jet as well as its interaction with the Dabie Mountains is able to promote the practical predictability of Meiyu-front forced convective events. In the meantime, since the low-level dynamic conditions are crucial to the frontal convection present in our study, targeted perturbations can be added to the low-level jet area to improve the ensemble spread performance.

4. Discussion and Conclusions

The mechanism of warm-season convective events dominated by the Meiyu-front in east China has been well studied during the last three decades [2,3,6,29,32,33,65], whereas the relevant researches on predictability are still limited [1], especially on the small scales in which the errors could rapidly grow nonlinearly across spatial scales and destroy the predictability. In this study, the practical predictability of two simulated mesoscale convective systems (MCS1 and MCS2) along the Meiyu-front is investigated using a state-of-the-art convection-allowing ensemble forecast system. The two events are distinguished by the additional orographic forcing presented in MCS1. Then on this basis, both the ensemble performance, scale-dependent forecast error growth, precipitation uncertainties and forecast sensitivity are evaluated.
An OSSE setup based on EnKF is first built that includes flow-dependent multiple-scale initial and lateral boundary perturbations. Therefore, a 12 h 30-member convection-allowing ensemble forecast from 12:00 UTC to 20:00 UTC 6 July 2013 is created. The forecast error growth dynamics are evaluated by investigating RMDTE [19] at different spatial scales and the associated precipitation uncertainties caused by forecast error growth are further assessed using the decorrelation scale method [27,28]. The meteorological forecast sensitivity is evaluated using a subjective good versus poor member comparison [15,23] with an objective ESA method [23,55].
The 30-member forecasts show a large precipitation difference for the two mesoscale convective systems along the Meiyu-front, implying a chaotic divergence among the members. The forecast error growth which leads to the large variability is then examined. Results show that the error energy evolution in the MCS1 region in which the convection is influenced by the Dabie Mountains shows a simultaneous peak pattern for all spatial scales at around 6 h with the presence of strong moisture dynamic. On the other hand, it is showing a stepwise increase with increasing spatial scale of forecast error in the MCS2 region where the precipitation is purely controlled by the large-scale flow. This dissimilarity is strongly linked to the forcing mechanisms of the convection. With the evolution of forecast error energy, the precipitation uncertainties develop and change correspondingly. Unlike the error energy, the precipitation uncertainties can only evolve from small scales and gradually transfer to larger scales, explaining the great precipitation variability within ensemble members. For different convective systems, this feature is also different, indicating different practical predictability limits.
Further investigations on the meteorological sensitivity demonstrate that the location and intensity of precipitation in the MCS1 region are closely related to the nighttime strengthened boundary layer low-level jet and its interaction with the Dabie Mountains. While the strength of synoptic southwest low-level jet is responsible for the accuracy of precipitation in the MCS2 region.
To conclude, these results suggest the predictability of Meiyu-front events can be impacted by the Dabie Mountains which locate over the low-level southwesterly winds. Therefore, the perturbation design for a convection-allowing ensemble forecast system covering the YHRB should be treated accordingly with respect to different forcing mechanisms.
In this work, the general features of meteorological sensitivity and error growth for Meiyu-frontal forcing events are revealed, and the impact of mesoscale orographic (the Dabie Mountains) forcing on such cases is preliminarily discussed. In a step forward, more on the impacts of the Dabie Mountains on practical predictability will be investigated through terrain modification experiments [66] and scale-based error sensitivity experiments [67]. In addition, it’s noted that the ensemble forecast for MCS1 presents a generally wet bias, while in the MCS2 region there is a dry bias (Figure 4). This feature may link to the diurnal nature of convection in this region. The influence of the Dabie Mountains and their associated mountain-valley circulation on the MCSs may lead to the differences. Thus, the diurnal nature of the MCSs and relevant predictabilities will also be studied in our next works.

Author Contributions

Conceptualization, X.Z., N.W. and J.M.; methodology, X.Z. and N.W.; formal analysis, X.Z. and N.W.; data curation, X.Z. and Y.X.; investigation, X.Z., N.W. and Y.X.; visualization, X.Z.; writing—review and editing, N.W.; funding acquisition, J.M.; supervision, J.M. All authors have read and agreed to the published version of the manuscript.

Funding

The author would like to thank the peaceful life in Norman, OK. This research was funded by the National Key Research and Development Program of China (2017YFC1502103), the National Natural Science Foundation of China (41705035, 41430427), the Postgraduate Research and Practice Innovation Program of Jiangsu Province (KYCX17_0876), the Science and Technology Planning Project of Guangdong Province, China (2017A020219005), and China Scholarship Council.

Conflicts of Interest

The authors declare no conflict of interest.

References

  1. Luo, Y.; Chen, Y. Investigation of the predictability and physical mechanisms of an extreme-rainfall-producing mesoscale convective system along the Meiyu front in East China: An ensemble approach. J. Geophys. Res. D Atmos. 2015, 120, 593–618. [Google Scholar] [CrossRef]
  2. Luo, Y.; Gong, Y.; Zhang, D.-L. Initiation and Organizational Modes of an Extreme-Rain-Producing Mesoscale Convective System along a Mei-Yu Front in East China. Mon. Weather Rev. 2013, 142, 203–221. [Google Scholar] [CrossRef] [Green Version]
  3. Ding, Y. Study on the Lasting Heavy Rainfalls Over the Yangtze-Huaihe River Basin in 1991; Chinese Meteorological Press Beijing: Beijing, China, 1993. [Google Scholar]
  4. Wang, Q.; Xue, M.; Tan, Z. Convective initiation by topographically induced convergence forcing over the Dabie Mountains on 24 June 2010. Adv. Atmos. Sci. 2016, 33, 1120–1136. [Google Scholar] [CrossRef] [Green Version]
  5. Zheng, Y.; Xue, M.; Li, B.; Chen, J.; Tao, Z. Spatial characteristics of extreme rainfall over China with hourly through 24-hour accumulation periods based on national-level hourly rain gauge data. Adv. Atmos. Sci. 2016, 33, 1218–1232. [Google Scholar] [CrossRef] [Green Version]
  6. Fu, P.; Zhu, K.; Zhao, K.; Zhou, B.; Xue, M. Role of the Nocturnal Low-level Jet in the Formation of the Morning Precipitation Peak over the Dabie Mountains. Adv. Atmos. Sci. 2019, 36, 15–28. [Google Scholar] [CrossRef]
  7. Geng, B.; Yamada, H.; Reddy, K.K.; Uyeda, H.; Fujiyoshi, Y. Mesoscale Development and Along-Frontal Variation of a Meiyu/Baiu Front and Precipitation Observed in the Downstream Region of the Yangtze River. J. Meteorol. Soc. Jpn. 2009, 87, 423–457. [Google Scholar] [CrossRef] [Green Version]
  8. Clark, P.; Roberts, N.; Lean, H.; Ballard, S.P.; Charlton-Perez, C. Convection-permitting models: A step-change in rainfall forecasting. Meteorol. Appl. 2016, 23, 165–181. [Google Scholar] [CrossRef] [Green Version]
  9. Johnson, A.; Wang, X.; Xue, M.; Kong, F.; Zhao, G.; Wang, Y.; Thomas, K.W.; Brewster, K.A.; Gao, J. Multiscale Characteristics and Evolution of Perturbations for Warm Season Convection-Allowing Precipitation Forecasts: Dependence on Background Flow and Method of Perturbation. Mon. Weather Rev. 2013, 142, 1053–1073. [Google Scholar] [CrossRef]
  10. Judt, F.; Chen, S.S.; Berner, J. Predictability of tropical cyclone intensity: Scale-dependent forecast error growth in high-resolution stochastic kinetic-energy backscatter ensembles. Q. J. R. Meteorol. Soc. 2016, 142, 43–57. [Google Scholar] [CrossRef]
  11. Toth, Z.; Kalnay, E. Ensemble Forecasting at NCEP and the Breeding Method. Mon. Weather Rev. 1997, 125, 3297–3319. [Google Scholar] [CrossRef]
  12. Zhuang, X.; Zhu, H.; Min, J.; Zhang, L.; Wu, N.; Wu, Z.; Wang, S. Spatial Predictability of Heavy Rainfall Events in East China and the Application of Spatial-Based Methods of Probabilistic Forecasting. Atmosphere 2019, 10, 490. [Google Scholar] [CrossRef] [Green Version]
  13. Frogner, I.-L.; Singleton, A.T.; Køltzow, M.Ø.; Andrae, U. Convection-permitting ensembles: Challenges related to their design and use. Q. J. R. Meteorol. Soc. 2019, 145, 90–106. [Google Scholar] [CrossRef] [Green Version]
  14. Johnson, A.; Wang, X. A Study of Multiscale Initial Condition Perturbation Methods for Convection-Permitting Ensemble Forecasts. Mon. Weather Rev. 2016, 144, 2579–2604. [Google Scholar] [CrossRef]
  15. Melhauser, C.; Zhang, F. Practical and Intrinsic Predictability of Severe and Convective Weather at the Mesoscales. J. Atmos. Sci. 2012, 69, 3350–3371. [Google Scholar] [CrossRef]
  16. Zhang, F.; Bei, N.; Rotunno, R.; Snyder, C.; Epifanio, C.C. Mesoscale Predictability of Moist Baroclinic Waves: Convection-Permitting Experiments and Multistage Error Growth Dynamics. J. Atmos. Sci. 2007, 64, 3579–3594. [Google Scholar] [CrossRef]
  17. Zhang, F.; Odins, A.M.; Nielsen-Gammon, J.W. Mesoscale Predictability of an Extreme Warm-Season Precipitation Event. Weather Forecast. 2006, 21, 149–166. [Google Scholar] [CrossRef]
  18. Zhang, F.; Snyder, C.; Rotunno, R. Effects of Moist Convection on Mesoscale Predictability. J. Atmos. Sci. 2003, 60, 1173–1185. [Google Scholar] [CrossRef] [Green Version]
  19. Nielsen, E.R.; Schumacher, R.S. Using Convection-Allowing Ensembles to Understand the Predictability of an Extreme Rainfall Event. Mon. Weather Rev. 2016, 144, 3651–3676. [Google Scholar] [CrossRef]
  20. Bierdel, L.; Selz, T.; Craig, G.C. Theoretical aspects of upscale error growth through the mesoscales: An analytical model. Q. J. R. Meteorol. Soc. 2017, 143, 3048–3059. [Google Scholar] [CrossRef]
  21. Lorenz, E.N. Atmospheric Predictability as Revealed by Naturally Occurring Analogues. J. Atmos. Sci. 1969, 26, 636–646. [Google Scholar] [CrossRef] [Green Version]
  22. Sun, Y.Q.; Zhang, F. Intrinsic versus Practical Limits of Atmospheric Predictability and the Significance of the Butterfly Effect. J. Atmos. Sci. 2016, 73, 1419–1438. [Google Scholar] [CrossRef] [Green Version]
  23. Wu, N.; Zhuang, X.; Min, J.; Meng, Z. Practical and Intrinsic Predictability of a Warm-sector Torrential Rainfall Event in the South China Monsoon Region. J. Geophys. Res. D Atmos. 2020. [Google Scholar] [CrossRef]
  24. Schumacher, R.S.; Davis, C.A. Ensemble-Based Forecast Uncertainty Analysis of Diverse Heavy Rainfall Events. Weather Forecast. 2010, 25, 1103–1122. [Google Scholar] [CrossRef]
  25. Dey, S.R.A.; Plant, R.S.; Roberts, N.M.; Migliorini, S. Assessing spatial precipitation uncertainties in a convective-scale ensemble. Q. J. R. Meteorol. Soc. 2016, 142, 2935–2948. [Google Scholar] [CrossRef]
  26. Dey, S.R.A.; Roberts, N.M.; Plant, R.S.; Migliorini, S. A new method for the characterization and verification of local spatial predictability for convective-scale ensembles. Q. J. R. Meteorol. Soc. 2016, 142, 1982–1996. [Google Scholar] [CrossRef] [Green Version]
  27. Surcel, M.; Zawadzki, I.; Yau, M.K. A Study on the Scale Dependence of the Predictability of Precipitation Patterns. J. Atmos. Sci. 2014, 72, 216–235. [Google Scholar] [CrossRef]
  28. Surcel, M.; Zawadzki, I.; Yau, M.K. The Case-to-Case Variability of the Predictability of Precipitation by a Storm-Scale Ensemble Forecasting System. Mon. Weather Rev. 2015, 144, 193–212. [Google Scholar] [CrossRef]
  29. Sun, J.; Zhang, F. Impacts of Mountain–Plains Solenoid on Diurnal Variations of Rainfalls along the Mei-Yu Front over the East China Plains. Mon. Weather Rev. 2012, 140, 379–397. [Google Scholar] [CrossRef] [Green Version]
  30. Miao, C.; Liu, W.; Wang, J.; WU, M.; LI, T.J.P.M. Comparison between two rainstorm meso-scale vortices circumambulated respectively from two sides of Mountain Dabieshan during Meiyu season. Plateau Meteorol. 2014, 33, 394–406. [Google Scholar]
  31. Fu, S.; Yu, F.; Wang, D.; Xia, R. A comparison of two kinds of eastward-moving mesoscale vortices during the mei-yu period of 2010. Sci. China Earth Sci. 2013, 56, 282–300. [Google Scholar] [CrossRef]
  32. Guo, R.; Miao, C.; Zhang, N. Sensitivity experiments of effects of Dabie mountains terrain on Meiyu front rainstorm over Huaihe River basin. Transac. Atmos. Sci. 2013, 36, 626–634. [Google Scholar]
  33. Yang, Y.; Gu, W.; Zhao, R.; Liu, J. The statistical analysis of low vortex during Meiyu season in the lower reaches of the Yangtze. J. Appl. Meteorol. Sci. 2010, 21, 11–18. [Google Scholar]
  34. Zhao, Y.; Xu, X.; Cui, C. Case study of the impact of mesoscale topography on the Meiyu frontal rainstorm. Plateau Meteorol. 2012, 31, 1268–1282. [Google Scholar]
  35. Bachmann, K.; Keil, C.; Craig, G.C.; Weissmann, M.; Welzbacher, C.A. Predictability of Deep Convection in Idealized and Operational Forecasts: Effects of Radar Data Assimilation, Orography, and Synoptic Weather Regime. Mon. Weather Rev. 2019, 148, 63–81. [Google Scholar] [CrossRef]
  36. Bachmann, K.; Keil, C.; Weissmann, M. Impact of radar data assimilation and orography on predictability of deep convection. Q. J. R. Meteorol. Soc. 2019, 145, 117–130. [Google Scholar] [CrossRef] [Green Version]
  37. Bei, N.; Zhang, F. Mesoscale predictability of moist baroclinic waves: Variable and scale-dependent error growth. Adv. Atmos. Sci. 2014, 31, 995–1008. [Google Scholar] [CrossRef]
  38. Carbone, R.E.; Tuttle, J.D. Rainfall Occurrence in the U.S. Warm Season: The Diurnal Cycle. J. Climate 2008, 21, 4132–4146. [Google Scholar] [CrossRef]
  39. Skamarock, W.C.; Klemp, J.B.; Dudhia, J.; Gill, D.O.; Barker, D.M.; Wang, W.; Powers, J.G. A Description of the Advanced Research WRF Version 3; NCAR Technical Note-475+ STR; NCAR: Boulder, CO, USA, 2008. [Google Scholar]
  40. Hong, S.-Y.; Lim, J.-O.J. The WRF single-moment 6-class microphysics scheme (WSM6). Mathematics 2006, 42, 129–151. [Google Scholar]
  41. Grell, G.A.; Dévényi, D. A generalized approach to parameterizing convection combining ensemble and data assimilation techniques. Geophys. Res. Lett. 2002, 29, 31–38. [Google Scholar] [CrossRef] [Green Version]
  42. Hong, S.-Y.; Noh, Y.; Dudhia, J. A New Vertical Diffusion Package with an Explicit Treatment of Entrainment Processes. Mon. Weather Rev. 2006, 134, 2318–2341. [Google Scholar] [CrossRef] [Green Version]
  43. Mlawer, E.J.; Taubman, S.J.; Brown, P.D.; Iacono, M.J.; Clough, S.A. Radiative transfer for inhomogeneous atmospheres: RRTM, a validated correlated-k model for the longwave. J. Geophys. Res. D Atmos. 1997, 102, 16663–16682. [Google Scholar] [CrossRef] [Green Version]
  44. Chou, M.; Suarez, M. A Solar Radiation Parameterization (CLIRAD–SW) for Atmospheric Studies; NASA/TM-1999-104606; NASA Goddard Space Flight Center: Greenbelt, MD, USA, 1999. [Google Scholar]
  45. Yu, E. High-resolution seasonal snowfall simulation over Northeast China. Chin. Sci. Bull. 2013, 58, 1412–1419. [Google Scholar] [CrossRef] [Green Version]
  46. Zhang, Y.; Zhang, F.; Davis, C.A.; Sun, J. Diurnal Evolution and Structure of Long-Lived Mesoscale Convective Vortices along the Mei-Yu Front over the East China Plains. J. Atmos. Sci. 2018, 75, 1005–1025. [Google Scholar] [CrossRef]
  47. Johnson, A.; Wang, X.; Carley, J.R.; Wicker, L.J.; Karstens, C. A Comparison of Multiscale GSI-Based EnKF and 3DVar Data Assimilation Using Radar and Conventional Observations for Midlatitude Convective-Scale Precipitation Forecasts. Mon. Weather Rev. 2015, 143, 3087–3108. [Google Scholar] [CrossRef]
  48. Wang, S.; Xue, M.; Schenkman, A.D.; Min, J. An iterative ensemble square root filter and tests with simulated radar data for storm-scale data assimilation. Q. J. R. Meteorol. Soc. 2013, 139, 1888–1903. [Google Scholar] [CrossRef] [Green Version]
  49. Whitaker, J.S.; Hamill, T.M. Ensemble Data Assimilation without Perturbed Observations. Mon. Weather Rev. 2002, 130, 1913–1924. [Google Scholar] [CrossRef]
  50. Snook, N.; Xue, M.; Jung, Y. Multiscale EnKF Assimilation of Radar and Conventional Observations and Ensemble Forecasting for a Tornadic Mesoscale Convective System. Mon. Weather Rev. 2014, 143, 1035–1057. [Google Scholar] [CrossRef]
  51. Zhu, X.; Zhu, J. New generation weather radar network in China. Meteorol. Sci. Technol 2004, 32, 255–258. [Google Scholar]
  52. Daniels, M.H.; Lundquist, K.A.; Mirocha, J.D.; Wiersema, D.J.; Chow, F.K. A New Vertical Grid Nesting Capability in the Weather Research and Forecasting (WRF) Model. Mon. Weather Rev. 2016, 144, 3725–3747. [Google Scholar] [CrossRef]
  53. Ancell, B.; Hakim, G.J. Comparing Adjoint- and Ensemble-Sensitivity Analysis with Applications to Observation Targeting. Mon. Weather Rev. 2007, 135, 4117–4134. [Google Scholar] [CrossRef]
  54. Bednarczyk, C.N.; Ancell, B.C. Ensemble Sensitivity Analysis Applied to a Southern Plains Convective Event. Mon. Weather Rev. 2014, 143, 230–249. [Google Scholar] [CrossRef]
  55. Hill, A.J.; Weiss, C.C.; Ancell, B.C. Ensemble Sensitivity Analysis for Mesoscale Forecasts of Dryline Convection Initiation. Mon. Weather Rev. 2016, 144, 4161–4182. [Google Scholar] [CrossRef]
  56. Xue, M.; Luo, X.; Zhu, K.; Sun, Z.; Fei, J. The Controlling Role of Boundary Layer Inertial Oscillations in Meiyu Frontal Precipitation and Its Diurnal Cycles Over China. J. Geophys. Res. D Atmos. 2018, 123, 5090–5115. [Google Scholar] [CrossRef]
  57. Zhang, Y.; Zhang, F.; Stensrud, D.J.; Meng, Z. Practical Predictability of the 20 May 2013 Tornadic Thunderstorm Event in Oklahoma: Sensitivity to Synoptic Timing and Topographical Influence. Mon. Weather Rev. 2015, 143, 2973–2997. [Google Scholar] [CrossRef] [Green Version]
  58. Selz, T.; Craig, G.C. Upscale Error Growth in a High-Resolution Simulation of a Summertime Weather Event over Europe. Mon. Weather Rev. 2014, 143, 813–827. [Google Scholar] [CrossRef]
  59. Hohenegger, C.; Lüthi, D.; Schär, C. Predictability Mysteries in Cloud-Resolving Models. Mon. Weather Rev. 2006, 134, 2095–2107. [Google Scholar] [CrossRef] [Green Version]
  60. Hohenegger, C.; Schar, C. Atmospheric Predictability at Synoptic Versus Cloud-Resolving Scales. Bull. Am. Meteorol. Soc. 2007, 88, 1783–1794. [Google Scholar] [CrossRef]
  61. Hohenegger, C.; Schär, C. Predictability and Error Growth Dynamics in Cloud-Resolving Models. J. Atmos. Sci. 2007, 64, 4467–4478. [Google Scholar] [CrossRef]
  62. Tan, Z.-M.; Zhang, F.; Rotunno, R.; Snyder, C. Mesoscale Predictability of Moist Baroclinic Waves: Experiments with Parameterized Convection. J. Atmos. Sci. 2004, 61, 1794–1804. [Google Scholar] [CrossRef] [Green Version]
  63. Done, J.M.; Craig, G.C.; Gray, S.L.; Clark, P.A.; Gray, M.E.B. Mesoscale simulations of organized convection: Importance of convective equilibrium. Q. J. R. Meteorol. Soc. 2006, 132, 737–756. [Google Scholar] [CrossRef] [Green Version]
  64. Flack, D.L.A.; Gray, S.L.; Plant, R.S.; Lean, H.W.; Craig, G.C. Convective-Scale Perturbation Growth across the Spectrum of Convective Regimes. Mon. Weather Rev. 2017, 146, 387–405. [Google Scholar] [CrossRef]
  65. Chen, Y.; Chen, Y.; Zhang, T. Characteristics analysis of warm sector rainstorms over the middle lower reaches of the Yangze River. Meteorol. Mon. 2016, 42, 724–731. [Google Scholar]
  66. Nielsen, E.R.; Schumacher, R.S.; Keclik, A.M. The Effect of the Balcones Escarpment on Three Cases of Extreme Precipitation in Central Texas. Mon. Weather Rev. 2015, 144, 119–138. [Google Scholar] [CrossRef]
  67. Weyn, J.A.; Durran, D.R. The scale dependence of initial-condition sensitivities in simulations of convective systems over the southeastern United States. Q. J. R. Meteorol. Soc. 2019, 145, 57–74. [Google Scholar] [CrossRef] [Green Version]
Figure 1. (a) Analysis domain. The color shading represents the terrain height (m). The red and blue rectangles correspond to the MCS1 and MCS2 regions, respectively. (b) Maximum reflectivity (dBz, color), 850 hPa wind vectors (m/s) and 850 hPa equivalent potential temperature (K, black contours from 344 to 348) and terrain height (m, blue contours) at 14:00 UTC 6 July 2013 of TRUE. (c) Vertical speed (shaded, m/s) and wind vectors at 14:00 UTC from TRUE in a vertical cross-section along the blue line in Figure 1a. The blue square marks the general range of synoptic low-level jet while the orange square marks the range of boundary layer low-level jet.
Atmosphere 11 00234 g001
Figure 2. The 850 hPa horizontal wind vectors and wind speed (color) from TRUE, (a) 14:00 UTC, (b) 16:00 UTC, (c) 18:00 UTC, (d) 20:00 UTC, (e) 22:00 UTC; 925 hPa horizontal wind vectors and wind speed (color) from TRUE, (f) 14:00 UTC, (g) 16:00 UTC, (h) 18:00 UTC, (i) 20:00 UTC, (j) 22:00 UTC. The black curves indicate the Meiyu-front. The black tangle in (f) marks out the main peak (>600 m height) of the Dabie Mountains.
Atmosphere 11 00234 g002
Figure 3. The 1 h accumulated precipitation for TRUE (top row), GOOD (middle row) and POOR (bottom row) at different valid times (a1a3) 2 h, (b1b3) 4 h, (c1c3) 6 h, (d1d3) 8 h, (e1e3) 10 h. The blue contour indicates the terrain height (m, contoured every 600 m).
Atmosphere 11 00234 g003
Figure 4. Time evolution of area-averaged 0.5 h precipitation from TRUE (black thick curve), ensemble mean (black dotted curve), ensemble members (gray curves), member 11 (red curve) and member 3 (blue curve) for the (a) MCS1 region and (b) MCS2 region. The blue and red shadings indicate the upper and bottom limit of ensembles.
Atmosphere 11 00234 g004
Figure 5. Distribution of RMDTE (color) at different spatial scales (first row) small-scale, (second row) transition-scale, (third row) larger-scale, and 1-h accumulated precipitation (contour) at different valid times (a1a3) 0 h, (b1b3) 2 h, (c1c3) 4 h, (d1d3) 6 h, (e1e3) 8 h.
Atmosphere 11 00234 g005
Figure 6. Time evolution of RMDTE at different spatial scales (Total: black curves; Small-scale: blue curves; Transition-scale: red curves; Larger-scale: green curves) in the (a) MCS1 region and (b) MCS2 region.
Atmosphere 11 00234 g006
Figure 7. The power ratio as a function of spatial scale for different lead times in the (a) MCS1 region and (b) MCS2 region. The decorrelation scale as a function of lead time with the dotted gray line showing a logarithmic fit in the (c) MCS1 region and (d) MCS2 region.
Atmosphere 11 00234 g007
Figure 8. Environments of GOOD and POOR at 1330 UTC 6 July (1.5 h lead time) and their difference (GOOD minus POOR): (ac) 1h accumulated precipitation (mm), (df) 925 hPa horizontal wind vectors and wind speed (shaded, m/s). The gray thick contour indicates the terrain height (m, contoured every 600 m). Red rectangles identify the MCS1 region. The red circle along with the rectangles indicates the convergence difference region, while the black polygon outlines the general range of the Dabie Mountains. (gi) Local vertical circulation (vectors, m/s) and equivalent potential temperature (shaded, K) along the black line in Figure 8c. Green lines represent the southerly wind (contoured every 2 m/s).
Atmosphere 11 00234 g008
Figure 9. Environments of GOOD and POOR at 19:00 UTC 6 July (7 h lead time) and their difference (GOOD minus POOR): (a–c) 1h accumulated precipitation (mm), (d–f) 850 hPa horizontal wind vectors and wind speed (shaded, m/s), (gi) 925 hPa horizontal wind vectors and wind speed (shaded, m/s). The gray thick contours represent the terrain height (m, contoured every 600 m). Red rectangles identify the MCS2 region. The red circle along with the arrows indicates the convergence difference region. (g–i) Local vertical circulation (vectors, m/s) and equivalent potential temperature (shaded, K) along the black line in Figure 9c. Green lines represent the westerly wind (contoured every 2 m/s).
Atmosphere 11 00234 g009
Figure 10. Sensitivity of hourly precipitation in the MCS1 region (red rectangle) at 14:00 UTC 6 July (2 h) to (a) 925 hPa zonal wind (shaded, mm (m s−1)−1 and (b) 925 hPa meridional wind (shaded, mm (m s−1)−1) at 12:00 UTC (0 h). Black shading indicates regions where the sensitivity is statistically significant at the 95% confidence level. The black vectors are 925 hPa ensemble mean wind fields. The black polygon outlines the general range of the Dabie Mountains.
Atmosphere 11 00234 g010
Figure 11. Sensitivity of hourly precipitation in the MCS2 region (red rectangle) at 19:00 UTC 6 July (7 h) to (a) 850 hPa zonal wind (shaded, mm (m s−1)−1) and (b) 850 hPa meridional wind (shaded, mm (m s−1)−1) at 17:00 UTC (5 h). Black shading indicates regions where the sensitivity is statistically significant at the 95% confidence level. The black vectors are 850 hPa ensemble mean wind fields.
Atmosphere 11 00234 g011