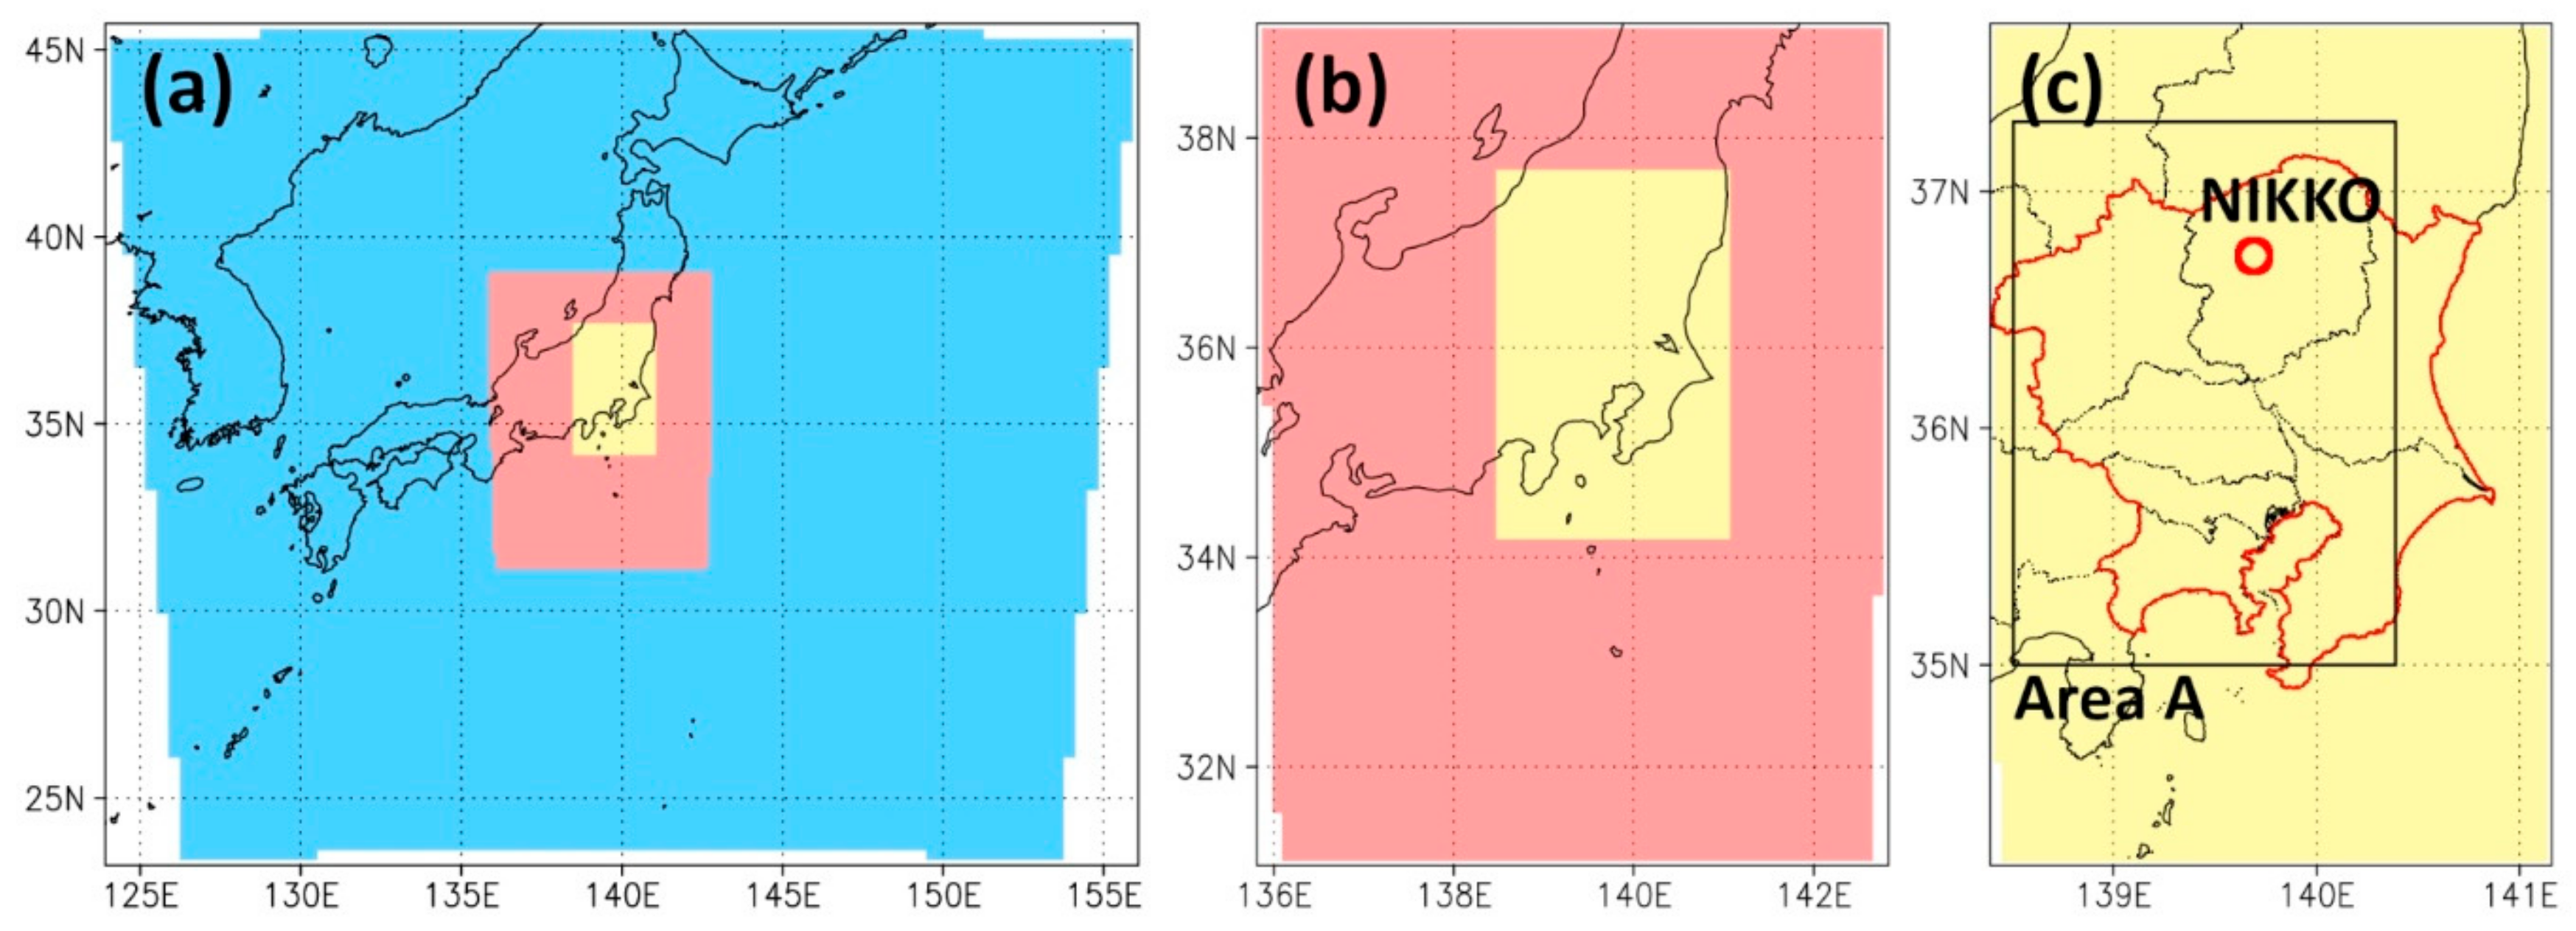
Figure 1.
Target domains for the weather research and forecasting (WRF) simulations. (a) Parent domain; (b) intermediate domain; (c) child domain. The blue, red, and yellow areas represent the parent, intermediate, and child domains, respectively. The red line and open rectangle shown in (c) indicate the Kanto area and area A, respectively. The red circle in (c) is the location of Nikko city.
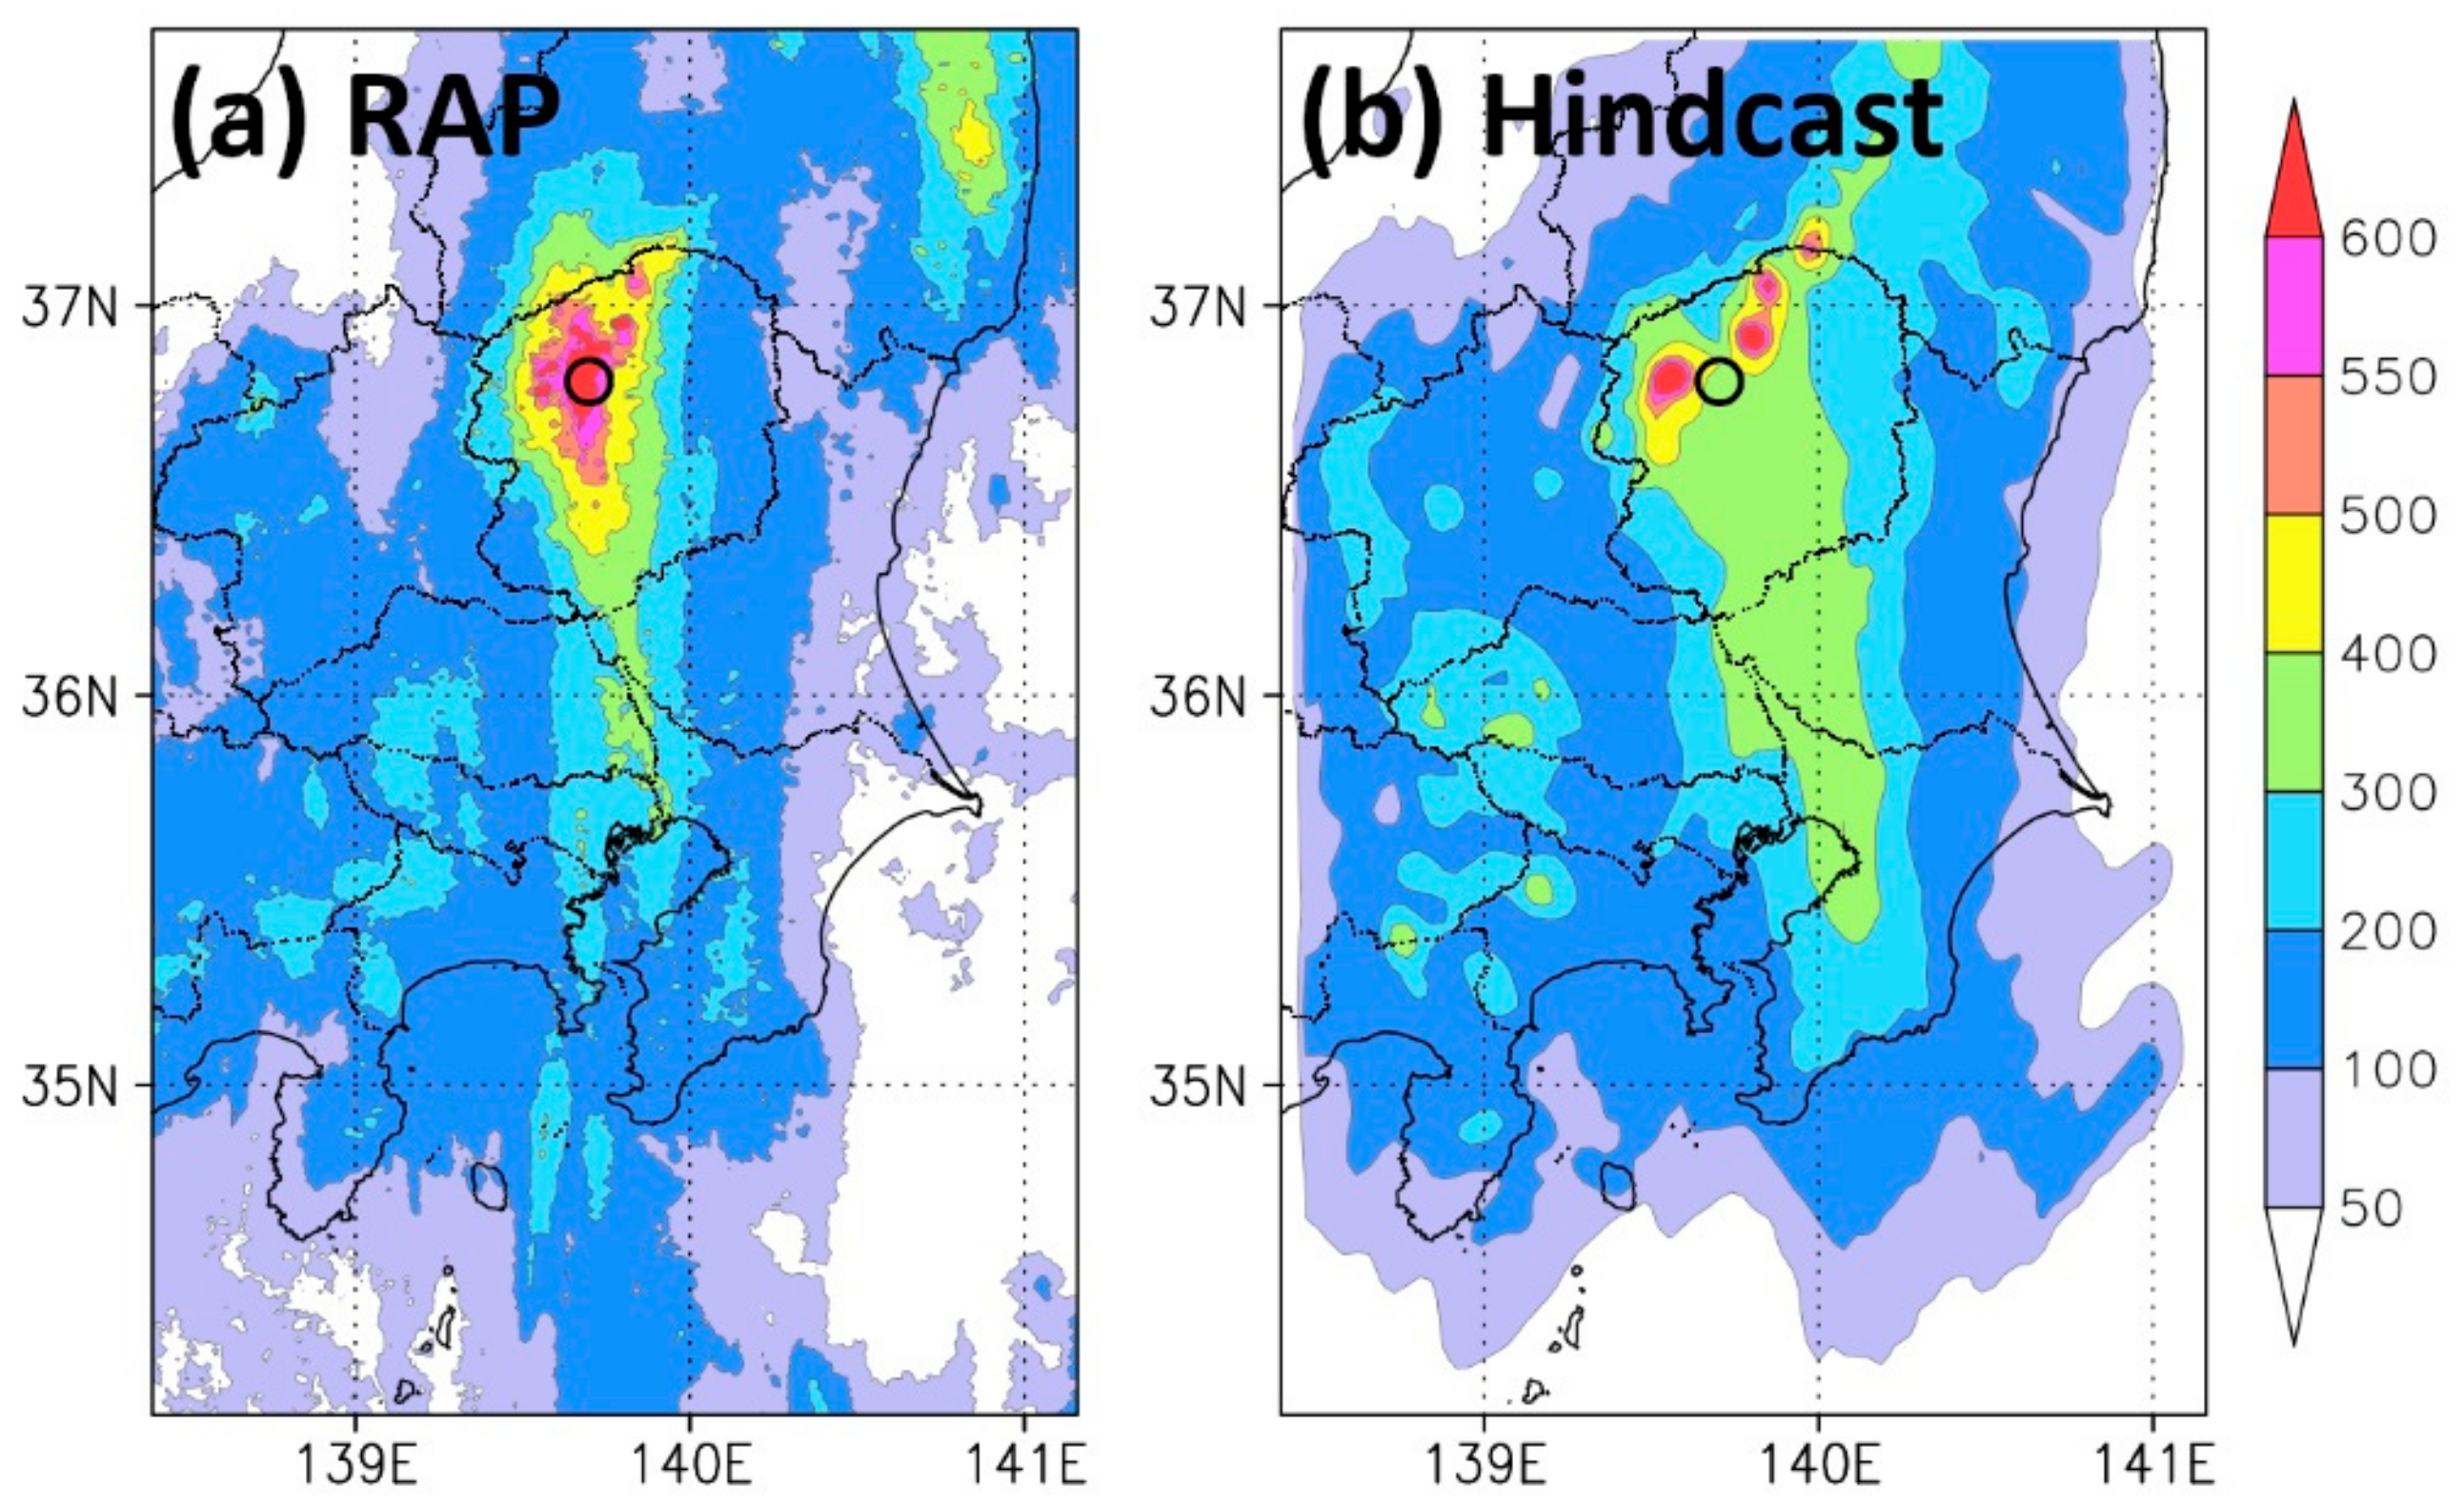
Figure 2.
Total rainfall from 8 to 11 September 2015. (a) Result by Radar-AMeDAS precipitation (RAP); (b) ensemble mean total rainfall of the hindcast. Open circle indicates the location of the Nikko city. The unit of the color bar is mm.
Figure 2.
Total rainfall from 8 to 11 September 2015. (a) Result by Radar-AMeDAS precipitation (RAP); (b) ensemble mean total rainfall of the hindcast. Open circle indicates the location of the Nikko city. The unit of the color bar is mm.
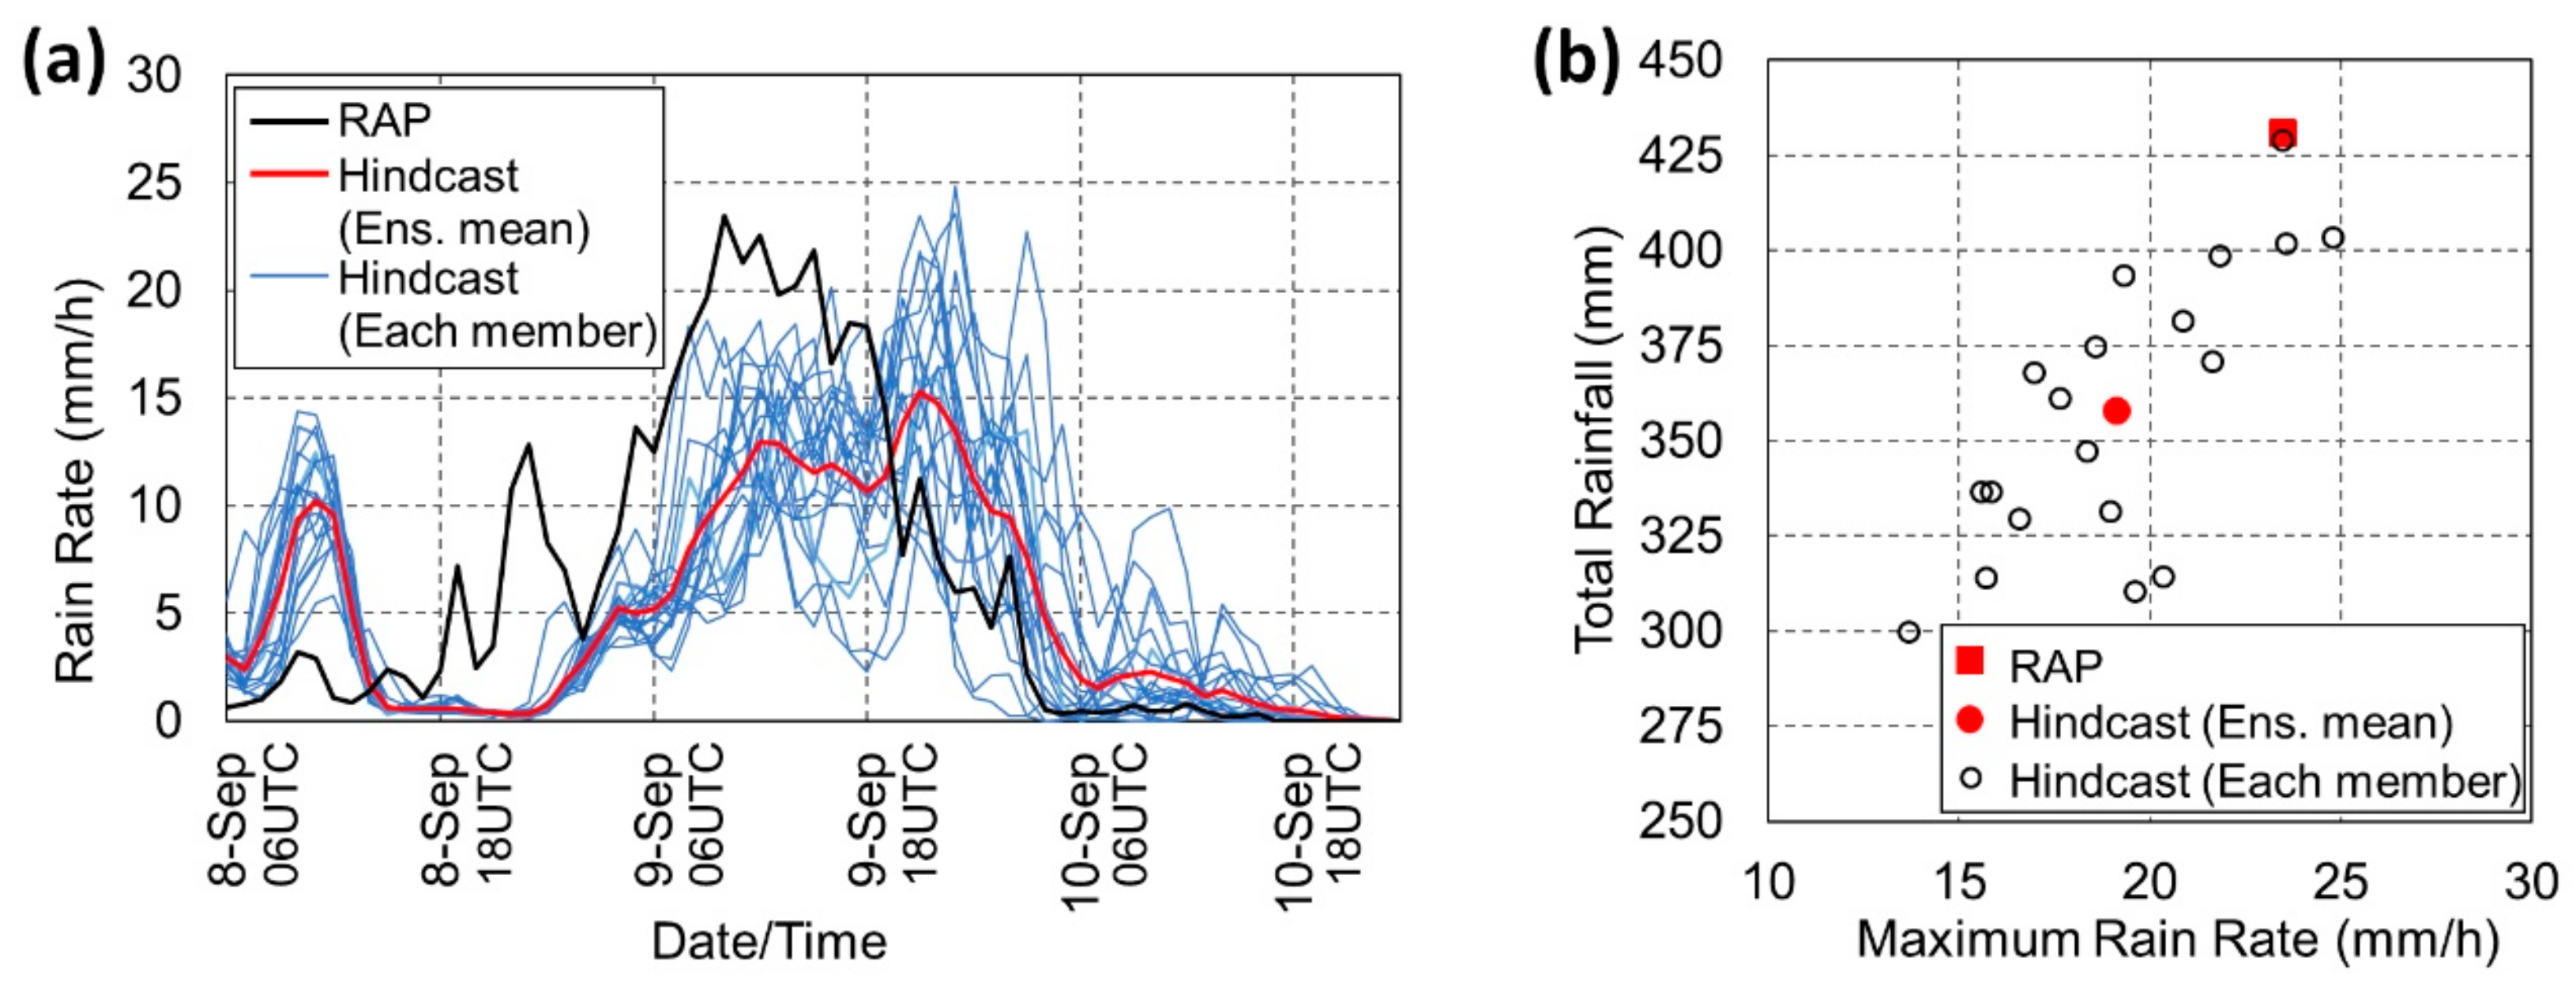
Figure 3.
(a) Time-series of hourly rain rate averaged for the area around the Nikko city; (b) scatter plot of the maximum rain rate and total rainfall averaged for the area around the Nikko city.
Figure 3.
(a) Time-series of hourly rain rate averaged for the area around the Nikko city; (b) scatter plot of the maximum rain rate and total rainfall averaged for the area around the Nikko city.
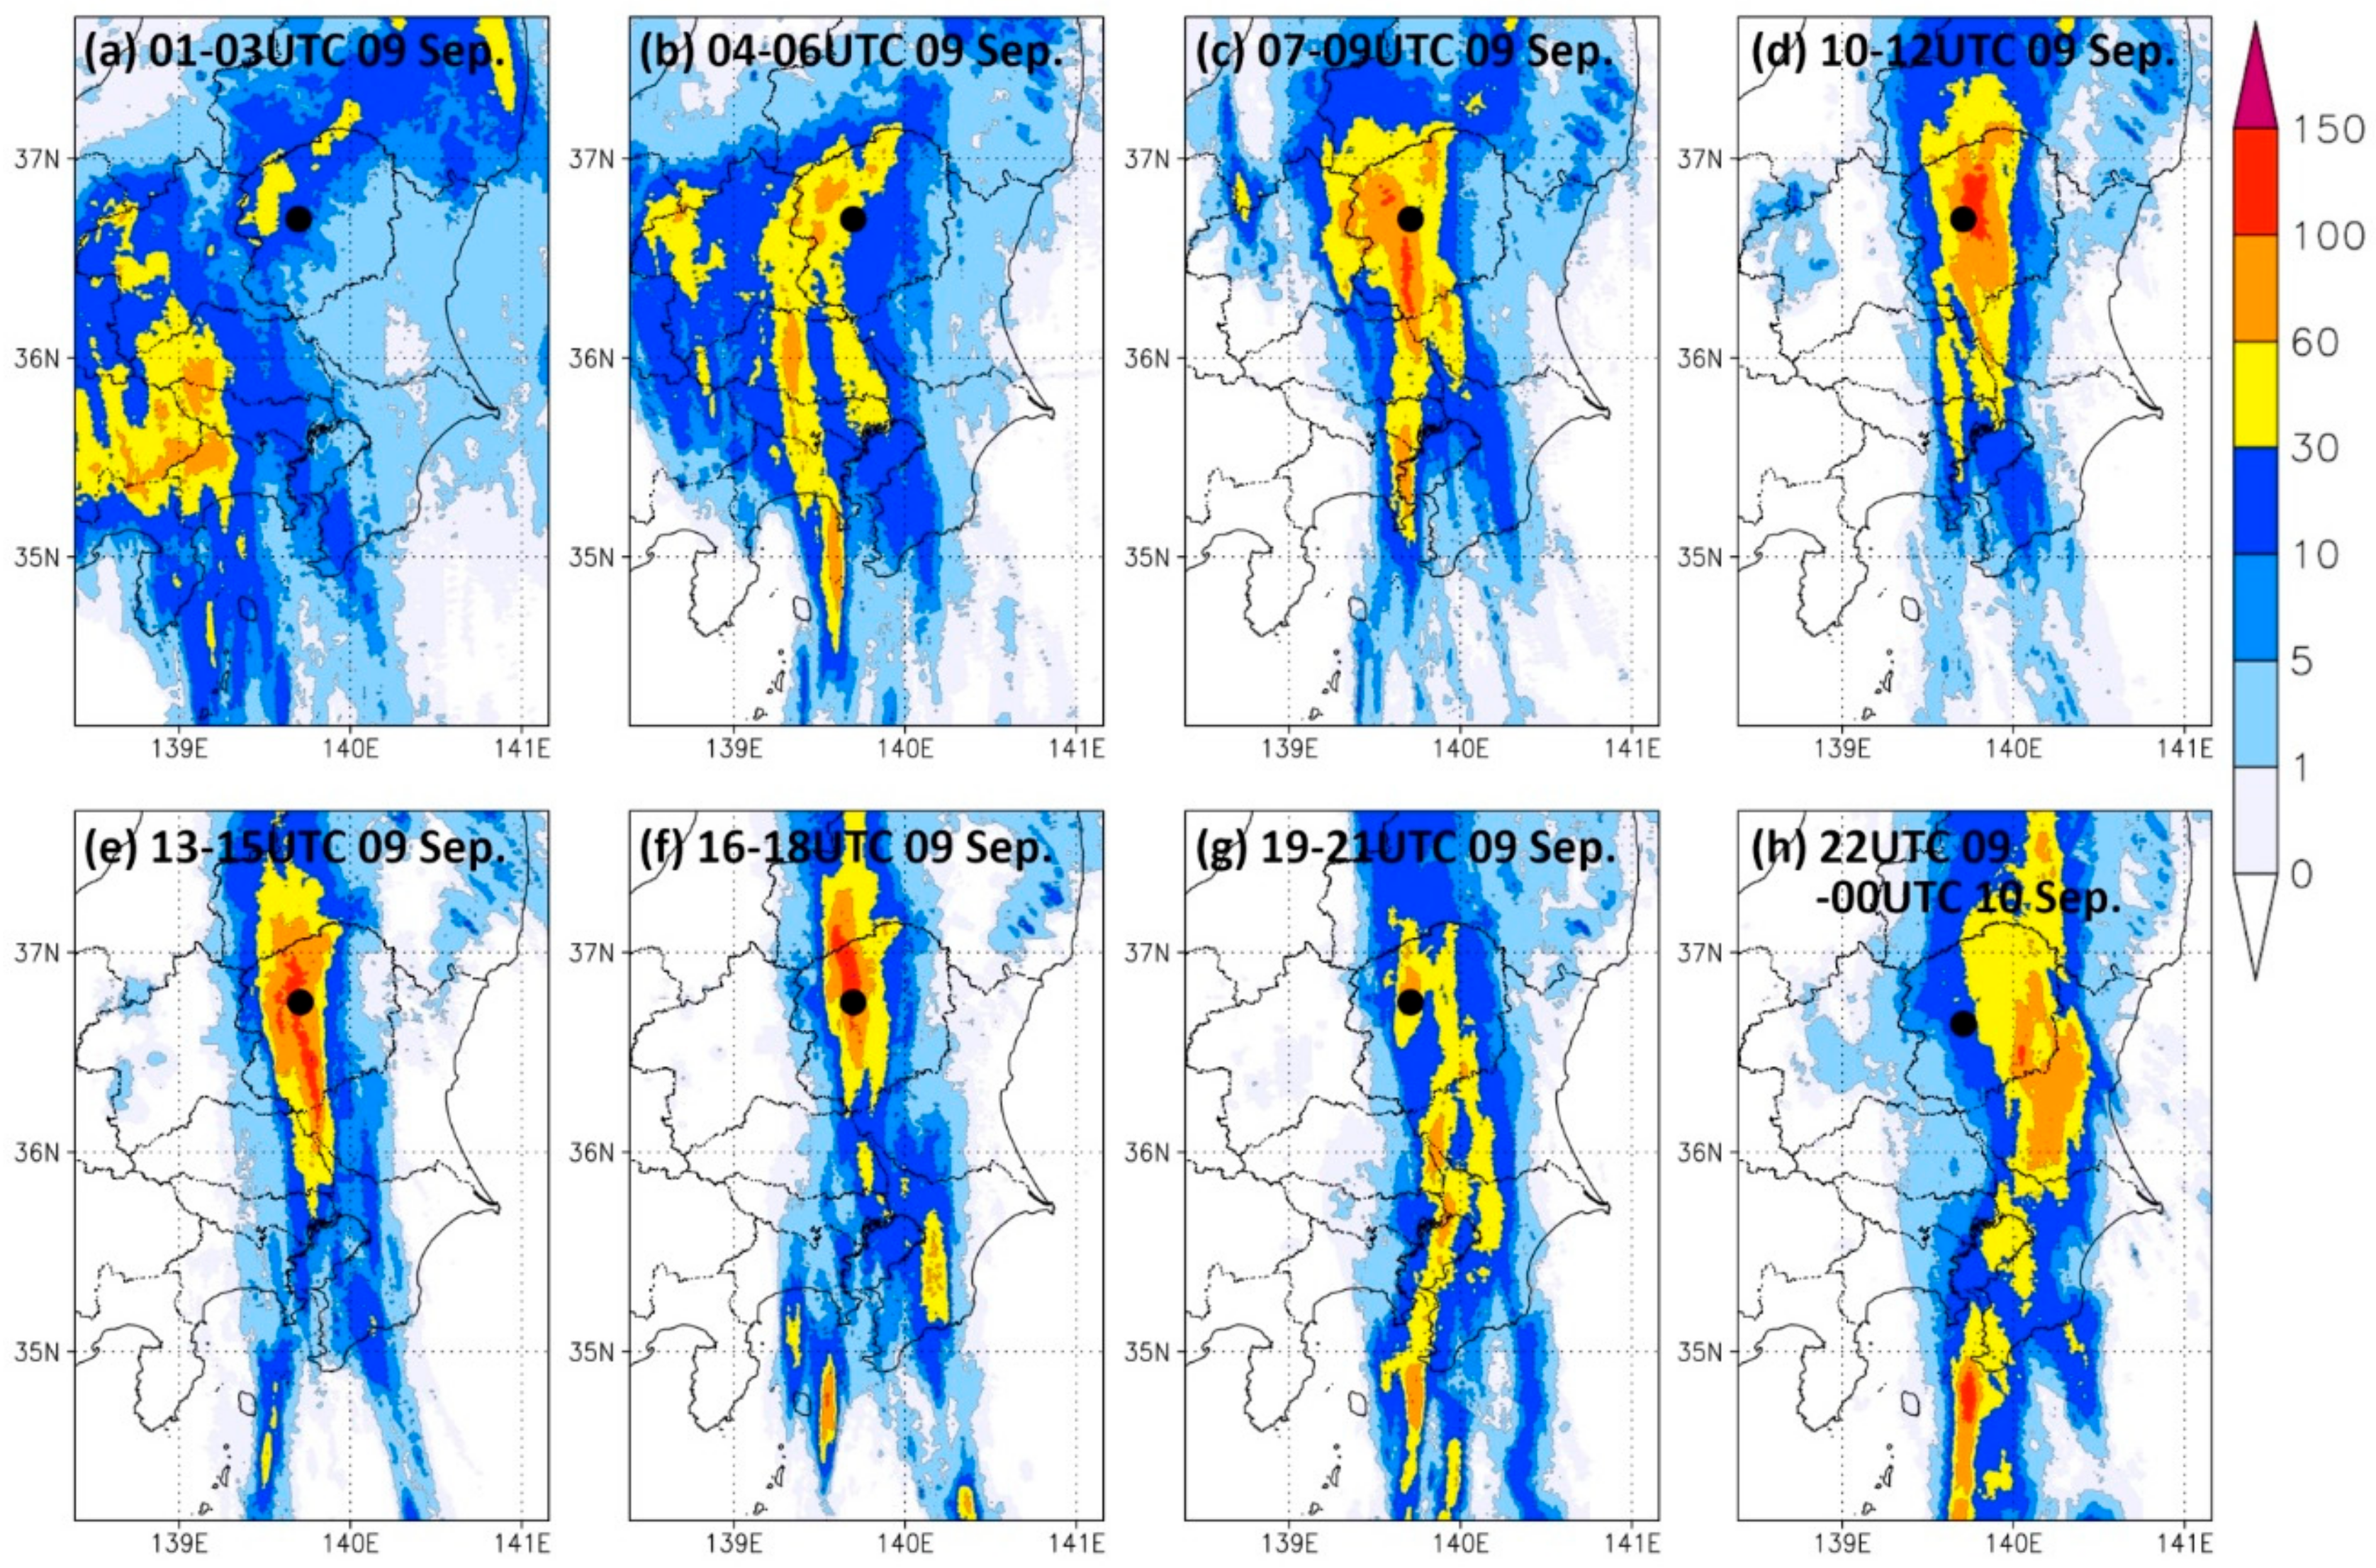
Figure 4.
3-hourly rainfall by Radar-AMeDAS precipitation (RAP). Result of (a) 01–03 UTC, (b) 04–06 UTC, (c) 07–09 UTC, (d) 10–12 UTC, (e) 13–15 UTC, (f) 16–18 UTC, (g) 19–21 UTC on 9 September. (h) Result of 22 UTC on 9 September–00 UTC on 10 September. The unit of the color bar is mm/3 h. Filled black circle indicate the location of the Nikko city.
Figure 5.
3-hourly rainfall by the hindcast simulation (a member starts at 00 UTC 7 September). Result of (a) 01–03 UTC, (b) 04–06 UTC, (c) 07–09 UTC, (d) 10–12 UTC, (e) 13–15 UTC, (f) 16–18 UTC, (g) 19–21 UTC on 9 September. (h) Result of 22 UTC on 9 September–00 UTC on 10 September. The unit of the color bar is mm/3 h. Filled black circle indicate the location of the Nikko city.
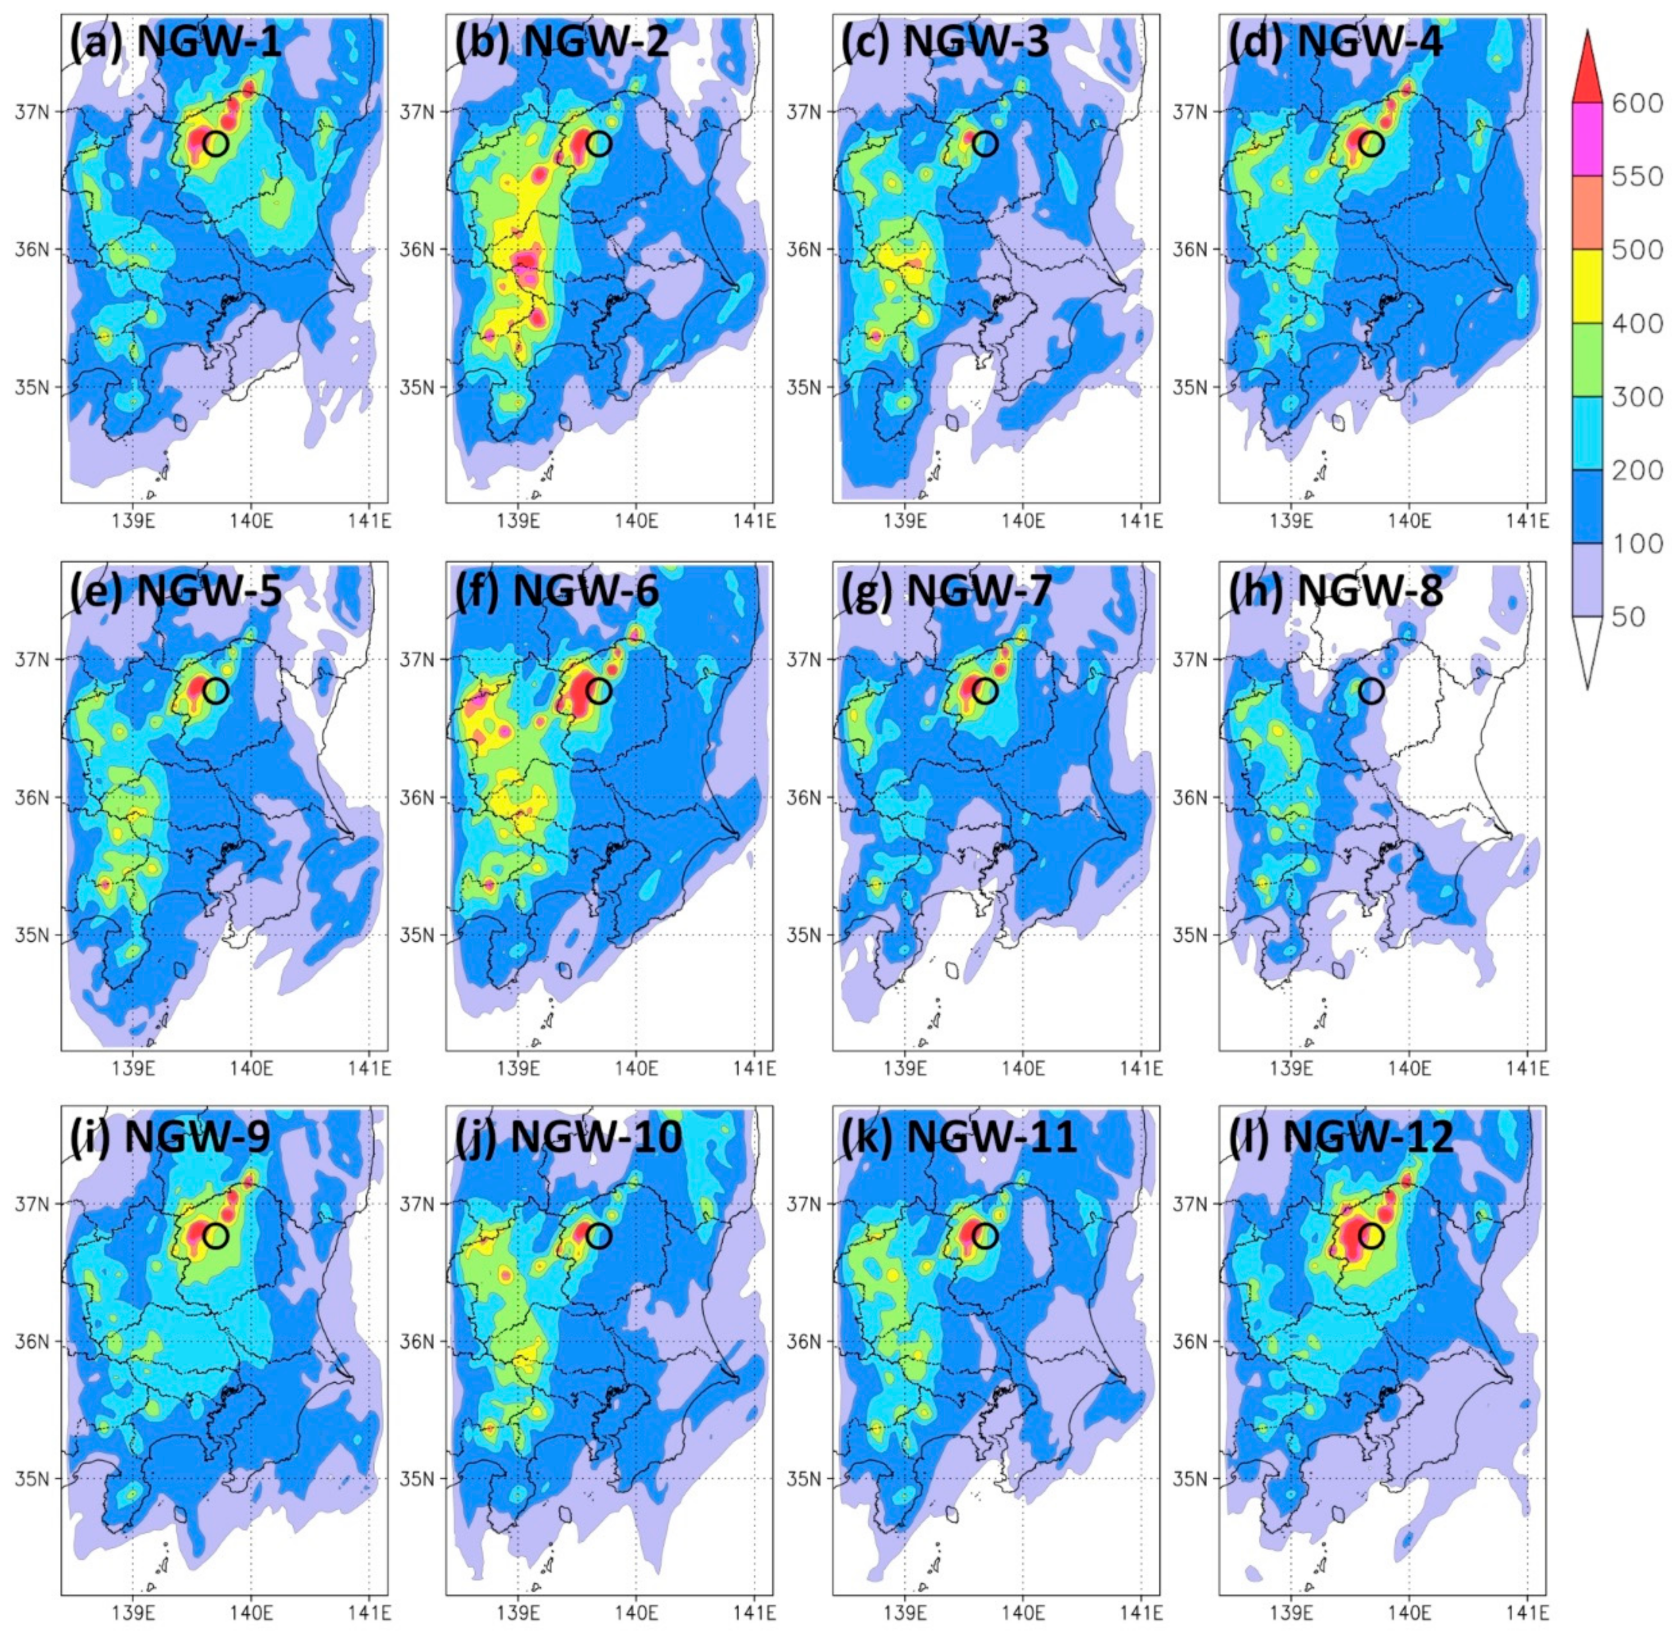
Figure 6.
Spatial distribution of the ensemble mean total rainfall in D03 for non-global warming (NGW) simulations. Result of (a) NGW-1, (b) NGW-2, (c) NGW-3, (d) NGW-4, (e) NGW-5, (f) NGW-6, (g) NGW-7, (h) NGW-8, (i) NGW-9, (j) NGW-10, (k) NGW-11, (l) NGW-12. The unit of the color bar is mm. Open circle indicates the location of the Nikko city.
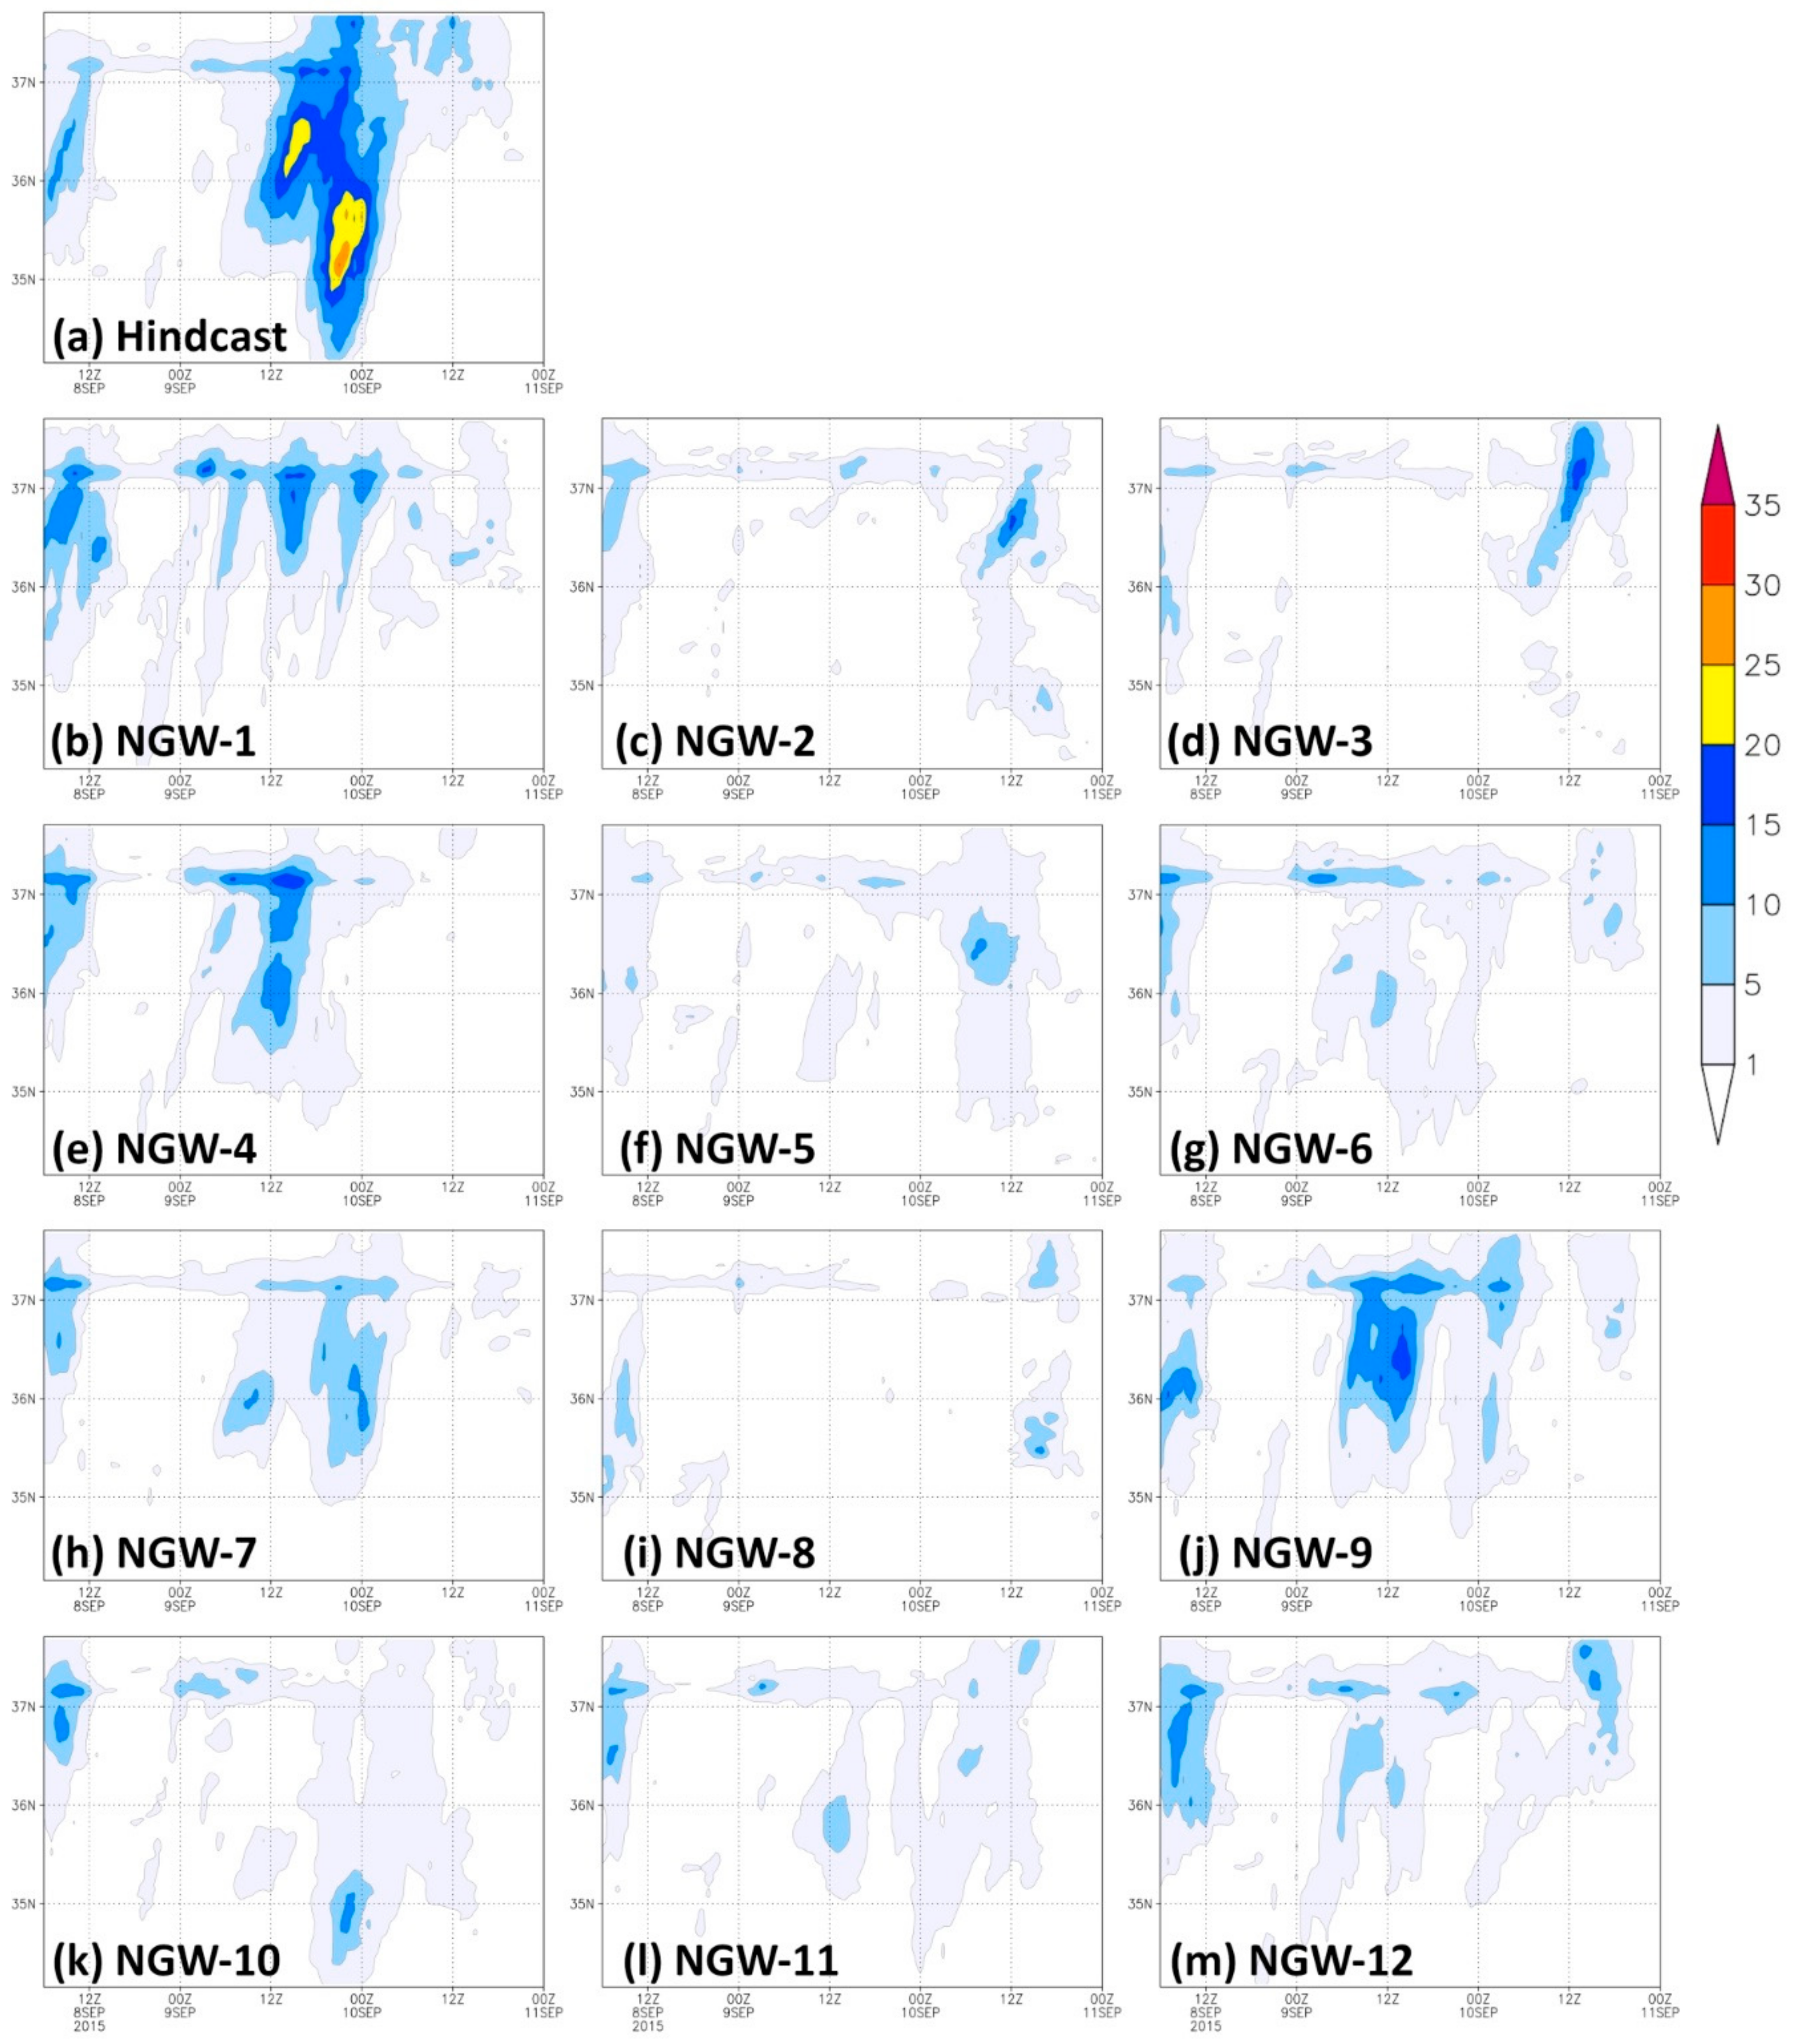
Figure 7.
Latitude-time cross section of hourly rainfall averaged for the 139.9° E–140.1° E band. Ensemble mean values are shown for each panel. Result of (a) hindcastm, (b) NGW-1, (c) NGW-2, (d) NGW-3, (e) NGW-4, (f) NGW-5, (g) NGW-6, (h) NGW-7, (i) NGW-8, (j) NGW-9, (k) NGW-10, (l) NGW-11, (m) NGW-12. The unit of the color bar is mm/h.
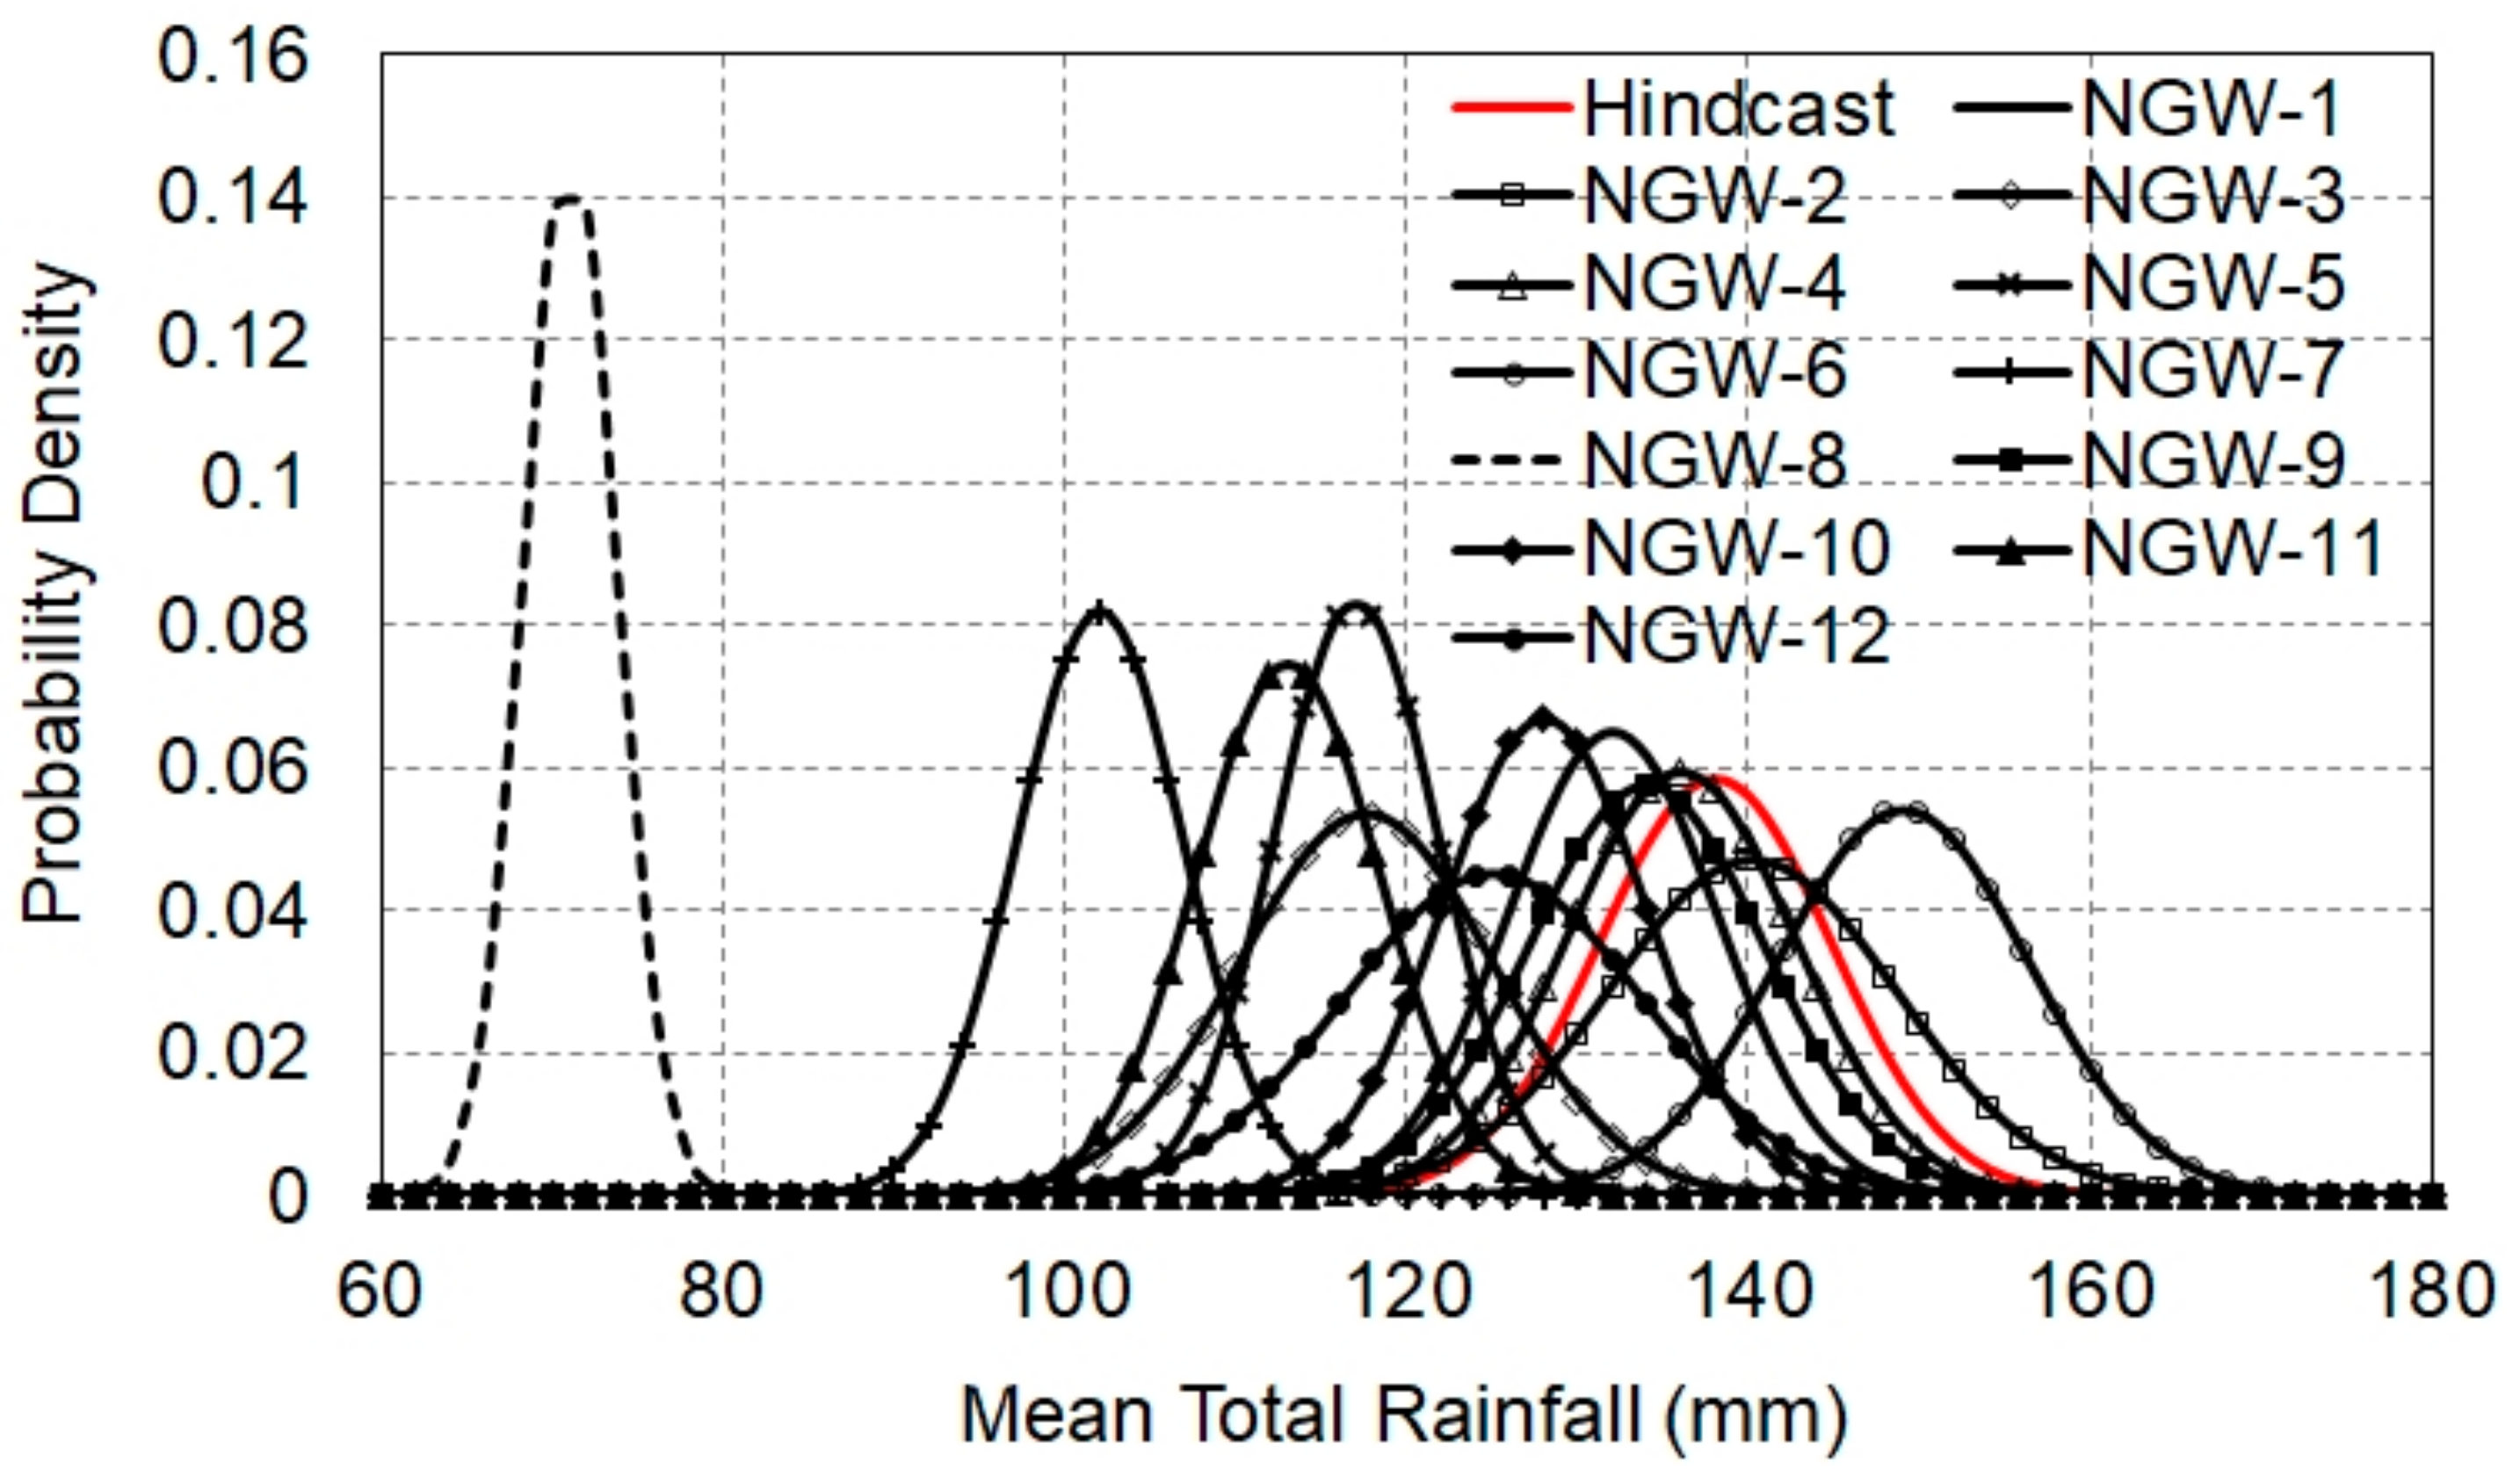
Figure 8.
Probability density curves of the mean total rainfall for D03 (RT,3). The horizontal axis is RT,3 (mm). The vertical axis is the probability density.
Figure 8.
Probability density curves of the mean total rainfall for D03 (RT,3). The horizontal axis is RT,3 (mm). The vertical axis is the probability density.
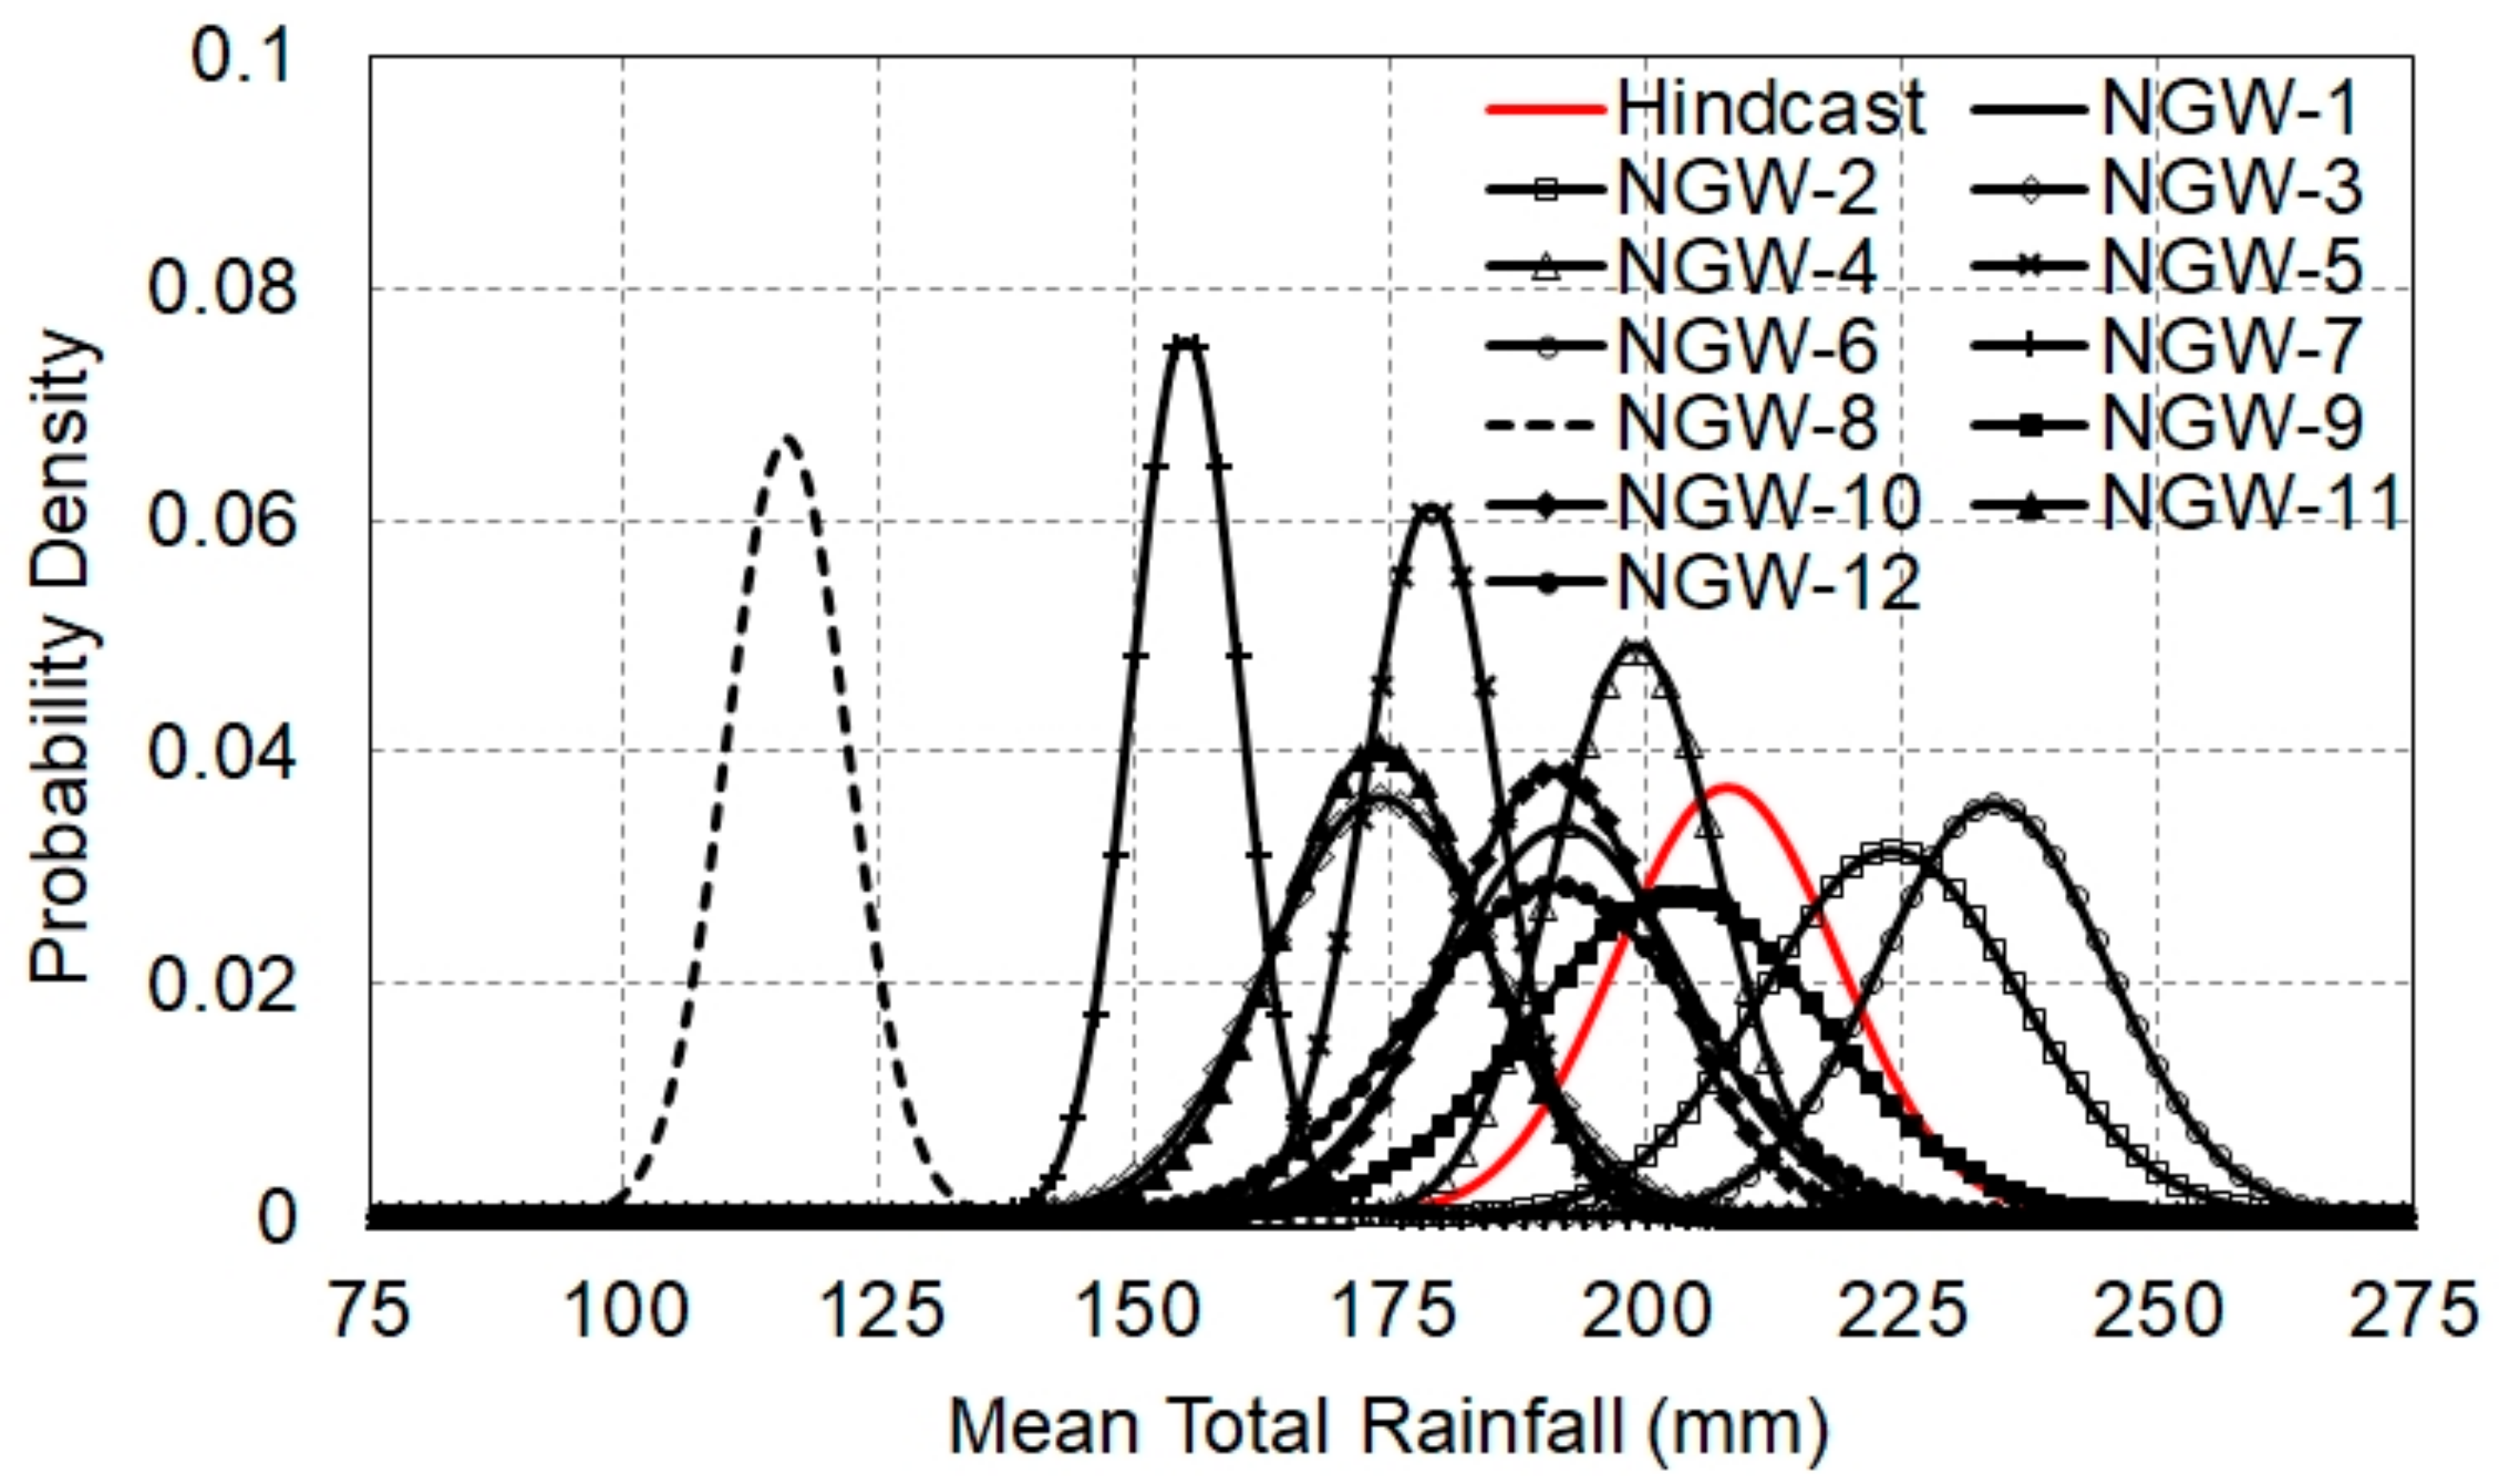
Figure 9.
Probability density curves of the mean total rainfall for area A (RT,A). The horizontal axis is RT,3 (mm). The vertical axis is the probability density.
Figure 9.
Probability density curves of the mean total rainfall for area A (RT,A). The horizontal axis is RT,3 (mm). The vertical axis is the probability density.
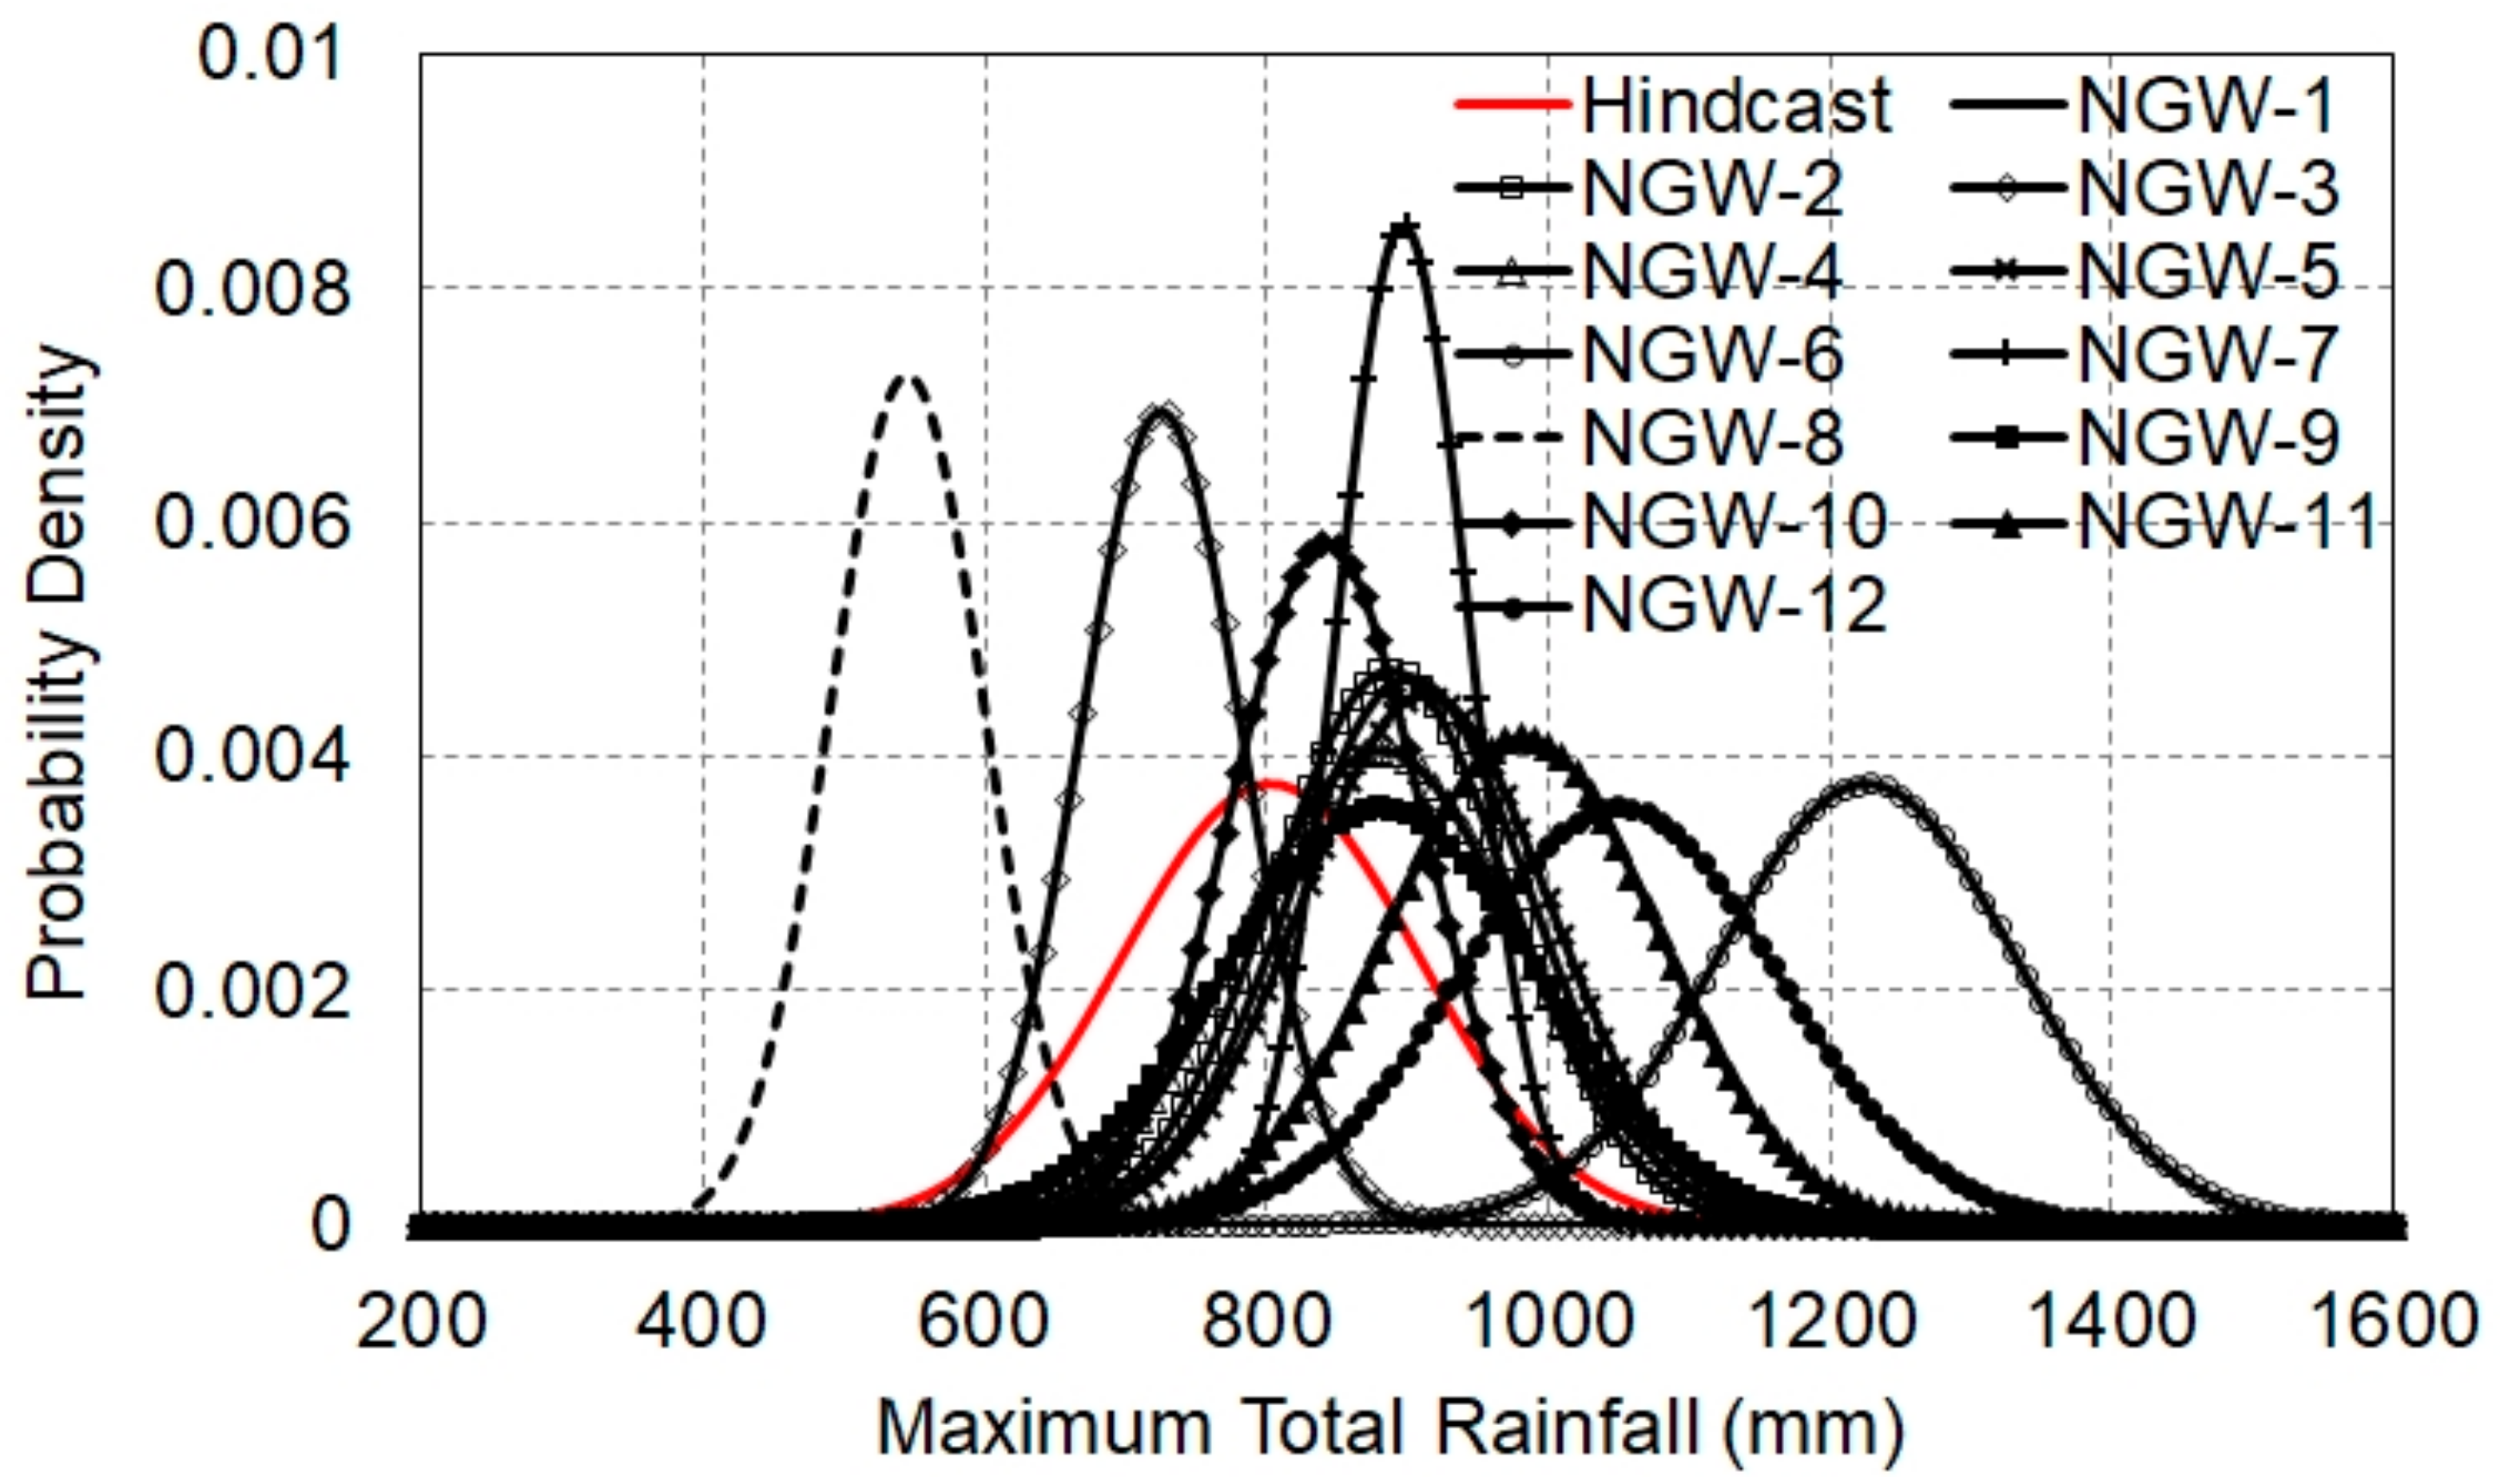
Figure 10.
Probability density curves of the maximum total rainfall in D03 (RMAX). The horizontal axis is RMAX (mm). The vertical axis is the probability density.
Figure 10.
Probability density curves of the maximum total rainfall in D03 (RMAX). The horizontal axis is RMAX (mm). The vertical axis is the probability density.
Figure 11.
Difference in atmospheric temperature 2 m above the Earth’s surface under initial conditions between each NGW simulation and the hindcast. Result (a) NGW-1, (b) NGW-2, (c) NGW-3, (d) NGW-4, (e) NGW-5, (f) NGW-6, (g) NGW-7, (h) NGW-8, (i) NGW-9, (j) NGW-10, (k) NGW-11, (l) NGW-12. The unit of the color bar is Kelvin.
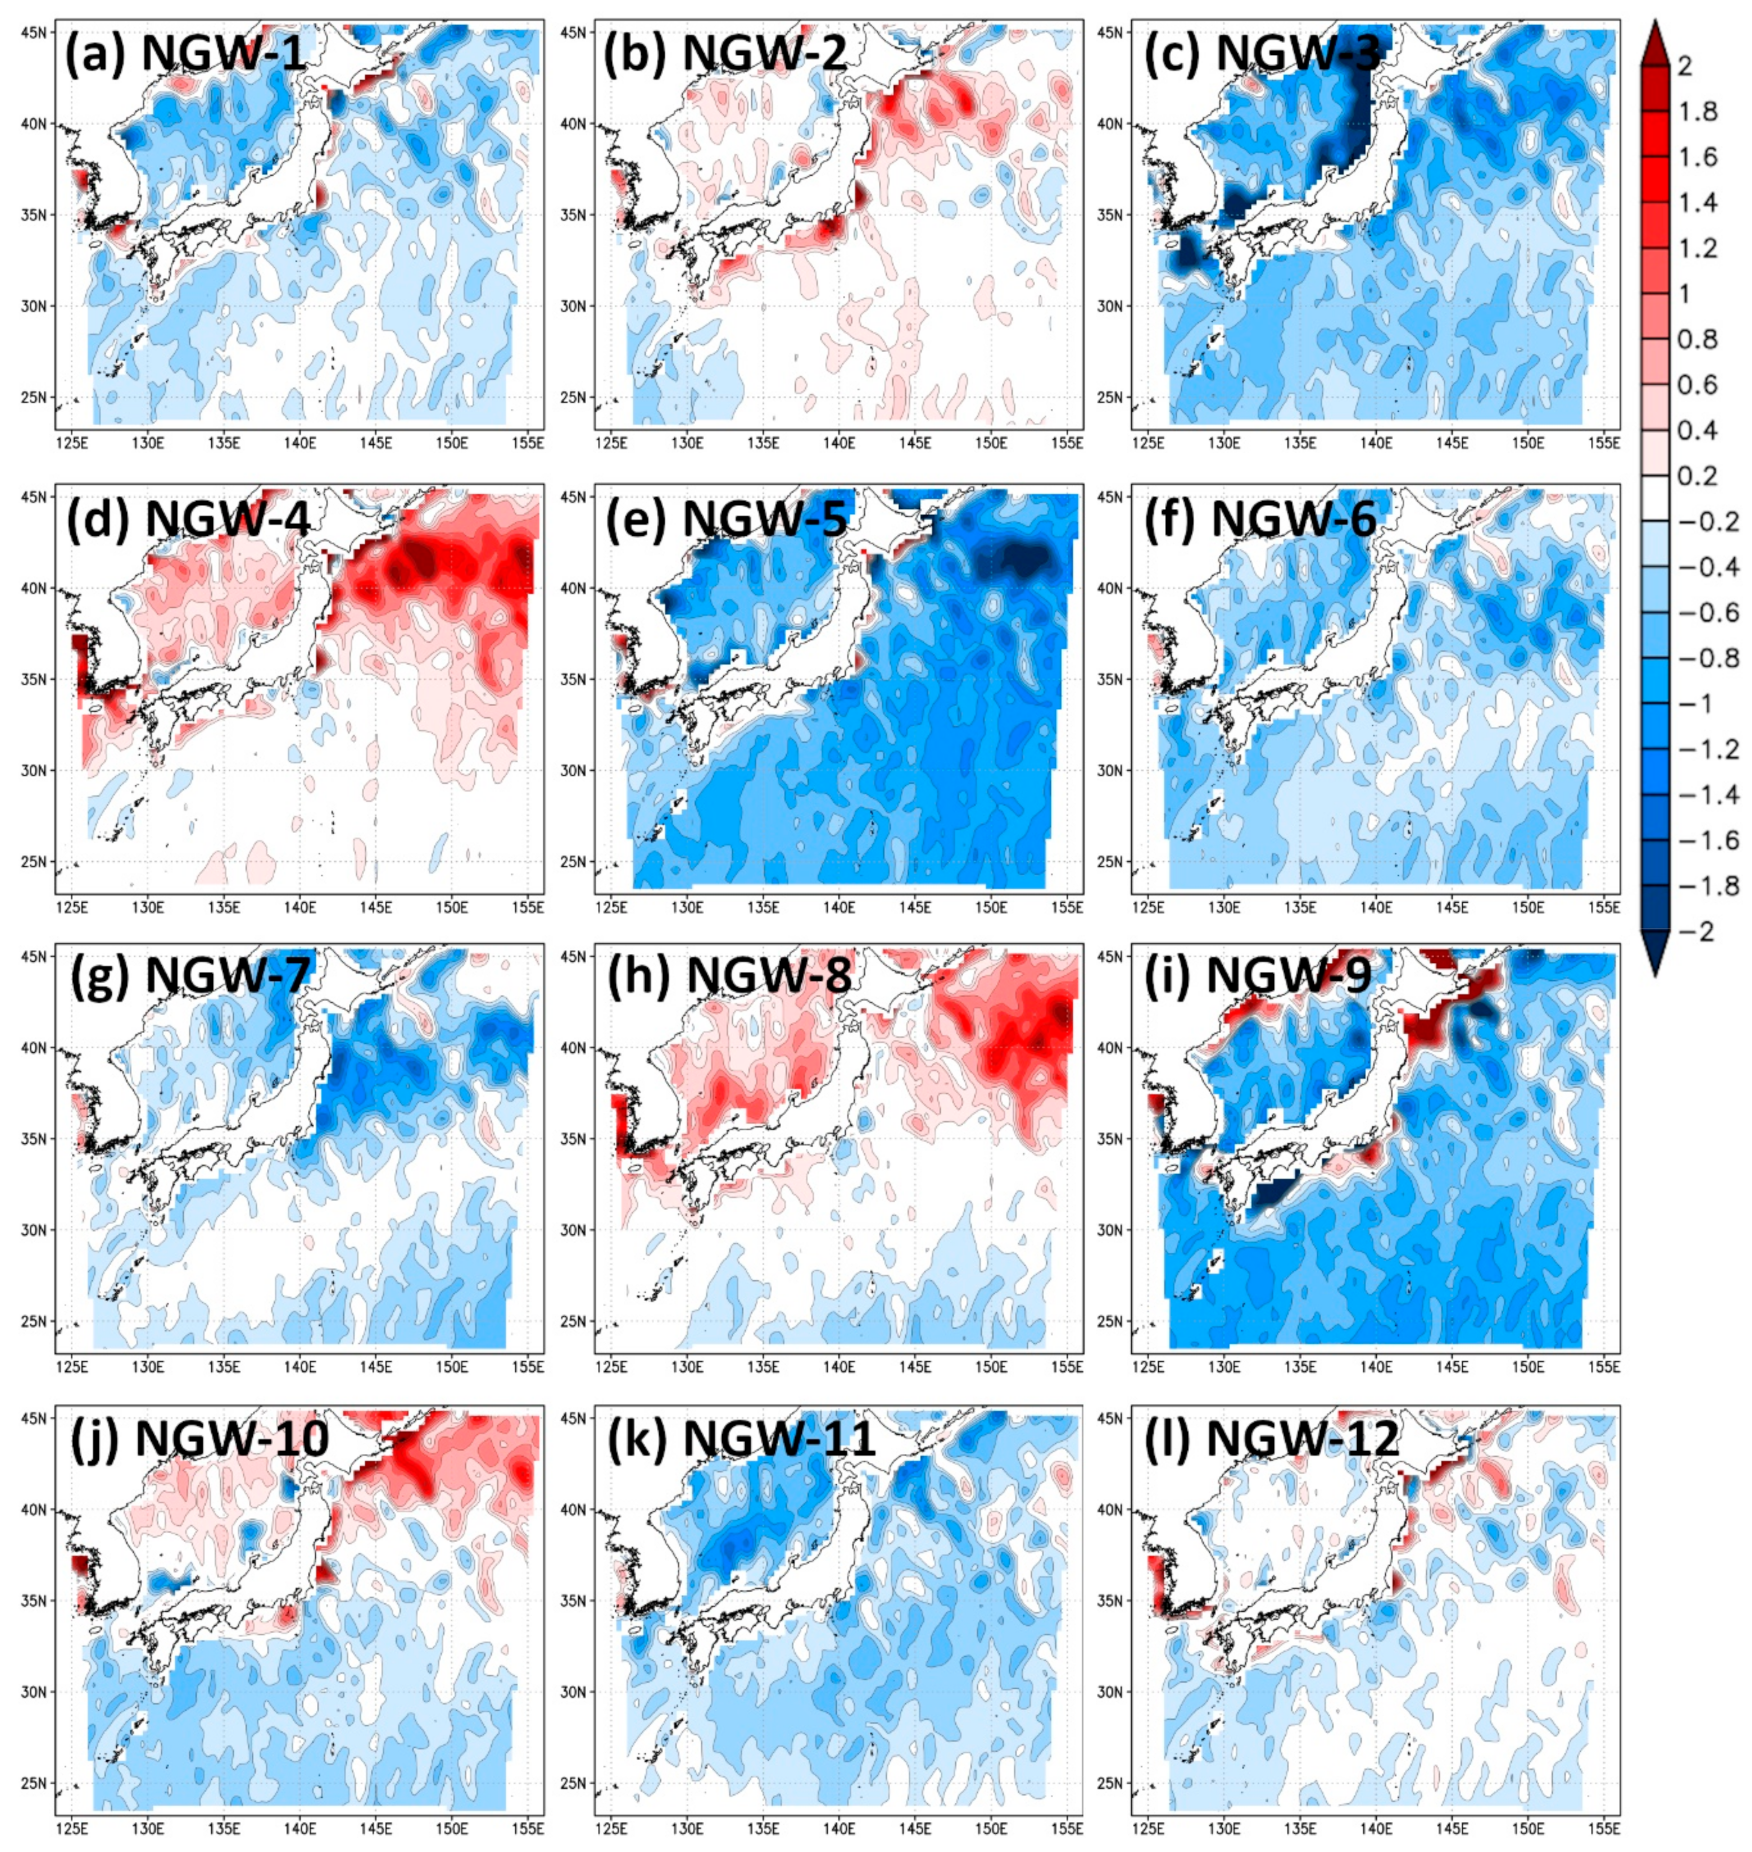
Figure 12.
Difference in sea surface temperature (SST) under initial conditions between each NGW simulation and the hindcast. Result of (a) NGW-1, (b) NGW-2, (c) NGW-3, (d) NGW-4, (e) NGW-5, (f) NGW-6, (g) NGW-7, (h) NGW-8, (i) NGW-9, (j) NGW-10, (k) NGW-11, (l) NGW-12. The unit of the color bar is Kelvin.
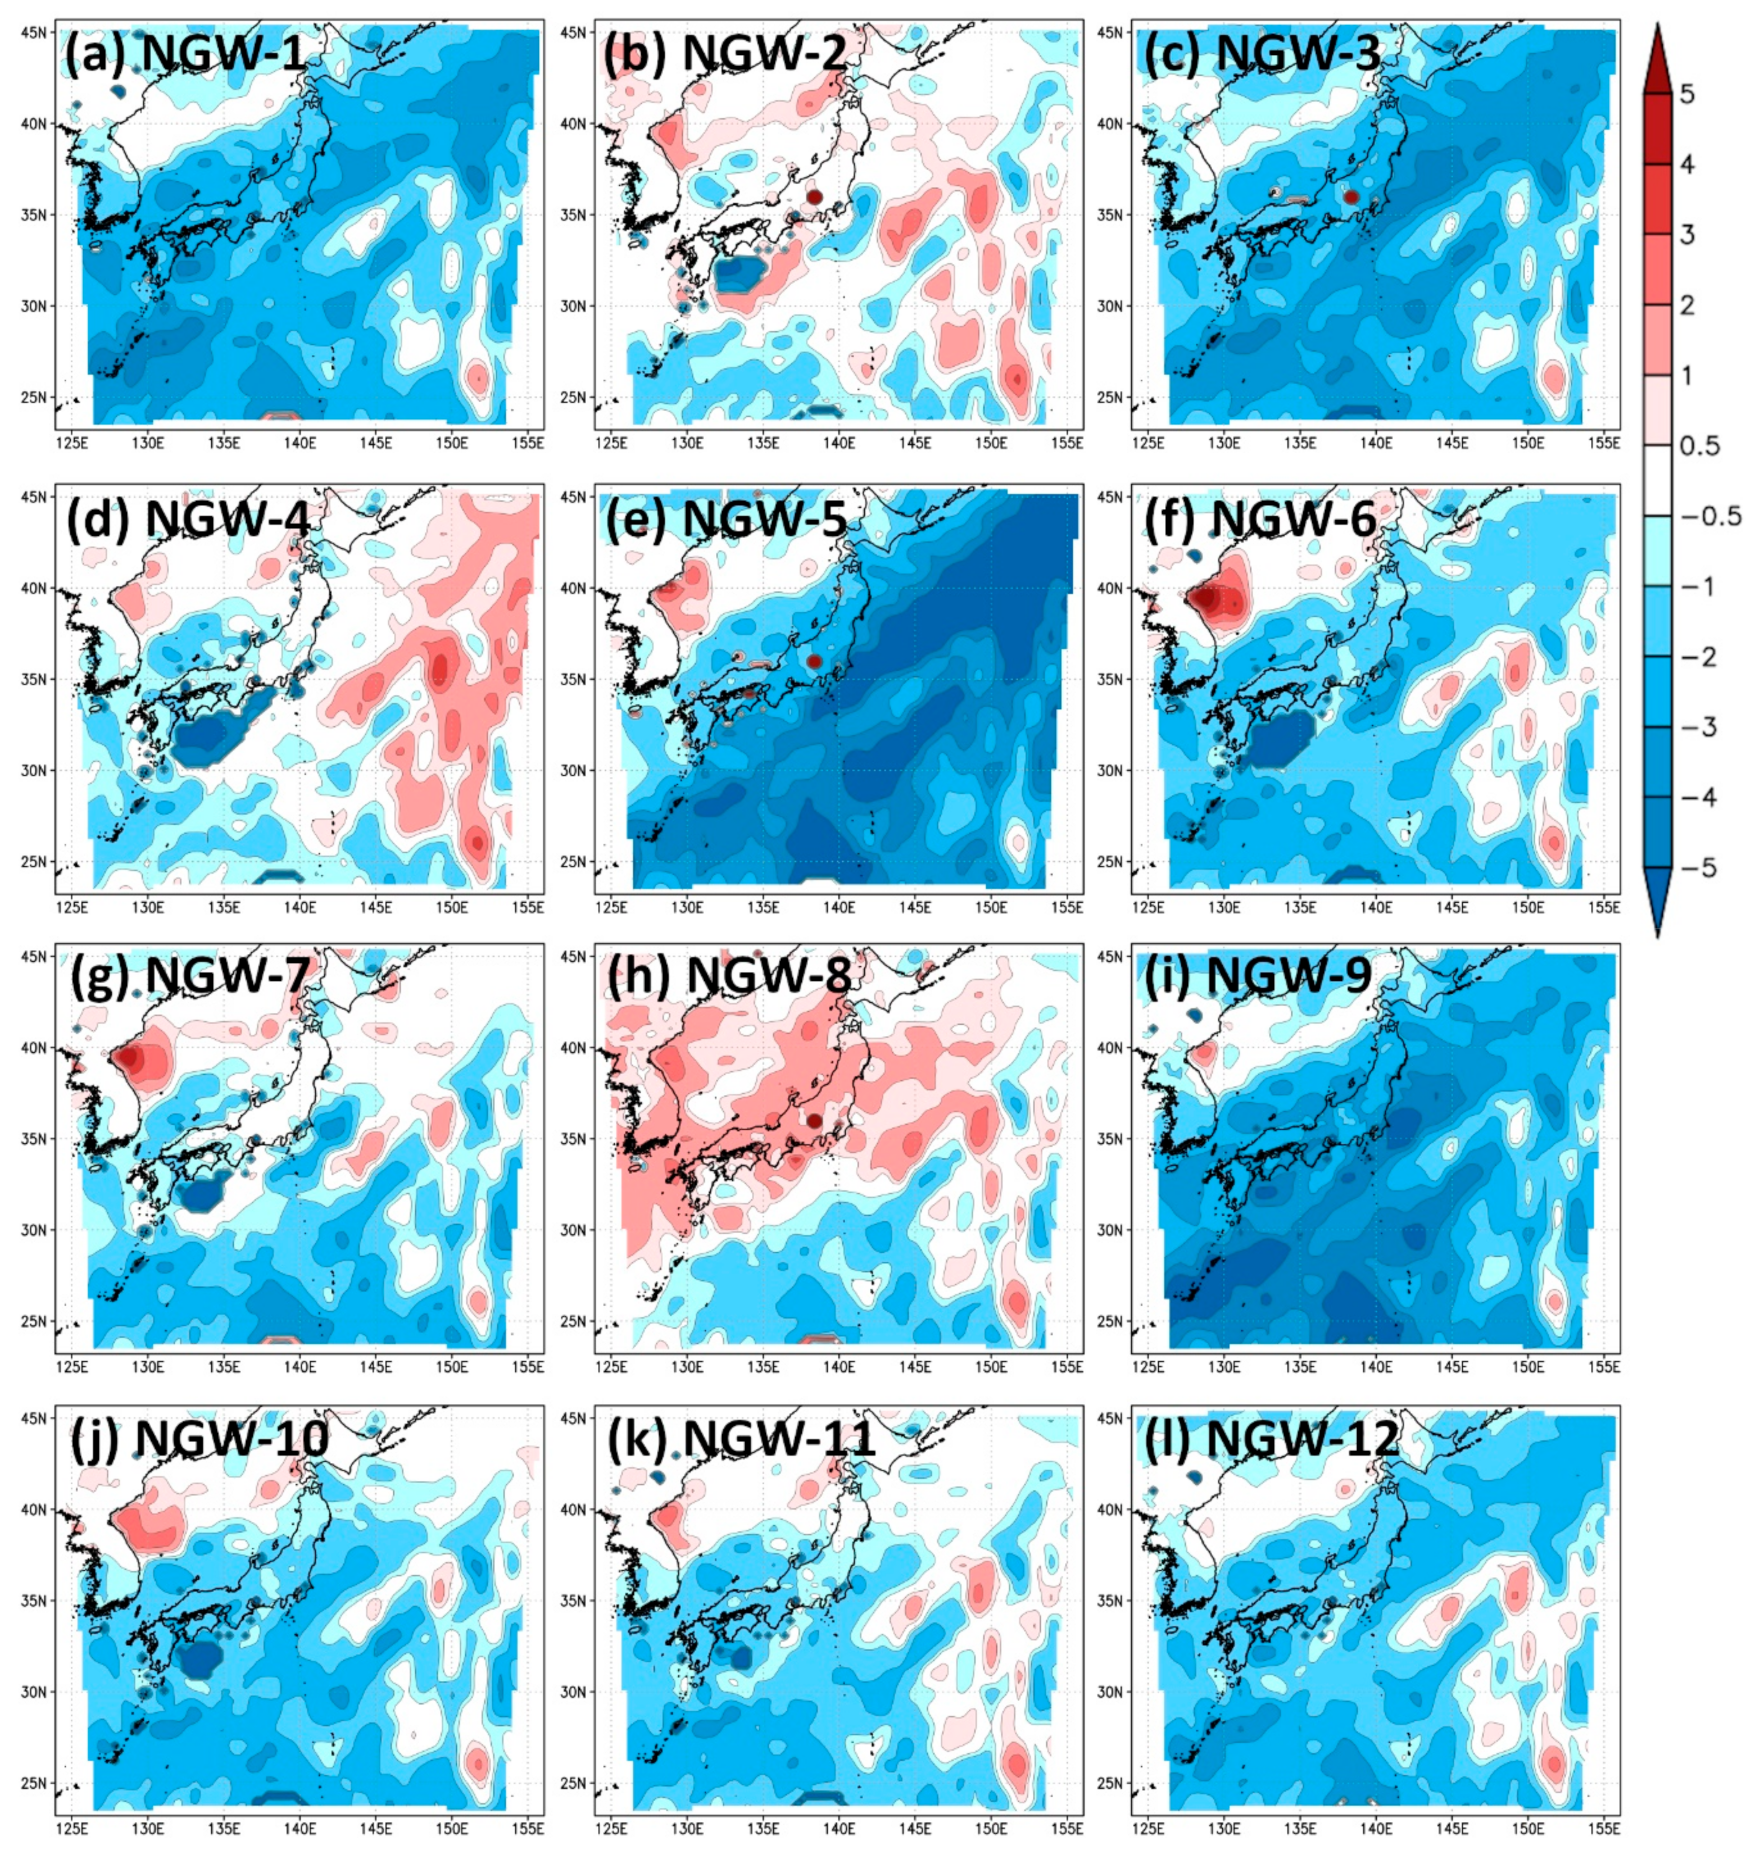
Figure 13.
Difference in precipitable water content (PWC) under initial conditions between each NGW simulation and the hindcast. Result (a) NGW-1, (b) NGW-2, (c) NGW-3, (d) NGW-4, (e) NGW-5, (f) NGW-6, (g) NGW-7, (h) NGW-8, (i) NGW-9, (j) NGW-10, (k) NGW-11, (l) NGW-12. The unit of the color bar is mm.
Figure 14.
Difference in PWC at 18 UTC 9 September between each NGW simulation and the hindcast. Result of (a) NGW-1, (b) NGW-2, (c) NGW-3, (d) NGW-4, (e) NGW-5, (f) NGW-6, (g) NGW-7, (h) NGW-8, (i) NGW-9, (j) NGW-10, (k) NGW-11, (l) NGW-12. The unit of the color bar is mm.
Figure 14.
Difference in PWC at 18 UTC 9 September between each NGW simulation and the hindcast. Result of (a) NGW-1, (b) NGW-2, (c) NGW-3, (d) NGW-4, (e) NGW-5, (f) NGW-6, (g) NGW-7, (h) NGW-8, (i) NGW-9, (j) NGW-10, (k) NGW-11, (l) NGW-12. The unit of the color bar is mm.
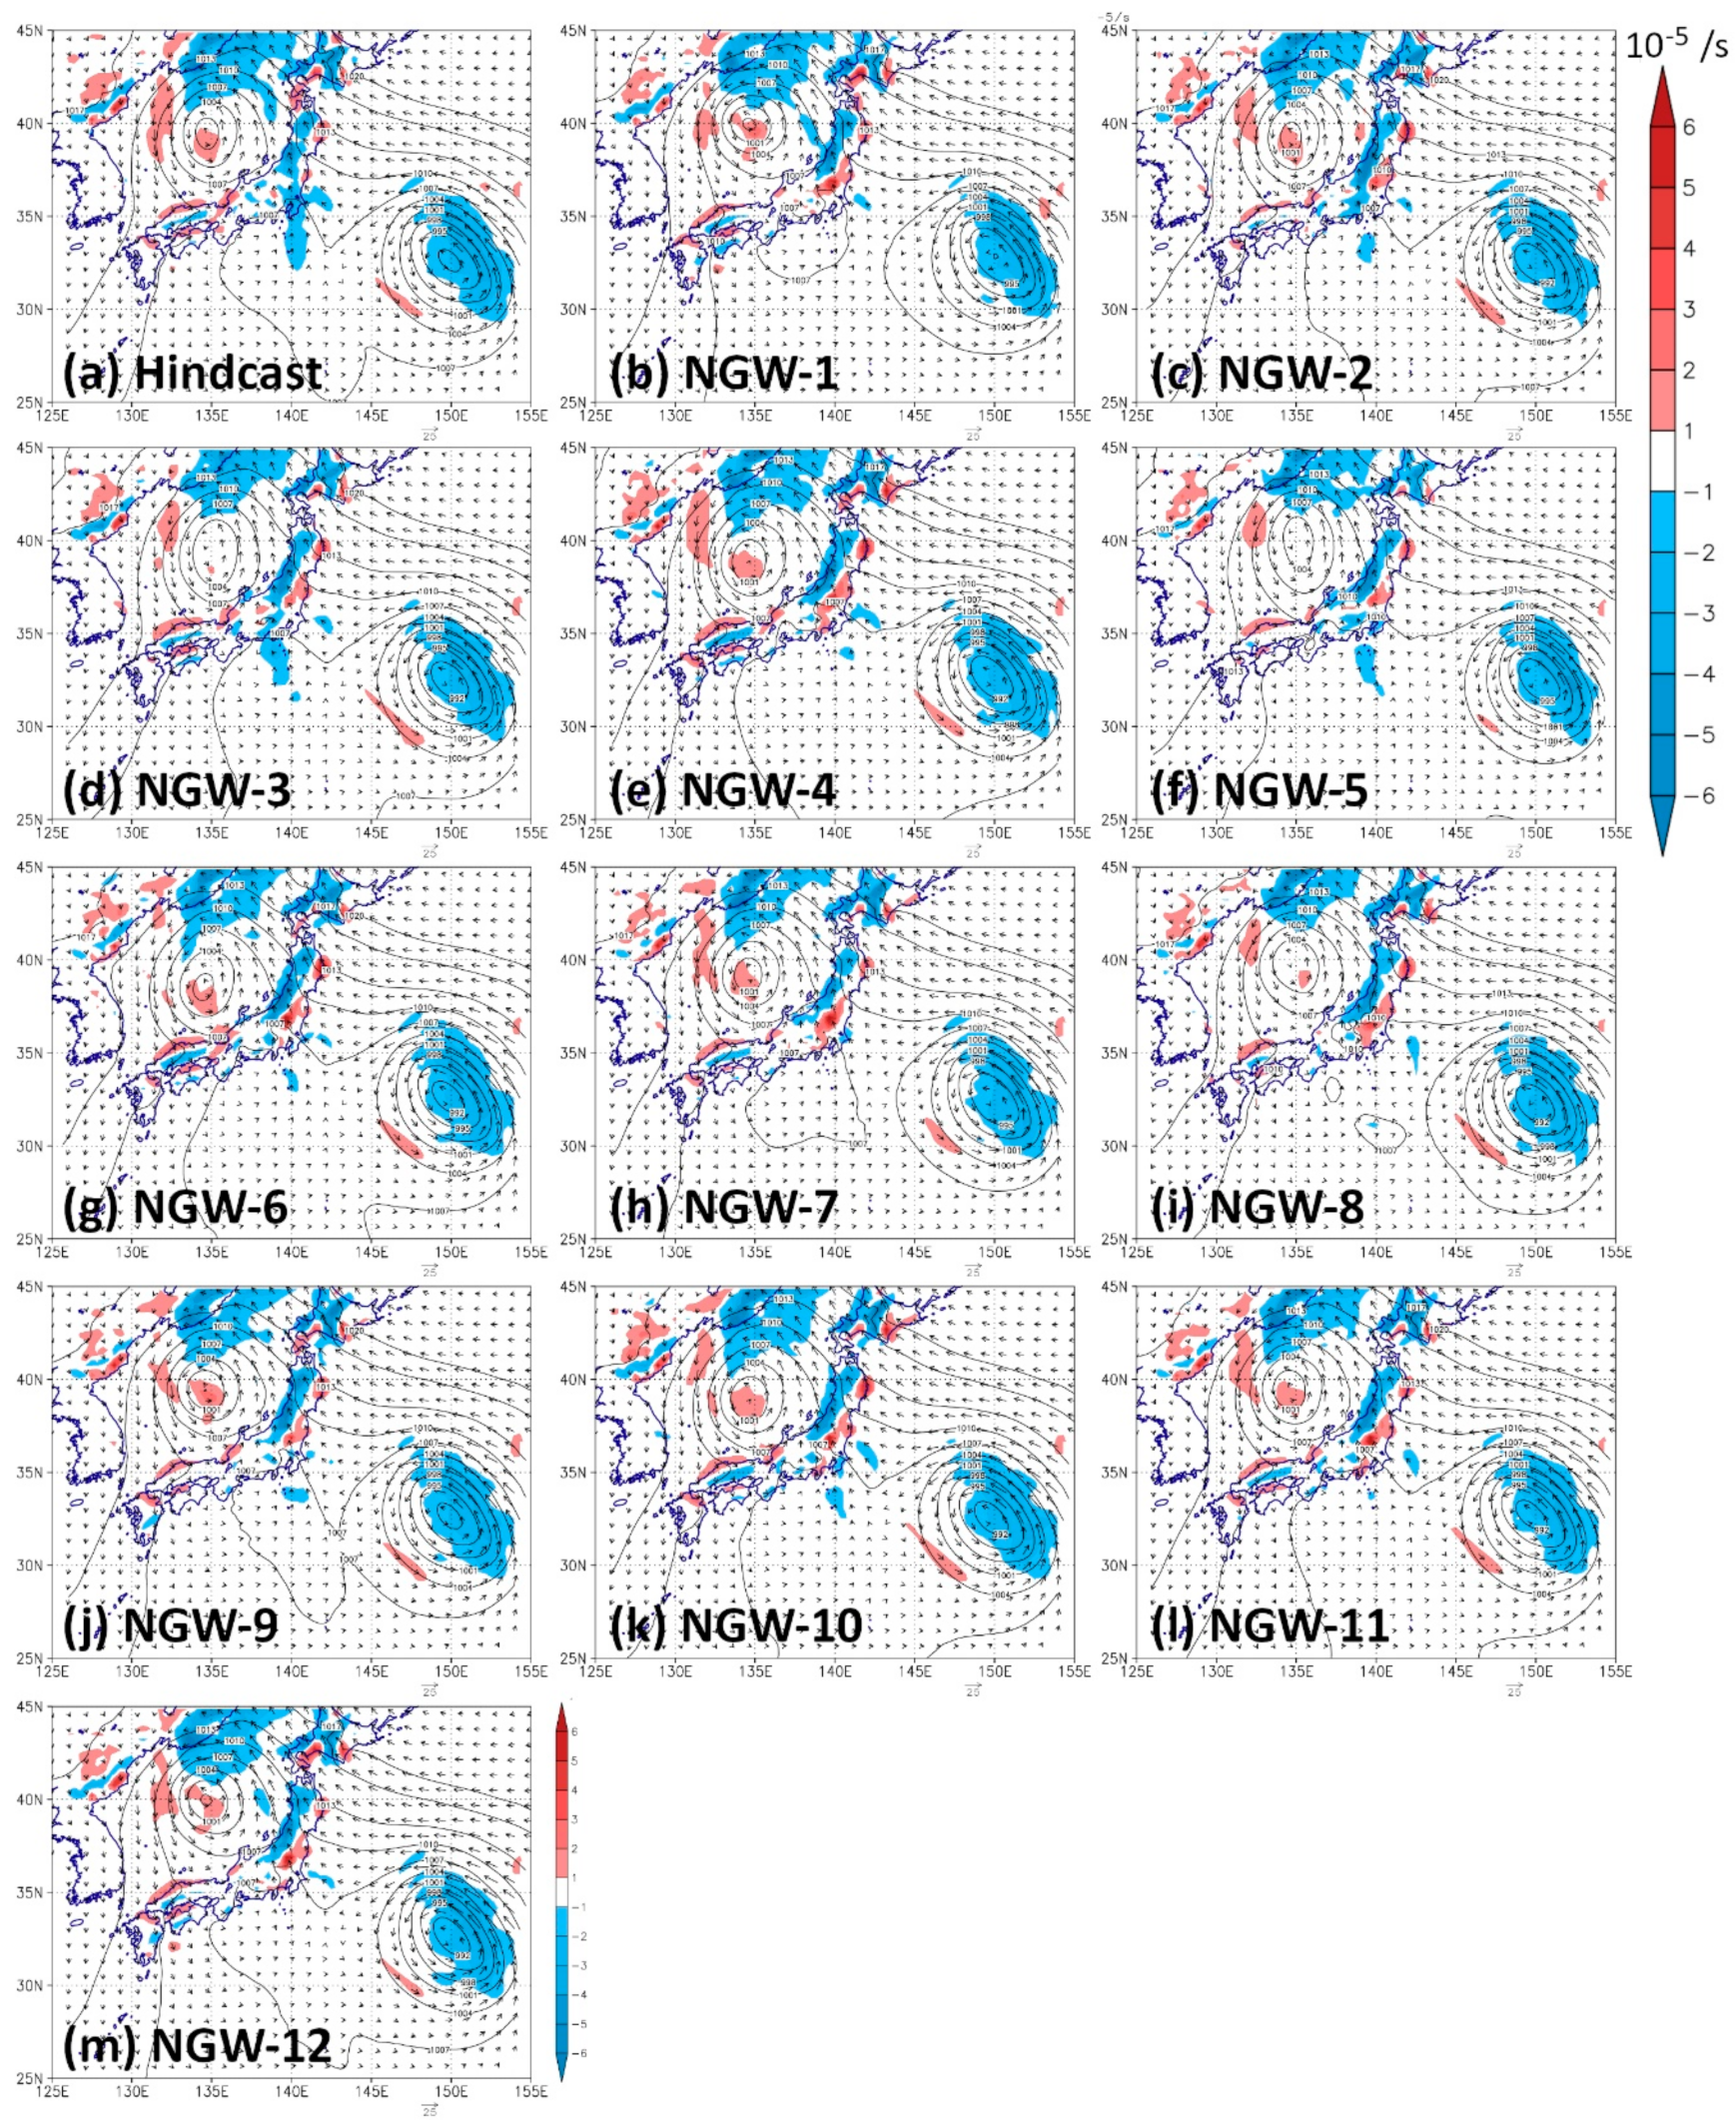
Figure 15.
Spatial distribution of divergence (shaded), wind (arrows), and sea level pressure (contours) at 18 UTC 9 September. Divergence and wind are averaged for the layers from 1000 to 700 hPa. Result (a) hindcast, (b) NGW-1, (c) NGW-2, (d) NGW-3, (e) NGW-4, (f) NGW-5, (g) NGW-6, (h) NGW-7, (i) NGW-8, (j) NGW-9, (k) NGW-10, (l) NGW-11, (m) NGW-12. The unit of the color bar is 10−5 /s.
Table 1.
CMIP5 models used in this study. Data resolution information is obtained from [
18].
Table 1.
CMIP5 models used in this study. Data resolution information is obtained from [
18].
| Number | IPCC ID | Institute and Country | Resolution (Lat × Lon) |
|---|
| 1 | CNRM-CM5 | Meteo-France, Centre Nationale de RecherchesMeteorologique (France) | 1.4008° × 1.40625° |
| 2 | CSIRO-Mk3-6-0 | The Commonwealth Scientific and Industrial Research Organisation and Queensland Climate Change Centre of Excellence (Australia) | 1.8653° × 1.875° |
| 3 | CanESM2 | Canadian Centre for Climate Modelling and Analysis (Canada) | 2.7906° × 2.8125° |
| 4 | GFDL-CM3 | Geophysical Fluid Dynamics Laboratory (USA) | 2.0° × 2.5° |
| 5 | GFDL-ESM2M | Geophysical Fluid Dynamics Laboratory (USA) | 2.02255° × 2.5° |
| 6 | GISS-E2-H | NASA/Goddard Institute for Space Studies (USA) | 2.0° × 2.5° |
| 7 | GISS-E2-R | NASA/Goddard Institute for Space Studies (USA) | 2.0° × 2.5° |
| 8 | HadGEM2-ES | UK Met Office Hadley Center (UK) | 1.25° × 1.875° |
| 9 | IPSL-CM5A-MR | Institute Pierre Simon Laplace (France) | 1.2676° × 2.5° |
| 10 | MIROC-ESM | Center for Climate System Research (the University of Tokyo), National Institute for Environmental Studies, and Frontier Research Center for Global Change (Japan) | 2.7906° × 2.8125° |
| 11 | MRI-CGCM3 | Meteorological Research Institute, Japan Meteorological Agency (Japan) | 1.12148° × 1.125° |
| 12 | NorESM1-M | Norwegian Climate Centre (Norway) | 1.8947° × 2.5° |
Table 2.
Settings of the weather research and forecasting (WRF) simulations.
Table 2.
Settings of the weather research and forecasting (WRF) simulations.
| Item | Setting |
|---|
| Model version | 3.7.1 |
| Cloud microphysics | WRF single-moment 5 class scheme |
| Cumulus parameterization | Simplified Arakawa-Schubert scheme |
| Longwave and shortwave radiation | RRTM |
| Land surface scheme | Eta model |
| Land model | Noah land surface model |
| Planetary boundary layer scheme | Mellor-Yamada-Janjic |
| Settings of spectral nudging | Applied to the layer above 6–7 km for atmospheric temperature, zonal and meridional winds, and geopotential height |
Table 3.
Combination of scale factors (α and β) to produce the ensemble members in the lagged-simulated perturbation (LSP) method.
Table 3.
Combination of scale factors (α and β) to produce the ensemble members in the lagged-simulated perturbation (LSP) method.
| Combinations of Scale Factors (α and β) |
|---|
| (−1/3, 1/3) | (−1/3, 2/3) | (−1/3, 1) | (0, 1/3) |
| (0, 2/3) | (1/3, −1/3) | (1/3, 0) | (1/3, 1/3) |
| (1/3, 2/3) | (1/3, 1) | (2/3, −1/3) | (2/3, 0) |
| (2/3, 1/3) | (2/3, 2/3) | (1, −1/3) | (1, 1/3) |
Table 4.
Initial and interruption times of the WRF simulation.
Table 4.
Initial and interruption times of the WRF simulation.
| Run | Initial Time | Interruption Time (Generating New Ensemble Members) | End of Simulation |
|---|
| Run to make S1 | 00 UTC 7 September | 00 UTC 8 September | 00 UTC 11 September |
| Run to make S2 | 06 UTC 7 September |
| Run to make S3 | 12 UTC 7 September |
Table 5.
Total rainfall averaged for D03 (RT,3).
Table 5.
Total rainfall averaged for D03 (RT,3).
| Run | Average 1 (mm) | Max 2 (mm) | Min 3 (mm) | Standard Deviation (mm) |
|---|
| Hindcast | 138 | 154 | 128 | 6.8 |
| NGW-1 | 132 (−6) | 142 (−12) | 119 (−9) | 6.1 (−0.7) |
| NGW-2 | 123 (−15) | 136 (−18) | 108 (-20) | 7.2 (+0.4) |
| NGW-3 | 122 (−16) | 134 (−20) | 104 (−24) | 7.4 (+0.6) |
| NGW-4 | 136 (−2) | 147 (−7) | 122 (−6) | 6.7 (−0.1) |
| NGW-5 | 117 (−21) | 124 (−30) | 106 (−22) | 4.8 (−2.0) |
| NGW-6 | 149 (+11) | 167 (+13) | 136 (+8) | 7.4 (+0.6) |
| NGW-7 | 102 (−18) | 111 (−43) | 91 (−37) | 4.9 (−1.9) |
| NGW-8 | 71 (−67) | 77 (−77) | 66 (−62) | 2.7 (4.1) |
| NGW-9 | 134 (−4) | 146 (−8) | 122 (−6) | 6.9 (+0.1) |
| NGW-10 | 128 (−10) | 140 (−14) | 118 (−10) | 5.9 (−0.9) |
| NGW-11 | 113 (−25) | 126 (−18) | 102 (−26) | 5.4 (−1.4) |
| NGW-12 | 125 (−13) | 237 (+84) | 107 (−21) | 8.8 (+2.0) |
Table 6.
Total rainfall averaged for the area A (RT,A).
Table 6.
Total rainfall averaged for the area A (RT,A).
| Run | Average 1 (mm) | Max 2 (mm) | Min 3 (mm) | Standard Deviation (mm) |
|---|
| Hindcast | 208 | 228 | 181 | 10.8 |
| NGW-1 | 192 (−16) | 214 (−14) | 172 (−9) | 11.9 (+1.1) |
| NGW-2 | 199 (−9) | 222 (−6) | 178 (−3) | 13.7 (+2.9) |
| NGW-3 | 183 (−25) | 204 (−24) | 158 (−23) | 11.1 (+0.3) |
| NGW-4 | 199 (−9) | 215 (−13) | 186 (+5) | 8.1 (−2.7) |
| NGW-5 | 179 (−29) | 193 (-35) | 163 (−18) | 6.5 (−4.3) |
| NGW-6 | 234 (+26) | 261 (+33) | 220 (+39) | 11.2 (+0.4) |
| NGW-7 | 155 (−53) | 167 (−61) | 144 (−37) | 5.2 (−5.6) |
| NGW-8 | 116 (−92) | 129 (−99) | 102 (−79) | 6.0 (−4.8) |
| NGW-9 | 203 (−5) | 228 (0) | 180 (−1) | 14.4 (+3.6) |
| NGW-10 | 191 (−17) | 213 (−15) | 176 (−5) | 10.5 (−0.3) |
| NGW-11 | 174 (−34) | 200 (−28) | 160 (−21) | 9.9 (−0.9) |
| NGW-12 | 191 (−17) | 216 (−12) | 160 (−21) | 14.0 (+3.2) |
Table 7.
Ensemble mean values of the maximum hourly and 24-h rainfall.
Table 7.
Ensemble mean values of the maximum hourly and 24-h rainfall.
| Run | Hourly Rainfall | 24-h Rainfall |
|---|
| Hindcast | 120 | 554 |
| NGW-1 | 118 (−2) | 506 * (−48) |
| NGW-2 | 133 * (+13) | 584 (+30) |
| NGW-3 | 119 (−1) | 406 * (−148) |
| NGW-4 | 115 (−5) | 543 (−11) |
| NGW-5 | 105 * (−15) | 493 * (−61) |
| NGW-6 | 101 * (−19) | 706 * (+152) |
| NGW-7 | 92 * (−28) | 517 (−37) |
| NGW-8 | 110 (−10) | 362 * (−192) |
| NGW-9 | 100 * (−20) | 581 (+27) |
| NGW-10 | 102 * (−18) | 514 (−40) |
| NGW-11 | 111 (−9) | 580 (+26) |
| NGW-12 | 127 (+7) | 540 (−14) |
Table 8.
The maximum total rainfall in D03 (RMAX).
Table 8.
The maximum total rainfall in D03 (RMAX).
| Run | Average 1 (mm) | Max 2 (mm) | Min 3 (mm) | Standard Deviation (mm) |
|---|
| Hindcast | 803 | 976 | 624 | 106 |
| NGW-1 | 902 (+99) | 1102 (+126) | 747 (+123) | 85 (−21) |
| NGW-2 | 891 (+88) | 1071 (+95) | 790 (+166) | 88 (−18) |
| NGW-3 | 742 (−61) | 878 (−98) | 639 (+15) | 66 (−40) |
| NGW-4 | 881 (+78) | 1061 (+85) | 748 (+124) | 98 (−8) |
| NGW-5 | 913 (+110) | 1183 (+207) | 806 (+182) | 88 (−18) |
| NGW-6 | 1226 (+423) | 1391 (+415) | 1002 (+378) | 106 (0) |
| NGW-7 | 897 (+94) | 970 (−6) | 783 (+159) | 47 (−59) |
| NGW-8 | 545 (−258) | 670 (−306) | 433 (−191) | 55 (−51) |
| NGW-9 | 881 (+78) | 1114 (+138) | 686 (+62) | 112 (+6) |
| NGW-10 | 842 (+39) | 999 (+23) | 746 (+122) | 69 (−37) |
| NGW-11 | 984 (+181) | 1107 (+131) | 787 (+163) | 96 (−10) |
| NGW-12 | 1080 (+277) | 1232 (+256) | 860 (+236) | 112 (+6) |
Table 9.
Spatial mean PWC and divergence for area A at 18 UTC 9 September. Values in parentheses are the difference between each NGW simulation and the hindcast. The result values are the ensemble mean for the hindcast and each NGW simulation.
Table 9.
Spatial mean PWC and divergence for area A at 18 UTC 9 September. Values in parentheses are the difference between each NGW simulation and the hindcast. The result values are the ensemble mean for the hindcast and each NGW simulation.
| Run | PWC (mm) | Divergence (10−5/s) |
|---|
| Hindcast | 40.3 | −1.05 |
| NGW-1 | 35.6 (−4.7) | 0.88 (+1.93) |
| NGW-2 | 43.7 (+3.4) | −1.23 (−0.17) |
| NGW-3 | 39.8 (−0.5) | −0.70 (+0.36) |
| NGW-4 | 40.1 (−0.2) | 0.69 (+1.74) |
| NGW-5 | 40.7 (+0.4) | −0.59 (+0.46) |
| NGW-6 | 43.8 (+3.5) | 0.04 (+1.09) |
| NGW-7 | 36.2 (−4.1) | 1.07 (+2.12) |
| NGW-8 | 36.2 (−4.1) | 0.63 (+1.67) |
| NGW-9 | 38.9 (−1.4) | −0.15 (+0.90) |
| NGW-10 | 42.2 (+1.9) | 0.20 (+1.25) |
| NGW-11 | 41.5 (+1.2) | 0.59 (+1.64) |
| NGW-12 | 36.4 (−3.9) | 0.54 (+1.60) |
Table 10.
Ensemble means of the minimum central pressures of typhoons 17 and 18.
Table 10.
Ensemble means of the minimum central pressures of typhoons 17 and 18.
| Run | Typhoon 17 | Typhoon 18 |
|---|
| Hindcast | 977.4 | 988.1 |
| NGW-1 | 978.0 | 989.7 |
| NGW-2 | 976.4 | 987.6 |
| NGW-3 | 976.8 | 987.8 |
| NGW-4 | 976.4 | 985.8 |
| NGW-5 | 979.1 | 990.4 |
| NGW-6 | 977.1 | 985.5 |
| NGW-7 | 978.3 | 988.6 |
| NGW-8 | 976.9 | 992.1 |
| NGW-9 | 977.6 | 988.9 |
| NGW-10 | 977.2 | 987.5 |
| NGW-11 | 977.1 | 989.3 |
| NGW-12 | 976.7 | 988.5 |
