Environmental Effective Assessment of Control Measures Implemented by Clean Air Action Plan (2013–2017) in Beijing, China


1
National Engineering Research Center of Urban Environmental Pollution Control, Beijing Municipal Research Institute of Environmental Protection, Beijing 100037, China
2
College of Resource Environment and Tourism, Capital Normal University, Beijing 100048, China
*
Author to whom correspondence should be addressed.
Atmosphere 2020, 11(2), 189; https://doi.org/10.3390/atmos11020189
Submission received: 21 January 2020
/
Revised: 2 February 2020
/
Accepted: 9 February 2020
/
Published: 11 February 2020
(This article belongs to the Section Air Quality)
Abstract
:The Beijing government initiated the Clean Air Action Plan (CAAP) in 2013. Through a series of actions to control air pollution, the emissions of major atmospheric pollutants are reduced to improve urban air quality. In order to evaluate the effectiveness of control measures taken to mitigate atmospheric pollution, we investigated and analyzed the implementation of the CAAP in Beijing from 2013 to 2017, estimating the corresponding reduction in emissions of major air pollutants. The contribution of different control measures to the improvement of air quality was quantified and the experiences of managing air pollution were summarized, which provided references for the continuous improvement of air quality in Beijing and the surrounding areas. The results showed that the emission of SO2, NOX, PM10, PM2.5, and VOCs from air pollution source have been decreased by 119,924, 116,091, 116,810, 46,652, and 97,267 tons after the implementation of the CAAP. The sum of these five air pollutants emissions have been reduced by 39% in 2017 compared with 2013, the largest decrease in SO2 emissions was 87%, which was related to the vigorous control on coal-fired combustion. The control measure with the greatest contribution to decreasing the ambient PM2.5 concentration was the clean energy transformation of coal-fired power plants, which contributed 27% of the total reduced concentration and 6.1 μg/m3 of the average PM2.5 concentration reduction in Beijing. Clean Residential coal use also significantly decreased the PM2.5 concentration by 5.4 μg/m3, which was 23% of the total reduction. In addition, the industrial restructuring and the management of automotive vehicle use and dust could also contribute to efficiently reducing the PM2.5 concentration by 4.0, 3.2, and 2.3 μg/m3, or 17%, 14%, and 10% of the total reduction, respectively. Due to the implementation of control measures of Clean Air Action Plan, the energy and industrial structure of Beijing have been adjusted and optimized, leading to the reduction of pollutant emissions, which is the secret of urban long-term air quality improvement.
1. Introduction
With the rapid development of the economy, the continuous growth of population, and the acceleration of urbanization, the demand for industrial products, energy, and transportation is constantly increasing, which leads to the production of enormous emissions including fossil fuel combustion, motor vehicle exhaust, and industrial production. Severe air pollution has existed in Beijing since the 1990s. Taking advantage of the opportunity of hosting a “2008 Olympics Games”, the government developed a comprehensive plan to control air pollution and established 16 stages of atmospheric pollution control measures [1,2,3,4]. The ambient concentration of PM10 had decreased, and the air quality had been improved in a certain extent [5,6,7,8,9]. However, in the context of complex air pollution caused by the rapid increase of polluting emissions from motor vehicles, the problem of PM2.5 pollution is highlighted [10,11,12,13,14].
To fully implement the Air Pollution Prevention and Control Action Plan and improve air quality, the Beijing government developed the 2013–2017 Clean Air Action Plan (CAAP), which focused on mitigating air pollution. In order to reduce coal-fired power production, the use of controlling automotive vehicle, pollutant emissions and dust emissions, a series of legal, economic, technical, and administrative actions were pursued for the scientific, comprehensive, and profound management of air pollution. These actions significantly improved the air quality in Beijing [15,16,17,18]. Compared with the PM2.5 concentration in 2013, the value in 2017 was 58 μg/m3 [19], with a reduction of 35.6%.
In order to evaluate and analyze the environmental effective for CAAP, we have sorted out the implementation and completion of various air pollution control measures and adopted the emission factor method to calculate the emission reduction by different control measures. The WRF-CMAQ model was used to evaluate the contribution of various measures to changes in ambient air quality, and the effectiveness of control measures was established, which provided a reference point for future actions addressing air pollution in Beijing.
2. Materials and Methods
2.1. Data Sources
The emissions of major air pollutants (PM10, PM2.5, SO2, NOX, CO, NH3, and VOCs) from different anthropogenic air pollution sources in Beijing were estimated via a combined bottom-up and top-down method detail method, which could be seen in our previous study [20]. Emission sources were firstly classified into ten main categories, including fossil fuel combustion, industrial process, mobile, solvent, agricultural, dust, storage, and solid waste source. Regarding the emissions reduction from the air pollution controls of the CAAP, each action is assessed with a variation of the degree of implementation, which is estimated based on the emission factors (Equation (1)):
where R is the emission; A and A’ are the activity degrees before and after the implementation of actions, respectively, including coal-fired quantity and production; Ef and Ef’ are the emission factors before and after the actions, respectively. For most air pollution sources, the emission factors are the same before and after the implementation of the actions, but some pollution sources have caused changes in the emission intensity due to variation in the production process, specific emission factors can be found in our previous study [20]. η and η’ are the reduction efficiency of the control technique before and after the actions, respectively.
Through data and literature investigation, this study analyzed and summarized the changes in the activity level of pollution source after the implementation of the Clean Air Action Plan, as shown in Figure 1. In the five years from 2013 to 2017, coal-fired power plants were all shut down or shut down. The 24 thousand steam-tons coal-fired industrial boilers were cleaned up, and 872,000 households substituted coal for electricity for heating, eliminating 2.1 million high polluted vehicles. Since 12.6 thousand high-pollution industrial enterprises were shut down or withdrawn, the energy structure in Beijing has undergone tremendous changes, the amount of coal burned has fallen sharply, and the proportion of clean energy has increased. The structure of the motor vehicle has undergone major adjustments, and the proportion of high-emission vehicles has decreased. Reduction of dust pollution emissions by strengthening road cleaning and improving cleaning processes was performed.
2.2. Development of Economics and Society in Beijing
Population, energy sources, vehicles, and economic development are the four driving forces of air pollutant emissions, the variation of population (a), GDP (b), energy consumption (c) and vehicle ownership quantity (d) in Beijing from 2012 to 2017 can be seen in Figure 2. During this period, the population increased 4.9% from 20.69 million to 21.70 million. The GDP increased 55.6% from 1.8 trillion to 2.8 trillion yuan. The total energy consumption increased 9.0% from 65.64 million tons of standard coal to 71.55 million tons. The car ownership quantity increased 13.6% from 5.2 million to 5.91 million. The constant increase in population yields excessive demand for transportation, housing, buildings, and industrial products, implying large increases in car ownership and construction. Although the energy intensity per unit GDP decreases, the total intensity increases with rapid economic development. In general, the internal mechanism of pollution emissions remains strong.
However, Beijing gradually changed its management style by adjusting the energy structure. Coal use, with its high pollution intensity [21,22,23,24], was gradually decreased as a proportion of total energy use from 22.1% in 2012 to 4.8% in 2017, essentially achieving coal-free status. In contrast, clean energy use, such as natural gas, amounted to 29.4% of total energy use in 2017. In addition, vehicle structure also varied greatly, the proportion of vehicles with emission standards of national III and below decreased from 44% in 2012 to 17% in 2017. Under regulations defining the new criteria for vehicle emissions and economic policy, vehicles with high emissions were gradually eliminated, and the proportion of vehicles at or below national standard II decreased. Thus, the efficiency of eliminating pollutants increases by establishing emission criteria and monitoring pollutant sources.
2.3. Assessment of Effects on the Environment
The mesoscale Weather Research and Forecasting (WRF), Sparse Matrix Operator Kernel Emissions (SMOKE), and chemical transport mode Models-3 Community Multiscale Air Quality (CMAQ) are used to establish the suitable atmospheric pollution system for Beijing and the surrounding areas [25]. The horizontal direction of the simulated area is established by using a triple-nested grid with a Lambert projection and a center of 34.53° N, 108.92° E. The resolutions of the grids are 36 km, 12 km, and 4 km.
The first estimated value field is generated using the WRF model with the information provided by NCEP FNL convection layers and corrected using ADP observation material. The first domain of the SMOKE model is obtained using MEIC anthropogenic emission inventory with a 0.25° × 0.25° resolution (http://www.meicmodel.org/). The inner two domains are obtained using the high-precision manufacture emission inventory for Beijing and the surrounding areas established by the Beijing Academy of Environmental Science. This inventory includes CO, NOx, SO2, PM10, PM2.5, VOCs, and NH3. The 3D spatial distribution of point sources is determined based on the longitude, latitude, and height of a chimney, and the area sources are divided into a net based on different land types, including roads, farmlands, residences, construction sites, buildings, and bare land.
Model validation have been conducted to compare with observational data which were the daily average concentration of PM2.5 of January, April, July, and October in 2013, collected from 12 national monitoring stations (including Dongsi, Guanyuan, Wanliu, Shunyi, Huairou etc., more detail information can be seen our previous study [25]) in Beijing. CMAQ reasonably reproduced the temporal variations, with a correlation coefficient of 0.74. Compared to the observations, CMAQ slightly overestimated the PM2.5 concentrations. The normalized MB and mean error values were 0.17 and 0.44, respectively, which may be due to the uncertainty in the emission inventory and inaccuracy of the simulated meteorological fields.
3. Results and Discussion
3.1. Emission Reductions of Control Measures
Based on the measuring methods of emission reductions, according to the activity level changes of different pollution source categories introduced by each control, the emission factor method is used to calculate emission reductions of fossil fuel combustion, technological, solvent, mobile, and dust source control actions. The implementation of the CAAP has significantly reduced the major air pollutant emissions in Beijing over the past five years. The air pollution control actions from the 2013–2017 CAAP primarily include coal-fired power plant shutdowns, clean energy retrofits of coal-fired boilers, cleaner residential coal use processes, industrial restructuring, management of volatile organic compounds (VOCs), and comprehensive management of mobile and dust sources. The emission reductions of air pollution control actions are presented in Table 1. As a result of the implementation of the CAAP, the emission reductions of the primary air pollutants SO2, NOx, PM10, PM2.5, and VOCs in Beijing were 119,924, 116,091, 116,810, 46,652, and 97,267 tons, respectively.
Figure 3 illustrates the contribution ratio of SO2 (a), NOx (b), PM10 (c), PM2.5 (d) and VOCs (e) emission reduction by control measures. For SO2, industrial boiler clean energy retrofits contributed the most to emission reductions, accounting for 51%, followed by cleaner residential coal use processes, whose contribution accounted for 30%, and then industrial restructuring and power plant shutdowns, whose contributions accounted for 11% and 8%, respectively. For NOx, motor vehicle emissions reductions contributed the most, accounting for 42%, followed by industrial boiler clean energy retrofits, whose contribution accounted for 25%, and then power plant shutdowns, industrial restructuring, and cleaner residential coal use technologies, whose contributions accounted for 16%, 10%, and 7%, respectively. For PM10, road dust management contributed the most to emissions reductions, accounting for 39%. Cleaner residential coal use processes and industrial boiler clean energy retrofits also contributed rather significantly, accounting for 26% and 22%, respectively. The contribution of industrial restructuring accounted for 10%. The contributions of power plant shutdowns and motor vehicle emissions reductions contributed relatively less, accounting for 2% and 1%, respectively. For PM2.5, cleaner residential coal use processes contributed the most to emissions reductions, accounting for 38%. Industrial boiler clean energy retrofits and road dust management also contributed rather significantly, accounting for 33% and 14%, respectively. The contribution of industrial restructuring accounted for 10%. The contributions of power plant shutdowns and motor vehicle emissions reductions contributed relatively less, accounting for 3% and 2%, respectively.
The CAAP had significant effects on the management of VOCs, requiring industrial companies and other key manufacturers to achieve a total emissions reduction of approximately 47 thousand tons, which contributed 48% to the total emissions reduction. Residential coal use also features large VOCs emissions. Cleaner heating cleaning processes had a rather large contribution on the VOCs emissions reduction, accounting for 22%. The contribution of motor vehicle emissions reduction accounted for 19%, primarily related to the elimination of old motor vehicles. By completely eliminating organic solvent-based coatings, asphalt waterproof materials, wood-based panel production, organic coatings for furniture manufacturing and wood products, substituting oil-based paints in the automotive industry, controlling VOCs in the production of pharmaceuticals, pesticides, and mechanical equipment, and promoting oil-based paint substitutes in building exterior-wall coatings, steel structure manufacturing, and vehicle maintenance industries, Beijing has achieved a total emissions reduction of 9 thousand tons in solvent sources, a contribution that accounts for 10% of the total emissions reduction.
3.2. Emission Changes between 2012 and 2017
The implementation of the CAAP has significantly reduced the major air pollutant emissions in Beijing during the five-year period, 2012–2017. Figure 4 shows the emissions variation of SO2 (a), NOx (b), PM10 (c), PM2.5 (d) and VOCs (e) from 2012 to 2017. Five air pollutants emissions averagely decreased by 39% in 2017 compared to 2013. The SO2 emissions decreased from 104 thousand tons in 2012 to 14 thousand tons in 2017, an average decrease of 86.7%, which was primarily due to the vigorous control of coal-burning sources [26,27]. The use of coal was greatly reduced. The NOx emissions decreased from 189 thousand tons in 2012 to 122 thousand tons in 2017, a decrease of 35.7%, primarily due to the optimization of energy and vehicle structures. However, mobile source emissions increased from 53% in 2012 to 80% in 2017, becoming the primary emitter of NOx. Automotive vehicles were the largest single source, accounting for 66%. The PM2.5 emissions decreased from 82 thousand tons in 2012 to 39 thousand tons in 2017, a decrease of 52.6%. Similarly, dust sources were the most important source of PM2.5, whose emissions increased from 47% in 2012 to 73% in 2017. Construction dust remained the largest single contributor among dust sources, the emissions of which increased from 30% in 2012 to 45% in 2017. Dust sources were controlled to a certain extent during the implementation of the CAAP. However, this pollution source emission type has a large base and it is difficult to control [28]. It is necessary to further improve management and control actions. The VOCs emissions decreased from 322 thousand tons in 2012 to 245 thousand tons in 2017, a decrease of 23.9%. Affected by the restriction in emission standards, the VOCs emissions from industrial solvent use decreased from 10% in 2012 to 6% in 2017. VOCs emissions from other types of solvent use remained high.
The effect of pollution reduction is also reflected in the air quality. The annual average concentration of airborne SO2 decreased from 28 µg/m3 in 2012 to 8 µg/m3 in 2017, a decrease of 71.4%, which is primarily due to the reduction in coal use. There was a good correlation between the reduction in total pollutant emissions and the decrease of pollutant concentrations. The annual average concentration of airborne PM10 and PM2.5 were decreasing every year, which was due to a sustained reduction in primary particle and gaseous pollutant emissions. This also reveals that pollutant emission reduction caused by the control and management of pollution sources is the primary reason and key factor for air quality improvement in Beijing.
3.3. Impact of Changes in Pollutant Emissions on Air Quality Improvement
Population, energy and economic development are the three drivers of pollution emissions. From 2012 to 2017, the population of Beijing continued to increase, the demands for transportation, housing, and office space and industrial products were strong, and the number of motor vehicles and construction area increased significantly. Although the intensity of energy consumption per unit of GDP was declining, the total energy consumption was still rising. From the macro data, the internal driving force of pollution emissions was still strong. However, from the perspective of structure, Beijing was gradually changing the extensive mode and vigorously promoting the adjustment of the energy structure. The proportion of coal with a high emission intensity per unit of heat continued to decline, from 25.2% in 2012 to 5.7% in 2017. The proportion of clean energy natural gas reached 31.8% in 2017, more than double that of coal. Through the new vehicle emission standards and economic policies, the high-emission vehicles were gradually eliminated, and the proportion of vehicles with national II emission standard and below continued to decline, from 28.1% in 2012 to 4.5% in 2017. Through the formulation of emission standards and the supervision of pollution sources, the efficiency of pollutant removal has been improved. For example, the control efficiency of dust at construction sites has increased from 54.5% in 2012 to 64.4% in 2017. The desulfurization and denitration efficiency of thermal power plants have increased year by year. Therefore, under the vigorous adjustment of the structure of energy, industry and motor vehicle, combined with the continuous improvement of pollutant control efficiency, the total emission of major air pollutants in Beijing decreased significantly from 2012 to 2017, especially SO2, CO and primary particulate matter emissions. The effect of pollution reduction was also reflected in air quality. The average annual concentration of air SO2 decreased from 28 ug/m3 in 2012 to 8 ug/m3 in 2017, a decrease of 71.4%, which was mainly related to the reduction of coal combustion. There was a good correlation between the reduction in total amount of pollutant discharged and the decrease of pollutant concentrations, with a correlation coefficient r of 0.95 between the sum of the four major air pollutants (SO2, NOX, PM10, PM2.5) emission and the sum of the ambient air concentrations of the four pollutants which observed from monitoring stations from 2012 to 2017. The average annual concentration of PM10 and PM2.5 was also decreasing year by year, which was related to the continuous decline of particulate matter and gaseous pollutant emissions, the relationship and variations among economic and social development, air quality and emission in Beijing from 2012 to 2017 can be seen in Figure 5. It showed that the reduction of pollutant emissions caused by the control and management of pollution sources was the primary cause and key factors for the improvement of air quality in Beijing.
3.4. Assessment on the Improvement in Air Quality Attributed to the CAAP
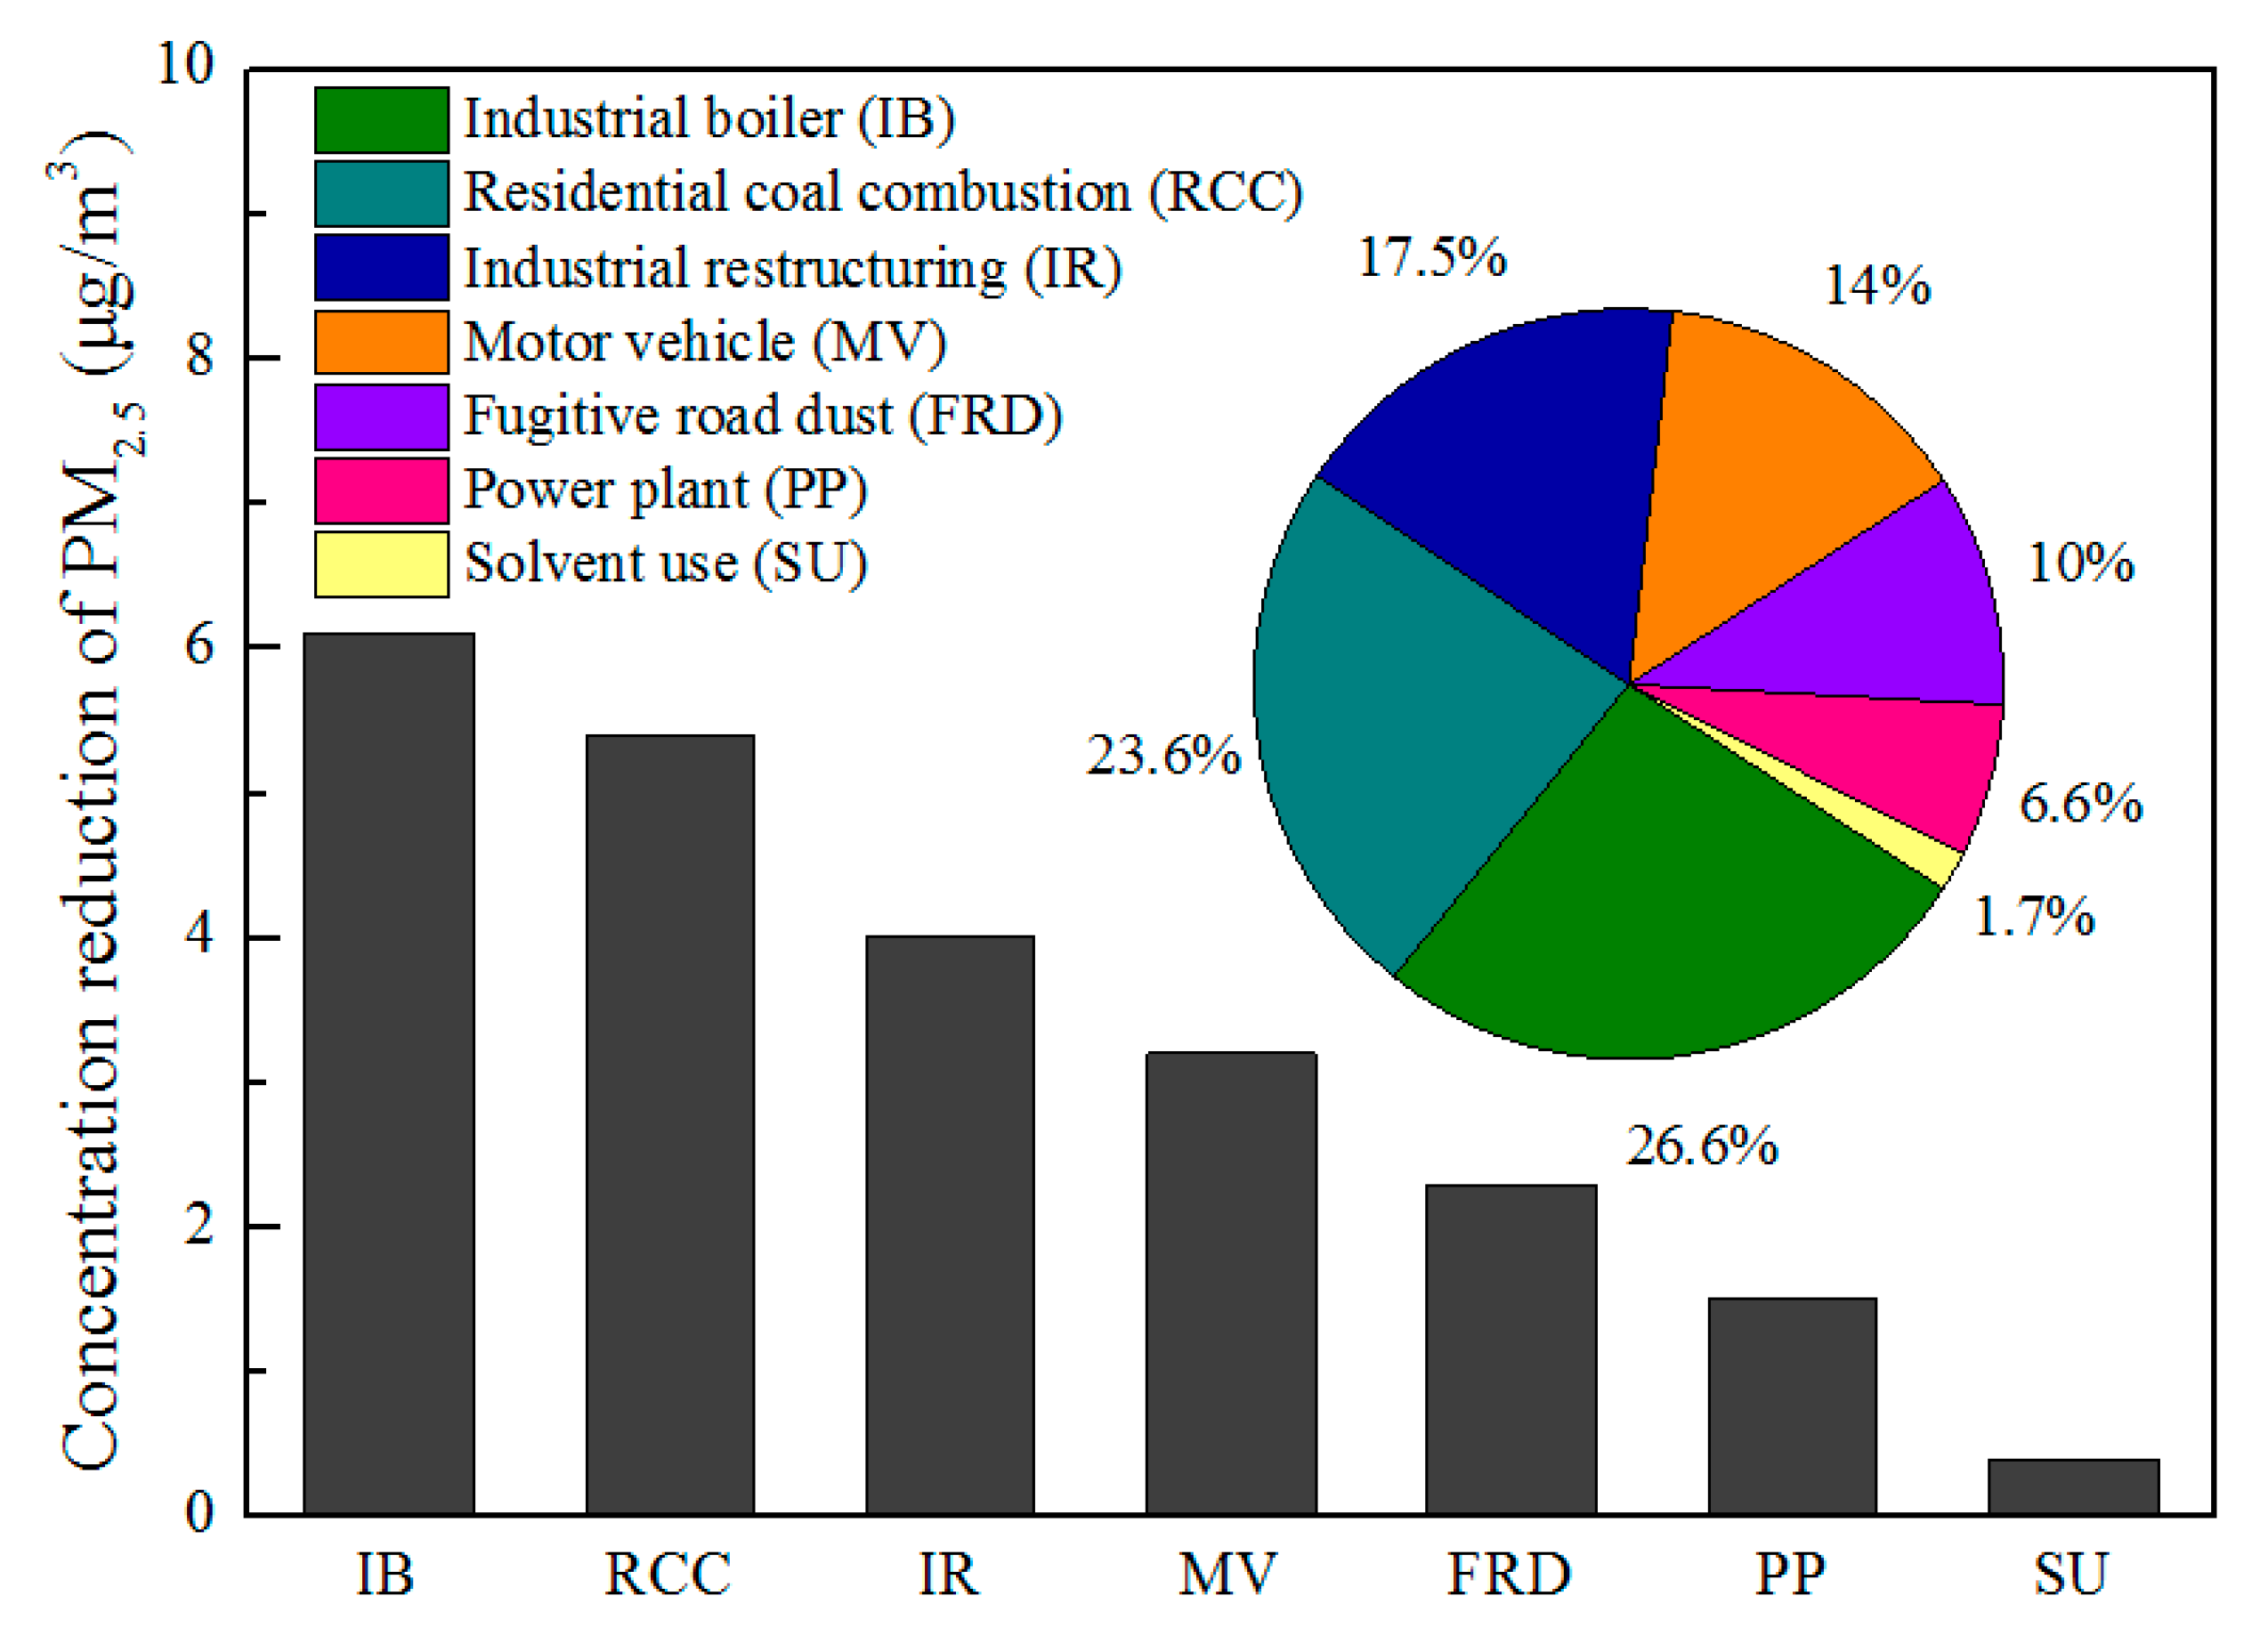
The air quality of Beijing in 2017 was simulated based on the air quality mode discussed above and compared with the air quality of the reference year to analyze the degree of improvement and standard level of the fine grain concentration. Figure 6 shows the spatial distribution of PM2.5 concentration reduction caused by control measures in coal combustion (a), industry (b) and motor vehicle (c). The improvement on the PM2.5 concentration for main control measure was simulated by using the WRF/CMAQ simulation system, with the contribution presented in Figure 7. Absent any consideration regarding variation in the weather conditions and reduction of emissions in the surrounding areas, the actions of the CAAP result in a decrease in the PM2.5 concentration in Beijing to 22.9 μg/m3.
Of all actions, the largest contributor to the PM2.5 concentration change was the clean energy retrofitting of coal-fired boilers, which contributed 27% of the total emissions reduction and 6.1 μg/m3 of the average PM2.5 concentration reduction in Beijing. Cleaner residential coal technologies also contributed significantly to the reduction of PM2.5 concentrations, decreasing 23%, to 5.4 μg/m3. Industrial restructuring and vehicle and dust control also significantly contributed to the decreases in the concentration and contribution of PM2.5 in Beijing, corresponding to 4.0, 3.2, and 2.3 μg/m3, and with 17%, 14%, and 10%, respectively. The closure of coal-fired power plants contributes 7% of the PM2.5 concentration reduction, and the management of VOCs contributes 0.4 μg/m3 of the PM2.5 concentration reduction.
3.5. Future Plans Regarding Air Pollution Control in Beijing
Through the implementation of the CAAP, the emission qualities of long-term air pollution varied greatly. The new characteristics of air pollution feature were the adequate control of coal pollution, vehicle pollution, industrial production, and personal consumption and the increasing proportion of pollutants from urban operations and residential activities. The future direction for reducing emissions is primarily focused on pivotal and difficult issues, including the development of clean energy sources in mountainous areas and the management of heavy-duty diesel vehicles, dust, and VOCs emission source to promote air quality improvement.
With regard to vehicle management, low-emission areas should be regularly expanded by managing high-emission vehicles, such as high-duty diesel vehicles, and improving enforcement [29]. Combining the characteristics of non-road mobile machinery with high emission intensity [30], emissions standards should be strengthened. It is necessary to eliminate old non-road mobile machinery by implementing economic policies.
As for manufacturing, relocating traditional building materials and metallurgy industries reduce the capacity for emissions reduction. However, it is difficult to manage major VOCs-producing industries such as those manufacture industrial coatings. Thus, controls should be implemented comprehensively at the source, throughout the process, and via end-of-pipe treatment. Regarding combustion sources, the energy structure is adjusted and optimized. However, in the future, coal-free processes should continue to improve the development of clean energy alternatives to replace the residential use of coal in mountainous areas. In addition, natural gas consumption will dramatically increase; thus, NOx emissions of gas-fired boilers must be addressed through low- or extremely low-N retrofits.
Dust sources can be minimized by improving street sweeping and cleaning in urban and suburban areas and implementing new techniques that reduce dust emissions through sustainable construction practices, online monitoring improvements, and the isolation of slag cars. Regarding resident sources, food and beverage standards must be strictly implemented for special projects in catering businesses, building coating adhesive standards must be instilled, and residents should be encouraged to use low-VOCs products.
4. Conclusions
Combined with the emission inventory of air pollutants for Beijing from 2012 to 2017, this study systematically studied the implementation of the Clean Air Action Plan of Beijing and assessed the variations in the energy structure and industrial structure. The environmental effects of the control measures were estimated which for providing reference and suggestion for the next stage of air pollution mitigation.
Through the implementation of the CAAP, primary air pollutants, such as SO2, NOx, PM10, PM2.5, and VOCs, decreased by 119,924, 116,091, 116,810, 46,652, and 97,267 tons, respectively. An assessment of the efficiency of the CAAP revealed that the most efficient action for reducing PM2.5 concentration levels was the clean energy retrofit of coal-fired boilers, which contributed to 27% and 6.1 μg/m3 of the overall reduction in the average PM2.5 concentration levels in Beijing. Cleaner residential coal-use alternatives also significantly contributed to the reduction in PM2.5 concentration levels, corresponding to 5.4 μg/m3 and 23% of the overall emissions reduction. The key to long-term improvements in urban air quality is the reduction of emissions achieved by reconstructing energy structures, optimizing industrial structures, and the comprehensive management of vehicles.
Author Contributions
Conceptualization, Y.X.; methodology, Y.X. and S.Z.; formal analysis, T.N. and X.C.; investigation, S.Z. and T.N.; data curation, Y.X. and X.C.; writing—original draft preparation, Y.X.; writing—review and editing, A.S. All authors have read and agreed to the published version of the manuscript.
Funding
This work was supported by the National Natural Science Foundation of China (21806012); the National Key Research and Development Program of China (2016YFC0201106); and the Science Foundation of Beijing Municipal Research Institute of Environmental Protection (2019B02).
Acknowledgments
The authors thank the MEIC team from Tsinghua University for providing the 36 km emission inventory.
Conflicts of Interest
The authors declare no conflict of interest.
References
- Jia, J.; Cheng, S.Y.; Lei, L.; Lang, J.L.; Gang, W.; Chen, G.L.; Liu, X.Y. An Integrated WRF-CAMx Modeling Approach for Impact Analysis of Implementing the Emergency PM2.5 Control Measures during Red Alerts in Beijing in December 2015. Aerosol Air Qual. Res. 2017, 17, 2491–2508. [Google Scholar] [CrossRef] [Green Version]
- Tian, J.Y.; Cai, T.Q.; Xu, G.; Shang, J.; Schauer, J.J.; Yang, S.J.; Zhang, L.J.; Zhang, Y.X. Effects of the emergency control measures in Beijing on air quality improvement. Atmos. Pollut. Res. 2019, 10, 580–586. [Google Scholar] [CrossRef]
- Wang, L.; Zhang, F.Y.; Pilot, E.; Yu, J.; Nie, C.J.; Holdaway, J.; Yang, L.S.; Li, Y.H.; Wang, W.; Vardoulakis, S. Taking Action on Air Pollution Control in the Beijing-Tianjin-Hebei (BTH) Region: Progress, Challenges and Opportunities. Int. J. Environ. Res. Public Health 2018, 15, 306. [Google Scholar] [CrossRef] [PubMed] [Green Version]
- Zhang, H.F.; Wang, S.X.; Hao, J.M.; Wang, X.M.; Wang, S.L.; Chai, F.H.; Mei, L. Air pollution and control action in Beijing. J. Clean. Prod. 2016, 112, 1519–1527. [Google Scholar] [CrossRef]
- Gao, J.M.; Xu, X.H.; Ying, Z.K.; Jiang, L.; Zhong, M.H.; Wang, A.X.; Chen, L.C.; Lu, B.; Sun, Q.H. Post-Effect of Air Quality Improvement on Biomarkers for Systemic Inflammation and Microparticles in Asthma Patients After the 2008 Beijing Olympic Games: A Pilot Study. Inflammation 2017, 40, 1214–1224. [Google Scholar] [CrossRef]
- Li, K.; Jacob, D.J.; Liao, H.; Zhu, J.; Shah, V.; Shen, L.; Bates, K.H.; Zhang, Q.; Zhai, S.X. A two-pollutant strategy for improving ozone and particulate air quality in China. Nat. Geosci. 2019, 12, 906–923. [Google Scholar] [CrossRef]
- Lin, H.L.; Liu, T.; Fang, F.; Xiao, J.P.; Zeng, W.L.; Li, X.; Guo, L.C.; Tian, L.W.; Schootman, M.; Stamatakis, K.A. Mortality benefits of vigorous air quality improvement interventions during the periods of APEC Blue and Parade Blue in Beijing, China. Environ. Pollut. 2017, 220, 222–227. [Google Scholar] [CrossRef] [Green Version]
- Wang, G.; Cheng, S.Y.; Wei, W.; Yang, X.W.; Wang, X.Q.; Jia, J.; Lang, J.L.; Lv, Z. Characteristics and emission-reduction measures evaluation of PM2.5 during the two major events: APEC and Parade. Sci. Total Environ. 2017, 595, 81–92. [Google Scholar] [CrossRef]
- Zeng, X.T.; Tong, Y.F.; Cui, L.; Kong, X.M.; Sheng, Y.N.; Chen, L.; Li, Y.P. Population-production-pollution nexus based air pollution management model for alleviating the atmospheric crisis in Beijing, China. J. Environ. Manag. 2017, 197, 507–521. [Google Scholar] [CrossRef]
- He, Q.Q.; Huang, B. Satellite-based high-resolution PM2.5 estimation over the Beijing-Tianjin-Hebei region of China using an improved geographically and temporally weighted regression model. Environ. Pollut. 2018, 236, 1027–1037. [Google Scholar] [CrossRef]
- Shen, Z.X.; Sun, J.; Cao, J.J.; Zhang, L.M.; Zhang, Q.; Lei, Y.L.; Gao, J.J.; Huang, R.J.; Liu, S.B.; Huang, Y. Chemical profiles of urban fugitive dust PM2.5 samples in Northern Chinese cities. Sci. Total Environ. 2016, 569–570, 619–626. [Google Scholar] [CrossRef] [PubMed]
- Song, L.; Song, H.; Lin, J.; Wang, C.; Yu, M.; Huang, X.; Guan, Y.; Wang, X.; Du, L. PM2.5 emissions from different types of heavy-duty truck: A case study and meta-analysis of the Beijing-Tianjin-Hebei region. Environ. Sci. Pollut. Res. 2017, 24, 11206–11214. [Google Scholar] [CrossRef] [PubMed]
- Yang, W.; Yu, C.Y.; Yuan, W.; Wu, X.Y.; Zhang, W.; Wang, X.J. High-resolution vehicle emission inventory and emission control policy scenario analysis, a case in the Beijing-Tianjin-Hebei (BTH) region, China. J. Clean. Prod. 2018, 203, 530–539. [Google Scholar] [CrossRef]
- Zhang, X.; Shi, M.; Li, Y.; Rui, P.; Nan, X. Correlating PM2.5 concentrations with air pollutant emissions: A longitudinal study of the Beijing-Tianjin-Hebei region. J. Clean. Prod. 2018, 179, 103–113. [Google Scholar] [CrossRef]
- Shao, P.Y.; Tian, H.Z.; Sun, Y.J.; Liu, H.J.; Wu, B.B.; Liu, S.H.; Liu, X.Y.; Wu, Y.; Liang, W.; Wang, Y.M.; et al. Characterizing remarkable changes of severe haze events and chemical compositions in multi-size airborne particles (PM1, PM2.5 and PM10) from January 2013 to 2016–2017 winter in Beijing, China. Atmos. Environ. 2018, 189, 133–144. [Google Scholar] [CrossRef]
- Vu, T.V.; Shi, Z.B.; Cheng, J.; Zhang, Q.; He, K.B.; Wang, S.X.; Harrison, R.M. Assessing the impact of clean air action on air quality trends in Beijing using a machine learning technique. Atmos. Chem. Phys. 2019, 19, 11303–11314. [Google Scholar] [CrossRef] [Green Version]
- Xue, Y.F.; Wang, Y.; Li, X.F.; Tian, H.Z.; Nie, L.; Wu, X.Q.; Zhou, J.R.; Zhou, Z. Multi-dimension apportionment of clean air “parade blue” phenomenon in Beijing. J. Environ. Sci. 2018, 65, 29–42. [Google Scholar] [CrossRef]
- Yang, J.; Song, D.; Fang, D.L.; Wu, F. Drivers of consumption-based PM2.5 emission of Beijing: A structural decomposition analysis. J. Clean. Prod. 2019, 219, 734–742. [Google Scholar] [CrossRef]
- Chen, Z.Y.; Chen, D.L.; Kwan, M.P.; Chen, B.; Gao, B.B.; Zhuang, Y.; Li, R.Y.; Xu, B. The control of anthropogenic emissions contributed to 80% of the decrease in PM2.5 concentrations in Beijing from 2013 to 2017. Atmos. Chem. Phys. 2019, 19, 13519–13533. [Google Scholar] [CrossRef] [Green Version]
- Xue, Y.F.; Zhang, S.H.; Zhou, Z.; Wang, K.; Liu, K.Y.; Wang, X.Y.; Shi, A.J.; Xu, K.L.; Tian, H.Z. Spatio-Temporal Variations of Multiple Primary Air Pollutants Emissions in Beijing of China, 2006–2015. Atmosphere 2019, 10, 494. [Google Scholar] [CrossRef] [Green Version]
- Cui, Z.K.; Li, Z.G.; Zhang, Y.Z.; Wang, X.F.; Li, Q.L.; Zhang, L.M.; Feng, X.B.; Li, X.Y.; Shang, L.H.; Yao, Z.X. Atmospheric Mercury Emissions from Residential Coal Combustion in Guizhou Province, Southwest China. Energy Fuels 2019, 33, 1937–1943. [Google Scholar] [CrossRef]
- Liu, S.J.; Ju, S.G.; Yang, S.; Du, W.G.; Yan, X.D.; Zhang, K.X. Producing Effective and Clean Coke for Household Combustion Activities to Reduce Gaseous Pollutant Emissions. J. Chem. 2019, 2019, 7142804. [Google Scholar] [CrossRef]
- Ouyang, J.; Song, L.J.; Ma, L.L.; Luo, M.; Dai, X.X.; Zhang, J.T.; Xu, D.D. Quantification of secondary particle loading during a heavy air pollution event in Beijing: A simplified method based on coal emission indicators. Atmos. Environ. 2019, 215, 116896. [Google Scholar] [CrossRef]
- Zhang, Z.Z.; Wang, W.X.; Cheng, M.M.; Liu, S.J.; Xu, J.; He, Y.J.; Meng, F. The contribution of residential coal combustion to PM2.5 pollution over China’s Beijing-Tianjin-Hebei region in winter. Atmos. Environ. 2017, 159, 147–161. [Google Scholar] [CrossRef]
- Nie, T.; Nie, L.; Zhou, Z.; Wang, Z.S.; Xue, Y.F.; Gao, J.J.; Wu, X.Q.; Fan, S.B.; Cheng, L.L. Exploring the heavy air pollution in Beijing in the fourth quarter of 2015: Assessment of environmental benefits for red alerts. Front. Earth Sci. 2018, 12, 361–372. [Google Scholar] [CrossRef]
- Dai, Q.L.; Bi, X.H.; Song, W.B.; Li, T.K.; Liu, B.S.; Ding, J.; Xu, J.; Song, C.B.; Yang, N.W.; Schulze, B.C.; et al. Residential coal combustion as a source of primary sulfate in Xi’an, China. Atmos. Environ. 2019, 196, 66–76. [Google Scholar] [CrossRef]
- Xu, W.; Song, W.; Zhang, Y.Y.; Liu, X.J.; Zhang, L.; Zhao, Y.H.; Liu, D.Y.; Tang, A.H.; Yang, D.W.; Wang, D.D. Air Quality Improvement in a Megacity: Implications from 2015 Beijing Parade Blue Pollution-Control Actions. Atmos. Chem. Phys. 2017, 17, 31–46. [Google Scholar] [CrossRef] [Green Version]
- Cheng, J.; Su, J.P.; Cui, T.; Li, X.; Dong, X.; Sun, F.; Yang, Y.Y.; Tong, D.; Zheng, Y.X.; Li, Y.S.; et al. Dominant role of emission reduction in PM2.5 air quality improvement in Beijing during 2013–2017: A model-based decomposition analysis. Atmos. Chem. Phys. 2019, 19, 6125–6146. [Google Scholar] [CrossRef] [Green Version]
- Zhang, Q.R.; Tong, P.F.; Liu, M.D.; Lin, H.M.; Yun, X.; Zhang, H.R.; Tao, W.; Liu, J.F.; Wang, S.X.; Tao, S.; et al. A WRF-Chem model-based future vehicle emission control policy simulation and assessment for the Beijing-Tianjin-Hebei region, China. J. Environ. Manag. 2020, 253, 109751. [Google Scholar] [CrossRef]
- Lang, J.L.; Tian, J.J.; Zhou, Y.; Li, K.H.; Chen, D.S.; Huang, Q.; Xing, X.F.; Zhang, Y.Y.; Cheng, S.Y. A high temporal-spatial resolution air pollutant emission inventory for agricultural machinery in China. J. Clean. Prod. 2018, 183, 1110–1121. [Google Scholar] [CrossRef]
Figure 1.
Main control measures and activity level variation taken by clean air action plan.
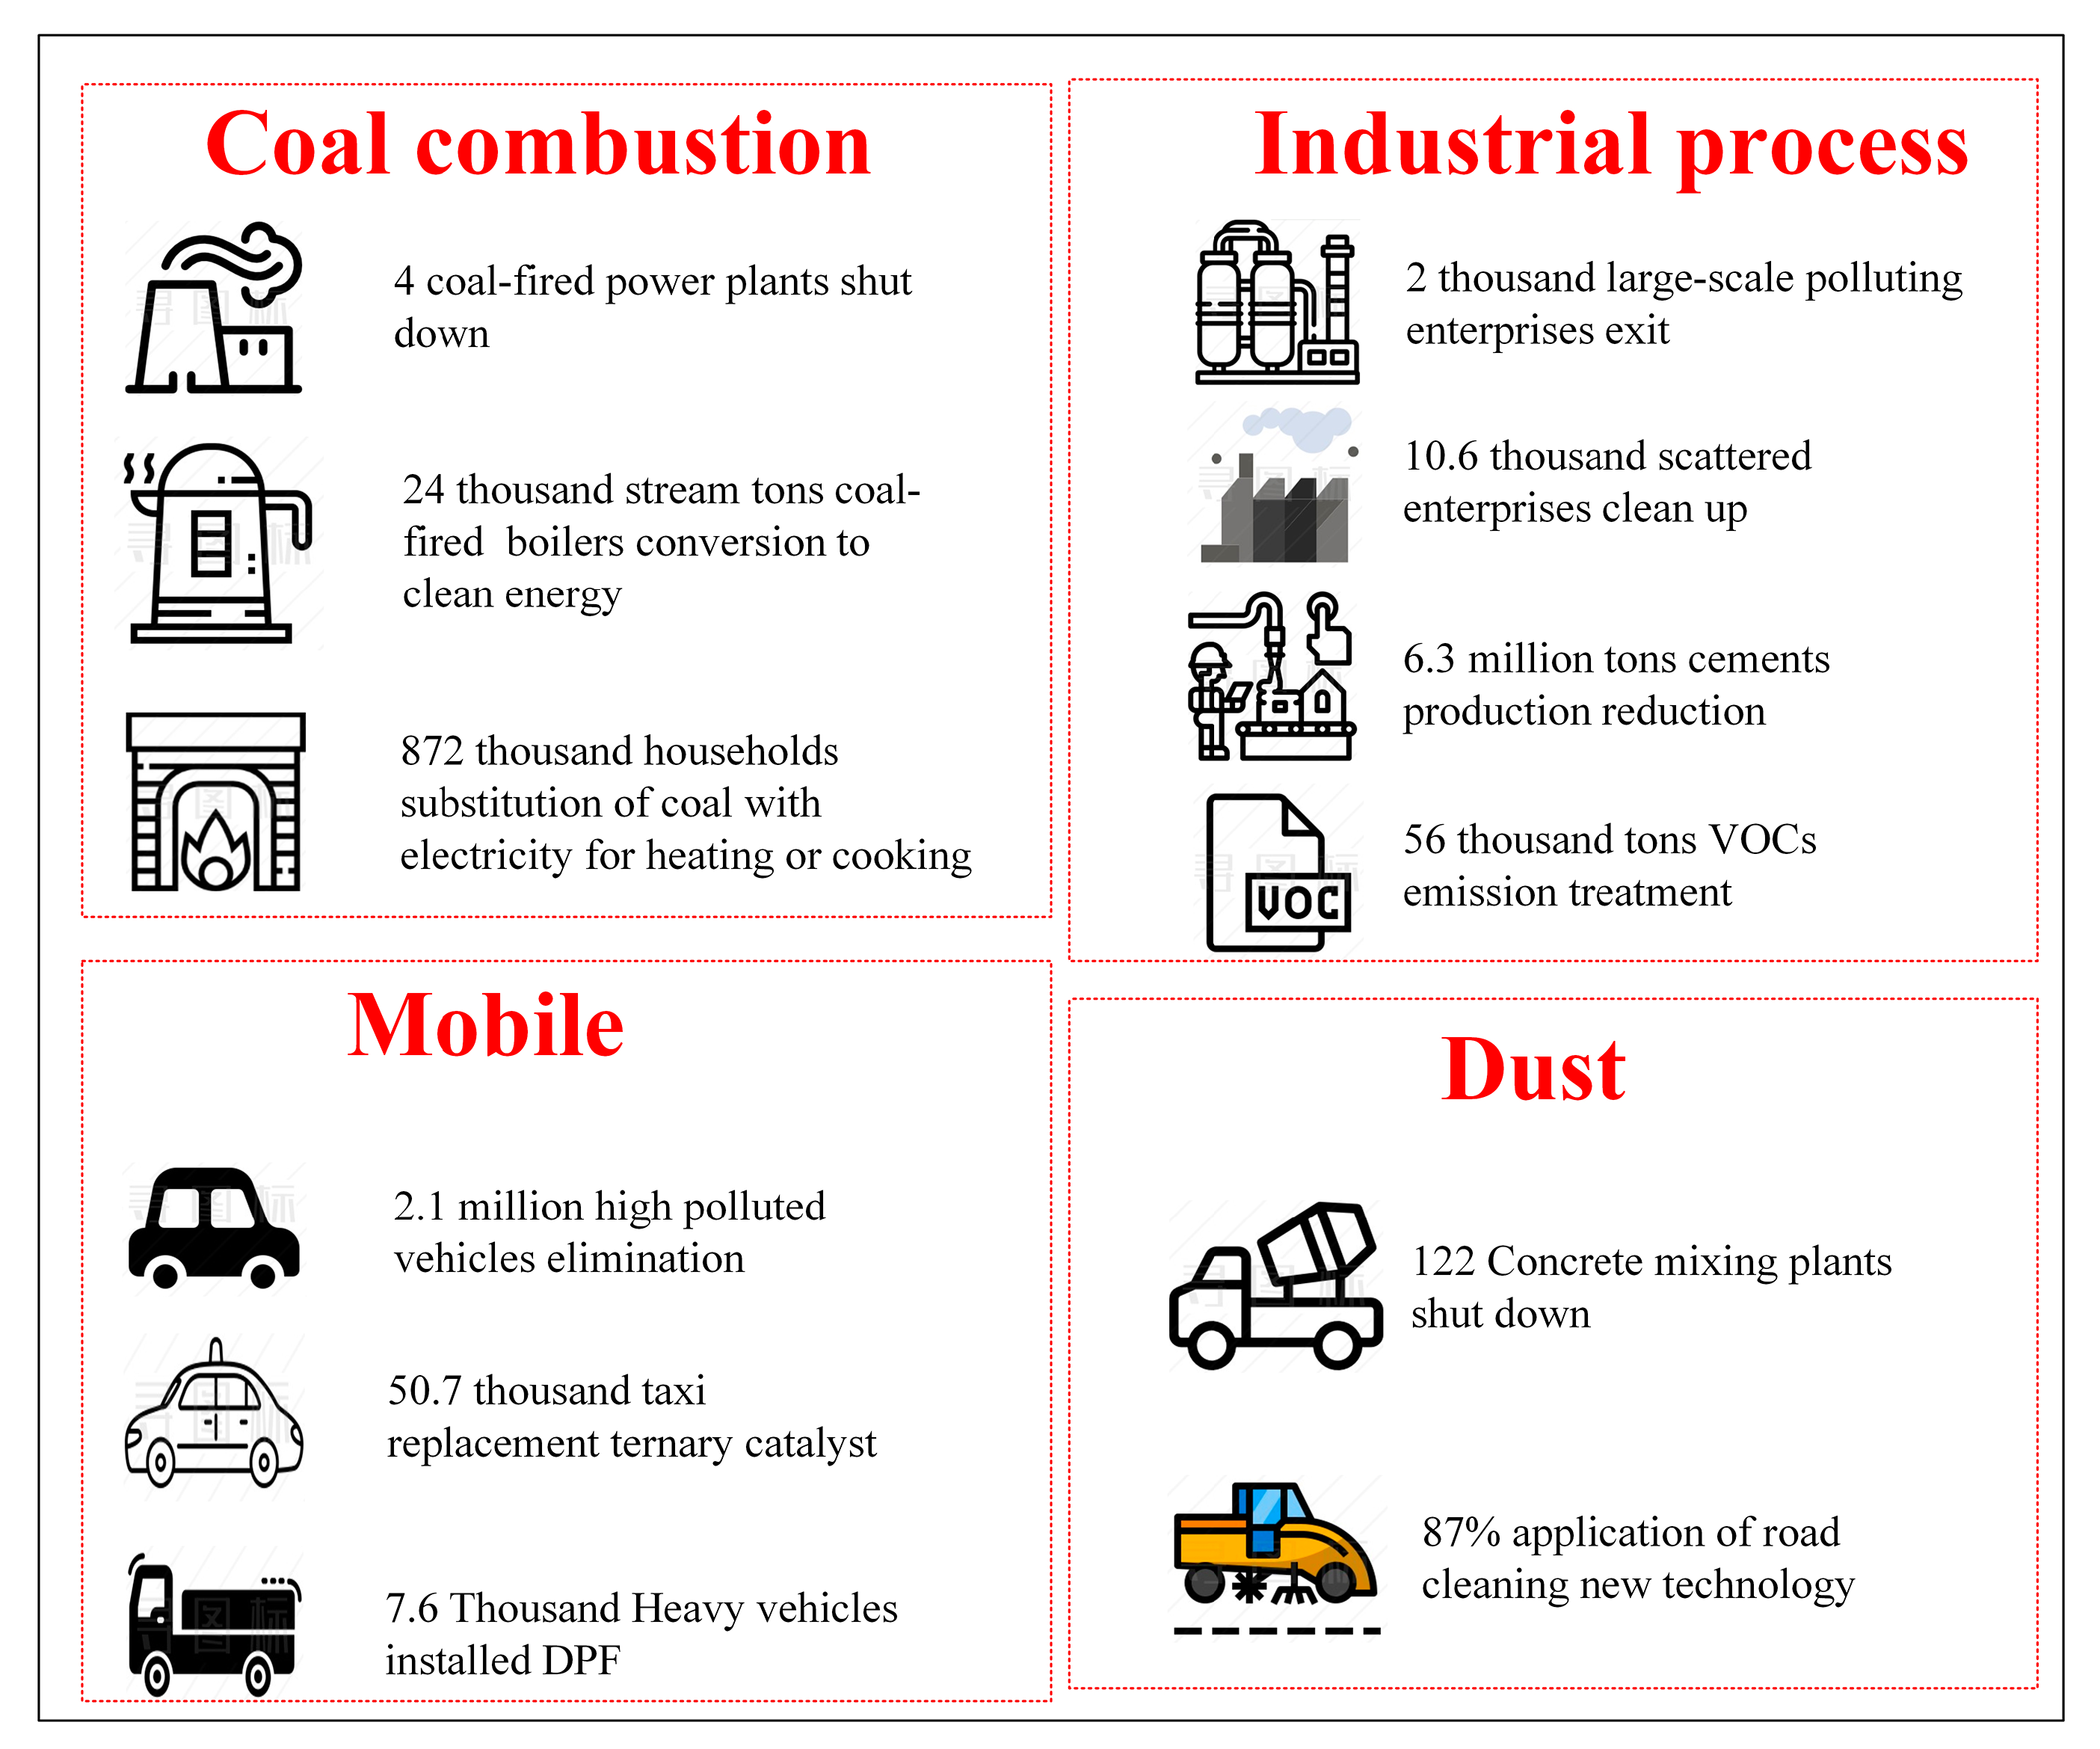
Figure 2.
Population (a), GDP (b), energy consumption (c) and vehicle ownership quantity (d) changes in Beijing from 2012 to 2017.
Figure 2.
Population (a), GDP (b), energy consumption (c) and vehicle ownership quantity (d) changes in Beijing from 2012 to 2017.
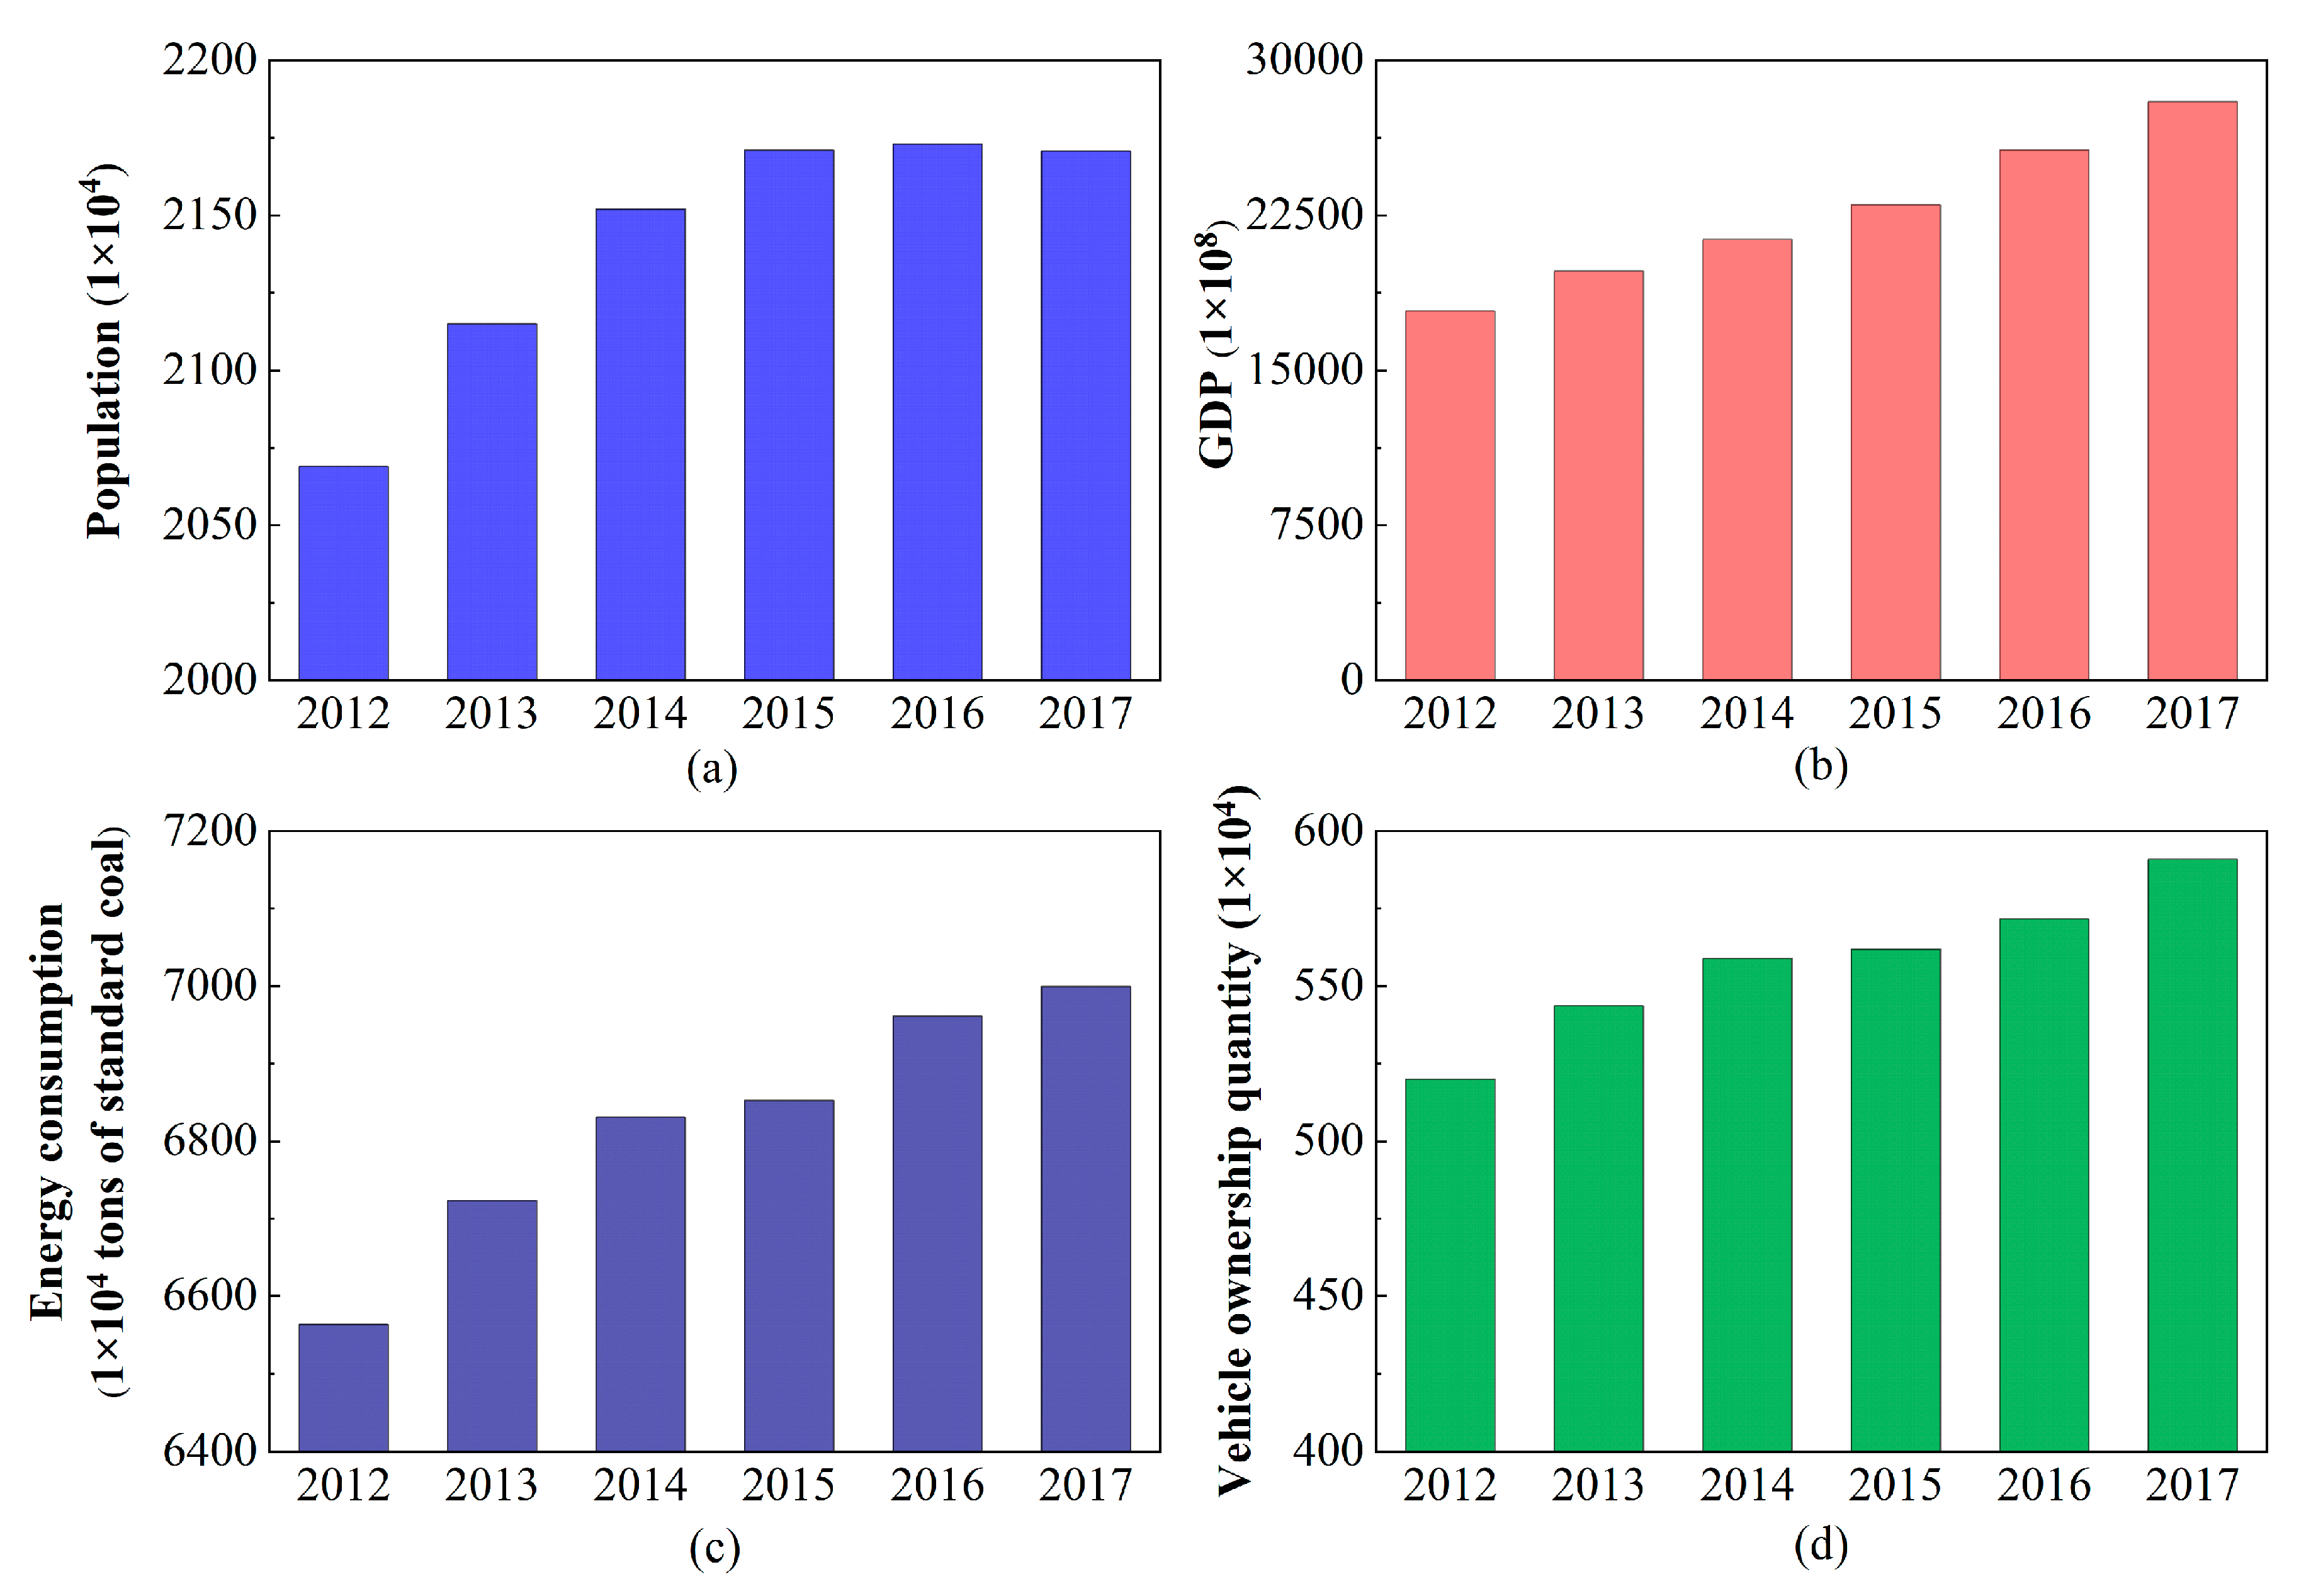
Figure 3.
Contribution ratio of air pollutants emission reduction by control measures. SO2 (a), NOx (b), PM10 (c), PM2.5 (d) and VOCs (e).
Figure 3.
Contribution ratio of air pollutants emission reduction by control measures. SO2 (a), NOx (b), PM10 (c), PM2.5 (d) and VOCs (e).
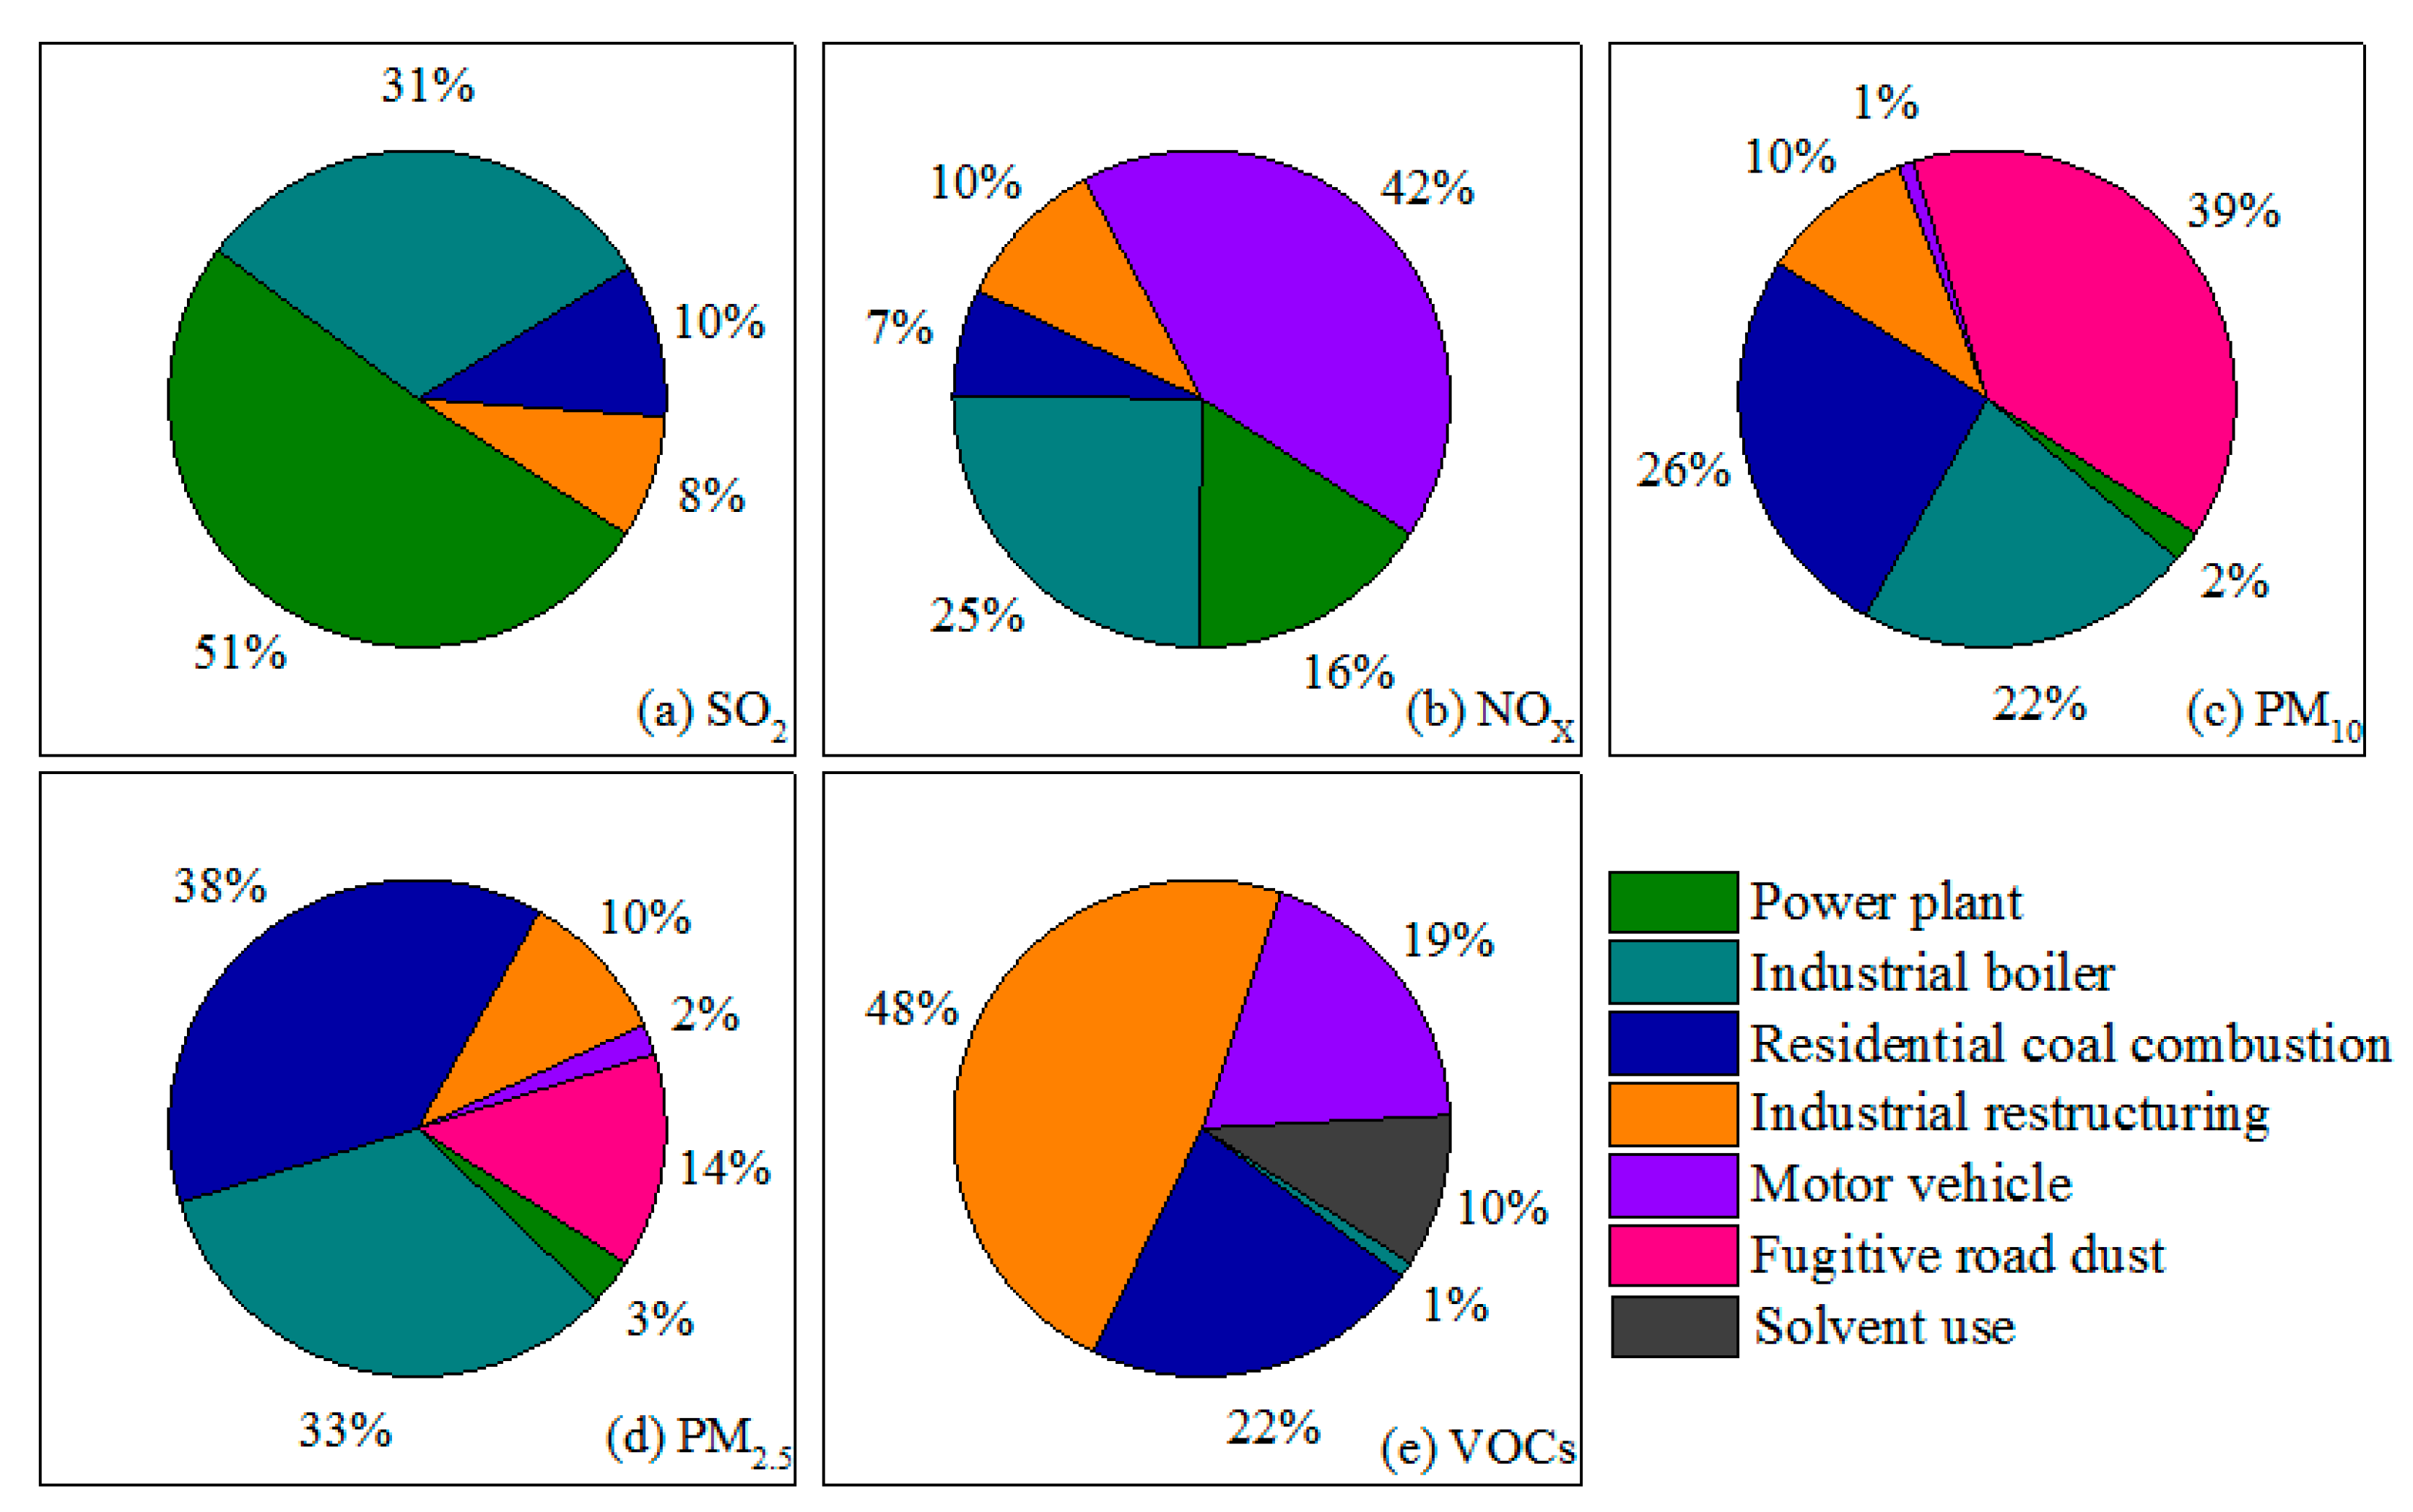
Figure 4.
Emission variation of air pollutants from 2012 to 2017. SO2 (a), NOx (b), PM10 (c), PM2.5 (d) and VOCs (e).
Figure 4.
Emission variation of air pollutants from 2012 to 2017. SO2 (a), NOx (b), PM10 (c), PM2.5 (d) and VOCs (e).
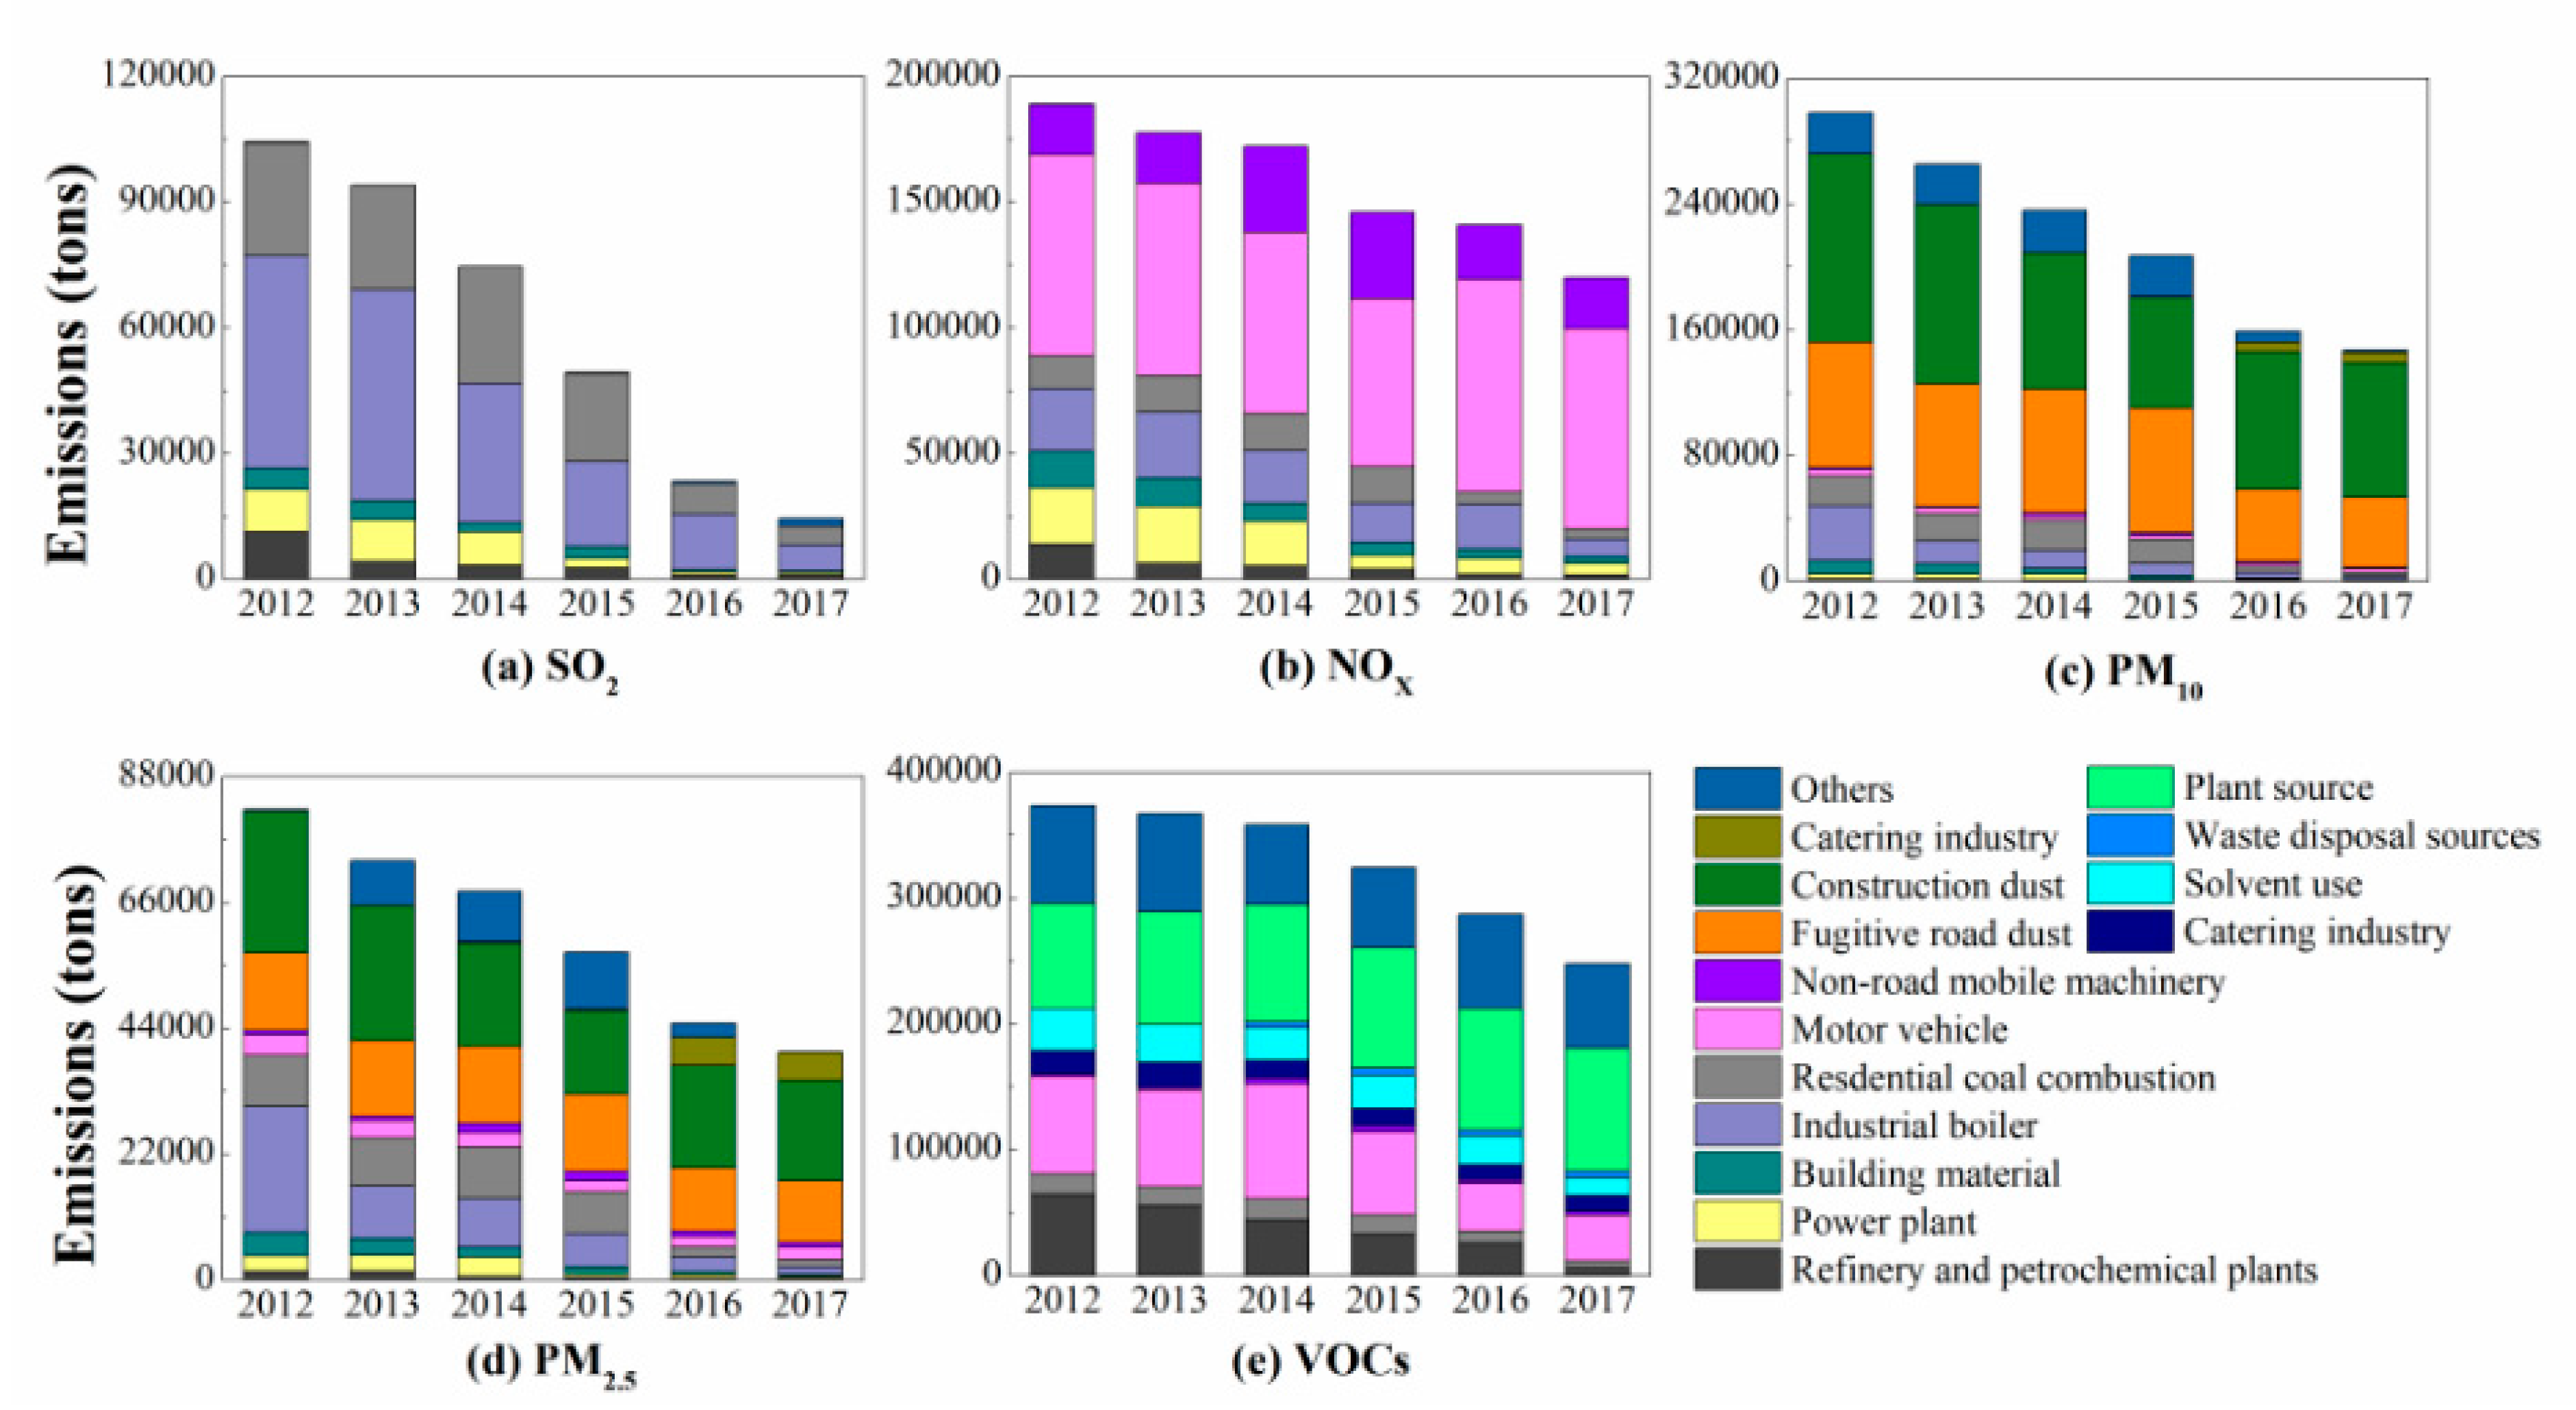
Figure 5.
Variations in economic and social development, air quality and emission in Beijing from 2012 to 2017.
Figure 5.
Variations in economic and social development, air quality and emission in Beijing from 2012 to 2017.
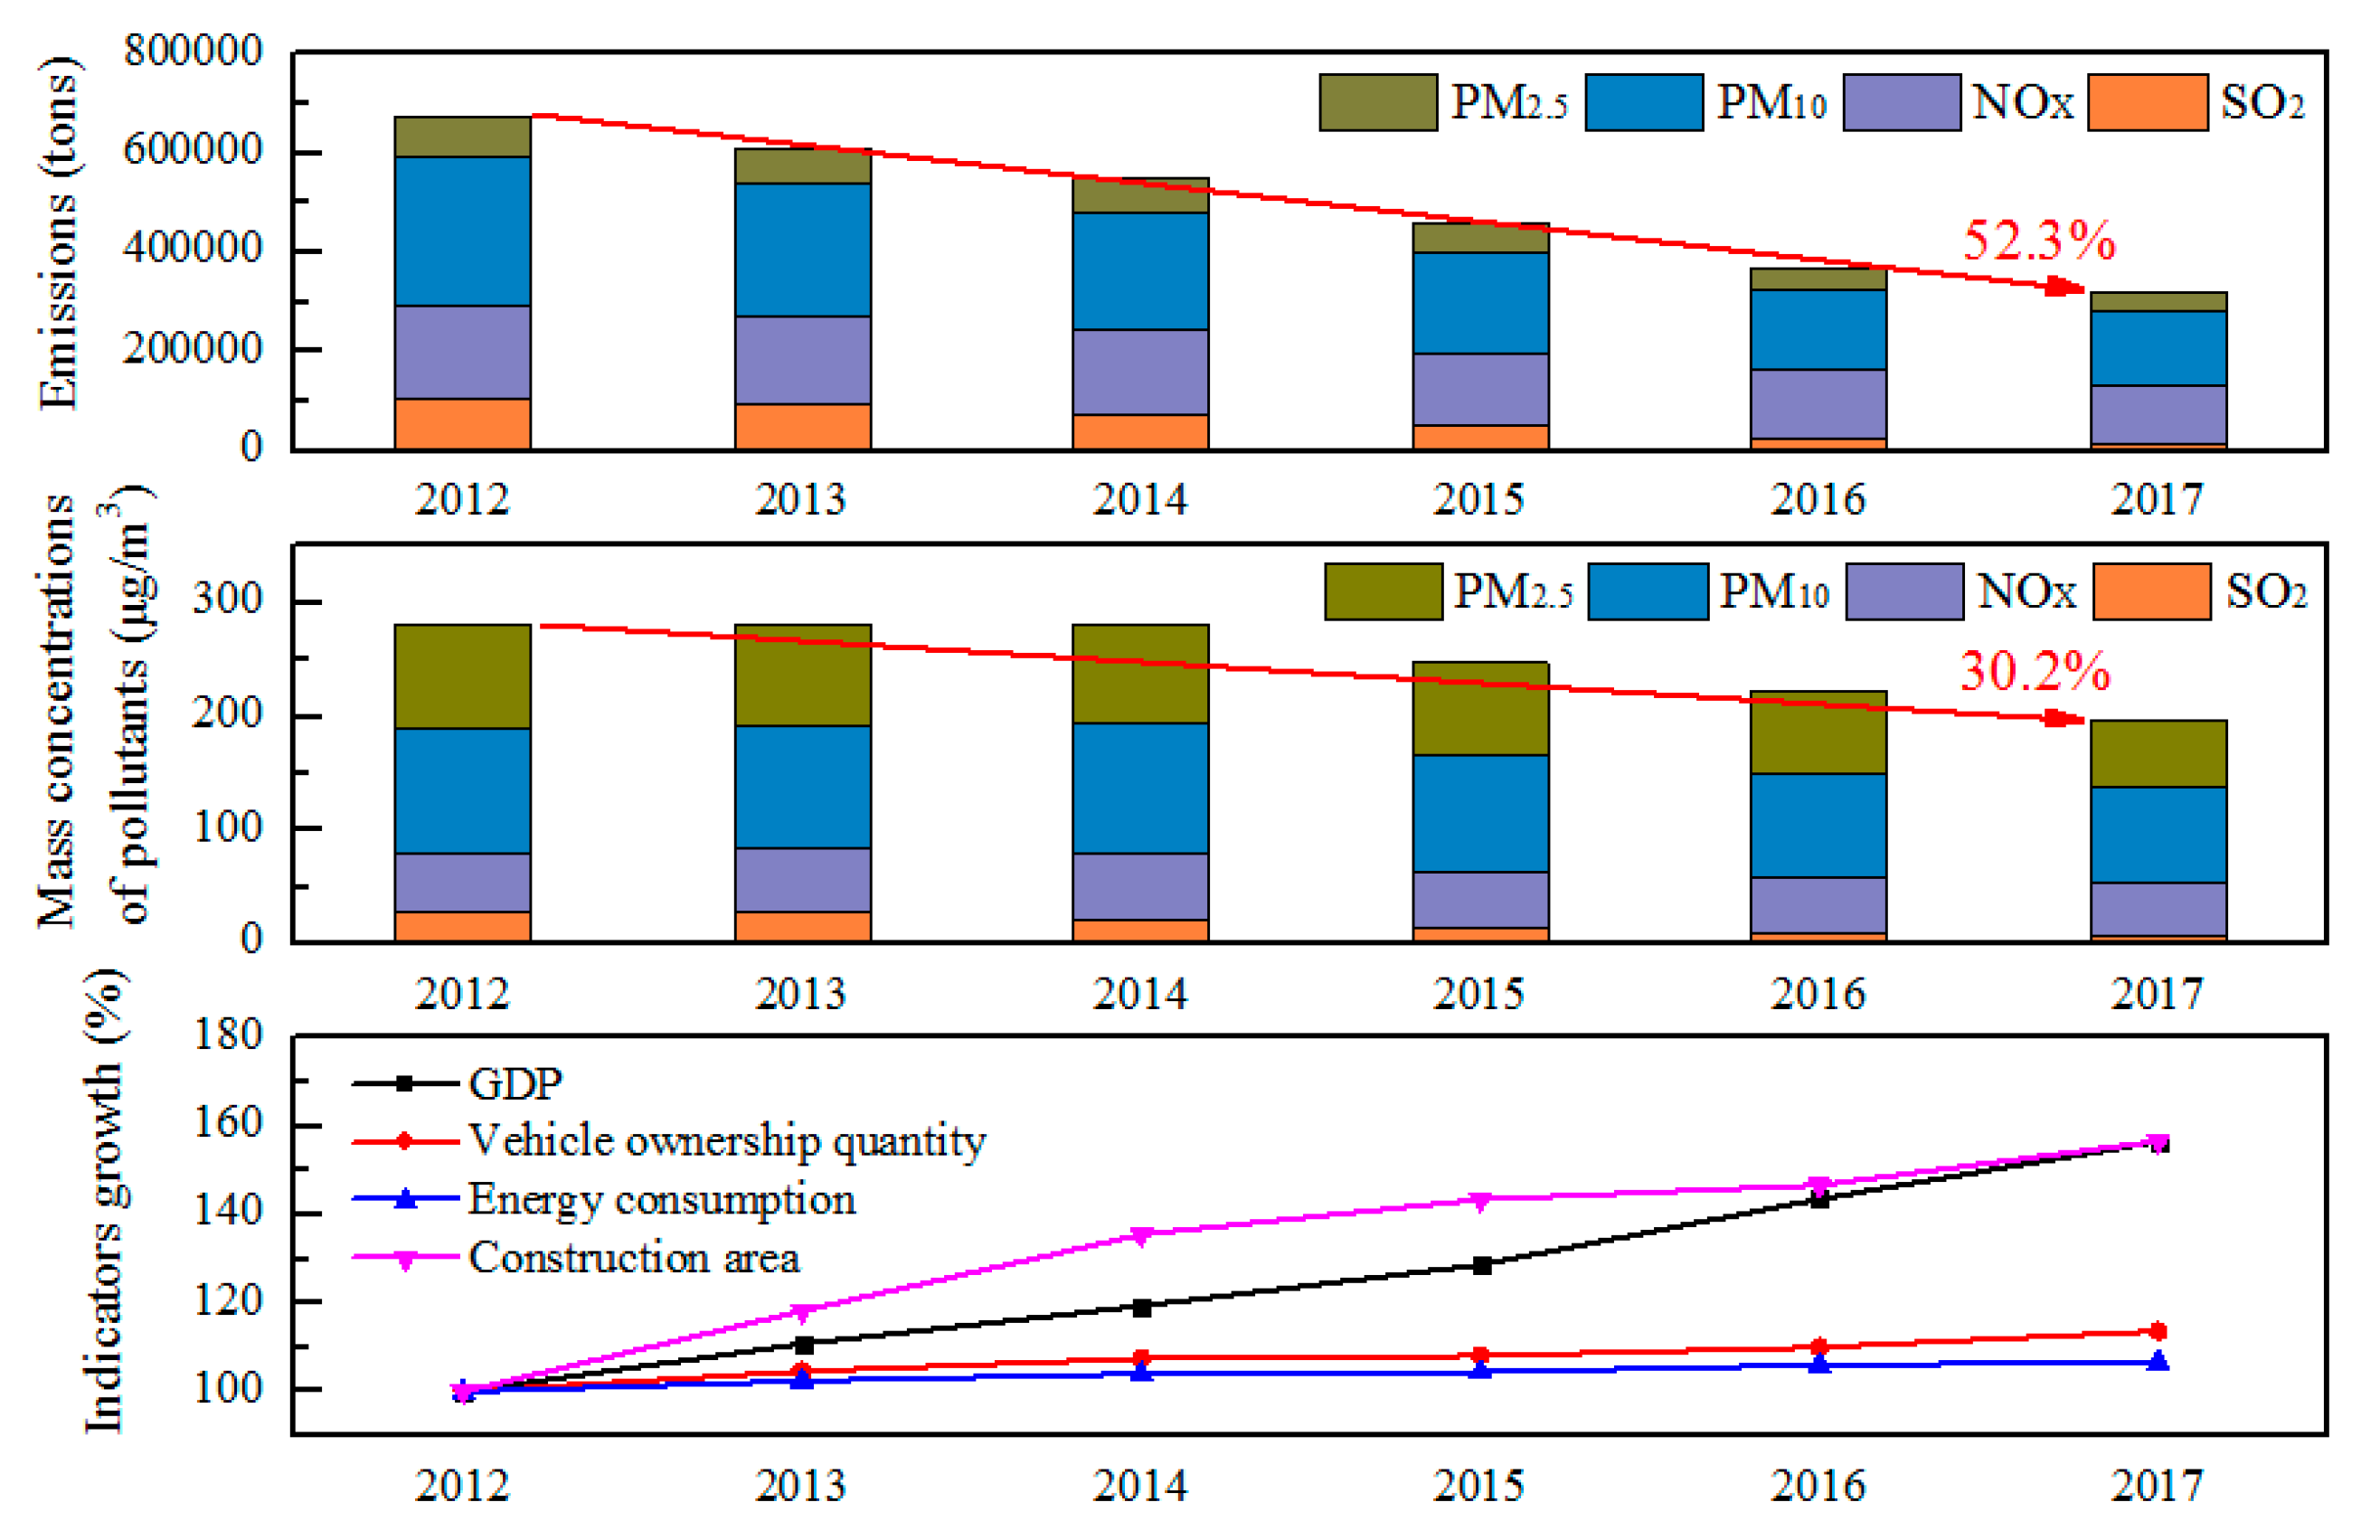
Figure 6.
Spatial distribution of PM2.5 concentration reduction caused by control measures in coal combustion (a), industry (b) and motor vehicle (c).
Figure 6.
Spatial distribution of PM2.5 concentration reduction caused by control measures in coal combustion (a), industry (b) and motor vehicle (c).
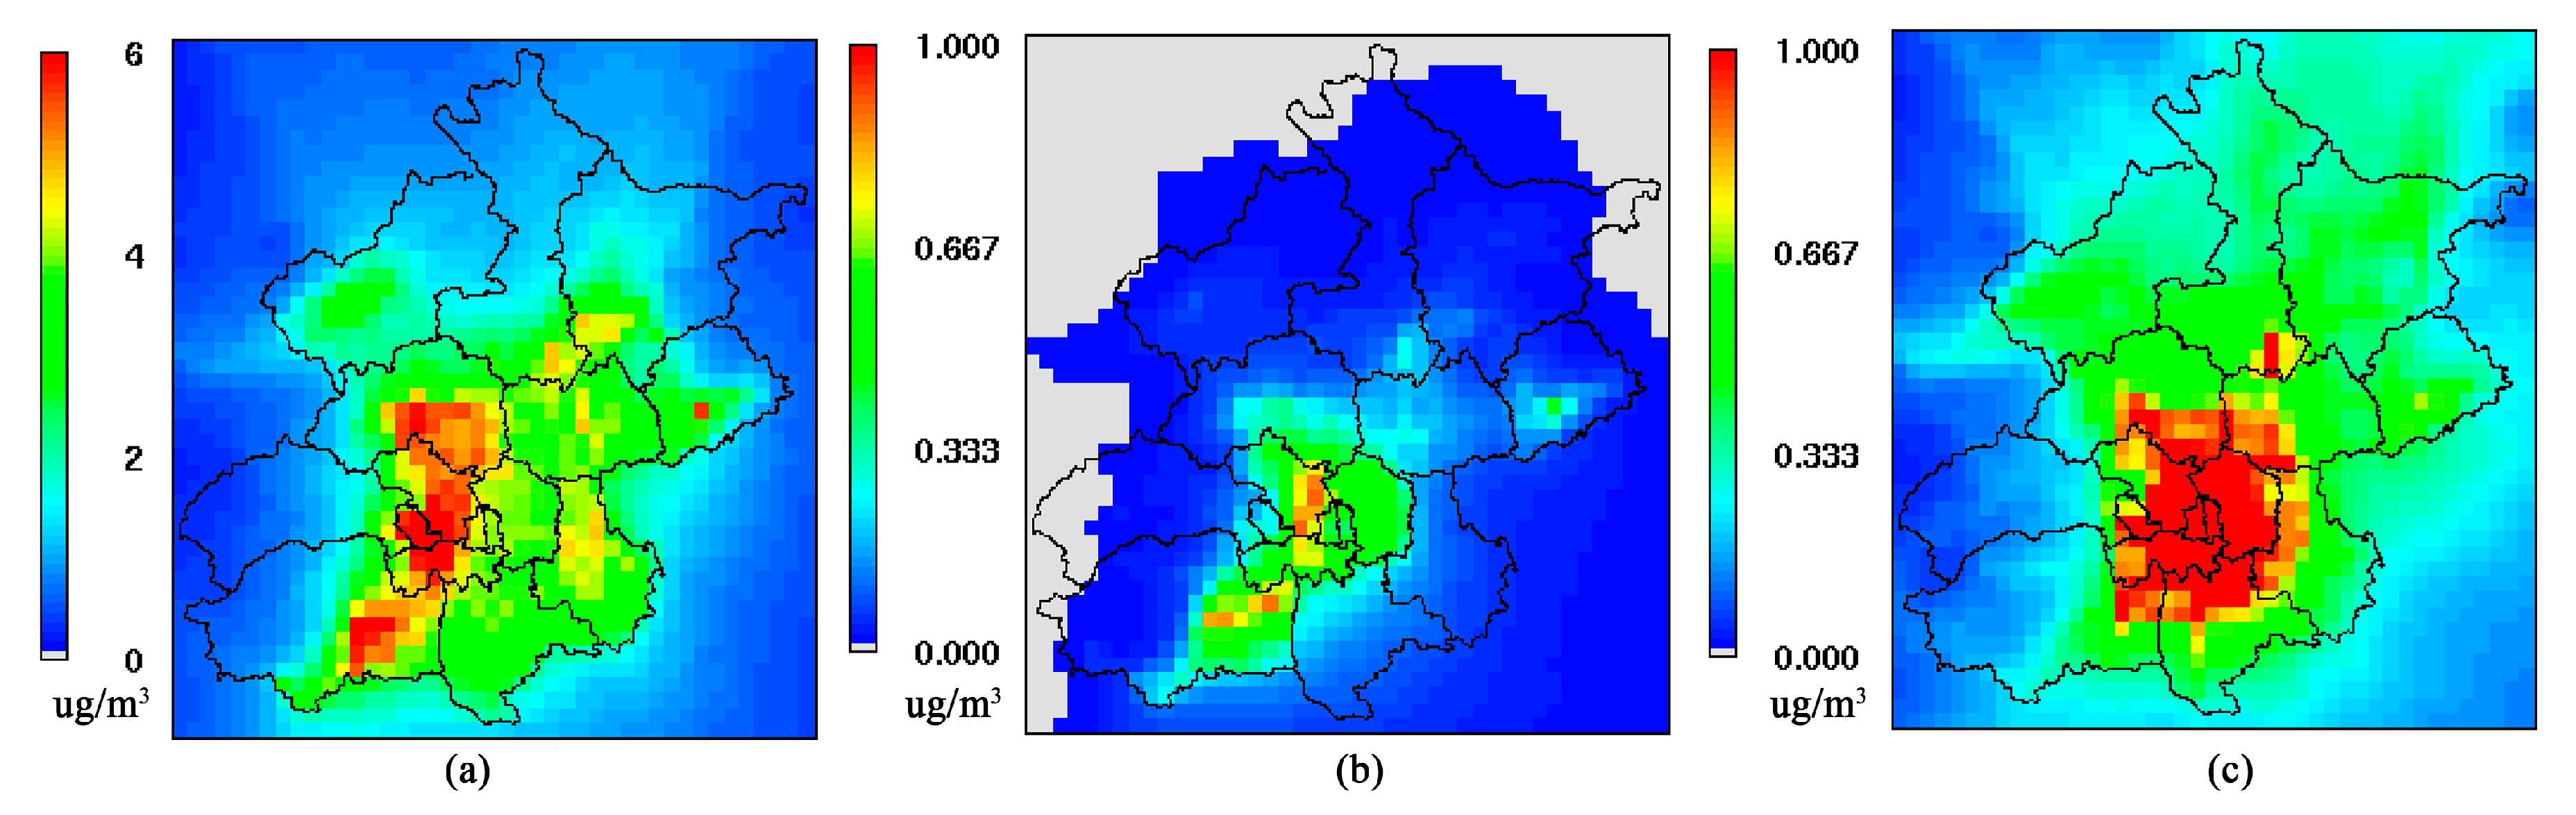
Figure 7.
Contribution to reduction of PM2.5 concentration by control measures in 2017 compared with 2013.
Figure 7.
Contribution to reduction of PM2.5 concentration by control measures in 2017 compared with 2013.

Table 1.
Emission reduction of air pollutants by implementing clean air action plan.
| Source Catalog | SO2 | NOX | PM10 | PM2.5 | VOCs | |
|---|---|---|---|---|---|---|
| Fossil fuel combustion | Power plant | 9993 | 19,054 | 2534 | 1495 | 356 |
| Industrial boiler | 61,221 | 28,812 | 25,909 | 15,286 | 539 | |
| Residential coal combustion | 36,550 | 8600 | 30,526 | 18,010 | 21,500 | |
| Industrial process | Industrial structure adjustment | 12,150 | 11,360 | 11,456 | 4530 | 46,847 |
| Solvent use | —— | 0 | 0 | 0 | 0 | 9385 |
| Mobile source | Vehicle | 10 | 48,265 | 1035 | 910 | 18,640 |
| Dust source | Road dust | 0 | 0 | 45,350 | 6420 | 0 |
| Total | 119,924 | 116,091 | 116,810 | 46,652 | 97,267 | |
© 2020 by the authors. Licensee MDPI, Basel, Switzerland. This article is an open access article distributed under the terms and conditions of the Creative Commons Attribution (CC BY) license (http://creativecommons.org/licenses/by/4.0/).
Share and Cite
MDPI and ACS Style
Xue, Y.; Zhang, S.; Nie, T.; Cao, X.; Shi, A. Environmental Effective Assessment of Control Measures Implemented by Clean Air Action Plan (2013–2017) in Beijing, China. Atmosphere 2020, 11, 189. https://doi.org/10.3390/atmos11020189
AMA Style
Xue Y, Zhang S, Nie T, Cao X, Shi A. Environmental Effective Assessment of Control Measures Implemented by Clean Air Action Plan (2013–2017) in Beijing, China. Atmosphere. 2020; 11(2):189. https://doi.org/10.3390/atmos11020189
Chicago/Turabian StyleXue, Yifeng, Shihao Zhang, Teng Nie, Xizi Cao, and Aijun Shi. 2020. "Environmental Effective Assessment of Control Measures Implemented by Clean Air Action Plan (2013–2017) in Beijing, China" Atmosphere 11, no. 2: 189. https://doi.org/10.3390/atmos11020189
Note that from the first issue of 2016, this journal uses article numbers instead of page numbers. See further details here.