Abstract
This study analyses Global Positioning System dropsondes to document the axisymmetric tropical cyclone (TC) boundary-layer structure, based on storm intensity. A total of 2608 dropsondes from 42 named TCs in the Atlantic basin from 1998 to 2017 are used in the composite analyses. The results show that the axisymmetric inflow layer depth, the height of maximum tangential wind speed, and the thermodynamic mixed layer depth are all shallower in more intense TCs. The results also show that more intense TCs tend to have a deep layer of the near-saturated air inside the radius of maximum wind speed (RMW). The magnitude of the radial gradient of equivalent potential temperature (θe) near the RMW correlates positively with storm intensity. Above the inflow layer, composite structures of TCs with different intensities all possess a ring of anomalously cool temperatures surrounding the warm-core, with the magnitude of the warm-core anomaly proportional to TC intensity. The boundary layer composites presented here provide a climatology of how axisymmetric TC boundary layer structure changes with intensity.
1. Introduction
Tropical cyclones (TCs) typically form over warm ocean regions and may strengthen when the environmental factors are favorable. Even in favorable conditions, TCs experience differing intensification rates due to internal processes. Accurate forecasts of TC track and intensity in numerical weather prediction models depend on multiple factors, but one important requirement is that the TC structure should be accurately represented. For instance, previous numerical studies have shown large sensitivities of TC intensity and structure to certain planetary boundary layer (PBL) parameterization schemes [,,,,]. The PBL physics regulates the strength of the inflow which is tied to TC spin-up via angular momentum advection []. It also affects the location of maximum low-level convergence and distribution of convection [,]. Thus, it is imperative to understand the TC boundary-layer structure for model physics evaluation and improvement purposes.
Since 1997, GPS-based dropsondes have been deployed in TCs during National Oceanic and Atmospheric Administration’s (NOAA) and Air Force’s research and reconnaissance missions []. Dropsondes measure quasi-vertical profiles of wind velocities, temperature, pressure and humidity between flight level and sea surface with a very high vertical resolution (<10 m). Dropsonde observations have been widely used for operational and research applications. In an operational framework, characteristics of the averaged wind profiles have been investigated in both eyewall and outside regions of TCs using dropsonde data []. Reduction factors are developed for estimating surface maximum winds from the flight level (~700 hPa), which are used by forecasters for making real-time estimates of TC intensity.
Previous studies have utilized dropsonde data to investigate both kinematic and thermodynamic structures of TCs. For example, Zhang et al. [] and Ming et al. [] have analyzed dropsonde data from multiple TCs to examine characteristic height scales of the boundary layer. Zhang et al. [] and Ren et al. [] have studied how the boundary layer height varies relative to the environmental shear and motion direction, respectively. Other aspects of the low-level TC structure have been investigated in several case studies, such as in Hurricanes Bonnie (1998, []), Edouard (2014, [,,]), and Earl (2010, [,]), as well as in studies using a composite approach [,].
This present study aims to investigate the relationship of the axisymmetric TC boundary-layer structure and storm intensity by compositing dropsonde data from multiple TCs. The objective is to create an observations-based climatology of the symmetric low-level (i.e., boundary layer) structure of a TC. Accurate forecasts of TC track and intensity require the TC vortex in numerical weather prediction models to be represented with enough accuracy in the model’s initial condition. Satellite-based observations can provide a reasonable estimate of TC horizontal structure, but they are limited by relatively low vertical resolution, especially in the boundary layer. The development of the GPS dropsonde has made it possible to obtain observations in nearly all portions of the TC with accuracy. The dropsonde composites can also be utilized for model evaluation purpose besides model initialization. Improved understanding of TC structural variation in response to storm intensity will provide useful information for forecasters to narrow the range of uncertainty in the intensity forecast, especially before TC landfalls.
2. Data and Methodology
This study uses a comprehensive database of GPS dropsonde profiles collected between 1998 to 2017 to diagnose the boundary-layer structure of TCs with different intensity. All dropsondes used here were deployed from either research or reconnaissance aircraft at 700–850 hPa pressure levels. A dropsonde descends with a speed of ~10 m s−1, collecting quasi-vertical atmospheric profiles of wind velocities, temperature, pressure, and humidity with a vertical resolution of less than 10 m. Details of instruments and their accuracies for a dropsonde can be referred to Hock and Franklin []. The raw dropsonde data are post-processed using the ASPEN program.
In order to stratify cases by storm intensity (defined as the maximum 1-min sustained surface wind speed at 10 m height), we use the intensity values provided by the National Hurricane Center’s (NHC) Best Track data []. We group the data by three classes of TC intensity: (1) Tropical Storm (17.5 m s−1 ≤ vmax < 32.5 m s−1), (2) Minor Hurricane (32.5 m s−1 ≤ vmax < 49 m s−1), and (3) Major Hurricane (vmax ≥ 49 m s−1). Table 1 lists the information of TCs and numbers of dropsonde profiles taken in each intensity class. A total of 42 TCs are included in the study. There are 641, 916, and 1051 dropsondes in the tropical-storm, minor-hurricane, and major-hurricane class, respectively. Figure 1 illustrates the horizontal distribution of dropsonde profiles for each intensity class. In all three TC intensity classes, the dropsondes are distributed evenly along azimuth and radius.

Table 1.
List of TCs and number of dropsondes. Date is in year and month format. For TC strength, TS represents tropical storm; H1, H2, H3, H4, and H5 represents Category 1, 2, 3, 4, and 5 hurricanes, respectively.
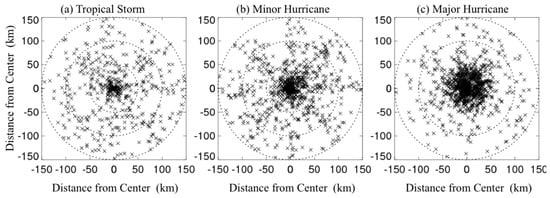
Figure 1.
Plan view of the dropsonde distribution in the azimuth-radial plane relative to the storm center for (a) tropical storms, (b) minor hurricanes, and (c) major hurricanes, respectively.
To compute the distance between each dropsonde and the TC center, Hurricane Research Division’s (HRD) 2-min-track dataset are used []. To put each dropsonde into normalized radial coordinates, we normalize the physical radius by the radius of maximum winds (RMW). Hourly estimates of the RMW are provided by the Tropical Cyclone Observations-Based Structure (TC-OBS) Database developed by the Tropical Cyclone Data Project at NCAR []. This new database was built using objective analysis methods, such as criteria-informed weighted averaging, to assess various storm parameters from high-resolution aircraft flight-level observations and vortex data messages.
The final step in the axisymmetric composite analysis places the dropsondes into normalized radial coordinates (i.e., r* = r/RMW). Figure 2 shows r*-z plot of dropsonde counts for each intensity class. The same composite method as in Zhang et al. [] is used in this study. For the inner-core region (), we use a radial bin width of 0.25 for the averaging. For the outer region, we use a bin width of 0.5. Note that the normalization by the RMW was conducted for individual dropsondes before the composite analysis.
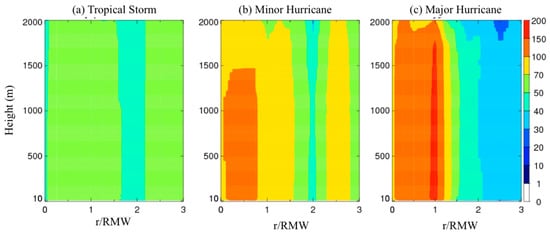
Figure 2.
Distribution of data counts in the normalized-radial and vertical plane for (a) tropical storms, (b) minor hurricanes, and (c) major hurricanes.
3. Results
The normalized radius-height representation of tangential velocities for the tropical-storm, minor-hurricane, and major-hurricane composites are displayed in Figure 3. In the major-hurricane composite, the maximum tangential wind speed is 58.1 m s−1 and is located at ~600 m altitude. For the minor-hurricane composite, the maximum tangential wind speed (Vt) is 44.7 m s−1 at ~800 m altitude. For the tropical-storm composite, the maximum Vt is 23.2 m s−1 at ~1000 m altitude. In each intensity class, the height of maximum Vt (hvtmax) increases with radius. Additionally, at a given radius, hvtmax decreases with the TC intensity. The tropical-storm composite shows that hvtmax increases to ~1300 m at 3 r*, while it only increases to ~1000 m in minor-hurricane and to ~800 m in major-hurricane composites. This structure of Vt in hurricane-strength TCs is consistent with that in previous studies (e.g., [,,,,]).
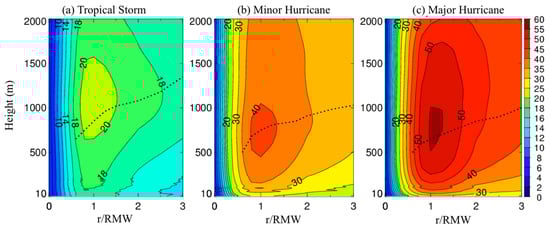
Figure 3.
Composite analysis of the tangential velocities (m s−1) as a function of altitude and normalized radius for (a) tropical storms, (b) minor hurricanes, and (c) major hurricanes. The dashed line in each panel depict the height of the maximum wind velocity as it varies with radius. The contour intervals in (a), (b), and (c) are 2, 5, and 5 m s−1, respectively.
To further elucidate the characteristics of Vt, each composite is normalized by its composite-maximum value of Vt (Figure 4). While the decreasing trend in hvtmax with increased TC intensity is evident, other interesting patterns are also revealed. Both the vertical and horizontal gradients of Vt increase with TC intensity. For example, at 3 r*, the tangential wind at 1000 m altitude is ~85% the peak value in tropical storms, while it is only ~70% the peak value in major hurricanes. The more rapid drop-off in Vt from their normalized values implies that the inertial stability is larger outside the eyewall region in more intense TCs. This corroborates the finding by Martinez et al. [] that “the eye and inner-core region of major hurricanes are much more inertially resistant compared to minor hurricanes.”
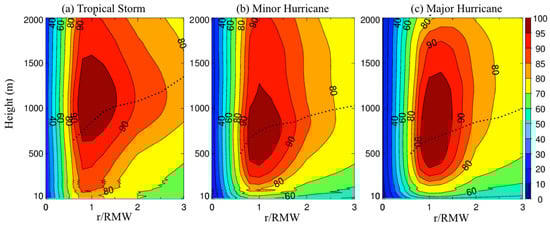
Figure 4.
Composite analysis of the tangential velocity, as a function of altitude and the normalized radius, normalized by the composite-peak values for (a) tropical storms, (b) minor hurricanes, and (c) major hurricanes.
To explore the variation of the inflow layer depth (hinflow) with storm intensity, Figure 5 shows the composite of the axisymmetric radial wind speed (Vr) for each intensity class, while Figure 6 shows the normalized Vr by the maximum inflow value. Here, hinflow is defined as the height of 10% of the maximum value of negative Vr []. The maximum values of radial inflow are 7.5, 15.6, and 20.7 m s−1 for tropical-storm, minor-hurricane, and major-hurricane composite, respectively. In all three composites, the radial inflow is strongest at ~150 m altitude and is located between and . However, the shape of the radial wind field varies largely between the different intensity classes. The major-hurricane composite is the only one with a pronounced outflow above the boundary layer. In the major-hurricane composite, hinflow is ~800 m near , decreases towards the storm center to ~500 m at . In the tropical-storm composite, the 10% contour is above 1000 m outside , which is larger than that in either the major- or minor-hurricane composite. In the minor-hurricane composite, hinflow is nearly 1000 m at and decreases to ~750 m at .
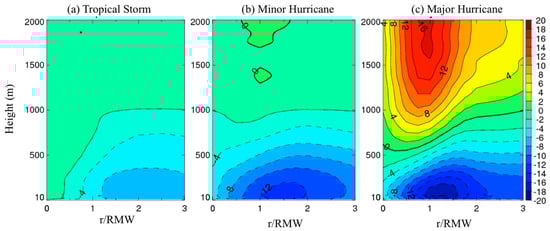
Figure 5.
Composite analysis results of the radial wind velocity (m s−1) as a function of altitude and normalized radius for (a) tropical storms, (b) minor hurricanes, and (c) major hurricanes. Contour interval is 2 m s−1 in all panels.
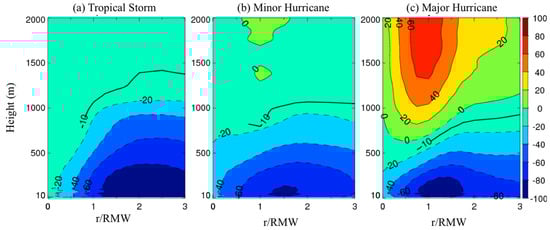
Figure 6.
Composite analysis of the radial wind velocity normalized by the peak values in percentage (%) as a function of altitude and normalized radius for (a) tropical storms, (b) minor hurricanes, and (c) major hurricanes.
The thermodynamic mixed layer depth (zi) is estimated based on the profiles of virtual potential temperature, , taken as the height where the lapse rate of is 3 K km−1 []. The composite implies that the boundary layer is warmer and/or moister in more intense storms (Figure 7). As one might expect, the magnitude of is larger at almost all vertical levels at a given radius in stronger TCs than in weaker ones. A well-mixed layer is below 600 m altitude between and in the tropical-storm composite (Figure 8a), which is below 550 m between and in the minor-hurricane composite (Figure 8b), and is below 500 m beyond in the major-hurricane composite (Figure 8c). Additionally, zi decreases with decreasing radius for all three intensity classes. At a given radius, zi is larger for TCs with weaker intensity. However, in all the composites, zi is much less than hvtmax or hinflow. The largest zi is ~500 m at r* = 3 in the tropical-storm class. Close to the eyewall (i.e., RMW = 1), zi is below ~250 m in all three intensity classes. Furthermore, the lapse rate of virtual potential temperature (Figure 8) shows that the near-surface layer is much more unstable (i.e., larger values of negative gradient) in weaker TCs.
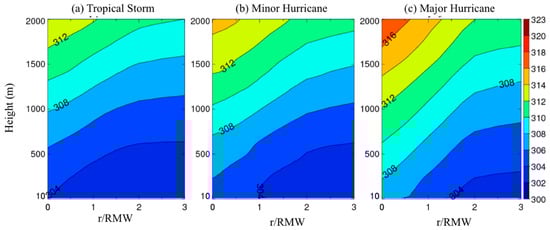
Figure 7.
Composite analysis of the virtual potential temperature (in K) as a function of altitude and normalized radius to the storm center for (a) tropical Storms, (b) minor hurricanes, and (c) major hurricanes. The contour interval is 2 K in all panels.
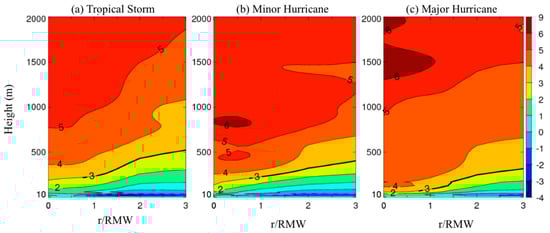
Figure 8.
Composite analysis of the lapse rate of virtual potential temperature (in K km−1) as a function of altitude and normalized radius for (a) tropical storms, (b) minor hurricanes, and (c) major hurricanes. The thick black line represents the contour of K km−1. The contour interval is 1 K km−1 in all panels.
The last boundary layer height definition is based on the height at which the bulk Richardson number is equal to a critical value of 0.25 (hRic). This method has been widely applied in the PBL schemes of numerical models [,,]. Interestingly, hRic is generally larger in more intense TCs at a given radius (Figure 9). hRic generally has a decreasing trend with decreasing radius in all three intensity classes, although there is a relatively large drop toward the storm center just outside r* = 1 in the major-hurricane class. Note that the difference in the magnitude of Richardson number among the intensity classes is mainly due to the difference in wind shear, as the difference in the static stability is small among the intensity classes as shown in Figure 8.
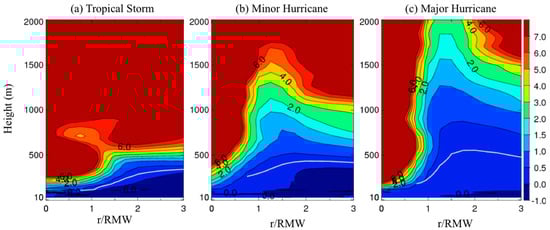
Figure 9.
Composite analysis of the Richardson numbers as a function of altitude and normalized radius for (a) tropical storms, (b) minor hurricanes, and (c) major hurricanes. The gray line in each panel show the 0.25 contour.
Next, we evaluate the differences in the thermal structures between the three intensity classes. Generally, the relative humidity decreases with height in all three composites (Figure 10). The relative humidity is the largest inside the RMW for all three intensity classes and is larger at almost all vertical levels at a given radius for more intense TCs. The major-hurricane composite shows nearly saturated (i.e., relative humidity >95%) air below 400 m and inside the RMW, while at the same region in the tropical-storm composite the relative humidity only approaches ~91%. Overall, more intense TCs tend to have a deeper layer of near-saturated air. These differences are consistent throughout the inflow layer and extend radially out to r* = 3.
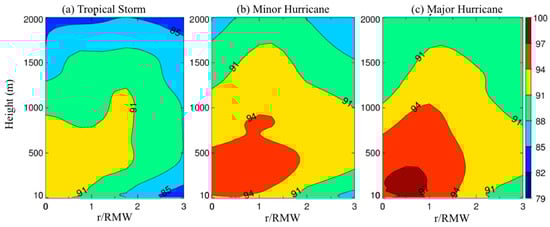
Figure 10.
Composite analysis of relative humidity (%) as a function of altitude and normalized radius for (a) tropical storms, (b) minor hurricanes, and (c) major hurricanes. The contour interval is 3% in all panels.
The distribution of equivalent potential temperature () in each composite is qualitatively consistent with that of the relative humidity distribution below 1000 m (Figure 11). It appears that increases as both height and radius decrease, and in general, the magnitude of near-surface increases as TC intensity increases. In the major-hurricane composite, the isolines of are nearly vertical near the RMW, while in less intense storm composites, the isolines tend to bend inward with height. Furthermore, the radial gradient of differs between the three TC classes (Figure 12). Outside the RMW, the radial gradient is much larger for more intense TCs. This result agrees with the maximum potential intensity theory given by Emanuel [] and numerical simulation result given by Bryan and Rotunno [].
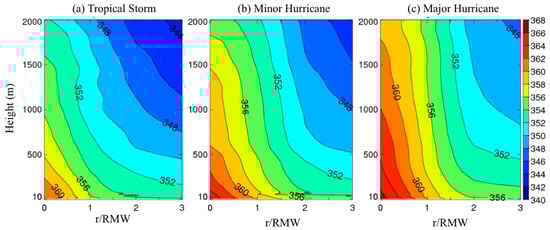
Figure 11.
Composite analysis of equivalent potential temperature (in K) as a function of altitude and normalized radius for (a) tropical storms, (b) minor hurricanes, and (c) major hurricanes. The contour interval is 2 K in all panels.
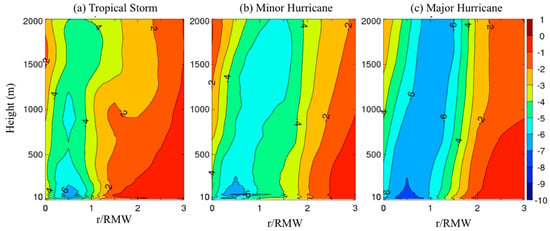
Figure 12.
Composite analysis of the radial derivative of equivalent potential temperature as a function of altitude and normalized radius for (a) tropical storms, (b) minor hurricanes, and (c) major hurricanes. The contour interval is 1 K km−1 in all panels.
To examine the low-level warm-core structure, we present composites of the temperature anomaly. Here, the temperature anomaly is computed as the difference between the TC temperature and environmental temperature. The environmental reference temperature is taken as the average temperature within and radii [,]. Here, the environmental dropsonde data are from the G-IV aircraft. There are a total of 78, 43, and 37 environmental dropsondes for tropical-storm, minor-hurricane, and major-hurricane class, respectively. Note that we extend the temperature anomaly composite to 4800 m in the vertical and 4 r* in the radii (Figure 13). A cold temperature anomaly exists in the low levels of all three composites, which is mainly a result of adiabatic expansion due to the low pressure at the storm center. The coldest anomaly exists in the major hurricane group. According to balanced dynamics, this low-level cold anomaly (along with the effect of friction) may help explain why the maximum tangential wind is found near 500 m rather than at the ground []. Of note, one needs to consider unbalanced dynamics in the TC boundary layer as well, especially in intense storms [,,,].
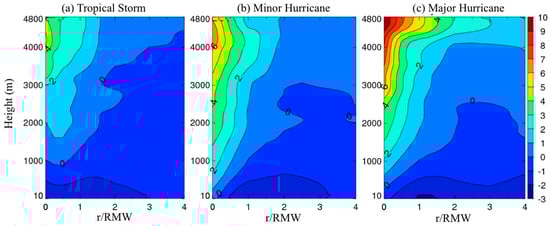
Figure 13.
Composite analysis of the temperature anomaly (in K) as a function of altitude and normalized radius for (a) tropical storms, (b) minor hurricanes, and (c) major hurricanes. The contour interval is 1 K in all panels.
In all three composites, the warm core expands outwards with height above 1000 m altitude, where the cold perturbation gradually diminishes with radius. The magnitudes of temperature anomalies are weaker for less intense TCs in agreement with previous studies [,,,]. The warm-core anomaly maximum is ~10 K in major hurricanes, while it is only ~4 K in tropical storms. Even so, the maximum warm-core anomaly occurs at similar heights in all three composites.
4. Discussion and Conclusions
This study constructed composites of dropsonde data to study the low-level structure of TCs of different intensity. After pairing these dropsondes with available TC parameters from the Best Track and the TC-OBS Database, 2608 dropsonde profiles from 42 North Atlantic TCs were analyzed over the period from 1998 to 2017. Composite analyses of inner-core structure of tangential wind, radial wind, virtual potential temperature, relative humidity, equivalent potential temperature, and temperature anomaly are conducted for three intensity classes: tropical-storm, minor- and major- hurricanes. The first part of this study is a follow-up to Zhang et al. []. Note that that study [] analyzed a much smaller number of dropsondes than our study. The uniqueness of the current composite analysis is the inclusion of a tropical storm group, an intensity category that has not been previously sampled as frequently.
Figure 14 presents a schematic diagram synthesizing the results of boundary-layer heights (hinflow, hvtmax, zi, and hRic) for the three TC intensity classes. All these height scales show a general decreasing trend with decreasing radius outside the RMW. While hinflow and hvtmax are close to each other, zi, and hRic are much smaller than hinflow in all intensity classes.
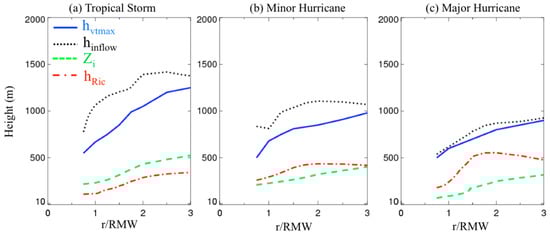
Figure 14.
A schematic plot summarizing the height scales in the composites of (a) tropical storms, (b) minor hurricanes, and (c) and major hurricanes. Note that hvtmax is the height of maximum tangential wind speed; hinflow is the inflow layer depth, Zi is the thermodynamic mixed layer depth, and hRic is the boundary layer height based on critical Richardson number method.
The result that more intense TCs tend to have a shallower boundary layer outside the RMW may be explained by the dynamical scaling (i.e., the square root of the ratio of the vertical eddy diffusivity and the inertial stability) []. It is expected that the inertial stability increases with the wind speed. In-situ aircraft data indicated that the vertical eddy diffusivity increases nearly linearly with the wind speed [,,]. However, the inertial stability increases faster than the vertical eddy diffusivity as the wind speed increases, because the inertial stability is nearly a function of the square of the wind speed. This may explain why stronger TCs tend to have shallower boundary layers.
In addition to the boundary-layer height, this study also investigated differences in the thermal structure among TCs of different intensities. The composites of all TC intensity classes possess a cold temperature anomaly surrounding the warm core near the top of the inflow layer with larger warm-core anomaly in more intense TCs. The result also suggests that more intense TCs have a deep layer of the near-saturated air in the eyewall region. The moisture differences between the three intensity classes may be tied to different strengths of turbulent mixing in TCs with different intensity. As stronger TCs tend to have larger turbulent mixing in a deeper layer as indicted by hRic, the near-saturated air near the sea surface could be mixed to higher levels in the boundary layer in stronger TCs.
The equivalent potential temperature increases as both radial distance and height decrease, and this trend is qualitatively consistent with the relative humidity distribution in all groups. In the eyewall region, the vertical variation of is much smaller in stronger TCs than in weaker TCs. On the other hand, the magnitude of the radial variation of is much larger in stronger TCs than in weaker TCs, especially in the eyewall region.
The TC-intensity based dropsonde composites in this study have several applications for TC forecast and research. For example, these composites can be used to identify deficiencies in the existing algorithms to construct initial bogus vortices for TC forecast models. One could also use these composites to validate TC structure in numerical simulations or forecasts over a TC’s life cycle, during its transition from a tropical-storm stage to minor-hurricane and/or major-hurricane stages. Such an examination may help identify potential deficiencies in model physics that can be reduced to improve TC track and intensity forecasts. The observed structural differences in TCs with different storm strengths may also assist forecasters to estimate potential TC intensity change in real time. The structural differences between weak and strong TCs can also be useful in the communication of intensity forecasts from the forecasters to public audiences.
Author Contributions
Conceptualization, Y.R., J.A.Z. and X.W.; methodology, Y.R., J.A.Z., X.W., and J.L.V.; software, X.W.; validation, J.A.Z., X.W, J.B.W. and P.Z.; formal analysis, Y.R., X.W., J.B.W.; investigation, Y.R., H.L., and J.A.Z.; resources, X.W., Y.R., J.A.Z., P.Z. and J.B.W.; data curation, J.A.Z., J.L.V., X.W.; writing—original draft preparation, Y.R., J.A.Z., J.L.V., X.W.; writing—review and editing, J.A.Z., J.L.V., P.Z., H.L., J.B.W.; visualization, Y.R., X.W.; supervision, J.A.Z., J.L.V.; project administration, X.W.; funding acquisition, J.A.Z., J.L.V., P.Z., X.W. All authors have read and agree to the published version of the manuscript.
Funding
The research material contributed by J.A.Z. and P.Z. was funded by National Science Foundation with grant numbers AGS1822128 and AGS-1822238, and by NOAA with grant numbers NA14NWS4680030 and NA16NWS4680029. The research material contributed by J. V. was based upon work supported by the National Center for Atmospheric Research, which is a major facility sponsored by the National Science Foundation under Cooperative Agreement No. 1852977. Joshua Wadler was supported by the National Science Foundation Graduate Research Fellowship under Grant No. DGE-1451511.
Acknowledgments
The authors acknowledge scientists and crew who participated the aircraft missions that helped collect the drosonde data used in this work. We acknowledge Kathryn Sellwood for helpful comments and suggestions.
Conflicts of Interest
The authors declare no conflict of interest.
References
- Braun, S.A.; Tao, W.K. Sensitivity of High-Resolution Simulations of Hurricane Bob (1991) to Planetary Boundary Layer Parameterizations. Mon. Weather. Rev. 2000, 128, 3941–3961. [Google Scholar] [CrossRef]
- Nolan, D.S.; Zhang, J.A.; Stern, D.P. Evaluation of planetary boundary layer parameterizations in tropical cyclones by comparison of in situ data and high-resolution simulations of Hurricane Isabel (2003). Part I: Initialization, maximum winds, and outer-core boundary layer structure. Mon. Weather Rev. 2009, 137, 3651–3674. [Google Scholar] [CrossRef]
- Smith, R.K.; Thomsen, G.L. Dependence of tropical-cyclone intensification on the boundary-layer representation in a numerical model. Q. J. R. Meteorol. Soc. 2010, 136, 1671–1685. [Google Scholar] [CrossRef]
- Kepert, J.D. Choosing a Boundary Layer Parameterization for Tropical Cyclone Modeling. Mon. Weather Rev. 2012, 140, 1427–1445. [Google Scholar] [CrossRef]
- Zhu, P.; Menelaou, K.; Zhu, Z. Impact of sub-grid scale vertical turbulent mixing on eyewall asymmetric structures and mesovortices of hurricanes. Q. J. R. Meteorol. Soc. 2013, 140, 416–438. [Google Scholar] [CrossRef]
- Montgomery, M.; Smith, R. Paradigms for tropical cyclone intensification. J. South. Hemisph. Earth Syst. Sci. 2014, 64, 37–66. [Google Scholar] [CrossRef]
- Zhang, J.A.; Rogers, R.F.; Tallapragada, V. Impact of Parameterized Boundary Layer Structure on Tropical Cyclone Rapid Intensification Forecasts in HWRF. Mon. Weather Rev. 2017, 145, 1413–1426. [Google Scholar] [CrossRef]
- Zhang, J.A.; Rogers, R.F. Effects of Parameterized Boundary Layer Structure on Hurricane Rapid Intensification in Shear. Mon. Weather Rev. 2019, 147, 853–871. [Google Scholar] [CrossRef]
- Hock, T.F.; Franklin, J.L. The NCAR GPS Dropwindsonde. Bull. Am. Meteorol. Soc. 1999, 80, 407–420. [Google Scholar] [CrossRef]
- Franklin, J.L.; Black, M.L.; Valde, K. GPS Dropwindsonde Wind Profiles in Hurricanes and Their Operational Implications. Weather Forecast. 2003, 18, 32–44. [Google Scholar] [CrossRef]
- Zhang, J.A.; Rogers, R.F.; Nolan, D.S.; Marks, F.D., Jr. On the Characteristic Height Scales of the Hurricane Boundary Layer. Mon. Weather Rev. 2011, 139, 2523–2535. [Google Scholar] [CrossRef]
- Ming, J.; Zhang, J.A.; Rogers, R.F. Typhoon kinematic and thermodynamic boundary layer structure from dropsonde composites. J. Geophys. Res. Atmos. 2015, 120, 3158–3172. [Google Scholar] [CrossRef]
- Zhang, J.A.; Rogers, R.F.; Reasor, P.D.; Uhlhorn, E.W.; Marks, F.D. Asymmetric Hurricane Boundary Layer Structure from Dropsonde Composites in Relation to the Environmental Vertical Wind Shear. Mon. Weather Rev. 2013, 141, 3968–3984. [Google Scholar] [CrossRef]
- Ren, Y.; Zhang, J.A.; Guimond, S.R.; Wang, X. Hurricane Boundary Layer Height Relative to Storm Motion from GPS Dropsonde Composites. Atmosphere 2019, 10, 339. [Google Scholar] [CrossRef]
- Barnes, G.M. Atypical Thermodynamic Profiles in Hurricanes. Mon. Weather Rev. 2008, 136, 631–643. [Google Scholar] [CrossRef]
- Rogers, R.F.; Zhang, J.A.; Zawislak, J.; Jiang, H.; Alvey, G.R., III; Zipser, E.J.; Stevenson, S.N. Observations of the structure and evolution of Hurricane Edouard (2014) during intensity change, Part II: Kinematic structure and the distribution of deep convection. Mon. Weather Rev. 2016, 144, 3355–3376. [Google Scholar] [CrossRef]
- Zawislak, J.; Jiang, H.; Alvey, G.R., III; Zipser, E.J.; Rogers, R.F.; Zhang, J.A.; Stevenson, S.N. Observations of the structure and evolution of Hurricane Edouard (2014) during intensity change. Part I: Relationship between the thermodynamic structure and precipitation. Mon. Weather Rev. 2016, 144, 3333–3354. [Google Scholar] [CrossRef]
- Zhang, J.A.; Cione, J.J.; Kalina, E.A.; Uhlhorn, E.W.; Hock, T.; Smith, J.A. Observations of Infrared sea surface temperature and air-sea interaction in Hurricane Edouard (2014) using GPS dropsondes. J. Atmos. Ocean. Technol. 2017, 34, 1333–1349. [Google Scholar] [CrossRef]
- Rogers, R.F.; Reasor, P.D.; Zhang, J.A. Multiscale Structure and Evolution of Hurricane Earl (2010) during Rapid Intensification. Mon. Weather Rev. 2015, 143, 536–562. [Google Scholar] [CrossRef]
- Wadler, J.B.; Zhang, J.A.; Jaimes, B.; Shay, L.K. Downdrafts and the Evolution of Boundary Layer Thermodynamics in Hurricane Earl (2010) before and during Rapid Intensification. Mon. Weather Rev. 2018, 146, 3545–3565. [Google Scholar] [CrossRef]
- Ahern, K.; Bourassa, M.A.; Hart, R.E.; Zhang, J.A.; Rogers, R.F. Observed Kinematic and Thermodynamic Structure in the Hurricane Boundary Layer during Intensity Change. Mon. Weather. Rev. 2019, 147, 2765–2785. [Google Scholar] [CrossRef]
- Nguyen, L.T.; Rogers, R.; Zawislak, J.; Zhang, J.A. Assessing the Influence of Convective Downdrafts and Surface Enthalpy Fluxes on Tropical Cyclone Intensity Change in Moderate Vertical Wind Shear. Mon. Weather Rev. 2019, 147, 3519–3534. [Google Scholar] [CrossRef]
- Landsea, C.W.; Franklin, J.L. Atlantic Hurricane Database Uncertainty and Presentation of a New Database Format. Mon. Weather Rev. 2013, 141, 3576–3592. [Google Scholar] [CrossRef]
- Willoughby, H.E.; Chelmow, M.B. Objective Determination of Hurricane Tracks from Aircraft Observations. Mon. Weather Rev. 1982, 110, 1298–1305. [Google Scholar] [CrossRef]
- TC-OBS: The Tropical Cyclone Observations-Based Structure Database, version 0.42, an alpha-level release; Tropical Cyclone Data Project, National Center for Atmospheric Research, Research Applications Laboratory: Boulder, CO, USA, 2018. [CrossRef]
- Martinez, J.; Bell, M.M.; Vigh, J.L.; Rogers, R.F. Examining Tropical Cyclone Structure and Intensification with the FLIGHT+ Dataset from 1999 to 2012. Mon. Weather Rev. 2017, 145, 4401–4421. [Google Scholar] [CrossRef]
- Troen, I.B.; Mahrt, L. A simple model of the atmospheric boundary layer; sensitivity to surface evaporation. Bound.-Layer Meteorol. 1986, 37, 129–148. [Google Scholar] [CrossRef]
- Vogelezang, D.H.P.; Holtslag, A.A.M. Evaluation and model impacts of alternative boundary-layer height formulations. Bound.-Layer Meteorol. 1996, 81, 245–269. [Google Scholar] [CrossRef]
- Zhang, J.A.; Nolan, D.S.; Rogers, R.F.; Tallapragada, V. Evaluating the Impact of Improvements in the Boundary Layer Parameterization on Hurricane Intensity and Structure Forecasts in HWRF. Mon. Weather Rev. 2015, 143, 3136–3155. [Google Scholar] [CrossRef]
- Emanuel, K.A. An Air-Sea Interaction Theory for Tropical Cyclones. Part I: Steady-State Maintenance. J. Atmos. Sci. 1986, 43, 585–605. [Google Scholar] [CrossRef]
- Bryan, G.H.; Rotunno, R. The maximum intensity of tropical cyclones in axisymmetry numerical model simulations. Mon. Weather Rev. 2009, 137, 1770–1789. [Google Scholar] [CrossRef]
- Stern, D.P.; Nolan, D.S. On the Height of the Warm Core in Tropical Cyclones. J. Atmos. Sci. 2012, 69, 1657–1680. [Google Scholar] [CrossRef]
- Stern, D.P.; Zhang, F. How Does the Eye Warm? Part I: A Potential Temperature Budget Analysis of an Idealized Tropical Cyclone. J. Atmos. Sci. 2013, 70, 73–90. [Google Scholar] [CrossRef]
- Ooyama, K. Numerical Simulation of the Life Cycle of Tropical Cyclones. J. Atmos. Sci. 1969, 26, 3–40. [Google Scholar] [CrossRef]
- Bell, M.M.; Montgomery, M.T. Observed Structure, Evolution, and Potential Intensity of Category 5 Hurricane Isabel (2003) from 12 to 14 September. Mon. Weather Rev. 2008, 136, 2023–2046. [Google Scholar] [CrossRef]
- Smith, R.K.; Montgomery, M.T.; Van Sang, N. Tropical cyclone spin-up revisited. Q. J. R. Meteorol. Soc. 2009, 135, 1321–1335. [Google Scholar] [CrossRef]
- Smith, R.K.; Zhang, J.A.; Montgomery, M.T. The dynamics of intensification in a Hurricane Weather and Research Forecast of Hurricane Earl (2010). Q. J. R. Meteorol. Soc. 2017, 143, 297–308. [Google Scholar] [CrossRef]
- Montgomery, M.T.; Zhang, J.A.; Smith, R.K. An analysis of the observed low-level structure of rapidly intensifying and mature hurricane Earl (2010). Q. J. R. Meteorol. Soc. 2014, 140, 2132–2146. [Google Scholar] [CrossRef]
- Zhang, D.-L.; Chen, H. Importance of the upper-level warm core in the rapid intensification of a tropical cyclone. Geophys. Res. Lett. 2012, 39. [Google Scholar] [CrossRef]
- Durden, S.L. Observed Tropical Cyclone Eye Thermal Anomaly Profiles Extending above 300 hPa. Mon. Weather Rev. 2013, 141, 4256–4268. [Google Scholar] [CrossRef]
- Kepert, J.; Wang, Y. The dynamics of boundary layer jets within the tropical cyclone core. Part II: Nonlinear enhancement. J. Atmos. Sci. 2001, 58, 2485–2501. [Google Scholar] [CrossRef]
- Zhang, J.A.; Drennan, W.M. An Observational Study of Vertical Eddy Diffusivity in the Hurricane Boundary Layer. J. Atmos. Sci. 2012, 69, 3223–3236. [Google Scholar] [CrossRef]
- Zhang, J.A.; Marks, F.D.; Montgomery, M.T.; Lorsolo, S. An Estimation of Turbulent Characteristics in the Low-Level Region of Intense Hurricanes Allen (1980) and Hugo (1989). Mon. Weather Rev. 2011, 139, 1447–1462. [Google Scholar] [CrossRef]
- Lorsolo, S.; Zhang, J.A.; Marks, F.; Gamache, J. Estimation and Mapping of Hurricane Turbulent Energy Using Airborne Doppler Measurements. Mon. Weather Rev. 2010, 138, 3656–3670. [Google Scholar] [CrossRef]
© 2020 by the authors. Licensee MDPI, Basel, Switzerland. This article is an open access article distributed under the terms and conditions of the Creative Commons Attribution (CC BY) license (http://creativecommons.org/licenses/by/4.0/).