A Decade of Aerosol Optical Properties Measurements over Athens, Greece

 ,
, 
 ,
, 

Abstract
1. Introduction
2. Data and Methodology
2.1. Theoretical Background
2.2. Site
2.3. Measurements
3. Results
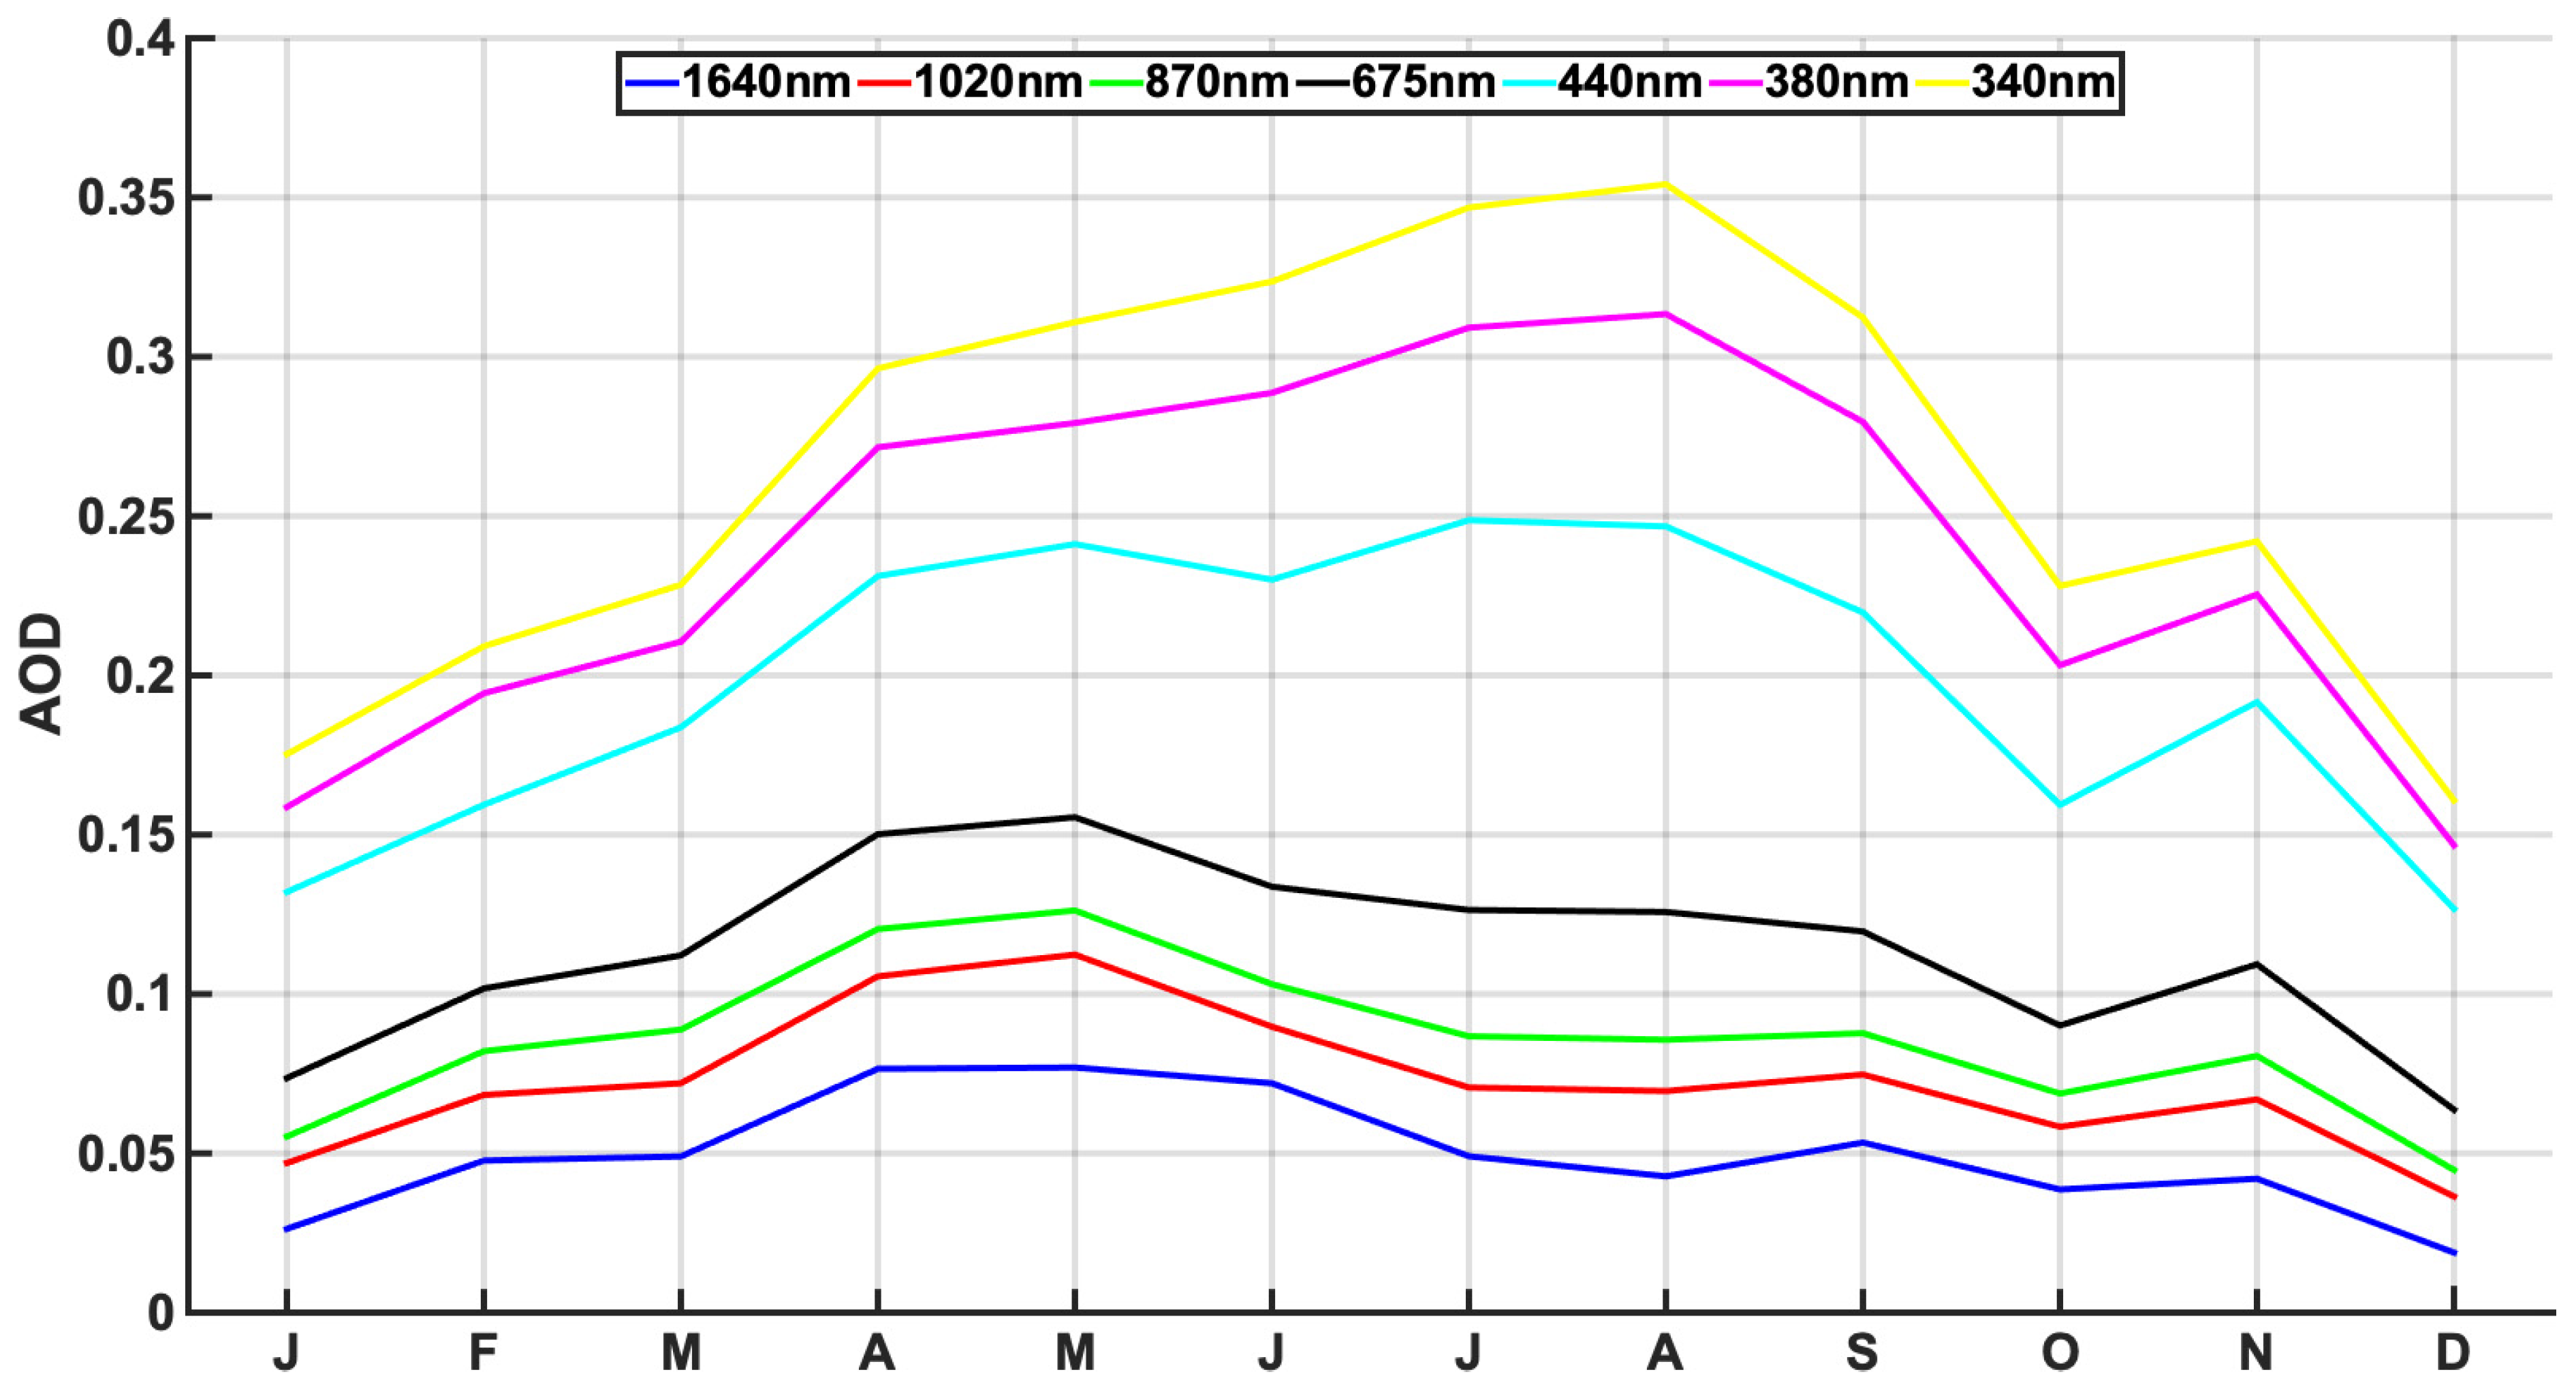
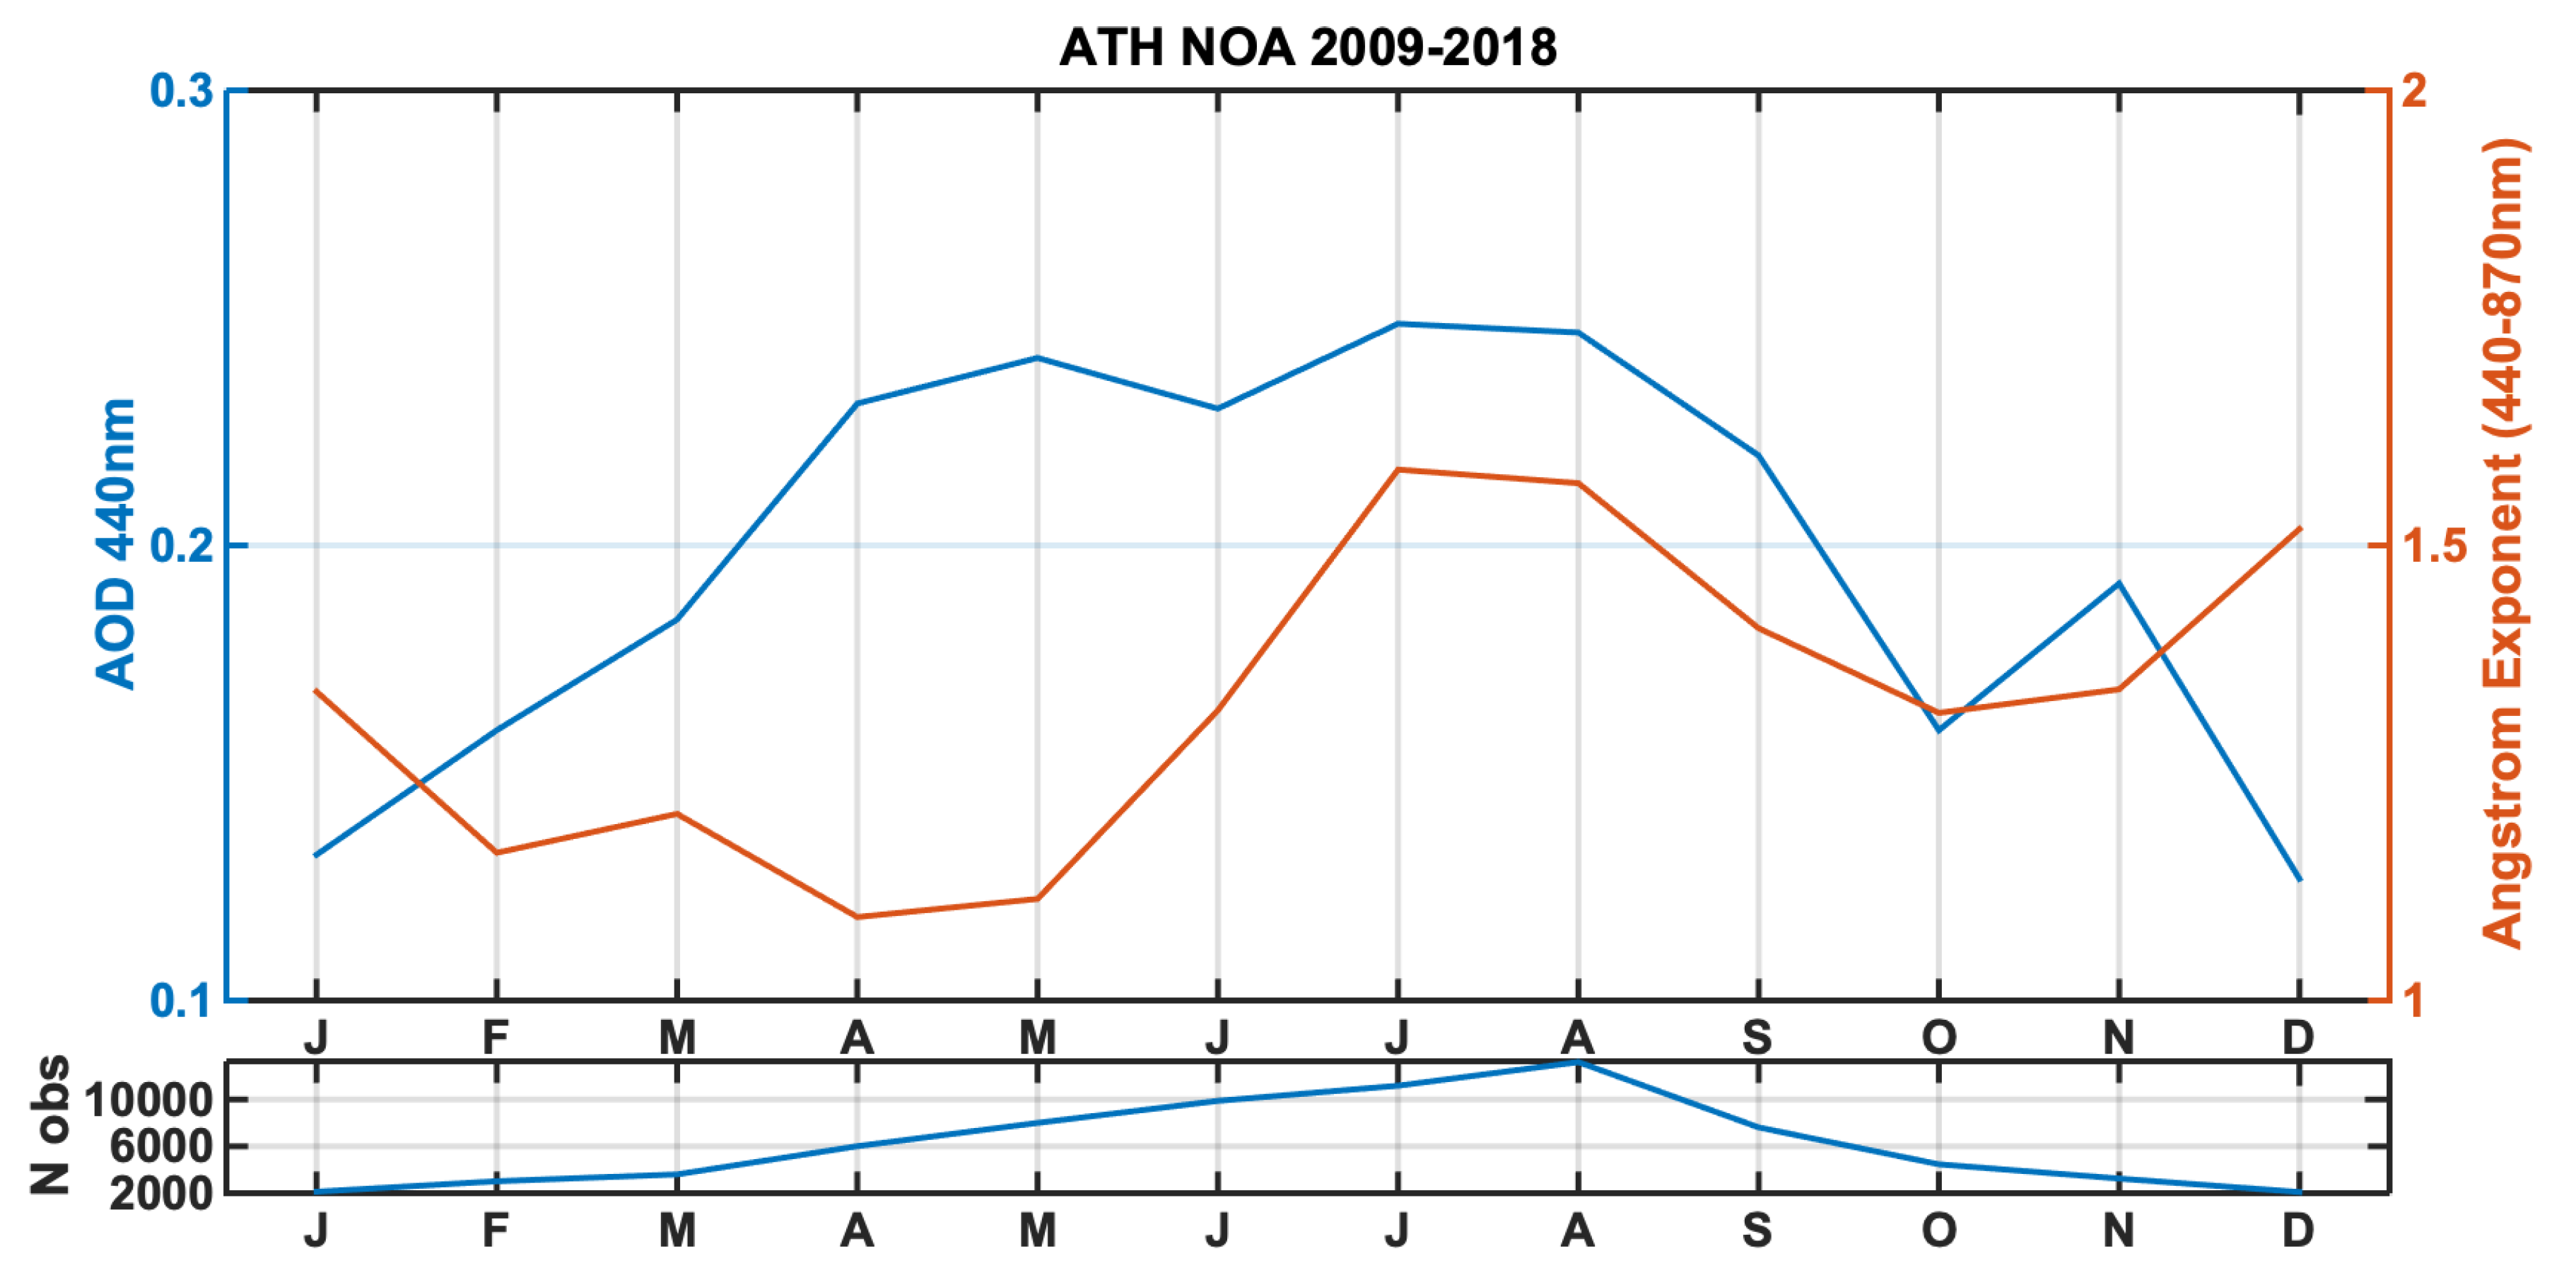
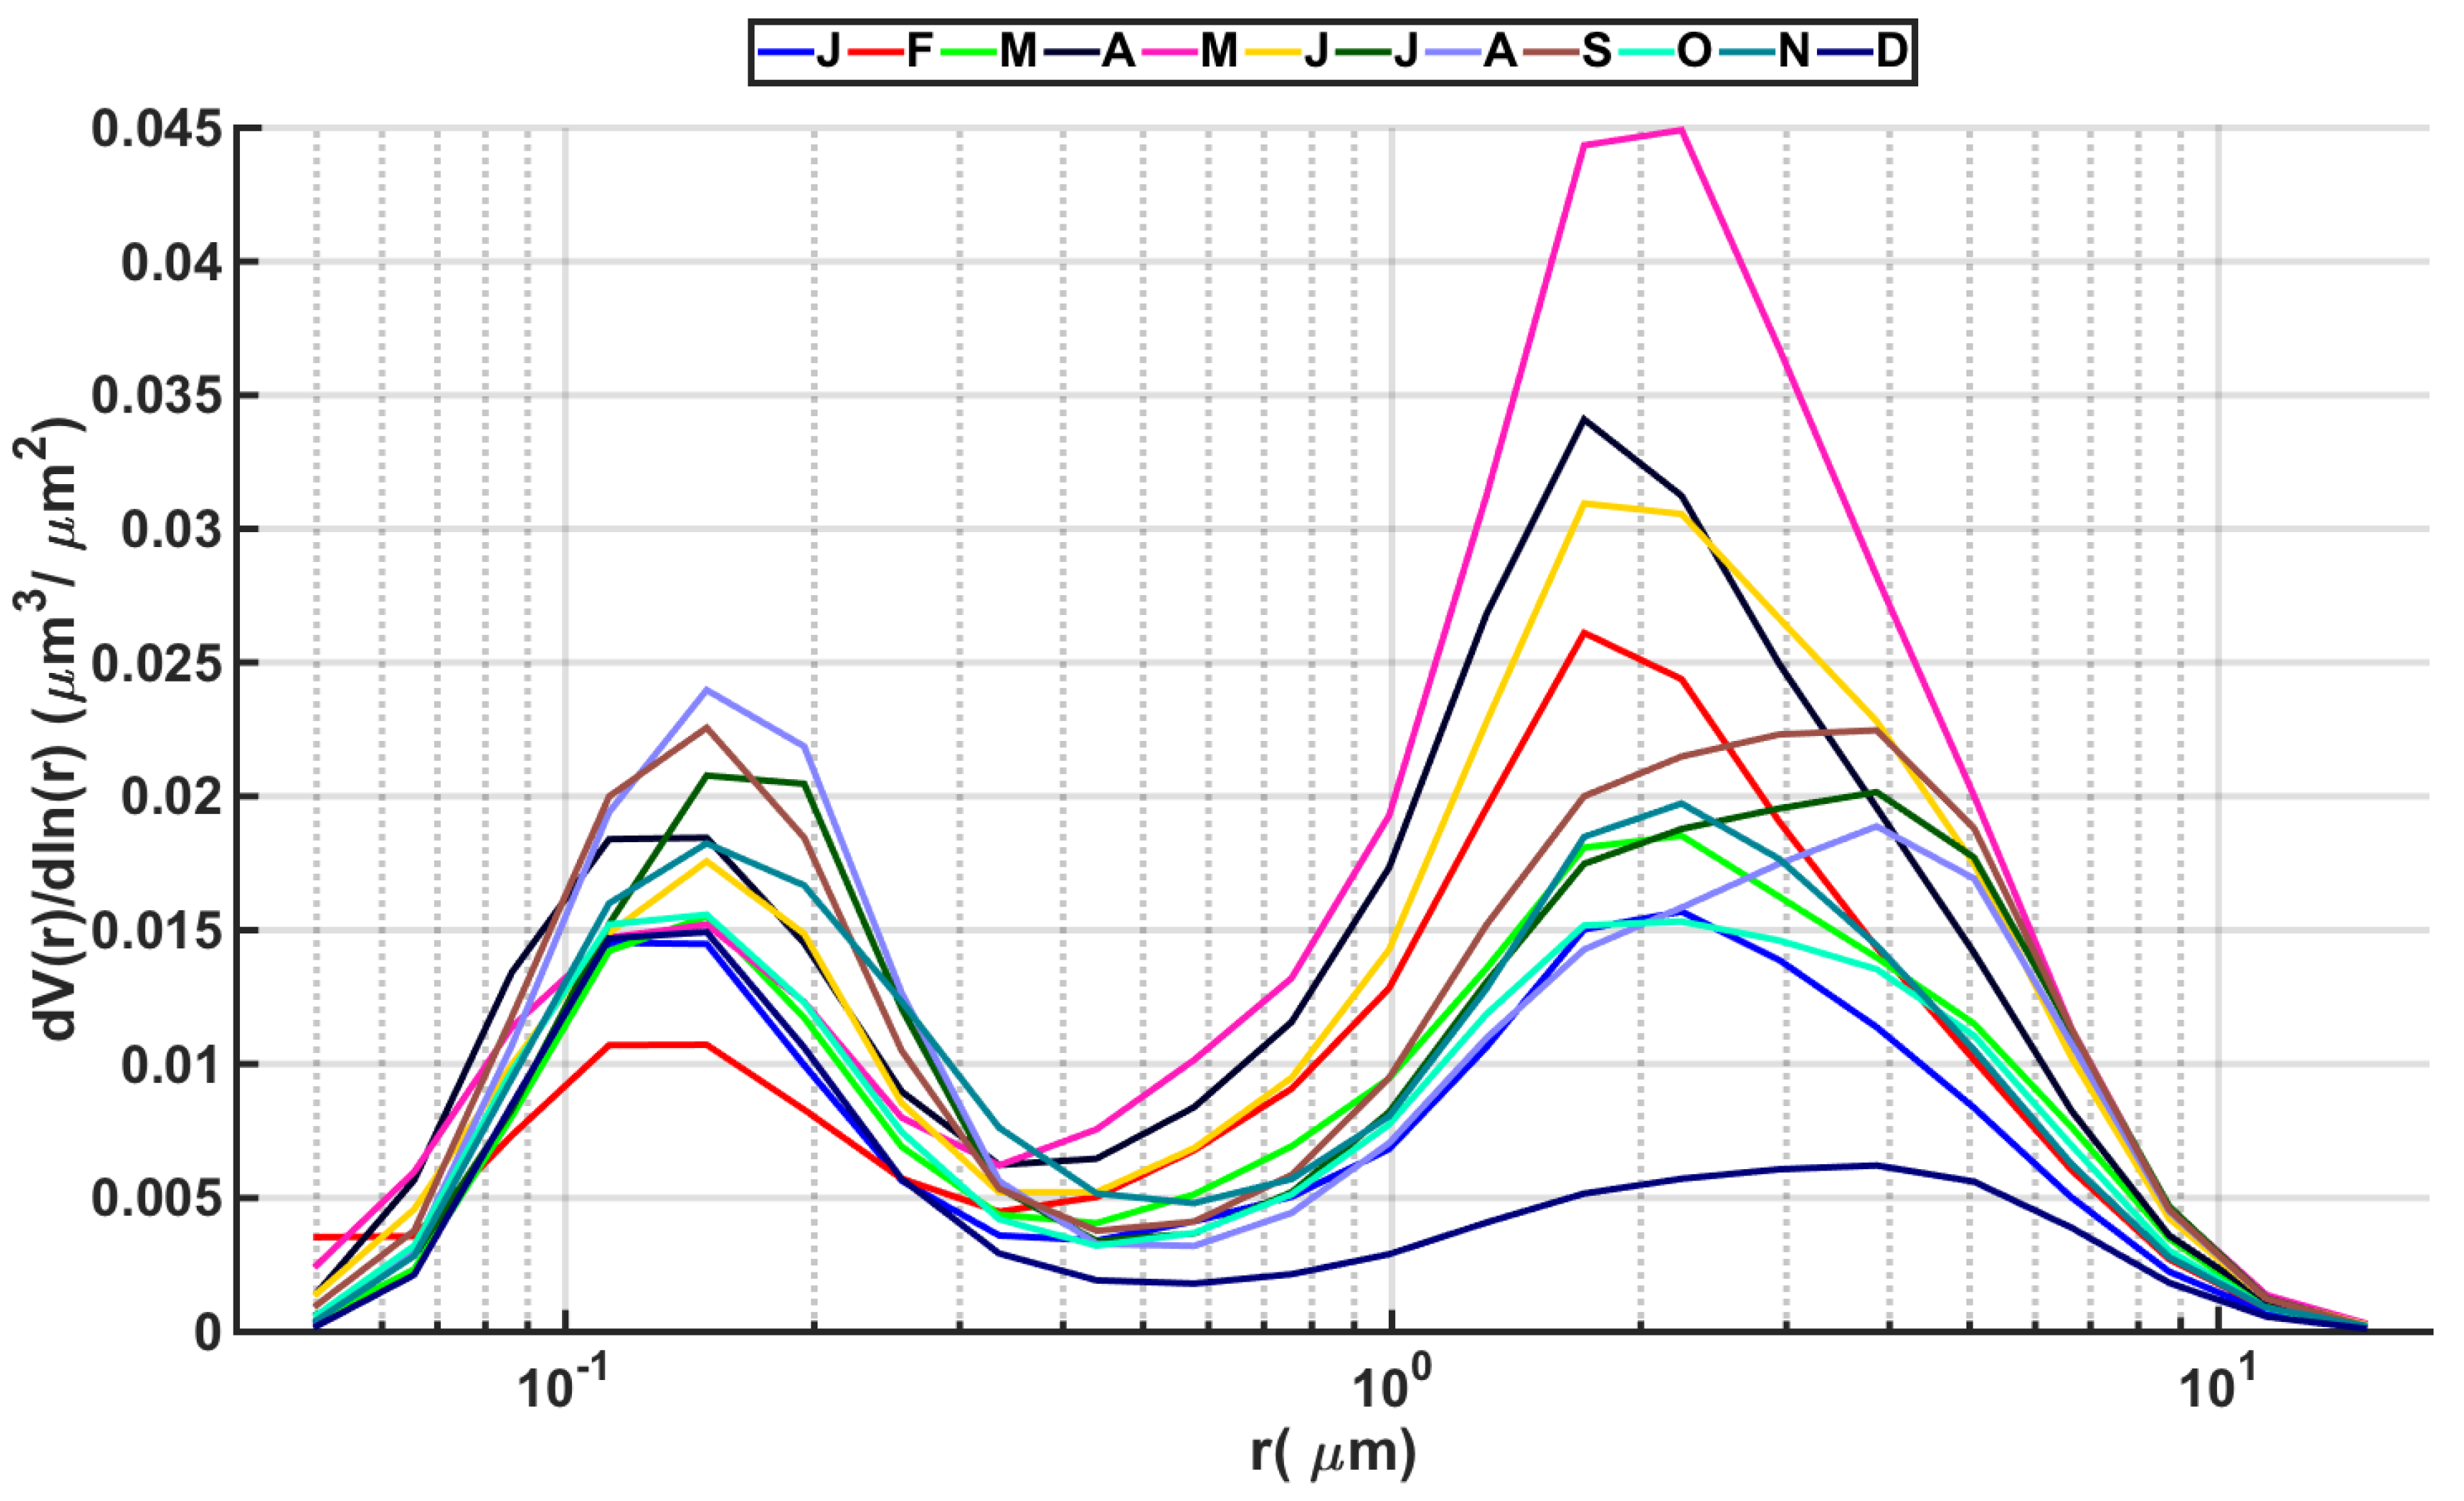
3.1. Seasonality
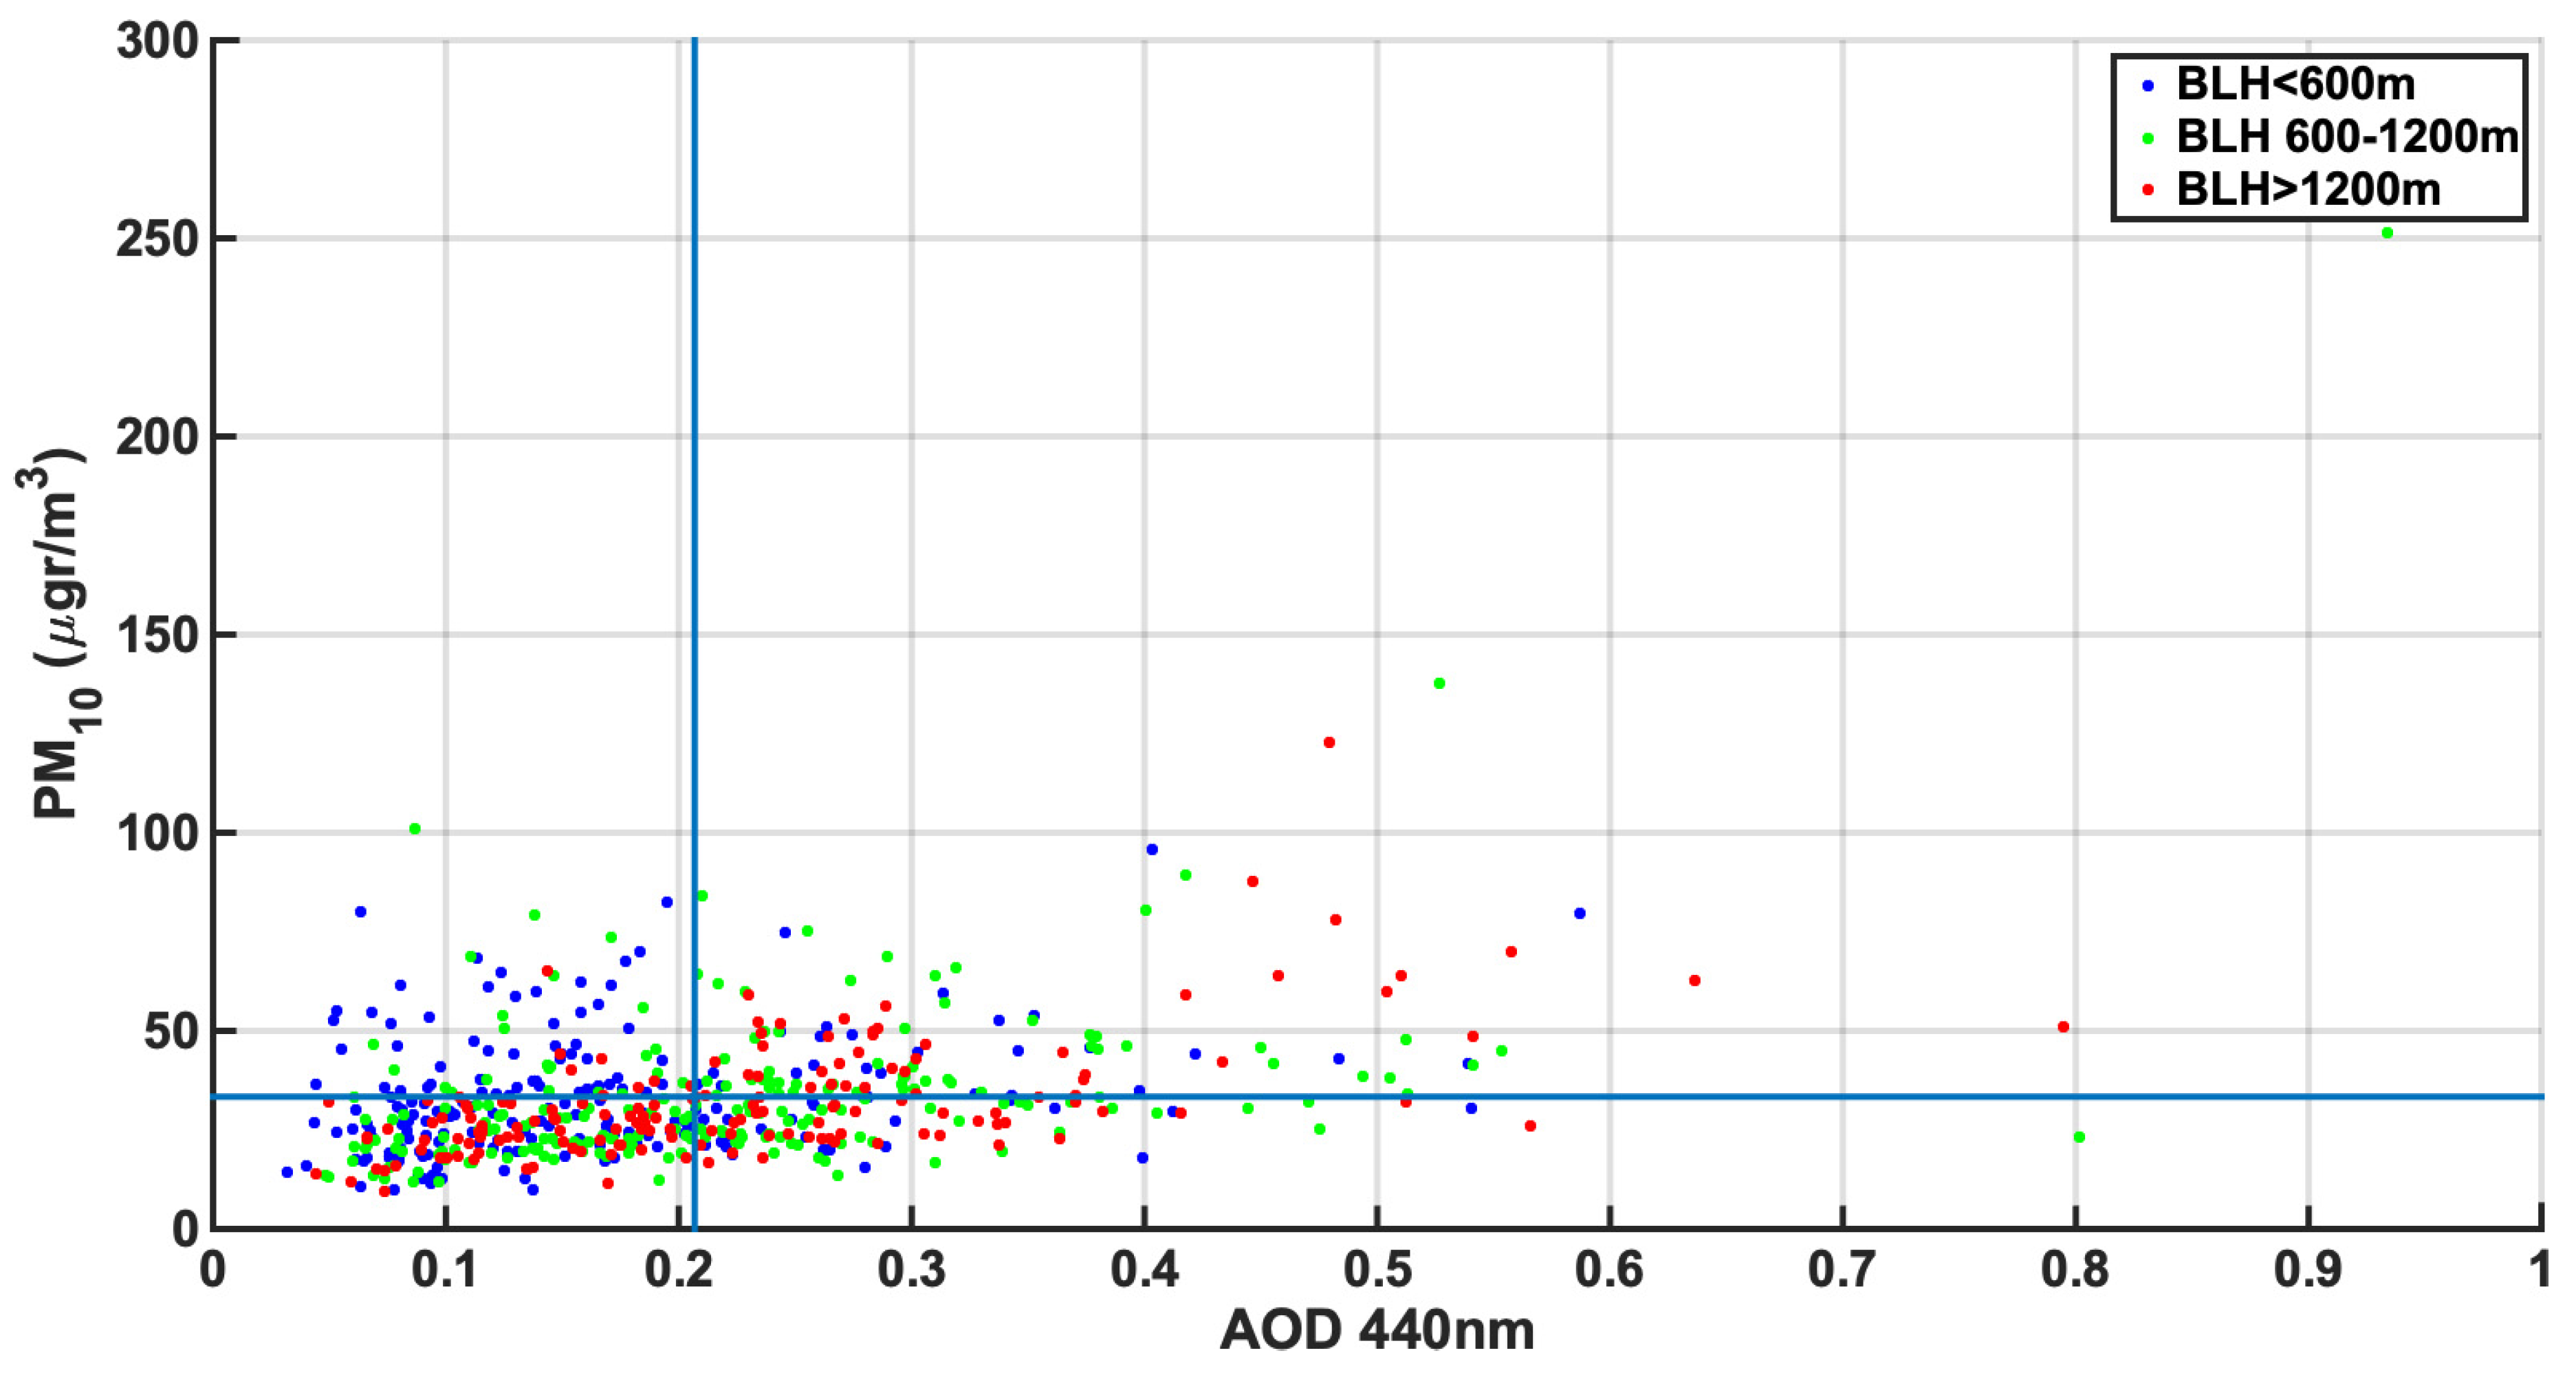
3.2. Connection of AOD with PM10
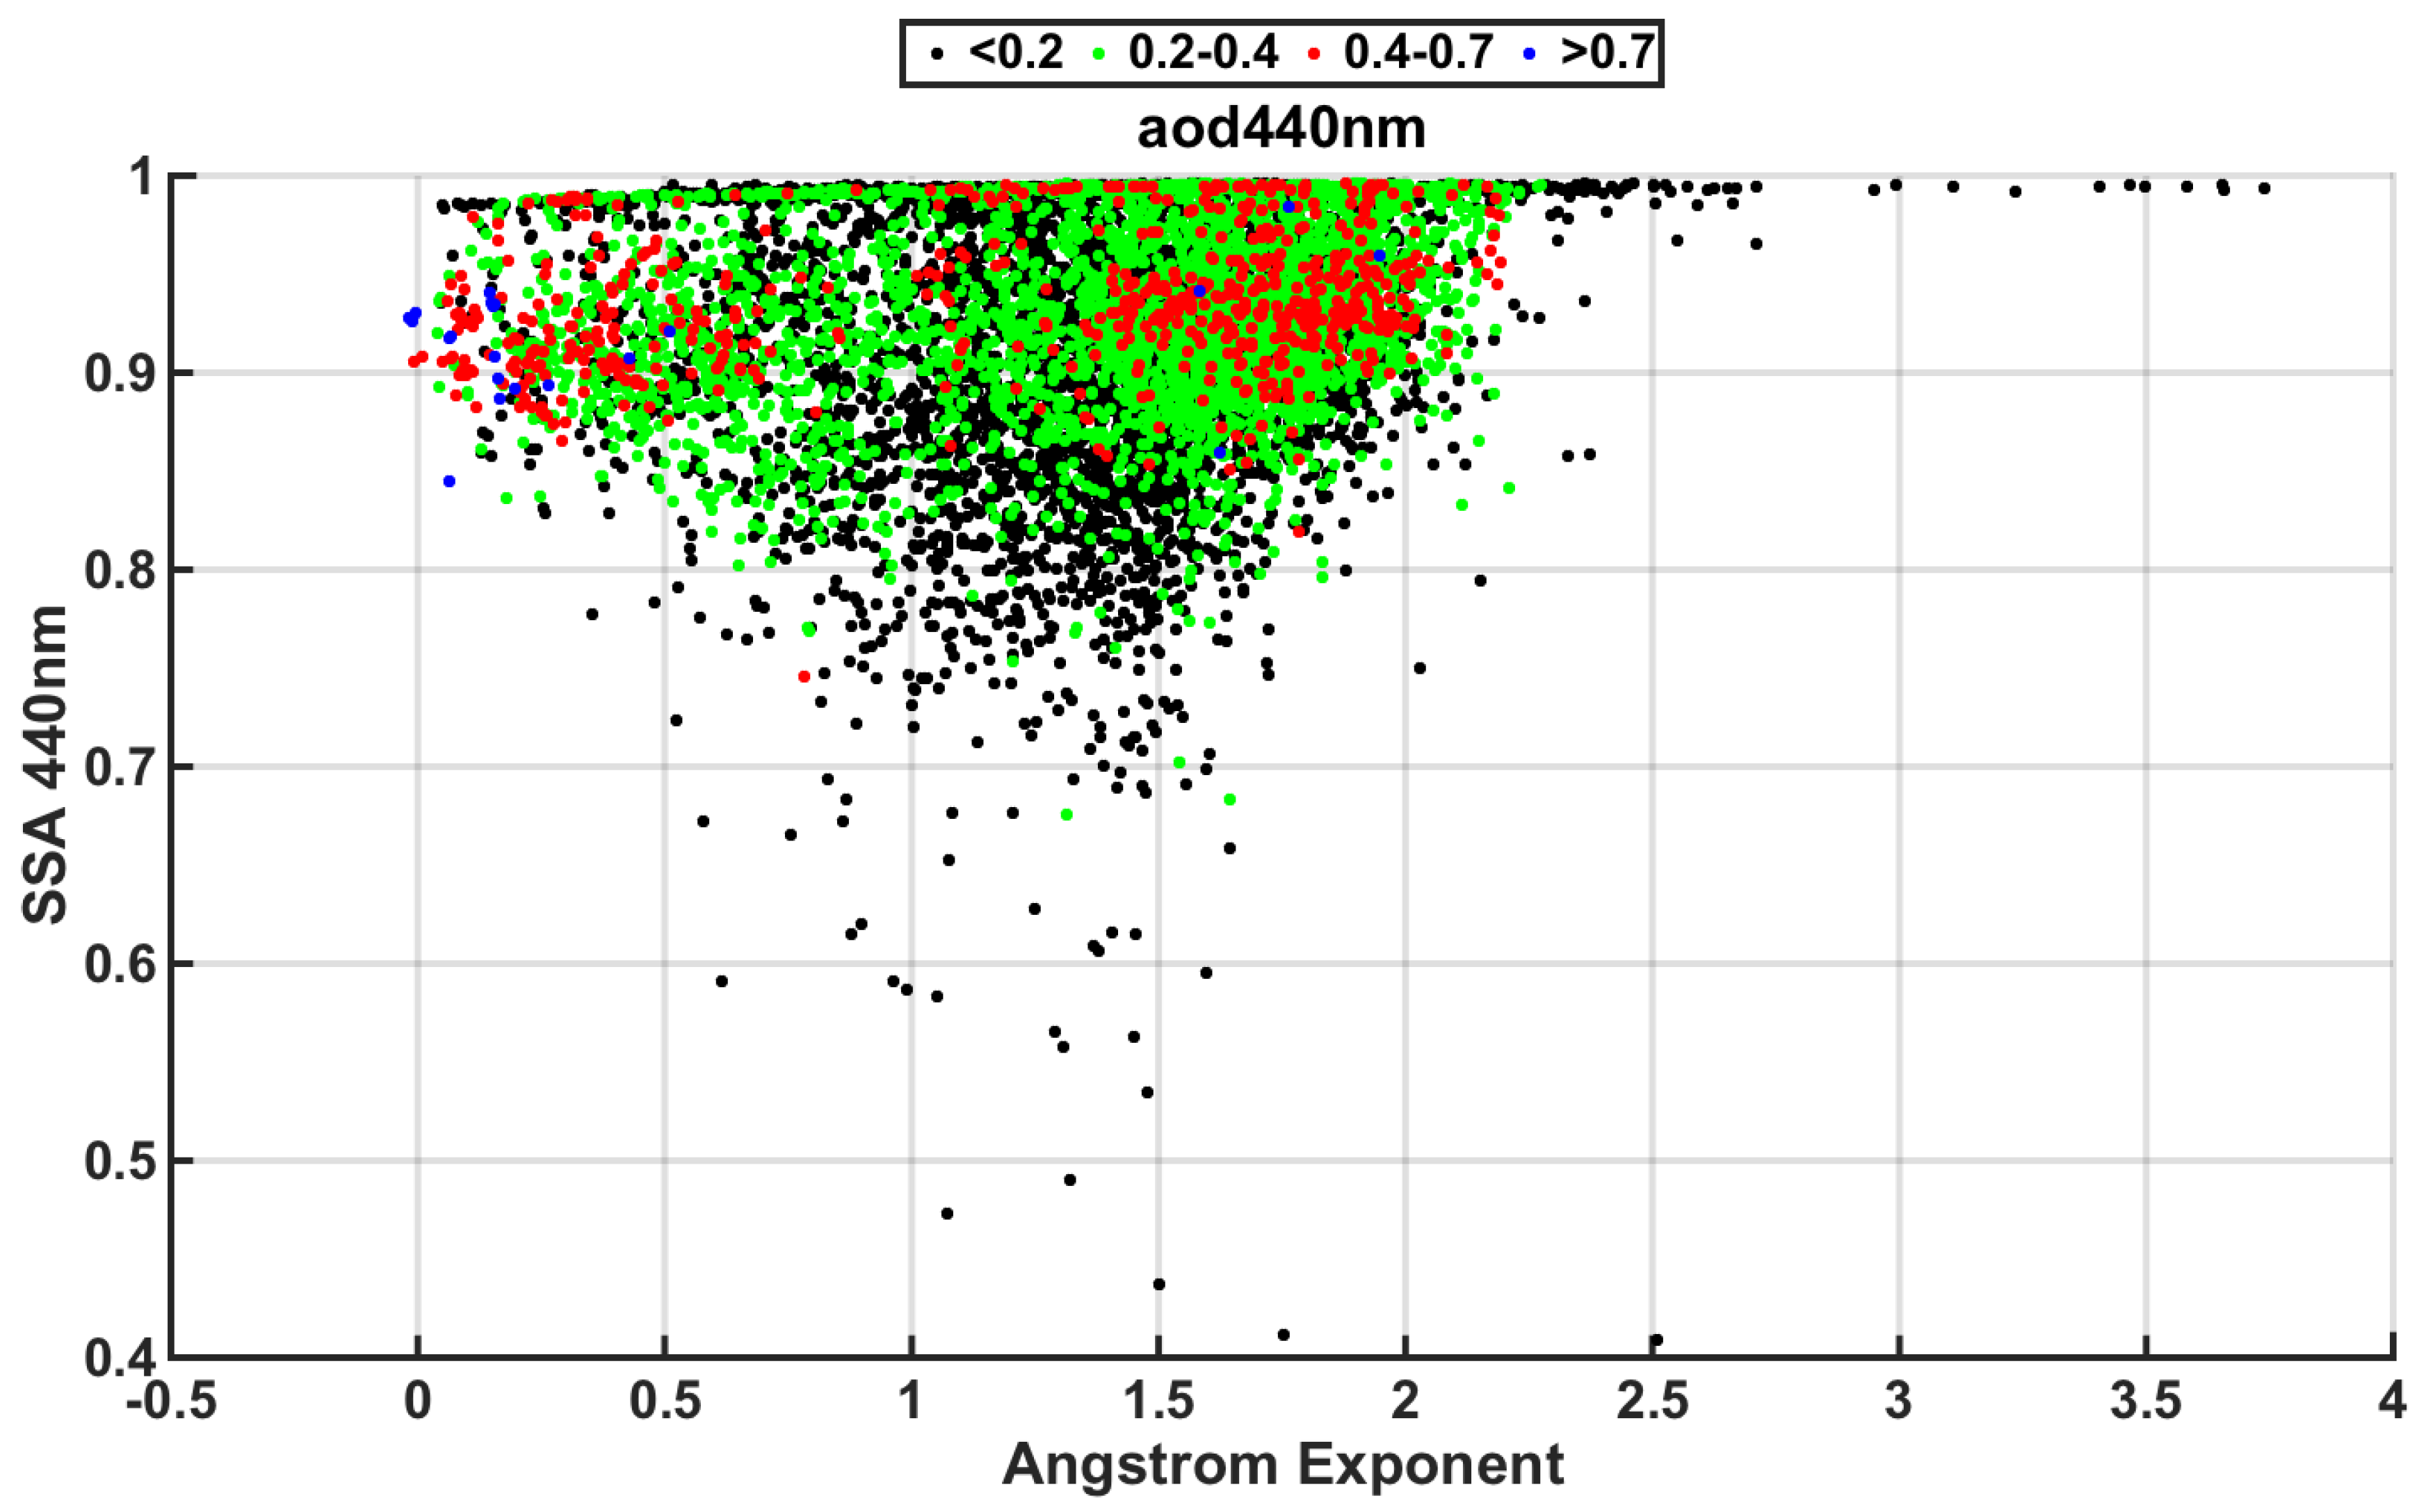
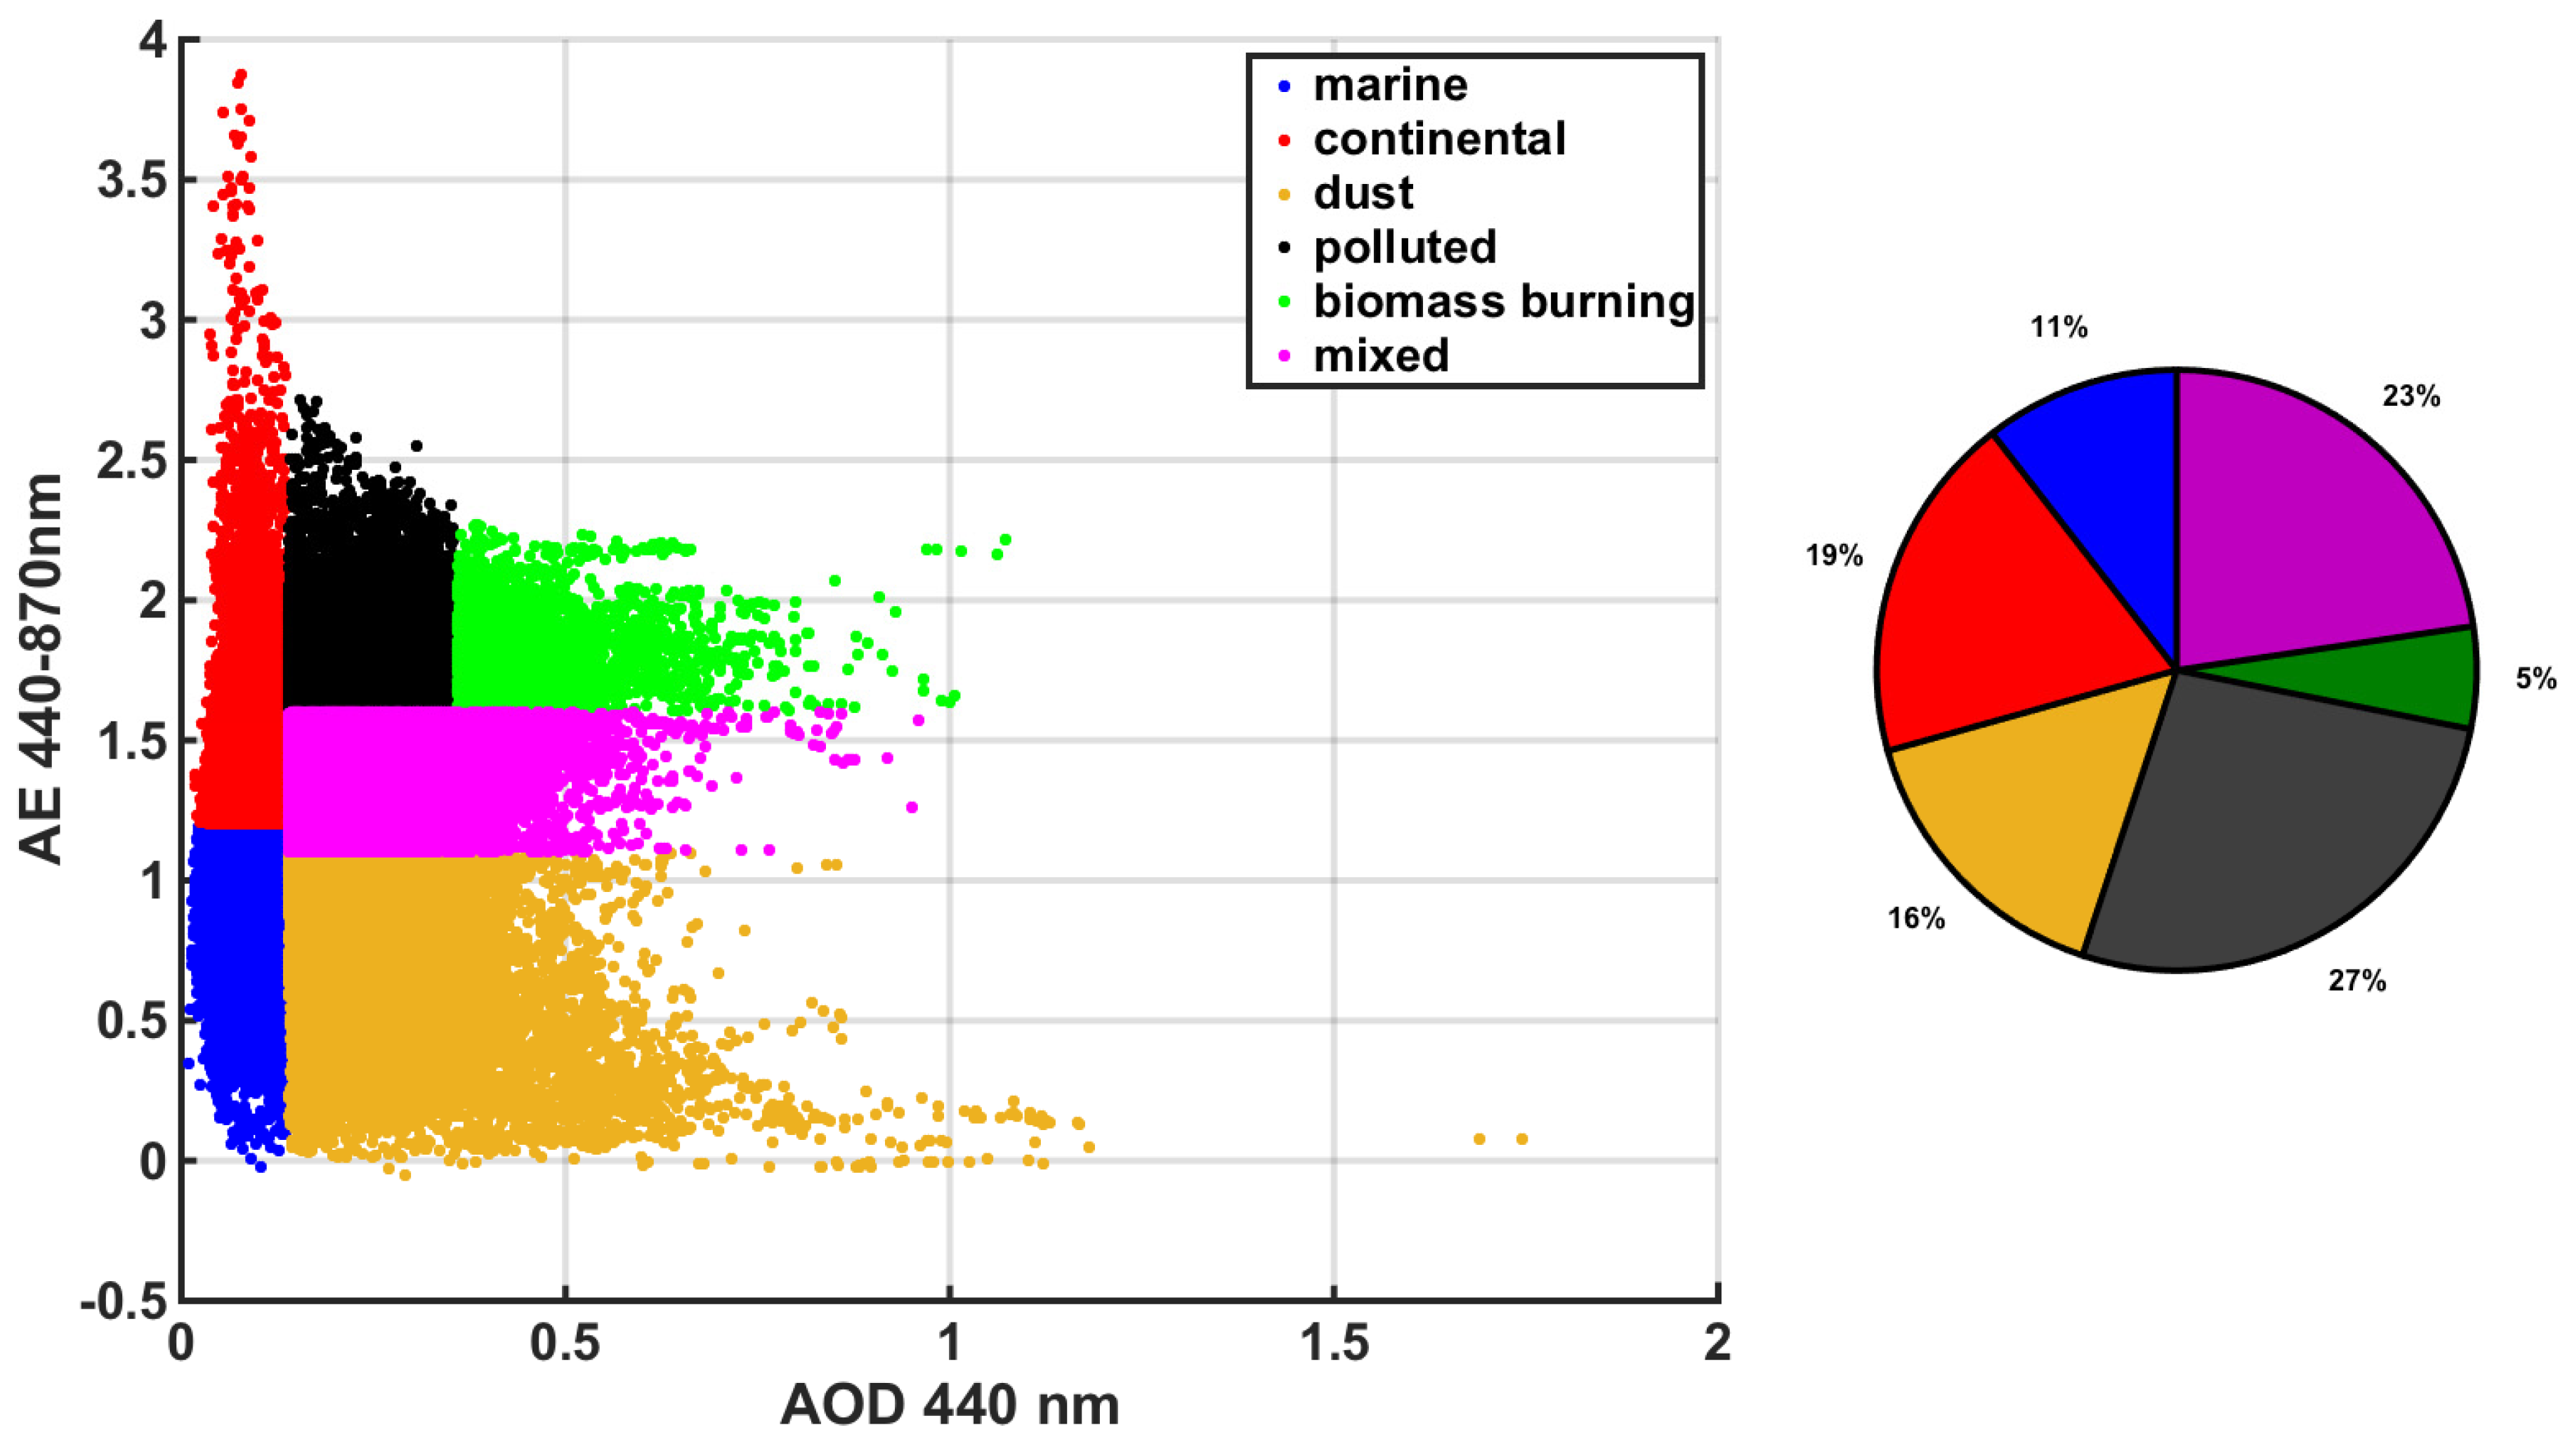
3.3. Particles Classification
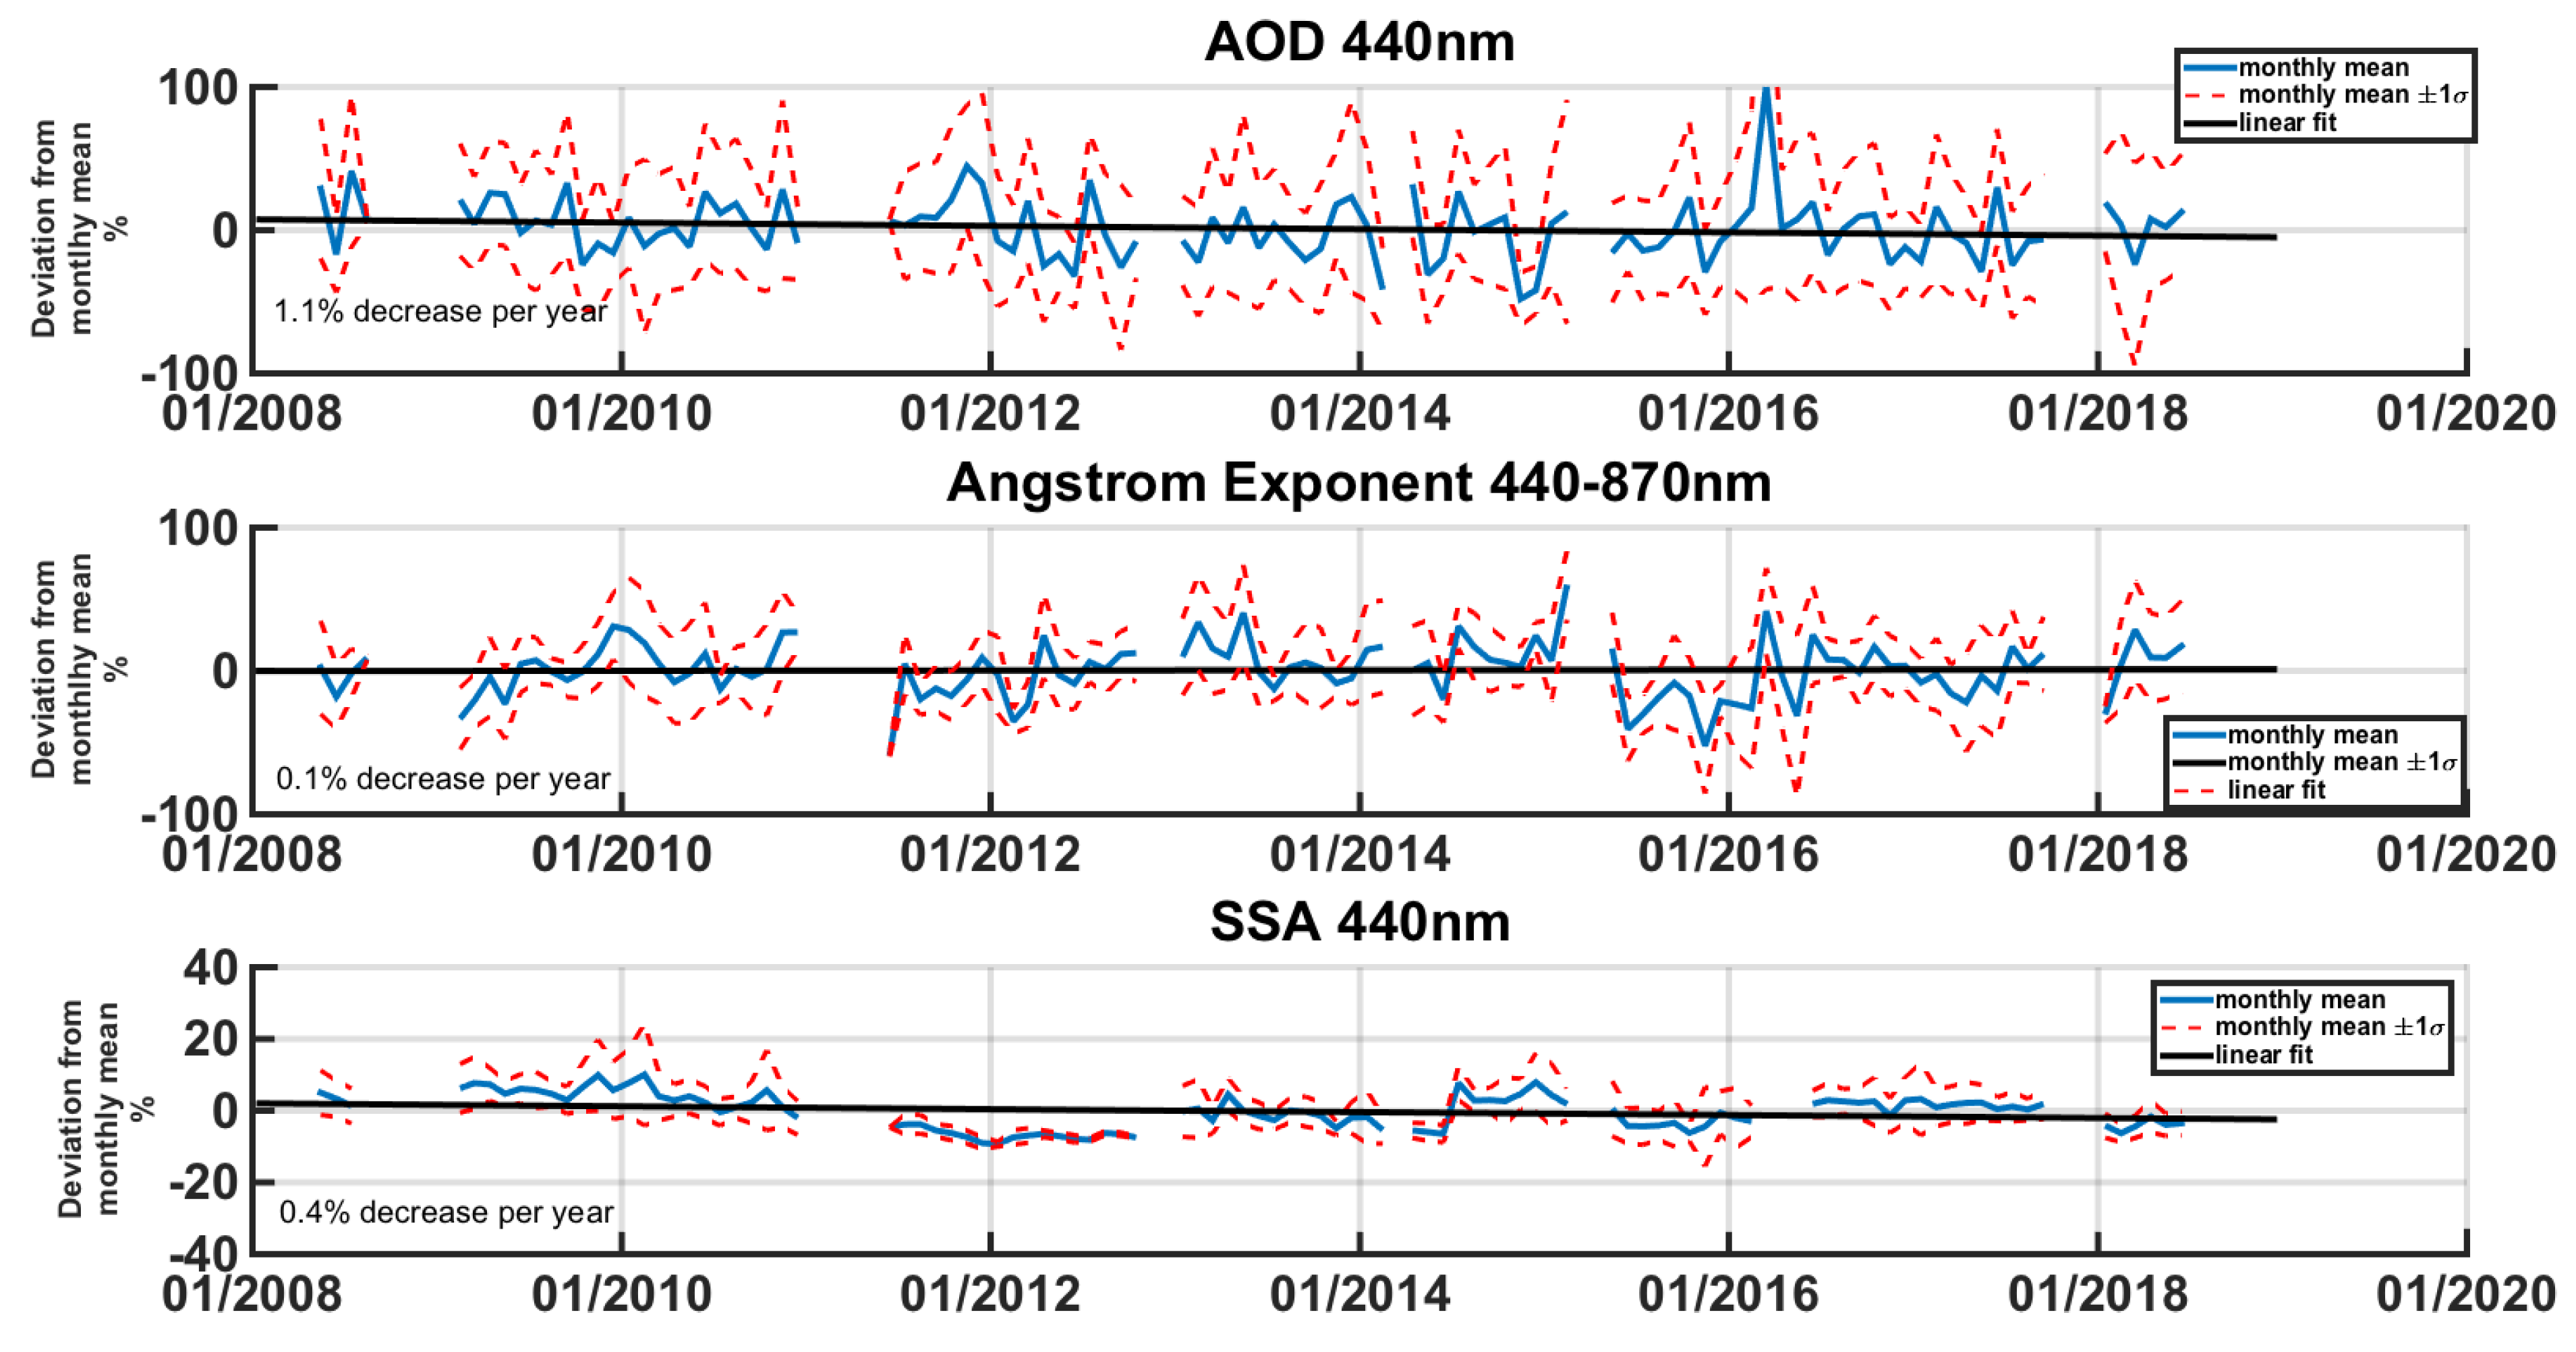
3.4. Long-Term Trends
4. Conclusions
Author Contributions
Funding
Acknowledgments
Conflicts of Interest
References
- IPCC. Climate Change 2013: The Physical Science Basis. Contribution of Working Group I to the Fifth Assessment Report of the Intergovernmental Panel on Climate Change; Cambridge University Press: Cambridge, UK, 2013; p. 1535. [Google Scholar]
- Pöschl, U. Atmospheric aerosols: Composition, transformation, climate and health effects. Angew. Chemie Int. Ed. 2005, 44, 7520–7540. [Google Scholar] [CrossRef]
- Shiraiwa, M.; Selzle, K.; Pöschl, U. Hazardous components and health effects of atmospheric aerosol particles: Reactive oxygen species, soot, polycyclic aromatic compounds and allergenic proteins. Free Radic. Res. 2012, 46, 927–939. [Google Scholar] [CrossRef]
- Shiraiwa, M.; Ueda, K.; Pozzer, A.; Lammel, G.; Kampf, C.J.; Fushimi, A.; Enami, S.; Arangio, A.M.; Fröhlich-Nowoisky, J.; Fujitani, Y.; et al. Aerosol health effects from molecular to global scales. Environ. Sci. Technol. 2017, 51, 13545–13567. [Google Scholar] [CrossRef]
- Boucher, O.; Randall, D.; Artaxo, P.; Bretherton, C.; Feingold, G.; Forster, P.; Kerminen, V.-M.; Kondo, Y.; Liao, H.; Lohmann, U.; et al. Clouds and Aerosols. In Climate Change 2013: The Physical Science Basis. Contribution of Working Group I to the Fifth Assessment Report of the Intergovernmental Panel on Climate Change; Cambridge University Press: Cambridge, UK, 2013; Chapter 7; pp. 571–657. [Google Scholar]
- Kaufman, Y.J.; Sendra, C. Algorithm for automatic atmospheric corrections to visible and near-IR satellite imagery. Int. J. Remote Sens. 1988, 9, 1357–1381. [Google Scholar] [CrossRef]
- Kaufman, Y.J.; Tanre, D. Strategy for direct and indirect methods for correcting the aerosol effect on remote sensing: From AVHRR to EOS-MODIS. Remote Sens. Environ. 1996, 55, 65–79. [Google Scholar] [CrossRef]
- Krotkov, N.A.; Herman, J.R.; Bhartia, P.K.; Seftor, C.J.; Arola, A.; Kaurola, J.; Koskinen, L.; Kalliskota, S.; Taalas, P.; Geogdzhaev, I.V. Version 2 TOMS UV algorithm: Problems and enhancements. Int. Soc. Opt. Photonics 2002, 4482, 82–94. [Google Scholar]
- Perry, M.; Troccoli, A. Impact of a fire burn on solar irradiance and PV power. Sol. Energy 2015, 114, 167–173. [Google Scholar] [CrossRef]
- Kosmopoulos, P.; Kazadzis, S.; El-Askary, H.; Taylor, M.; Gkikas, A.; Proestakis, E.; Kontoes, C.; El-Khayat, M. Earth-Observation-Based Estimation and Forecasting of Particulate Matter Impact on Solar Energy in Egypt. Remote Sens. 2018, 10, 1870. [Google Scholar] [CrossRef]
- Holben, B.N.; Eck, T.F.; Slutsker, I.; Tanré, D.; Buis, J.P.; Set- zer, A.; Vermote, E.; Reagan, J.A.; Kaufman, Y.J.; Nakajima, T.; et al. AERONET—A federated instrument network and data archive for aerosol characterization. Remote Sens. Environ. 1998, 66, 1–16. [Google Scholar] [CrossRef]
- Nakajima, T.; Yoon, S.C.; Ramanathan, V.; Shi, G.Y.; Takemura, T.; Higurashi, A.; Takamura, T.; Aoki, K.; Sohn, B.J.; Kim, S.W.; et al. Overview of the Atmospheric Brown Cloud East Asian Regional Experiment 2005 and a study of the aerosol direct radiative forcing in east. J. Geophys. Res. Atmos. 2007, 112, D24. [Google Scholar] [CrossRef]
- WMO/GAW. Experts Workshop on a Global Surface-based Network for Long Term Observations of the Column Aerosol Optical Properties; GAW 162; World Meteorological Organization: Davos, Switzerland, 2005. [Google Scholar]
- Kazadzis, S.; Kouremeti, N.; Nyeki, S.; Gröbner, J.; Wehrli, C. The World Optical Depth Research and Calibration Center (WORCC) quality assurance and quality control of GAW-PFR AOD measurements. Geosci. Instrum. Methods Data Syst. 2018, 7, 39. [Google Scholar] [CrossRef]
- Kazadzis, S.; Kouremeti, N.; Diémoz, H.; Gröbner, J.; Forgan, B.W.; Campanelli, M.; Estellés, V.; Lantz, K.; Michalsky, J.; Carlund, T.; et al. Results from the Fourth WMO Filter Radiometer Comparison for aerosol optical depth measurements. Atmos. Chem. Phys. 2018, 18, 3185–3201. [Google Scholar] [CrossRef]
- Cuevas, E.; Romero-Campos, P.M.; Kouremeti, N.; Kazadzis, S.; Räisänen, P.; García, R.D.; Barreto, A.; Guirado-Fuentes, C.; Ramos, R.; Toledano, C.; et al. Aerosol optical depth comparison between GAW-PFR and AERONET-Cimel radiometers from long-term (2005–2015) 1 min synchronous measurements. Atmos. Meas. Tech. 2019, 12, 4309–4337. [Google Scholar] [CrossRef]
- Levy, R.C.; Remer, L.A.; Kleidman, R.G.; Mattoo, S.; Ichoku, C.; Kahn, R.; Eck, T.F. Global evaluation of the Collection 5 MODIS dark-target aerosol products over land. Atmos. Chem. Phys. 2010, 10, 10399–10420. [Google Scholar] [CrossRef]
- Martonchik, J.V.; Kahn, R.A.; Diner, D.J. Retrieval of Aerosol Properties over Land Using MISR Observations; Springer: Berlin, Germany, 2009; pp. 67–293. [Google Scholar]
- Young, S.A.; Vaughan, M.A.; Kuehn, R.E.; Winker, D.M. The Retrieval of Profiles of Particulate Extinction from Cloud–Aerosol Lidar and Infrared Pathfinder Satellite Observations (CALIPSO) Data: Uncertainty and Error Sensitivity Analyses. J. Atmos. Oceanic Technol. 2013, 30, 395–428. [Google Scholar] [CrossRef]
- Grey, W.M.; North, P.R. Aerosol Optical Depth ftom Dual-View (A)ATSR Satellite Observations; Springer: Berlin, Germany, 2009; pp. 161–192. [Google Scholar]
- Alpert, P.; Shvainshtein, O.; Kishcha, P. AOD trends over megacities based on space monitoring using MODIS and MISR. Am. J. Clim. Chang. 2012, 1, 117. [Google Scholar] [CrossRef]
- Manktelow, P.T.; Mann, G.W.; Carslaw, K.S.; Spracklen, D.V.; Chipperfield, M.P. Regional and global trends in sulfate aerosol since the 1980s. Geophys. Res. Lett. 2007, 34. [Google Scholar] [CrossRef]
- Mortier, A.; Schulz, M.; Gliss, J. Biennalupdate of ACTRSI-2 Trends Report on Trend Assessment. 2018. Available online: https://www.actris.eu/Portals/46/Documentation/actris2/Deliverables/public/WP13_D13.6_M36(1).pdf?ver=2019-01-09-090544-173 (accessed on 2 December 2019).
- Eleftheriadis, K.; Colbeck, I.; Housiadas, C.; Lazaridis, M.; Mihalopoulos, N.; Mitsakou, C.; Smolik, J.; Ždímal, V. Size distribution, composition and origin of the submicron aerosol in the marine boundary layer during the eastern Mediterranean “SUB-AERO” experiment. Atmos. Environ. 2006, 40, 6245–6260. [Google Scholar] [CrossRef]
- Gerasopoulos, E.; Amiridis, V.; Kazadzis, S.; Kokkalis, P.; Eleftheratos, K.; Andreae, M.O.; Andreae, T.W. Three-year ground based measurements of aerosol optical depth over the Eastern Mediterranean: The urban environment of Athens. Atmos. Chem. Phys. 2011, 11, 2145–2159. [Google Scholar] [CrossRef]
- Tsekeri, A.; Amiridis, V.; Kokkalis, P.; Basart, S.; Chaikovsky, A.; Dubovik, O.; Mamouri, R.E.; Papayannis, A.; Baldasano, J.M. Application of a synergetic lidar and sunphotometer algorithm for the characterization of a dust event over Athens, Greece. Int. J. Environ. Clim. Chang. 2013, 18, 531–546. [Google Scholar] [CrossRef]
- Athanasopoulou, E.; Protonotariou, A.; Papangelis, G.; Tombrou, M.; Mihalopoulos, N.; Gerasopoulos, E. Long-range transport of Saharan dust and chemical transformations over the Eastern Mediterranean. Atmos. Environ. 2016, 140, 592–604. [Google Scholar] [CrossRef]
- Marinou, E.; Amiridis, V.; Binietoglou, A.; Tsikerdekis, S.; Solomos, E.; Proestakis, D.; Konsta, N.; Papagiannopoulos, A.; Tsekeri, G.; Vlastou, P.; et al. Three-dimensional evolution of Saharan dust transport towards Europe based on a 9-year EARLINET-optimized CALIPSO dataset. Atmos. Chem. Phys. 2017, 17, 5893–5919. [Google Scholar] [CrossRef]
- Koukouli, M.E.; Kazadzis, S.; Amiridis, V.; Ichoku, C.; Balis, D.S.; Bais, A.F. Signs of a negative trend in the MODIS aerosol optical depth over the Southern Balkans. Atmos. Environ. 2010, 44, 1219–1228. [Google Scholar] [CrossRef]
- Amiridis, V.; Zerefos, C.; Kazadzis, S.; Gerasopoulos, E.; Eleftheratos, K.; Vrekoussis, M.; Stohl, A.; Mamouri, R.E.; Kokkalis, P.; Papayannis, A.; et al. Impact of the 2009 Attica wild fires on the air quality in urban Athens. Atmos. Environ. 2012, 46, 536–544. [Google Scholar] [CrossRef]
- Athanasopoulou, E.D.; Rieger, C.; Walter, H.; Vogel, A.; Karali, M.; Hatzaki, E.; Gerasopoulos, B.; Vogel, C.; Giannakopoulos, M.; Roussos, A. Fire risk, atmospheric chemistry and radiative forcing assessment of wildfires in eastern Mediterranean. Atmos. Environ. 2014, 95, 113–125. [Google Scholar] [CrossRef]
- Amiridis, V.; Balis, D.; Giannakaki, E.; Kazadzis, S.; Arola, A.; Gerasopoulos, E. Characterization of the aerosol type using simultaneous measurements of the lidar ratio and estimations of the single scattering albedo. Atmos. Res. 2011, 101, 46–53. [Google Scholar] [CrossRef]
- Papayannis, A.; Argyrouli, A.; Kokkalis, P.; Tsaknakis, G.; Binietoglou, I.; Solomos, S.; Kazadzis, S.; Samaras, S.; Böckmann, C.; Raptis, P.; et al. Vertical Profiles of Aerosol Optical and Microphysical Properties During a Rare Case of Long-range Transport of Mixed Biomass Burning-polluted Dust Aerosols from the Russian Federation-kazakhstan to Athens, Greece. EPJ Web Conf. EDP Sci. 2016, 119, 18003. [Google Scholar] [CrossRef]
- Bryant, C.; Eleftheriadis, K.; Smolik, J.; Zdimal, V.; Mihalopoulos, N.; Colbeck, I. Optical properties of aerosols over the eastern Mediterranean. Atmos. Environ. 2006, 40, 6229–6244. [Google Scholar] [CrossRef]
- Paraskevopoulou, D.; Liakakou, E.; Gerasopoulos, E.; Mihalopoulos, N. Sources of atmospheric aerosol from long-term measurements (5 years) of chemical composition in Athens, Greece. Sci. Total Environ. 2015, 527, 165–178. [Google Scholar] [CrossRef]
- Fοurtziou L., E.; Liakakou, I.; Stavroulas, C.; Theodosi, P.; Zarmpas, B.; Psiloglou, J.; Sciare, T.; Maggos, K.; Bairachtari, A.; Bougiatioti, E.; et al. Multi-tracer approach to characterize domestic wood burning in Athens (Greece) during wintertime. Atmos. Environ. 2017, 148, 89–101. [Google Scholar] [CrossRef]
- Athanasopoulou, E.; Speyer, O.; Brunner, D.; Vogel, H.; Vogel, B.; Mihalopoulos, N.; Gerasopoulos, E. Changes in domestic heating fuel use in Greece: Effects on atmospheric chemistry and radiation. Atmos. Chem. Phys. 2017, 17, 10597–10618. [Google Scholar] [CrossRef]
- Gratsea, M.; Liakakou, E.; Mihalopoulos, N.; Adamopoulos, A.; Tsilibari, E.; Gerasopoulos, E. The combined effect of reduced fossil fuel consumption and increasing biomass combustion on Athens’ air quality, as inferred from long term CO measurements. Sci. Total Environ. 2017, 592, 115–123. [Google Scholar] [CrossRef] [PubMed]
- Kalogridis, A.-C.; Vratolis, S.; Liakakou, E.; Gerasopoulos, E.; Mihalopoulos, N.; Eleftheriadis, K. Assessment of wood burning versus fossil fuel contribution to wintertime black carbon and carbon monoxide concentrations in Athens, Greece. Atmos. Chem. Phys. 2018, 18, 10219–10236. [Google Scholar] [CrossRef]
- Paraskevopoulou, D.; Liakakou, E.; Gerasopoulos, E.; Theodosi, C.; Mihalopoulos, N. Long-term characterization of organic and elemental carbon in the PM2.5 fraction: The case of Athens, Greece. Atmos. Chem. Phys. 2014, 14, 13313–13325. [Google Scholar] [CrossRef]
- Theodosi, C.; Tsagkaraki, M.; Zarmpas, P.; Grivas, G.; Liakakou, E.; Paraskevopoulou, D.; Lianou, M.; Gerasopoulos, E.; Mihalopoulos, N. Multi-year chemical composition of the fine-aerosol fraction in Athens, Greece, with emphasis on the contribution of residential heating in wintertime. Atmos. Chem. Phys. 2018, 18, 14371–14391. [Google Scholar] [CrossRef]
- Stavroulas, I.; Bougiatioti, A.; Grivas, G.; Paraskevopoulou, D.; Tsagkaraki, P.; Zarmpas, P.; Liakakou, E.; Gerasopoulos, E.; Mihalopoulos, N. Sources and processes that control the submicron organic aerosol composition in an urban Mediterranean environment (Athens): A high temporal-resolution chemical composition measurement study. Atmos. Chem. Phys. 2019, 19, 901–919. [Google Scholar] [CrossRef]
- Taghvaee, S.; Sowlat, M.H.; Diapouli, E.; Ioannis, M.; Vasilatou, V.; Eleftheriadis, K.; Sioutas, C. Science of the Total Environment Source apportionment of the oxidative potential of fi ne ambient. Sci. Total Environ. 2019, 653, 1407–1416. [Google Scholar] [CrossRef]
- Eleftheriadis, K. Long term variability of the air pollution sources reflected on the state of mixing of the urban aerosol. Environ. Sci. Health 2019, 8, 36–39. [Google Scholar] [CrossRef]
- Tsiflikiotou, M.A.; Kostenidou, E.; Papanastasiou, D.K.; Patoulias, D.; Zarmpas, P.; Paraskevopoulou, D.; Diapouli, E.; Kaltsonoudis, C.; Florou, K.; Bougiatioti, A.; et al. Summertime particulate matter and its composition in Greece. Atmos. Environ. 2019, 213, 597–607. [Google Scholar] [CrossRef]
- Ångström, A. On the atmospheric transmission of sun radiation and on dust in the air. Geografiska Ann. 1929, 11, 156–166. [Google Scholar]
- Corr, C.A.; Krotkov, N.; Madronich, S.; Slusser, J.R.; Holben, B.; Gao, W.; Flynn, J.; Lefer, B.; Kreidenweis, S.M. x Retrieval of aerosol single scattering albedo at ultraviolet wavelengths at the T1 site during MILAGRO. Atmos. Chem. Phys. 2009, 9, 5813–5827. [Google Scholar]
- Stull, R.B. An Introduction to Boundary Layer Meteorology; Kluwer Academic Publishers: Dordrecht, The Netherlands, 1988; p. 666. [Google Scholar]
- Kalabokas, P.D.; Viras, L.G.; Repapis, C.C. Analysis of the 11-year record (1987–1997) of air pollution measurements in Athens, Greece, Part I: Primary air pollutants. Glob. Nest Int. J. 1999, 1, 157–168. [Google Scholar]
- Gkikas, A.; Basart, S.; Hatzianastassiou, N.; Marinou, E.; Amiridis, V.; Kazadzis, S.; Pey, J.; Querol, X.; Jorba, O.; Gassó, S.; et al. Mediterranean intense desert dust outbreaks and their vertical structure based on remote sensing data. Atmos. Chem. Phys. 2016, 16, 8609–8642. [Google Scholar] [CrossRef]
- Gkikas, A.; Hatzianastassiou, N.; Mihalopoulos, N.; Torres, O. Characterization of aerosol episodes in the greater Mediterranean Sea area from satellite observations (2000–2007). Atmos. Environ. 2016, 128, 286–304. [Google Scholar] [CrossRef]
- Holben, B.; Slutsker, I.; Giles, D.; Eck, T.; Smirnov, A.; Sinyuk, A.; Schafer, J.; Sorokin, M.; Rodriguez, J.; Kraft, J.; et al. AERONET Version 3 Release: Providing Significant Improvements for Multi-Decadal Global Aerosol Database and Near Real-Time Validation, Nasa Technical Reports. 2016. Available online: https://ntrs.nasa.gov/search.jsp?R=20160013870 (accessed on 30 January 2020).
- Giles, D.M.; Sinyuk, A.; Sorokin, M.G.; Schafer, J.S.; Smirnov, A.; Slutsker, I.; Eck, T.F.; Holben, B.N.; Lewis, J.R. Advancements in the Aerosol Robotic Network (AERONET) Version 3 database – automated near-real-time quality control algorithm with improved cloud screening for Sun photometer aerosol optical depth (AOD) measurements. Atmos. Meas. Tech. 2019, 12, 169–209. [Google Scholar] [CrossRef]
- Kazadzis, S.; Raptis, P.; Kouremeti, N.; Amiridis, V.; Arola, A.; Gerasopoulos, E.; Schuster, G.L. Aerosol absorption retrieval at ultraviolet wavelengths in a complex environment. Atmos. Meas. Tech. 2016, 9, 5997. [Google Scholar] [CrossRef]
- Salminen, K.; Karlsson, V. Comparability of low-volume PM10 sampler with β-attenuation monitor in background air. Atmos. Environ. 2002, 37, 3707–3712. [Google Scholar] [CrossRef]
- Schroedter-Homscheidt, M.; Arola, A.; Killius, N.; Lefèvre, M.; Saboret, L.; Wandji, W.; Wald, L.; Wey, E. The Copernicus atmosphere monitoring service (CAMS) radiation service in a nutshell. In Proceedings of the 22nd So-larPACES Conference, Abu Dhabi, UAE, 14 October 2016. [Google Scholar]
- Flemming, J.; Huijnen, V.; Remy, S.; Kipling, Z. Chemistry and aerosol model development for the Copernicus Atmosphere Monitoring Service at ECWMF. EGU Gen. Assem. Conf. Abstr. 2017, 19, 16776. [Google Scholar]
- Peuch, V.H.; Engelen, R.; Ades, M.; Barré, J.; Inness, A.; Flemming, J.; Kipling, Z.; Agusti-Panareda, A.; Parrington, M.; Ribas, R.; et al. The Use of Satellite Data in the Copernicus Atmosphere Monitoring Service (Cams). In Proceedings of the 2018 IEEE International Geoscience and Remote Sensing Symposium, Valencia, Spain, 27 July 2018; pp. 1594–1596. [Google Scholar]
- Benedetti, A.; Morcrette, J.J.; Boucher, O.; Dethof, A.; Engelen, R.J.; Fisher, M.; Flentje, H.; Huneeus, N.; Jones, L.; Kaiser, J.W.; et al. Aerosol analysis and forecast in the European centre for medium-range weather forecasts integrated forecast system: 2. Data assimilation. J. Geophys. Res. Atmos. 2009, 114, D13. [Google Scholar] [CrossRef]
- Sayer, A.M.; Munchak, L.A.; Hsu, N.C.; Levy, R.C.; Bettenhausen, C.; Jeong, M.-J. MODIS Collection 6 aerosol products: Comparison between Aqua’s e-Deep Blue, Dark Target, and “merged” data sets, and usage recommendations. J. Geophys. Res. Atmos. 2014, 119, 13965–13989. [Google Scholar] [CrossRef]
- Kaufman, Y.J.; Wald, A.E.; Remer, L.A.; Gao, B.C.; Li, R.R.; Flynn, L. The MODIS 2.1-/spl mu/m channel-correlation with visible reflectance for use in remote sensing of aerosol. IEEE Trans. Geosci. Remote Sens. 1997, 35, 1286–1298. [Google Scholar] [CrossRef]
- Levy, R.C.; Mattoo, S.; Munchak, L.A.; Remer, L.A.; Sayer, A.M.; Patadia, F.; Hsu, N.C. The Collection 6 MODIS aerosol products over land and ocean. Atmos. Meas. Tech. 2013, 6, 2989–3034. [Google Scholar] [CrossRef]
- Tanré, D.; Kaufman, Y.J.; Herman, M.; Mattoo, S. Remote sensing of aerosol properties over oceans using the MODIS/EOS spectral radiances. J. Geophys. Res. Atmos. 1997, 102, 16971–16988. [Google Scholar] [CrossRef]
- Hsu, N.C.; Jeong, M.J.; Bettenhausen, C.; Sayer, A.M.; Hansell, R.; Seftor, C.S.; Huang, J.; Tsay, S.C. Enhanced Deep Blue aerosol retrieval algorithm: The second generation. J. Geophys. Res. Atmos. 2013, 118, 9296–9315. [Google Scholar] [CrossRef]
- LAADS DAAC. Available online: https://ladsweb.modaps.eosdis.nasa.gov/ (accessed on 16 December 2019).
- MODIS Atmosphere QA Plan for Collection 61m Version 9. Available online: https://modis-images.gsfc.nasa.gov/_docs/QA_Plan_C61_Master_2017_03_15.pdf (accessed on 16 December 2019).
- Amiridis, V.; Balis, D.S.; Giannakaki, E.; Stohl, A.; Kazadzis, S.; Koukouli, M.E.; Zanis, P. Optical characteristics of biomass burning aerosols over Southeastern Europe determined from UV-Raman lidar measurements. Atmos. Chem. Phys. 2009, 9, 2431–2440. [Google Scholar] [CrossRef]
- Kirchstetter, T.W.; Novakov, T.; Hobbs, P.V. Evidence that the spectral dependence of light absorption by aerosols is affected by organic carbon. J. Geophys. Res. 2004, 109, D21208. [Google Scholar] [CrossRef]
- Schuster, G.L.; Dubovik, O.; Arola, A. Remote sensing of soot carbon–Part 1: Distinguishing different absorbing aerosol species. Atmos. Chem. Phys. 2016, 16, 1565–1585. [Google Scholar] [CrossRef]
- Kalivitis, N.; Gerasopoulos, E.; Vrekoussis, M.; Kouvarakis, G.; Kubilay, N.; Hatzianastassiou, N.; Vardavas, I.; Mihalopoulos, N. Dust transport over the eastern Mediterranean derived from Total Ozone Mapping Spectrometer, Aerosol Robotic Network, and surface measurements. J. Geophys. Res. Atmos. 2007, 112, D3. [Google Scholar] [CrossRef]
- Copernicus Climate Change Service (C3S) (2017): ERA5: Fifth Generation of ECMWF Atmospheric Reanalyses of the Global Climate. Copernicus Climate Change Service Climate Data Store (CDS). 20 July 2019. Available online: https://cds.climate.copernicus.eu/cdsapp#!/home (accessed on 16 December 2019).
- Dubovik, O.; Holben, B.; Eck, T.F.; Smirnov, A.; Kaufman, Y.J.; King, M.D.; Tanré, D.; Slutsker, I. Variability of absorption and optical properties of key aerosol types observed in worldwide locations. J. Atmos. Sci. 2001, 59, 590–608. [Google Scholar] [CrossRef]
- Gobbi, G.P.; Kaufman, Y.J.; Koren, I.; Eck, T.F. Classification of aerosol properties derived from AERONET direct sun data. Atmos. Chem. Phys. 2007, 7, 453–458. [Google Scholar] [CrossRef]
- Greek Ministry of Environment and Energy. Annual Air Quality Report 2018. Available online: http://www.ypeka.gr/LinkClick.aspx?fileticket=FJbhHPSTih4%3d&tabid=490&language=el-GR (accessed on 16 December 2019).
- Andreae, M.O.; Gelencsér, A. Black carbon or brown carbon? The nature of light-absorbing carbonaceous aerosols. Atmos. Chem. Phys. 2006, 6, 3131–3148. [Google Scholar] [CrossRef]


| DJF | MAM | JJA | SON | All Seasons | |
|---|---|---|---|---|---|
| Lower Left Low AOD–Low PM10 | 39.5% | 29.4% | 31.9% | 51.6% | 42.5% |
| Lower Right Low AOD–Low PM10 | 8.1% | 16.7% | 23.8% | 14.5% | 18.9% |
| Upper right High AOD–High PM10 | 15.1% | 35.0% | 37.5% | 24.2% | 23.6% |
| Upper left Low AOD–High PM10 | 36.6% | 18.9% | 6.90% | 9.7% | 14.9% |
| AOD Trends (% per Year) | AERONET 440 nm | CAMS 500 nm | MODIS-TERRA 550 nm | MODIS-AQUA 550 nm |
|---|---|---|---|---|
| Annual | −1.1 ± 0.7 | −2.5 ± 1.1 | −1.7 ± 1.0 | −1.7 ± 1.0 |
| DJF | −0.1 ± 0.9 | −4.2 ± 1.5 | −1.3 ± 1.4 | −1.3 ± 1.4 |
| MAM | −1.8 ± 0.9 | −0.5 ± 1.3 | −1.7 ± 1.2 | −1.2 ± 1.3 |
| JJA | −3.2 ± 1.1 | −1.9 ± 1.5 | −2.9 ± 1.3 | −2.7 ± 1.4 |
| SON | −0.8 ± 1.0 | −2.1 ± 1.4 | −2.6 ± 1.3 | −2.6 ± 1.3 |
© 2020 by the authors. Licensee MDPI, Basel, Switzerland. This article is an open access article distributed under the terms and conditions of the Creative Commons Attribution (CC BY) license (http://creativecommons.org/licenses/by/4.0/).
Share and Cite
Raptis, I.-P.; Kazadzis, S.; Amiridis, V.; Gkikas, A.; Gerasopoulos, E.; Mihalopoulos, N. A Decade of Aerosol Optical Properties Measurements over Athens, Greece. Atmosphere 2020, 11, 154. https://doi.org/10.3390/atmos11020154
Raptis I-P, Kazadzis S, Amiridis V, Gkikas A, Gerasopoulos E, Mihalopoulos N. A Decade of Aerosol Optical Properties Measurements over Athens, Greece. Atmosphere. 2020; 11(2):154. https://doi.org/10.3390/atmos11020154
Chicago/Turabian StyleRaptis, Ioannis-Panagiotis, Stelios Kazadzis, Vassilis Amiridis, Antonis Gkikas, Evangelos Gerasopoulos, and Nikolaos Mihalopoulos. 2020. "A Decade of Aerosol Optical Properties Measurements over Athens, Greece" Atmosphere 11, no. 2: 154. https://doi.org/10.3390/atmos11020154
APA StyleRaptis, I.-P., Kazadzis, S., Amiridis, V., Gkikas, A., Gerasopoulos, E., & Mihalopoulos, N. (2020). A Decade of Aerosol Optical Properties Measurements over Athens, Greece. Atmosphere, 11(2), 154. https://doi.org/10.3390/atmos11020154