Article

A Sea Breeze Study during Ticosonde-NAME 2004 in the Central Pacific of Costa Rica: Observations and Numerical Modeling

1
Center for Geophysical Research, University of Costa Rica, San José 11501, Costa Rica
2
School of Physics, University of Costa Rica, San José 11501, Costa Rica
*
Author to whom correspondence should be addressed.
Atmosphere 2020, 11(12), 1333; https://doi.org/10.3390/atmos11121333
Submission received: 31 October 2020 / Revised: 26 November 2020 / Accepted: 30 November 2020 / Published: 9 December 2020
(This article belongs to the Special Issue Central America and Caribbean Hydrometeorology and Hydroclimate)

Abstract

:
Surface and upper air observations and MM5v3 simulations examined the structure and inland penetration of sea breeze (SB) along the Grande de Tárcoles river basin (GTRB), central Pacific, Costa Rica, for two different intensity regimes of the Caribbean Low-Level Jet (CLLJ). Data comprise the period of 1 July to 16 September 2004 from Ticosonde-North American Monsoon Experiment, and a local University of Costa Rica-National Meteorological Institute field campaign. Maximum precipitation occurs between 14:00–17:00 LST, showing a time lag of 2 to 3 h after the temperature maximum, suggesting that local diurnal heating is key to convection. July–August precipitation exhibited a rainfall decrease along GTRB due to the SB dynamical processes interaction with a strong CLLJ. The SB maximum inland incursion was 24 km, with no evidence of its penetration into the Central Valley. The MM5v3 simulations for two convective and boundary layer (BL) schemes captured some SB structure features along the GTRB. Comparison of model results with observed data shows deficiencies in the model representation of the surface flow near coastal regions. Differences may be the result of time lag model’s poor responses to actual early morning BL sea–land temperature gradients. MM5v3 configurations used in this study resulted in biased wind speed simulations.

1. Introduction

The study of the sea breeze (SB) is one of the most challenging meso-scale meteorological phenomena occurring along coastal regions around the world. The SB is primarily due to pressure gradients caused by diurnal differential heating between land and sea [1,2]. These circulations play an important role in the climate and atmospheric environment of maritime areas and adjacent inland areas, having a direct effect on weather patterns of temperature, precipitation, and wind speed and direction. The special observational requirements partially explain why studies of the SB have mainly focused on describing diurnal variations using available meteorological in situ data, specially near coastal areas. A better understanding of the dynamics and characteristics of these local winds could contribute to tourism and urban planning activities, improve the analysis of air quality (because they constitute a mechanism of pollution transport), and provide information for navigation safety and forest fire prevention [2].
In the tropics, the behavior and evolution of the SB have been documented with the purpose of understanding the local weather, including the location and initiation of convection [3,4,5]. This circulation is shown to have clear impacts on agriculture, marine processes, coastal industries, and the regional economy. For example, Carrasco-Díaz et al. [6] analyzed the effects of local SB circulation on wind power generation in Cuba. Their results confirm that the littoral presents favorable conditions for the exploitation of wind energy for electricity generation. However, the evolution and inland penetration of the SB system are influenced by many factors such as topography, latitude, and interaction with synoptic circulations [7]. Therefore, it is important to investigate the development of coastal winds and their inland penetration in a context of complex terrain conditions and interaction with synoptic flow. As discussed below, this is one of the main objectives of this work.
Numerical [8,9,10,11] and observational [7,12,13] studies have shown that both the direction and strength of the synoptic flow affect the structure and evolution of the SB. If synoptic winds are in the same direction as the breeze, it is possible for the SB front to penetrate much farther inland. In the opposite case, its inland penetration may be restricted to a few km, or even to the possibility of SB development being inhibited [1].
The aim of the present study is to analyze the structure and evolution of the SB along the Grande de Tárcoles River Basin (GTRB) in Costa Rica (a region of complex topography, see Figure 1a) from July to September 2004. This work uses surface and upper-air observations and a meso-scale numerical model to better understand the SB inland penetration and its interaction with the Caribbean Low-Level Jet (CLLJ) [14,15]. The CLLJ is a prominent regional climate feature of the trade wind regime modulating the precipitation distribution in Central America and other regions [14]. The data were collected during two special observation campaigns carried out in Costa Rica in 2004. One of them was the international Ticosonde-North American Monsoon Experiment (T-NAME). Details of Ticosonde can be obtained at https://bocachica.arc.nasa.gov/TICOSONDE/Ticosonde-NAME/index.html. For a description of the NAME campaign see in [16]. The other was a local project conducted by the Center for Geophysical Research (CIGEFI), University of Costa Rica (UCR), in collaboration with the Costa Rica’s National Meteorological Institute (IMN in Spanish) and other national institutions.
The organization of the paper is divided as follows. The main large-scale dynamical processes—regional weather modulators and the annual cycle of precipitation—focused on July–September are briefly described in the next section. Section 3 contains a short description of the observational campaigns and general features of the local meso-scale region (the GTRB), where the UCR-IMN campaign took place. Metadata and information of the analyzed surface data, such as wind, precipitation, temperature, and the upper-air observations, are also found in this section. The last part of Section 3 presents the methods of analysis along with the experimental design and the configuration of the numerical model used. The results and the concluding remarks, together with recommendations for future research, are given in Section 4 and Section 5, respectively.

2. Climate of the Region during the Analysis Period

The climate of Central America (CA) is largely determined by the interaction of large-scale and meso-scale physical and dynamical processes. This is mainly a consequence of how the trade winds (large-scale fields, including the CLLJ) interplay with coastal circulations [17], the southward intrusion of cold air masses [18,19], the north–south migration of the Inter-Tropical Convergence Zone (ITCZ) [20,21], the seasonal evolution of the North Atlantic Subtropical High (NASH), the nearby sea surface temperature (SST) distribution associated with the development of the Western Hemisphere Warm Pool (WHWP) [22,23], and the regional complex topography, among others.
In regard to the annual cycle of precipitation, two contrasting climatological regimes develop as a consequence of the interaction of all those multiscale systems. One of these regimes (the most relevant for this study) occurs on the Pacific slope (leeward side) of CA, and it has a well-defined rainy season from May to October–November, with daily rains occurring predominantly during the afternoon [24]. The biweekly precipitation distribution shows a well-defined reduction during July–August that has been associated with the mid-summer drought (MSD) [25]. This feature, of enormous relevance for agriculture, power generation, tourism, and other economic sectors, has been investigated in regard to its evolution and nature using different research methods during the past years [26,27,28,29].
The other rainfall regime occurs on the Caribbean slope (windward side of the region), where rainfall is abundant mostly all year round and exhibits important precipitation peaks during July (this has been related to the CLLJ by several studies [14,15,28,30]). During the boreal winter months (December–February) precipitation is abundant and is mainly associated with the intrusion of cold fronts [18,19] and the winter component of the CLLJ [28,30]. The CLLJ is an important dynamical mechanism due to its role as a conveyor of moisture to the continent (CA and parts of Mexico). Furthermore, the CLLJ is directly associated with the region’s rainfall regime and the displacement of the ITCZ [20,21]. Its intensity is associated with the phases of the El Niño Southern Oscillation (ENSO) [15,31,32]. The connection between these two regional regime processes at subseasonal scales has been recently investigated by the authors of [29].
ENSO, a low-frequency mode, is one of the main large-scale modulators of the climate in CA [33,34]. During its warm phase (El Niño), the rainfall regime on the Pacific slope of Costa Rica shows a significant annual decrease, and the surface temperature increases over this region [35,36]. Amador et al. [30] and Amador and Alfaro [37] identified a higher than normal Caribbean–Pacific pressure gradient that causes an acceleration of the trade winds across the country during an El Niño. Amador [15] extended this concept by pointing out that in the warm phase of ENSO, the July winds associated with the CLLJ are stronger than normal, so the displacement of the ITCZ to the south is more pronounced during this month. This condition is usually manifested in negative rainfall anomalies on the Pacific slope of CA. During the cold phase of ENSO (La Niña), almost the opposite response has been reported in the above works. The changes in precipitation due to ENSO are known to reflect on different socio-economic sectors such as agriculture (crop losses), hydroelectric power generation, and drinking water supplies [38].
Within the scope of this study, the impacts of these climate processes on Costa Rica’s territory can be summarized as follows. The MSD is more intense in the northwestern part of the Pacific littoral and the lower part of the Central Valley [24], where the Tempisque and the GTRB are located, respectively. Alfaro [26] found that in the GTRB the most severe summer events are more likely under El Niño conditions, and that on most dates analyzed, the minimum precipitation occurred, on average, in July. This author also found that, on average, the decrease in rainfall starts near 1 July and then increases during the first two weeks of August. Nevertheless, the onset and duration of this phenomenon are highly variable from one year to another [28].
Another low-frequency large-scale process that modulates the precipitation on CA is also associated with the phases of the Pacific Decadal Oscillation (PDO) and its interaction with the ENSO phases [39,40,41]. However, for a period as short as that used here (78 days), its influence can not be determined, although a warm PDO and a warm ENSO phase were reported (http://www.esrl.noaa.gov/psd/data/climateindices/list/).

3. Data and Methods

3.1. Study Area

The GTRB is an important socio-economic area extending from the central plateau of the country (Central Valley) to the Pacific Ocean (Figure 1a). In this region, the country’s largest concentration of population is found (an estimated total of 3,800,300 inhabitants). The Juan Santamaría International Airport (JSIA), the sounding site, is located in the western part of the Central Valley (west of the capital city of San José). This area also concentrates most of the industrial (80%), commercial, and agricultural activity of the country.
The GTRB has an enormous impact on the production of hydropower generation, as five power plants are located down along the stream. As can be observed in Figure 1a, the region has complex and varied topography.

3.2. Ticosonde-NAME 2004

During summer 2004, a major field campaign took place in Costa Rica to help characterize elements such as (1) the vertical structure and temporal variability of the atmosphere over CA, (2) the MSD, and (3) the local wind system associated with the CLLJ. This meteorological observational program was known as the T-NAME 2004 field campaign and it was partially supported by NASA-AMES Research Center, the NAME, UCR (CIGEFI and School of Physics), IMN, Universidad Nacional (UNA), Centro Nacional de Alta Tecnología (CeNAT), and Comité Regional de Recursos Hidráulicos (CRRH). Four daily soundings (00, 06, 12, and 18 UTC) were launched from the JSIA (WMO 78,762) from mid-June through September 2004. A total of 340 rawinsonde ascents were planned, beginning 16 June and concluding 8 September; however, only 272 soundings were reported. Missing data (16.4%) were attributed to telecommunications and power supply problems. For the purpose of this investigation, a data subset was extracted from the original observational period and analysis was made from 1 July to 8 September. These data files were obtained from the T-NAME Website mentioned above.
The soundings were performed using Väisälä RS-90-AG sondes during July-August and Väisälä RS80-15G sondes for the remainder of the period (see in [16] for details on the characteristics of the radiosonde observations during the T-NAME campaign). Daily mean profiles of temperature, specific humidity, and zonal wind at 910, 850, 700, 500, and 400 hPa were calculated.

3.3. Surface Data

In addition to T-NAME 2004, CIGEFI-UCR carried out a collaboration project with the IMN. The objective was to install a network of nine automatic meteorological stations strategically located along the GTRB, to obtain a profile of surface observations from the Pacific Coast to the Central Valley. IMN additionally provided information from the automated weather station at JSIA for the period of study, giving a total of ten stations. During this campaign, two types of automatic meteorological stations were used: Davis and Campbell Scientific. Guacalillo and Capulín were Davis Vantage Pro Plus stations and the rest were Campbell CR-10 X. The 5-min data gathered by the local UCR-IMN project, allowed to study the diurnal cycles of wind and precipitation, and the diurnal anomalies (hourly value minus daily mean) of the temperature during summer 2004. For each of the ten stations, an accumulated pentad precipitation variable was computed to obtain the precipitation time variations. In addition, the accumulated hourly contribution (in %) to total precipitation and the accumulated contribution (in %) of days with precipitation were also determined. Information regarding the automatic meteorological stations used to collect the data, their distribution with altitude, as well as the percentage of missing data for each time series is shown in Table 1.

3.4. Model and Experimental Design

Numerical experiments using the fifth-generation Pennsylvania State University (PSU)-National Center for Atmospheric Research (NCAR) Mesoscale Model (MM5) [42] were performed. The MM5 version 3 (MM5v3) used in this study is a nonhydrostatic regional model with multiple nesting capabilities and provides more realistic parameterization schemes as compared to the previous versions. Initial and boundary conditions for the simulations were derived from 6-hourly ERA-Interim [43] re-analysis data with a grid spacing of approximately 75 km. The regional model experiments employed three nested domains (D1, D2, and D3) at grid spacings of 27, 9, and 3 km (see Figure 1b), with 34 sigma (terrain-following) levels from surface up to 50 hPa. The parent domain simulates synoptic-scale processes, while the inner domains are used for capturing mesoscale and local weather phenomena. Despite the availability of state-of-the-art tools such as the Weather Research and Forecasting (WRF) model, previous works show that there are no remarkable differences in model performance between MM5 and WRF [44,45,46,47].
Two sets of MM5v3 simulations (experiments) were carried out on the study region to assess the model’s (1) ability to represent atmospheric SB circulations and wind patterns under the influence of (a) strong and (b) weak synoptic flows associated with the CLLJ, and (2) sensitivity to changes in physical parameterizations. The cases were selected using the CLLJ intensity over the area as proposed in [15]. The first (control) set is composed of two 72-h runs, one from 06 UTC 9 July to 06 UTC 12 July 2004, and the other from 06 UTC 30 August to 06 UTC 1 September, 2004. Physical parameterizations for this set are based on tested model configurations in [48,49]. The MM5v3 results are evaluated for 11 July (strong CLLJ and synoptic flow) and 1 September (weak CLLJ and synoptic flow). The second set of runs is the same as the control group, but with different cumulus and planetary boundary layer (PBL) schemes [8,9,50] for SB studies. In all runs, the first 48 simulation hours were considered as the spin-up time.
For all domains, the control set of experiments uses the Medium-Range Forecast (MRF) [51] PBL scheme and simple ice microphysics [52], allowing shallow convection. The Grell (Gr) [53] cumulus parameterization is only active in the parent domain, while convection is explicitly resolved in the second and third domains. The second set of simulations, on the other hand, uses Gayno–Seaman (GS) [54] PBL in the two inner domains and Kain–Fritsch (KF) [55] cumulus convection in the parent domain. The rest of the physical configurations match that of the control set. Cumulus and PBL parameterizations are especially important in the simulation of atmospheric properties and local circulations [56]. The PBL along a coastal area, for example, behaves differently than farther inland due to daily variations in the thermal and pressure gradients between land and sea [57,58,59], which can cause significant changes in local circulation characteristics.

3.5. Evaluation Methods

The observational data used for model evaluation in this study come mainly from the ten meteorological stations located along the GTRB. By using the closest grid point to a given station, calculations of, for example, 3-hourly 10 m winds were performed to evaluate the model representation of the flow speed and direction. The mean bias (simulation minus observation) and mean square error (MSE) are the metrics used to determine the model performance in simulating the 3-hourly surface wind speed. In Table 2, the results of these estimations are presented. Additionally, MM5v3 temperature, wind, and specific humidity fields were compared with radiosonde data at JSIA at available pressure levels.

4. Results

4.1. Observational Data

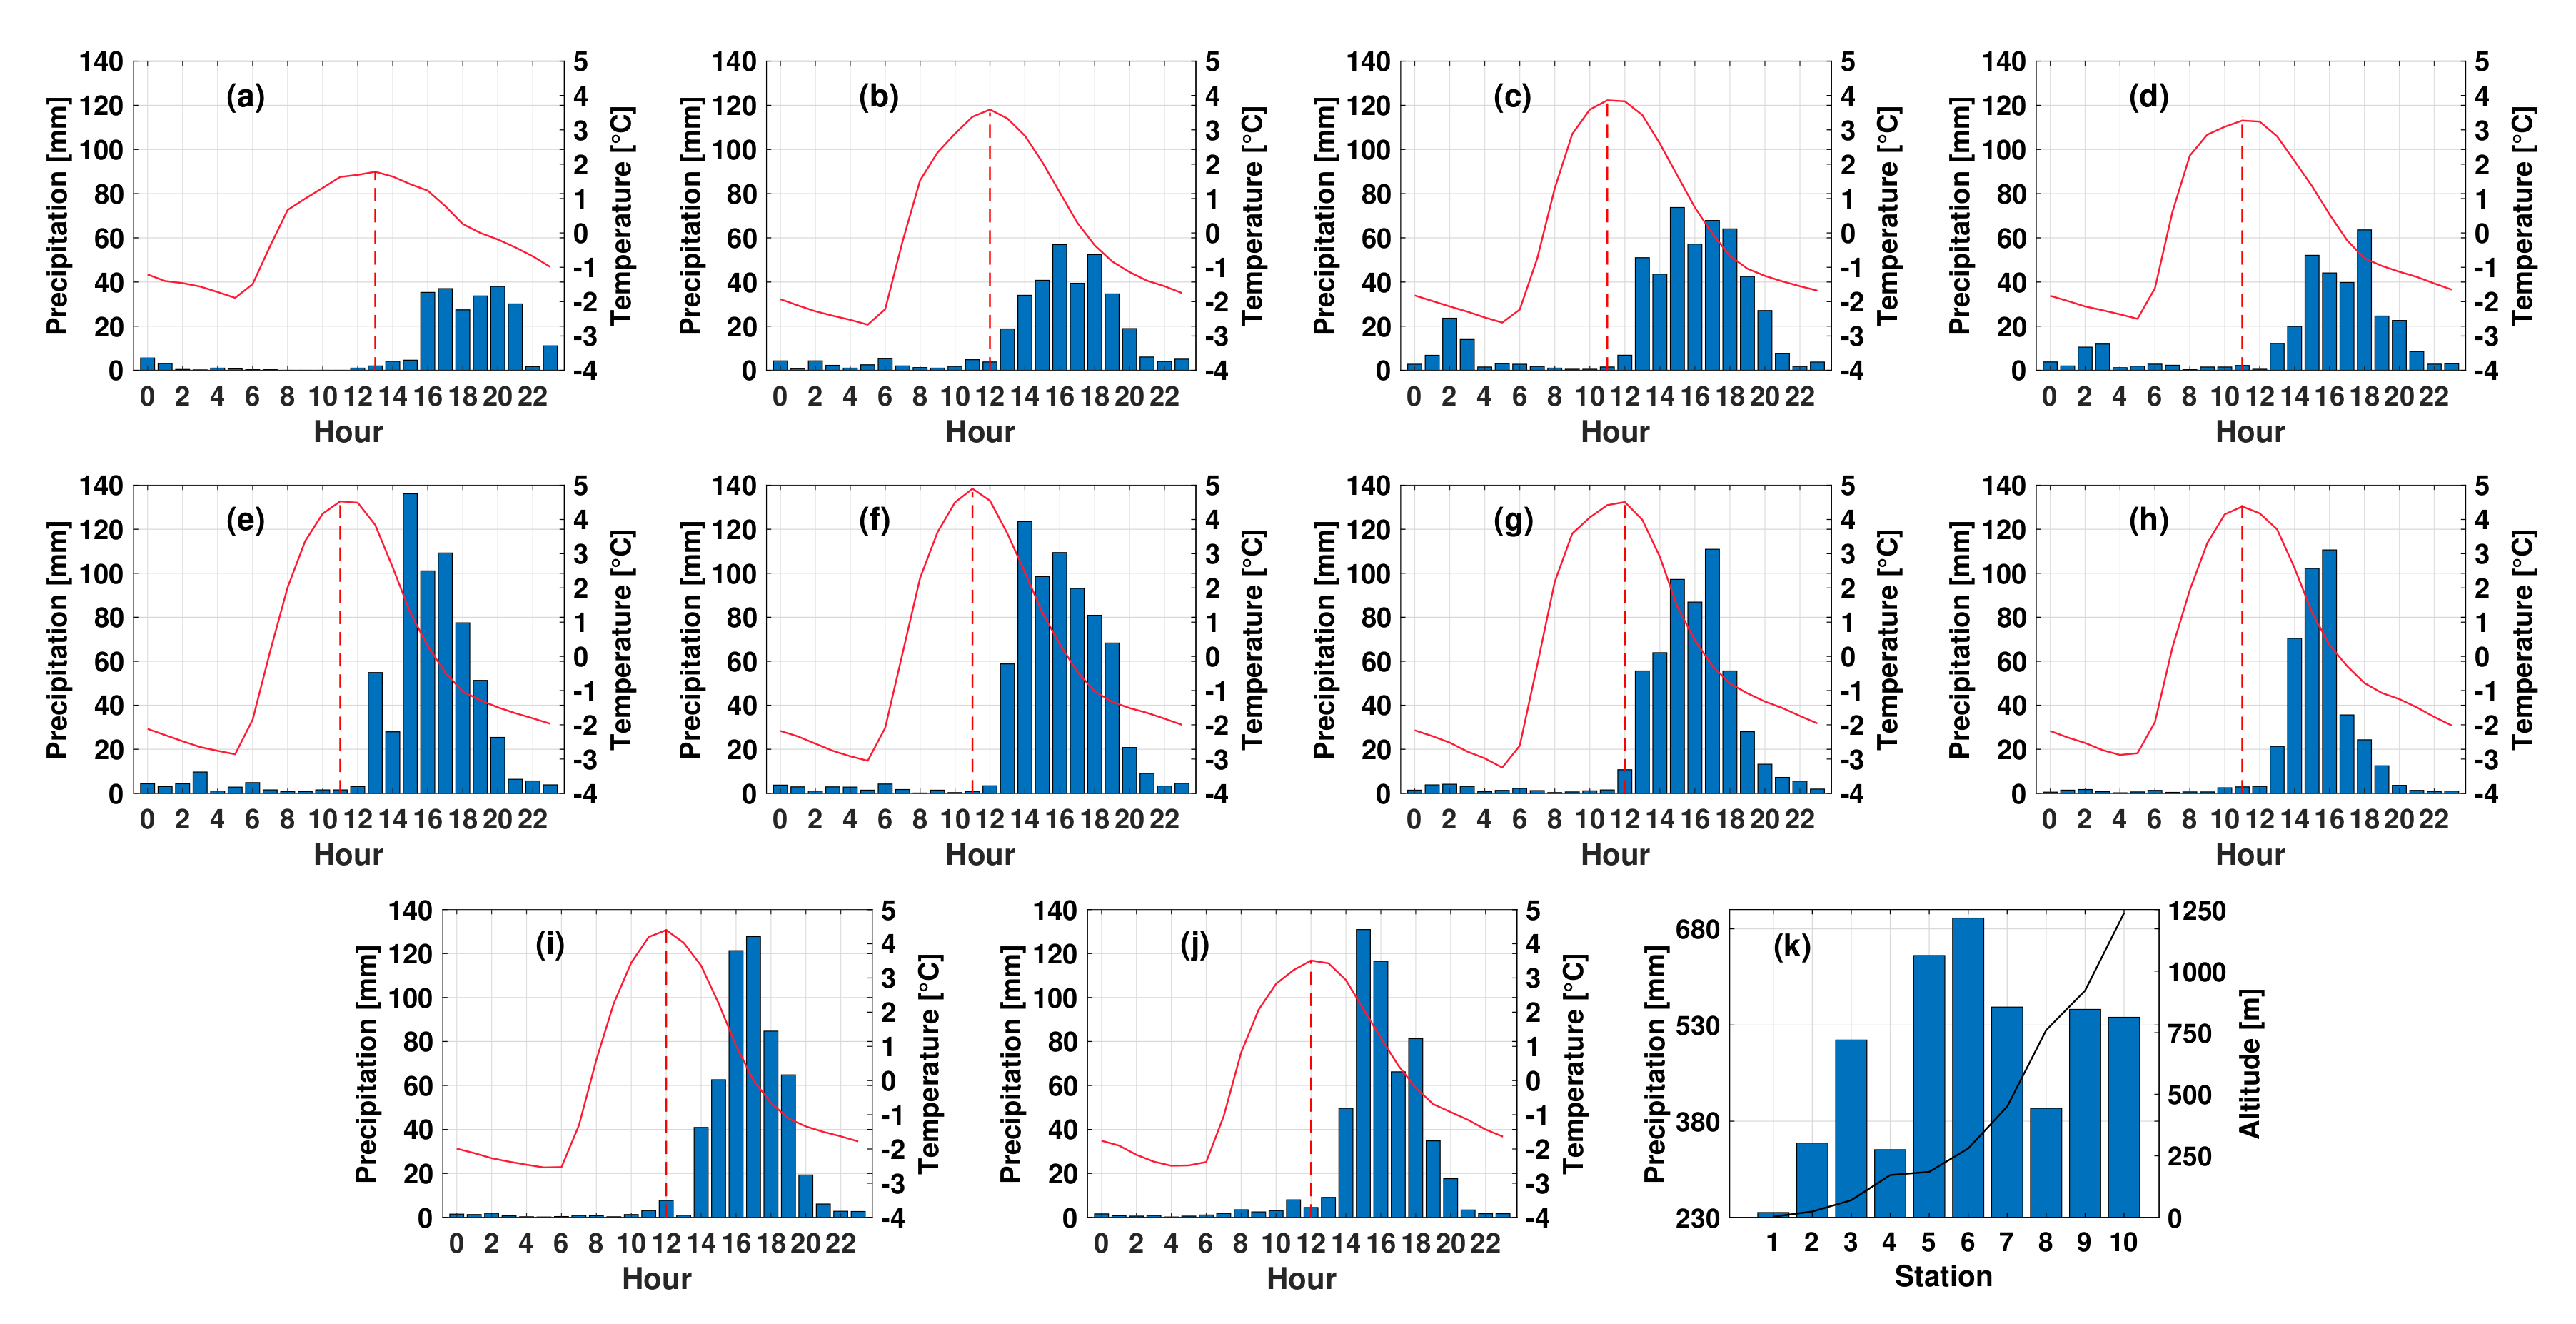
The hourly rainfall distribution over the GTRB is presented for all stations in Figure 2. In all stations, maximum precipitation is observed between 14:00 and 17:00 LST (Local Solar Time); these values increase with altitude up to the Central Valley. The mean diurnal cycles indicate that maximum precipitation, for all stations, occurs at about the same time (afternoon hours), which suggests that there is no sea breeze-induced moisture transport from the Pacific Coast into the Central Valley. A smaller accumulation of precipitation is observed during the morning hours, especially in stations located farther from the coast (Figure 2h–j). The accumulated percentage of total hourly precipitation (not shown) evidences that in the afternoon hours (14:00–17:00 LST), more than 34% of precipitation occurs along the topographic profile. The rainy days correspond to 35% of the total number of days in the study period (not shown).
A remarkable feature of the precipitation diurnal cycle present in all the stations described above is the 2- to 3-h time lag with respect to the surface air temperature anomalies diurnal cycle (solid red line in Figure 2). The daily maximum temperature anomaly (vertical dashed red line in Figure 2) is found at 13:00 LST (Figure 2a) near the coast (Puntarenas), and from 1 to 2 h earlier towards the mountains (Figure 2b–j). This suggests that the local diurnal heating plays an important role in convection initiation.
In Figure 2k, the maximum value of total rainfall (≈ 696 mm) is observed at the middle point of the station profile (Hacienda Vieja, 280 m above sea level). This rainfall distribution suggests that a large part of the humidity carried by the Pacific SB is discharged near this area. This relationship between precipitation and altitude has been documented by (1) Hastenrath [60] using 45 stations along a transect from the Pacific coastal range to the interior highlands of Guatemala, (2) Mendizábal [61] for two portions of the Atlantic slope of Costa Rica and one of the Pacific slope of Panama, and (3) Fernández et al. [62] using a topographic profile of 14 stations distributed from the Pacific to the Caribbean coasts of Costa Rica. These investigations focused on CA corroborate the existence of a characteristic rainfall maximum at intermediate altitudes, a feature that is also confirmed in the present analysis having an important impact on planning activities for many economic sectors along the Pacific slope of CA. The difference in the accumulated rainfall among the stations may be attributable to regional topography, local radiative balance effects, and the interaction between local and synoptic flows.
The distribution of pentad precipitation has a minimum during the period 21 July–14 August 2004 (not shown), corresponding to the MSD signal and consistent with the results by Alfaro [26] for the GTRB region.
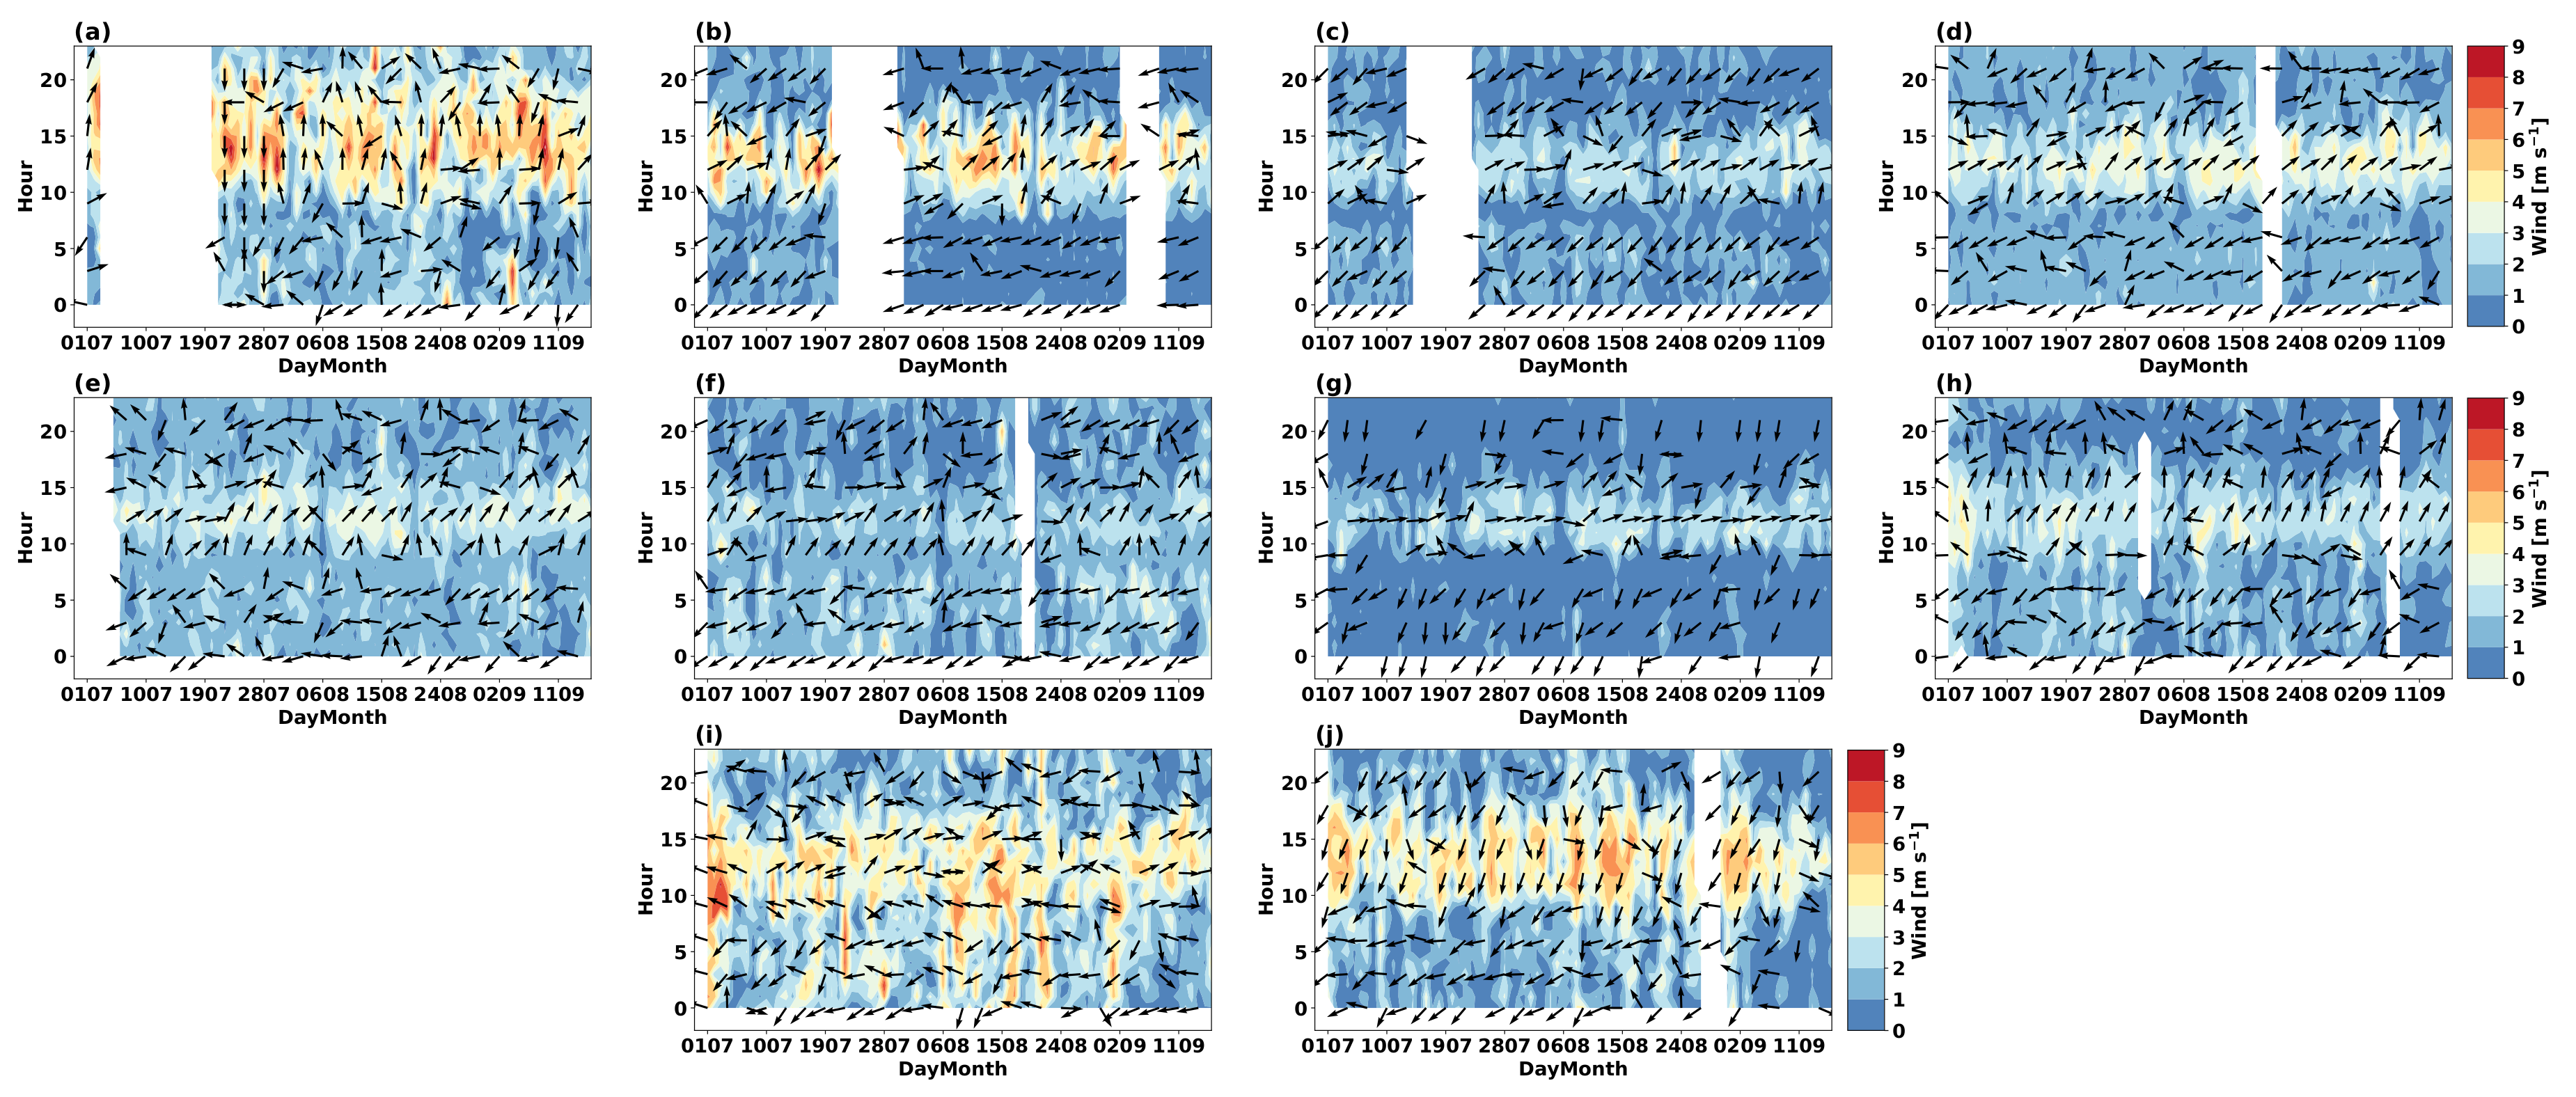
Figure 3 presents the hourly distribution of the surface wind along the GTRB. Note here that wind intensity decreases with altitude between Puntarenas and Escuela de Ganadería. Maximum values generally occur between 13:00 and 15:00 LST and vary between 4 m s 1 and 9 m s 1 . On the other hand, night and early morning hours are characterized by weaker wind intensities.
At Puntarenas (Figure 3a), northerly wind dominates during the early morning hours, while southward wind is observed from 10:00 LST until late in the night. At Guacalillo, Capulín, Lagunilla, and Orotina (Figure 3b–e, respectively), south-southwesterly wind (i.e., SB) prevails from 10:00 to 15:00 LST. The rest of the day, the wind direction in these locations is from the north-northeast due to two factors: the influence of the trade winds and the downslope circulation from the colder highlands to the warmer lowlands. From Hacienda Vieja to CIGEFI (Figure 3f–j), the maximum wind speed varies between 4 m s 1 and 8 m s 1 in the period from 10:00 to 16:00 LST. In addition, northeasterly flow dominates during early hours of the day, which is consistent with prevailing trade winds. At Hacienda Vieja (Figure 3f), the wind is from the south between 10:00 and 16:00 LST. In this time interval, the wind is westerly at the Escuela de Ganadería (Figure 3g) and flows from the flanks of the Aguacate Mounts, while in La Garita station, which is located farther from the coast, the wind maintains a southerly component (Figure 3h). At JSIA (Figure 3i), the wind behavior is irregular throughout the day. Night and morning hours are characterized by dominant easterlies (trade winds). From 11:00 until 18:00 LST, the wind is mainly from the southwest direction. This is consistent with the findings by the authors of [63,64], who used radiosonde and station data, respectively, to study the mean diurnal cycle of wind in the Central Valley of Costa Rica. The station located in CIGEFI (Figure 3j) is only influenced by trade winds (northeasterlies) throughout the day. It is important to emphasize that the wind is stronger in the latter two stations.

4.2. Model Simulations

4.2.1. Case of 11 July 2004

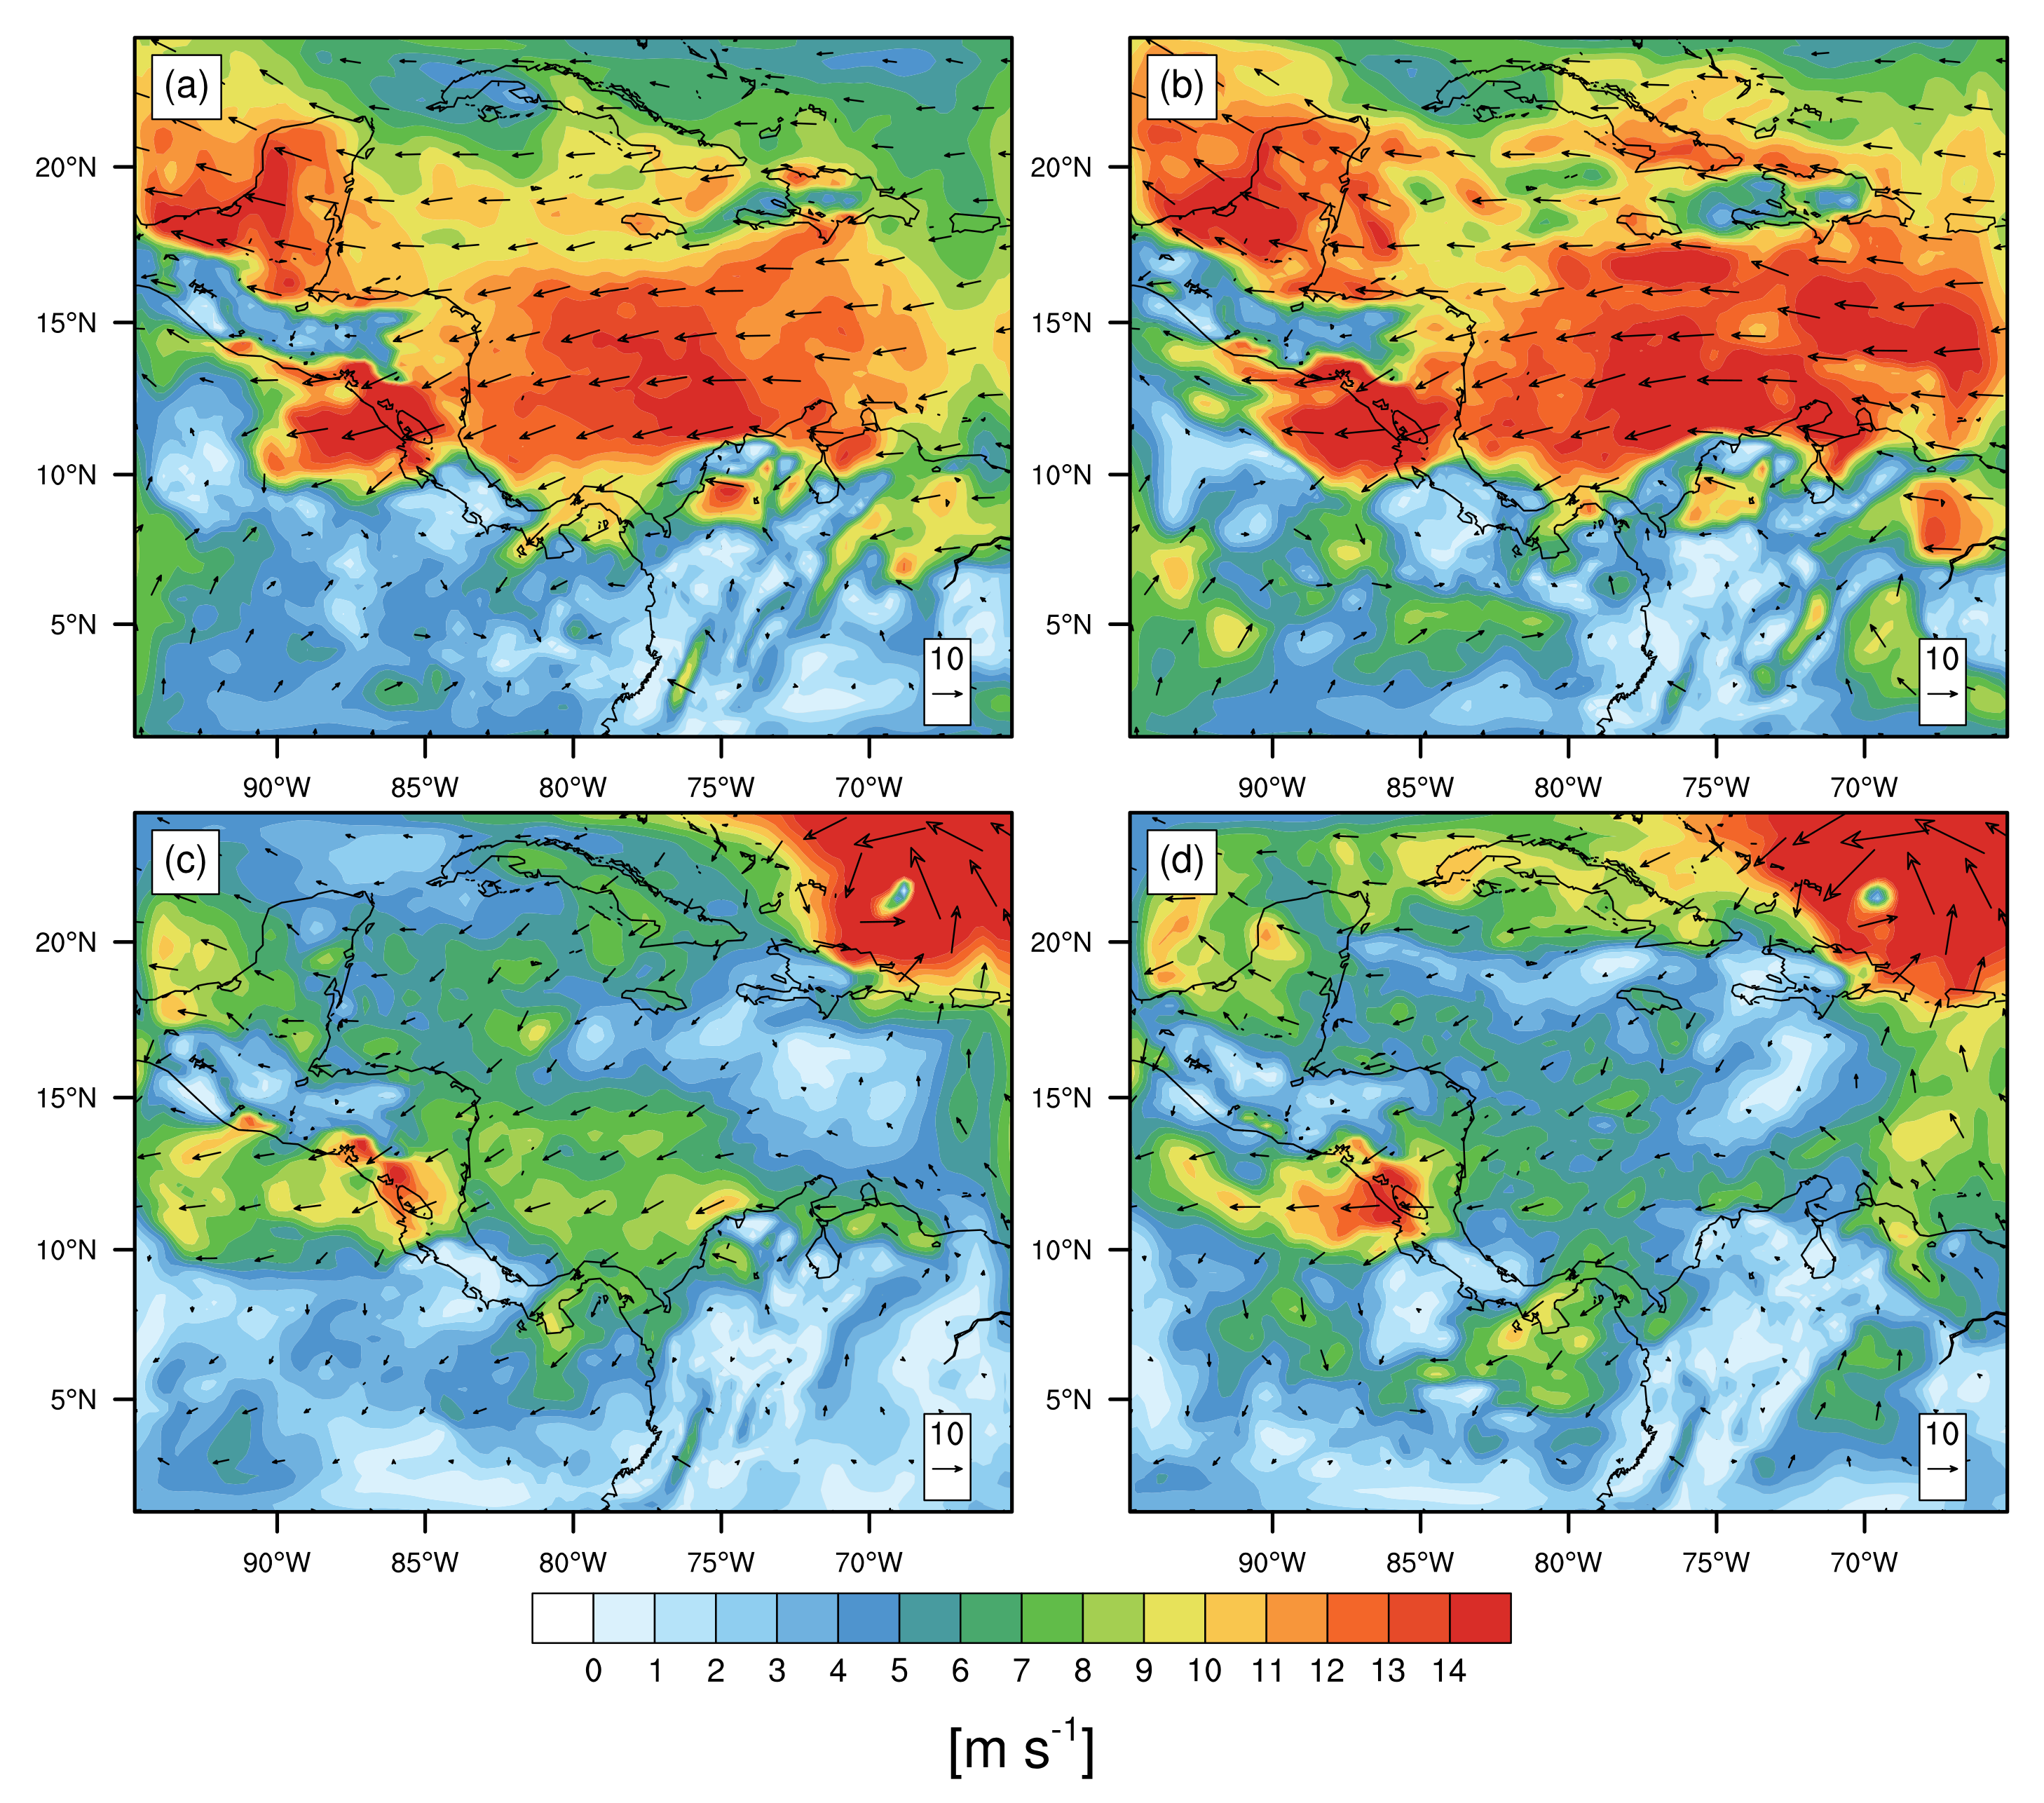
A representative case, 11 July 2004, is selected to study the influence of a strong CLLJ on the SB in the Costa Rican Pacific region. The numerical simulations for this day used two different configurations of convection and boundary layer schemes, as described previously. The magnitude and direction of the wind in D1 for both sets of experiments are presented in Figure 4a,b. The upper left panel (Figure 4a) represents the Grell-Medium Range Forecast (GrMRF) simulation and the upper right panel (Figure 4b) the Kain Fritsch–Gayno Seaman (KFGS) simulation. Both show intense 925 hPa winds (13–14 m s 1 ) over the Caribbean Sea area, and capture the presence of the low-level jet (with greater magnitude in KFGS). The CLLJ northward branch toward the Gulf of Mexico and the wind gap flow crossing CA to the eastern Pacific are also shown. Both simulations are consistent with the dynamically initialized data from ERA-Interim and with the summer wind pattern reported in [14,15,65].
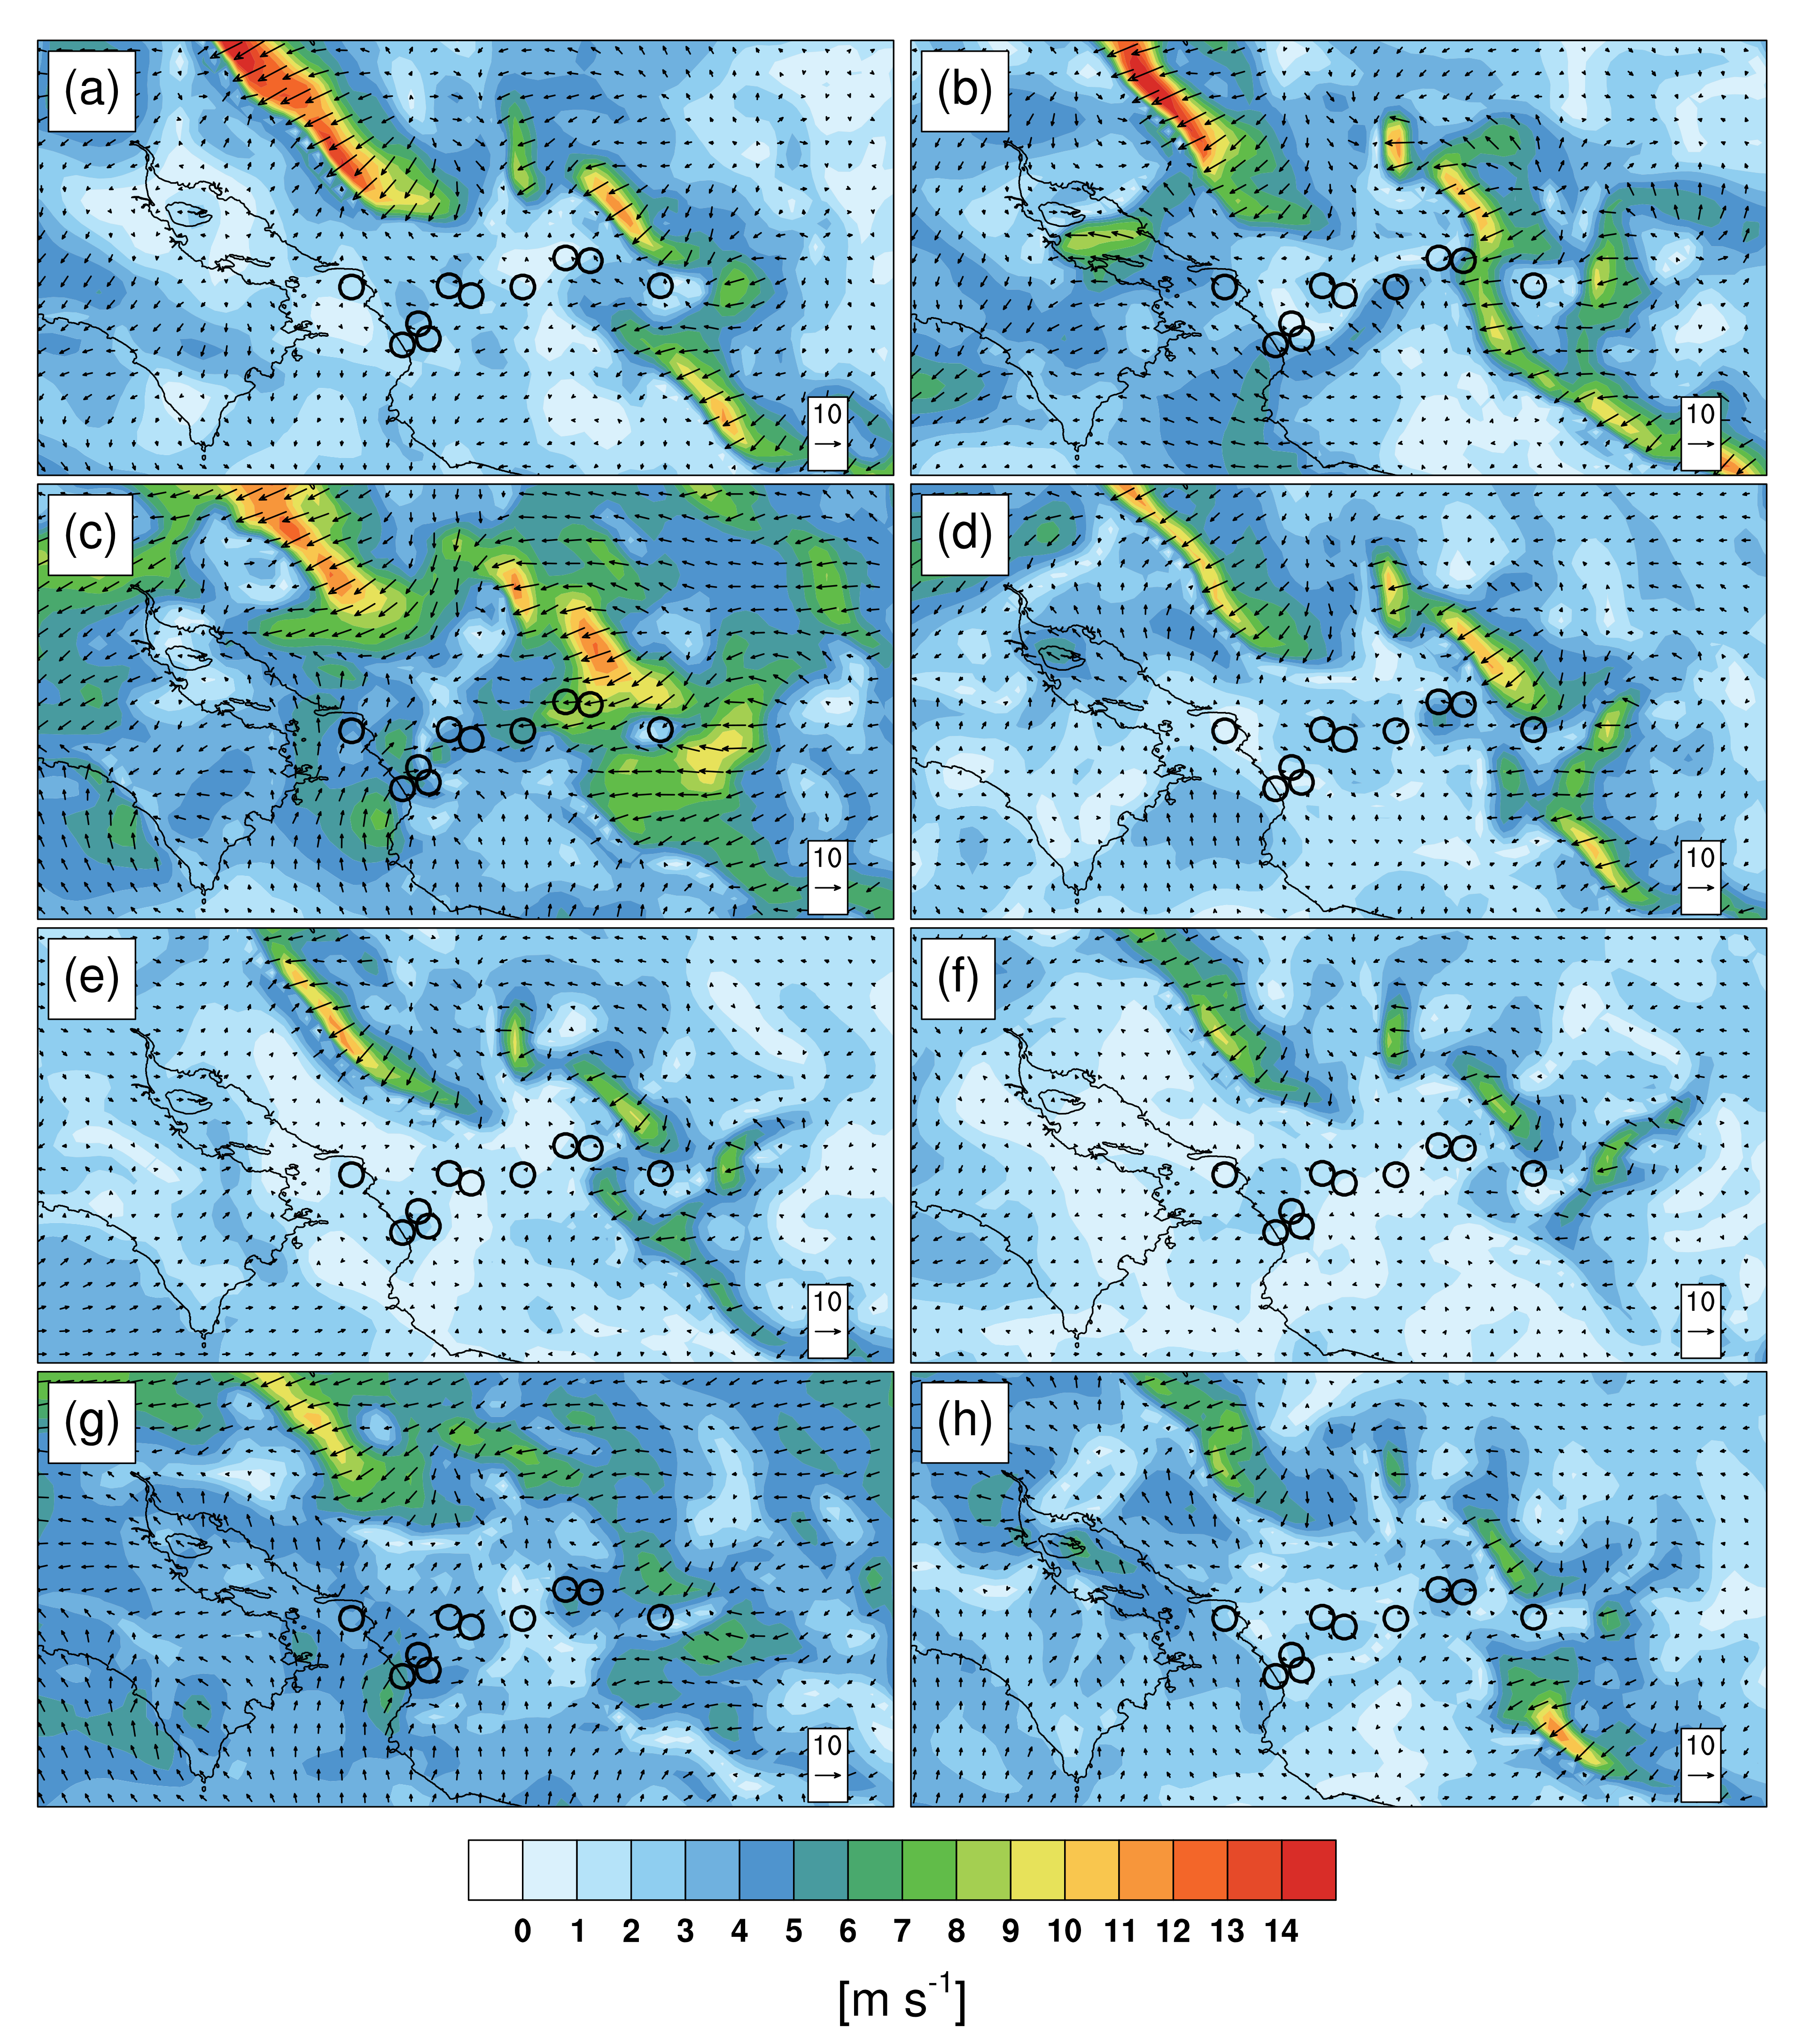
The passage of the enhanced low-level flow from the Caribbean Sea to the Pacific coast of Costa Rica is linked to a reduction in precipitation in the latter region. This synoptic setting also affects the inland penetration of the SB on the Pacific side of the country, as presented in Figure 5a–d for the simulated 10 m winds in D3 of the GrMRF experiment. At 00:00 LST (Figure 5a), the region of interest is under the influence of easterly wind. At 06:00 LST (Figure 5b), southeastern wind was observed at the Escuela de Ganadería station; while at higher elevations, along the GTRB, the predominant flow was from the east. Starting at 12:00 LST (Figure 5c), the time of solar radiation maximum, a southwestern SB flow established over the stations near the Pacific coast (Puntarenas, Guacalillo, Capulín, and Lagunilla), while the wind at more inland stations (Orotina, Hacienda Vieja, Escuela de Ganadería, La Garita, JSIA, and CIGEFI) is mainly from the east. By late afternoon (18:00 LST, Figure 5d), weaker westerly flow reaches the station at the Escuela de Ganadería.
A comparison of the above results with those of the KFGS simulation exposes important differences in the behavior of the wind direction (not shown). At 00:00 LST, there is weak westerly wind from Puntarenas to La Garita in KFGS. At 09:00 LST, KFGS shows weak westerly flow from Puntarenas upward to Hacienda Vieja and easterly winds in the other stations. From 12:00 to 15:00 LST, a west-southwestern SB flow reaches the surroundings of the Escuela de Ganadería, and at night this flow decreases in intensity. Both numerical experiments present dominant trade winds over Costa Rica’s northern Caribbean, North Zone, and North Pacific regions, in addition to strong winds blowing through the mountain gaps.

4.2.2. Case of 1 September 2004

For this date, the MM5v3 simulations exhibited weaker intensities of both the trade winds and the CLLJ, as seen in Figure 4c,d. However, the wind over the Caribbean Sea region is more intense in GrMRF (Figure 4c) than in KFGS (Figure 4d). At the 925 hPa level, both model experiments clearly capture Hurricane Frances [66] to the north of La Hispaniola. This confirms the ability of the regional model to represent the most important synoptic features of the simulation period.
The 10 m GrMRF winds for 1 September 2004 (Figure 5e–h) show weak and unorganized trade winds between 00:00 and 06:00 LST (Figure 5e,f). At noon (Figure 5g), the model adequately represents the westerly and southwesterly winds from the coast to the Escuela de Ganadería. Later in the afternoon, westward flow reaches the surroundings of the JSIA area (18:00 LST, Figure 5h). Note that at 18:00 LST, there is wind with a weak westerly component over the stations closest to the coast, so the flow at higher elevations may be due to valley breeze circulations.
In the case of the KFGS simulation (not shown), the model presents uniform easterly flow from 00:00 to 06:00 LST over the entire region. At 12:00 LST, this experiment captures southwesterly wind over coastal stations up to La Garita. At 18:00 LST, the wind is from the south in the coastal region, it is northeasterly at middle elevations and westerly at higher places, except in CIGEFI (easterly wind). In general terms, the wind intensity in KFGS is weaker than in GrMRF.

4.3. Model Evaluation

4.3.1. Simulation of 11 July 2004

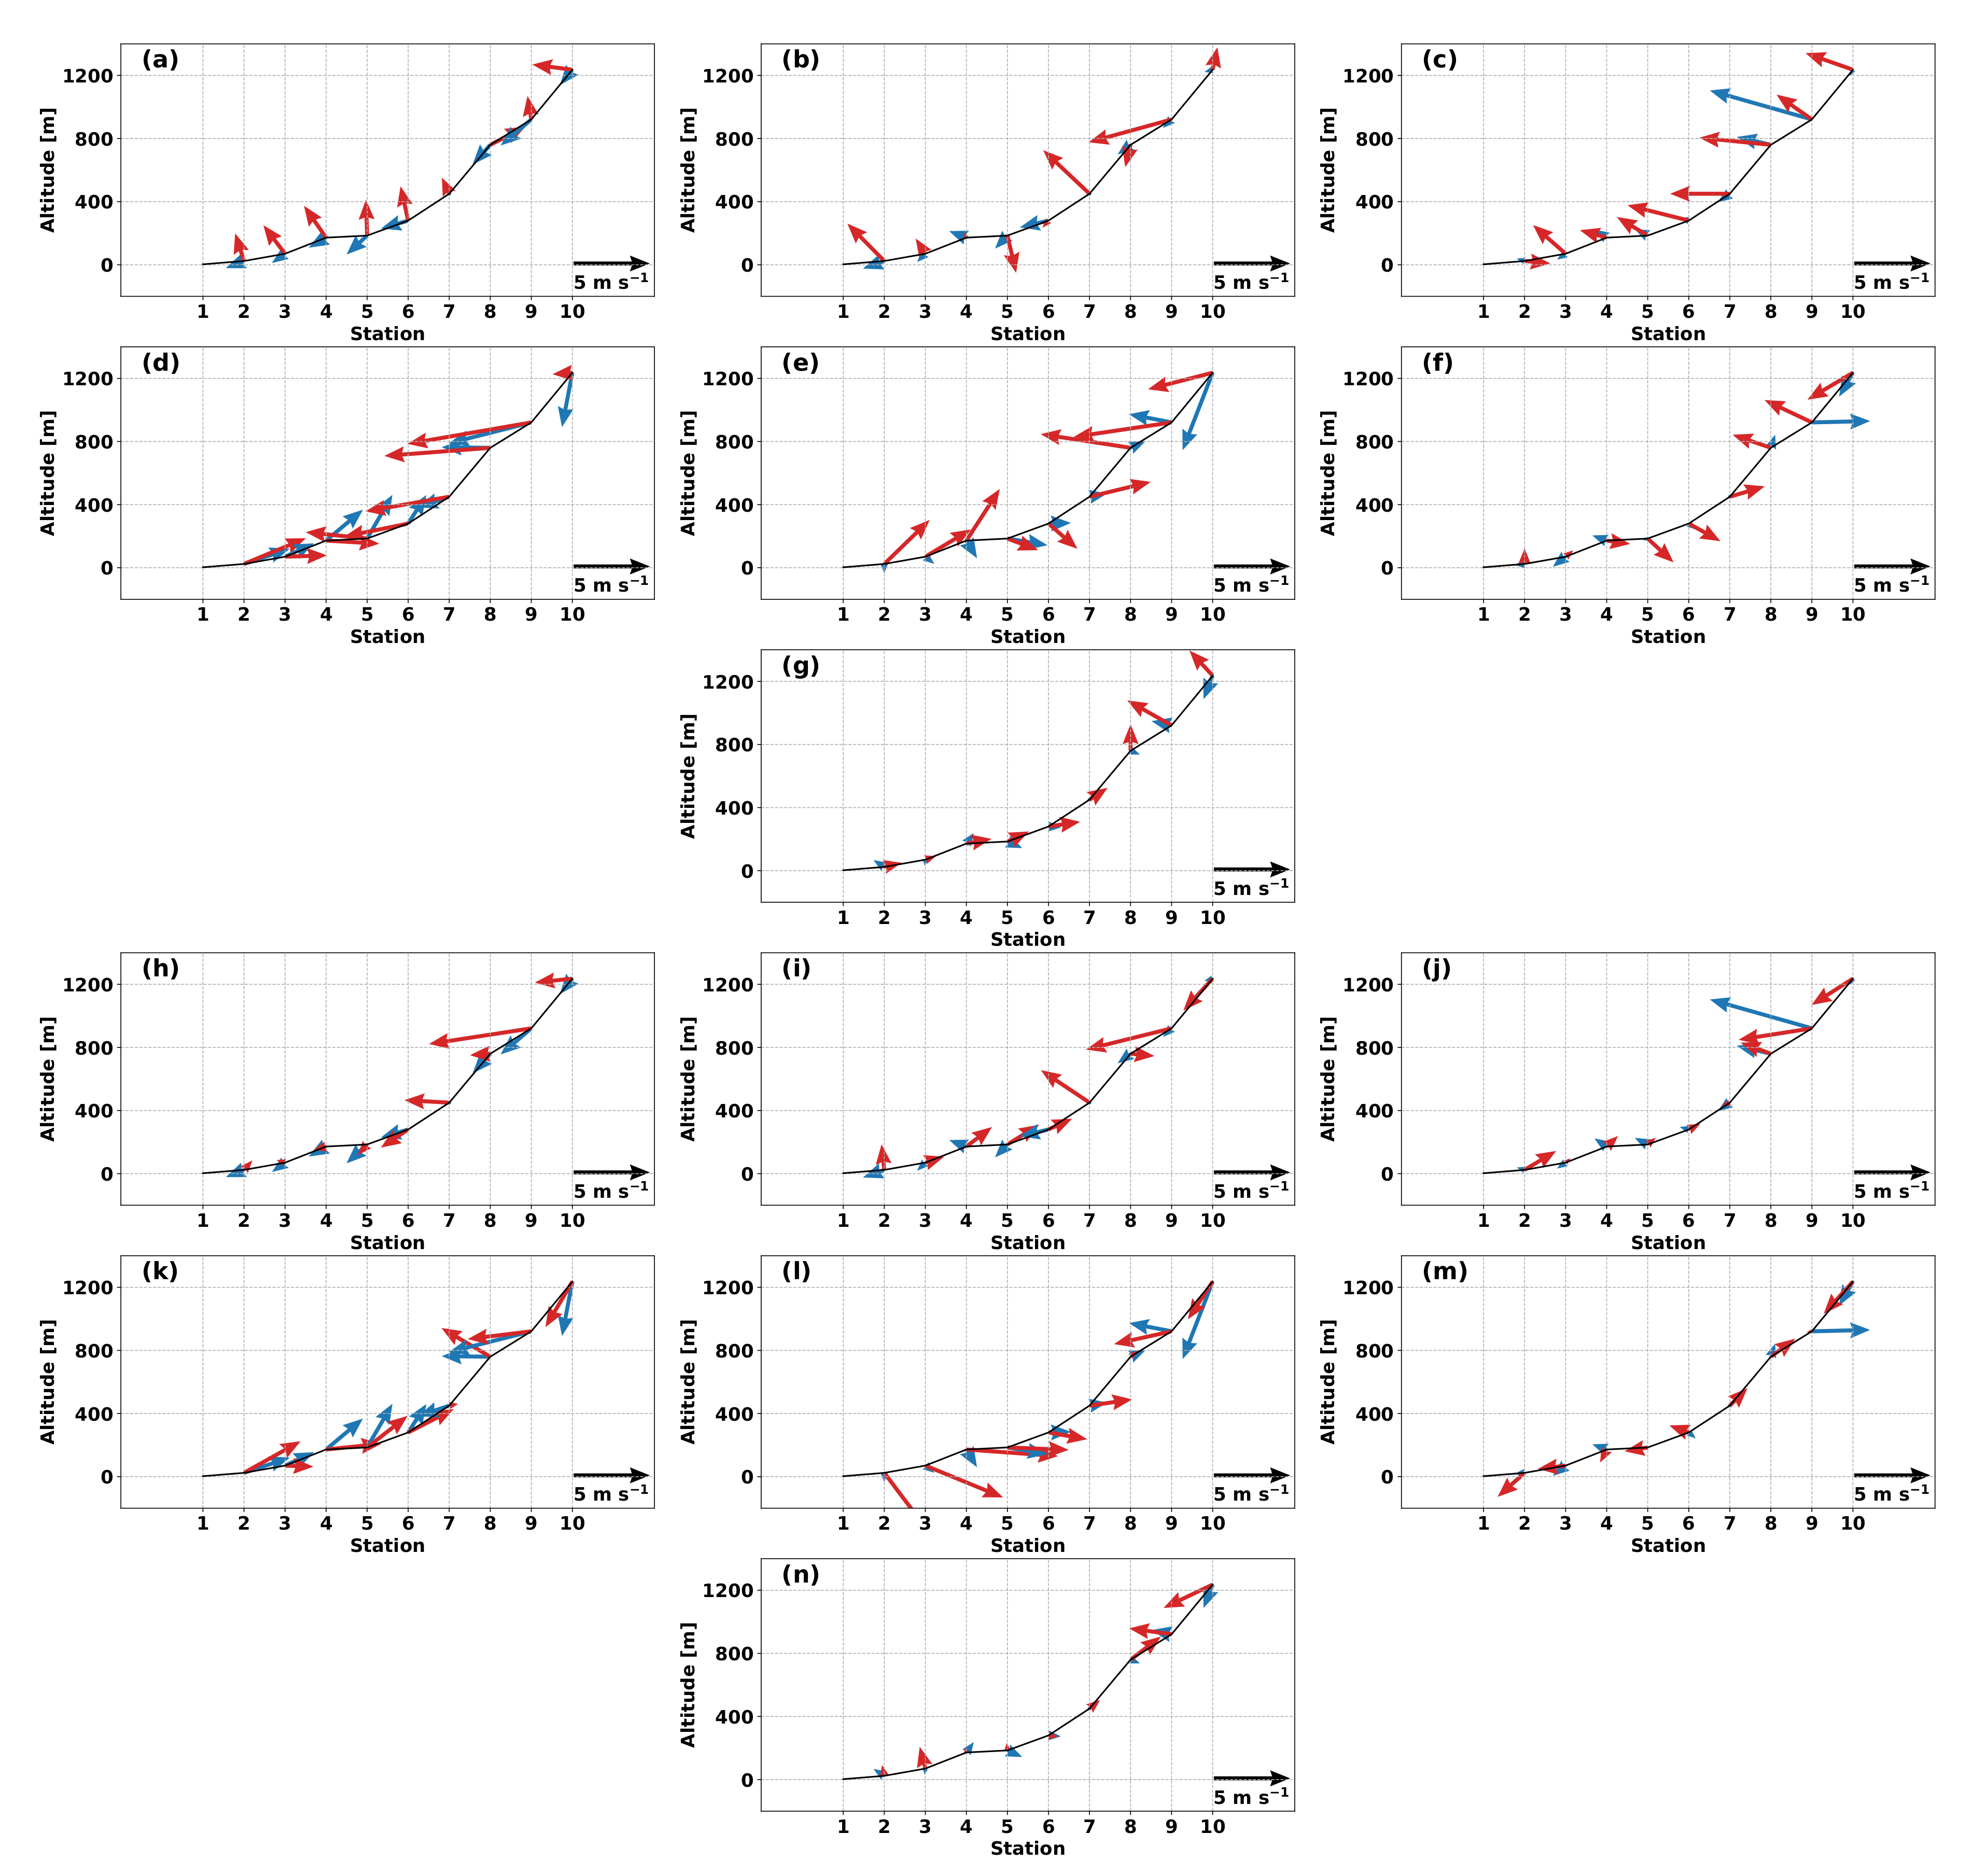
For 11 July 2004, Figure 6 shows the 3-hourly evolution of the observed (in blue) and simulated (in red) wind vectors at the location of the meteorological stations. According to the observations, flow with northeasterly direction is dominant between 03:00 and 09:00 LST (Figure 6a–c). At noon (Figure 6d), the SB flow is well established and is represented by a southwesterly wind that reaches the Hacienda Vieja, while stations 7 to 10 (see Table 1) continue to be influenced by wind from the east. At 15:00 LST (Figure 6e), the SB decreases its intensity and only a weak westerly flow is observed at La Garita. Later, at night, the wind presents a large spatial variability (Figure 6f,g). Note that the station located at CIGEFI reports northeasterly flow during the entire day. The GrMRF experiment does not represent adequately the wind variations during the early morning hours (Figure 6a,b). Nonetheless, between 09:00 (Figure 6c) and 21:00 LST (Figure 6g), the model properly represents the flow along the observational profile. According to Table 2, this simulation overestimates the magnitude of the 3-hourly surface wind (positive mean bias) at all stations, with the largest differences found in Escuela de Ganadería and La Garita (2.60 m s 1 and 2.18 m s 1 , respectively).
Figure 6 also examines the ability of the KFGS experiment to simulate SB during this particular day. The behavior of the simulated wind at 03:00 LST matches that from observations, i.e., it is predominantly from the east (Figure 6h). However, at 06:00 LST and 09:00 LST (Figure 6i,j) the modeled wind direction is from the southwest instead of the northeast as observed. From noon (Figure 6k) to late afternoon (Figure 6l), the model captures the breeze circulations from the Pacific. In addition, it represents the change in wind direction at 18:00 LST, as well as the influence of the synoptic flow over stations located far from the coast (Figure 6m). Late at night (Figure 6n) the KFGS simulation is not able to reproduce the observed wind direction. Table 2 shows that KFGS also overestimates the surface wind speed, but the mean biases are lower in all stations, except in CIGEFI, as compared with GrMRF. Additionally, MSE values in this simulation are lower in the five stations located at the middle of the topographical profile (from Orotina to JSIA). Overall, by using the GS boundary layer parameterization, the model is able to better represent the wind magnitude (mean bias of 0.70 m s 1 and MSE of 3.06 m 2 s 2 ).
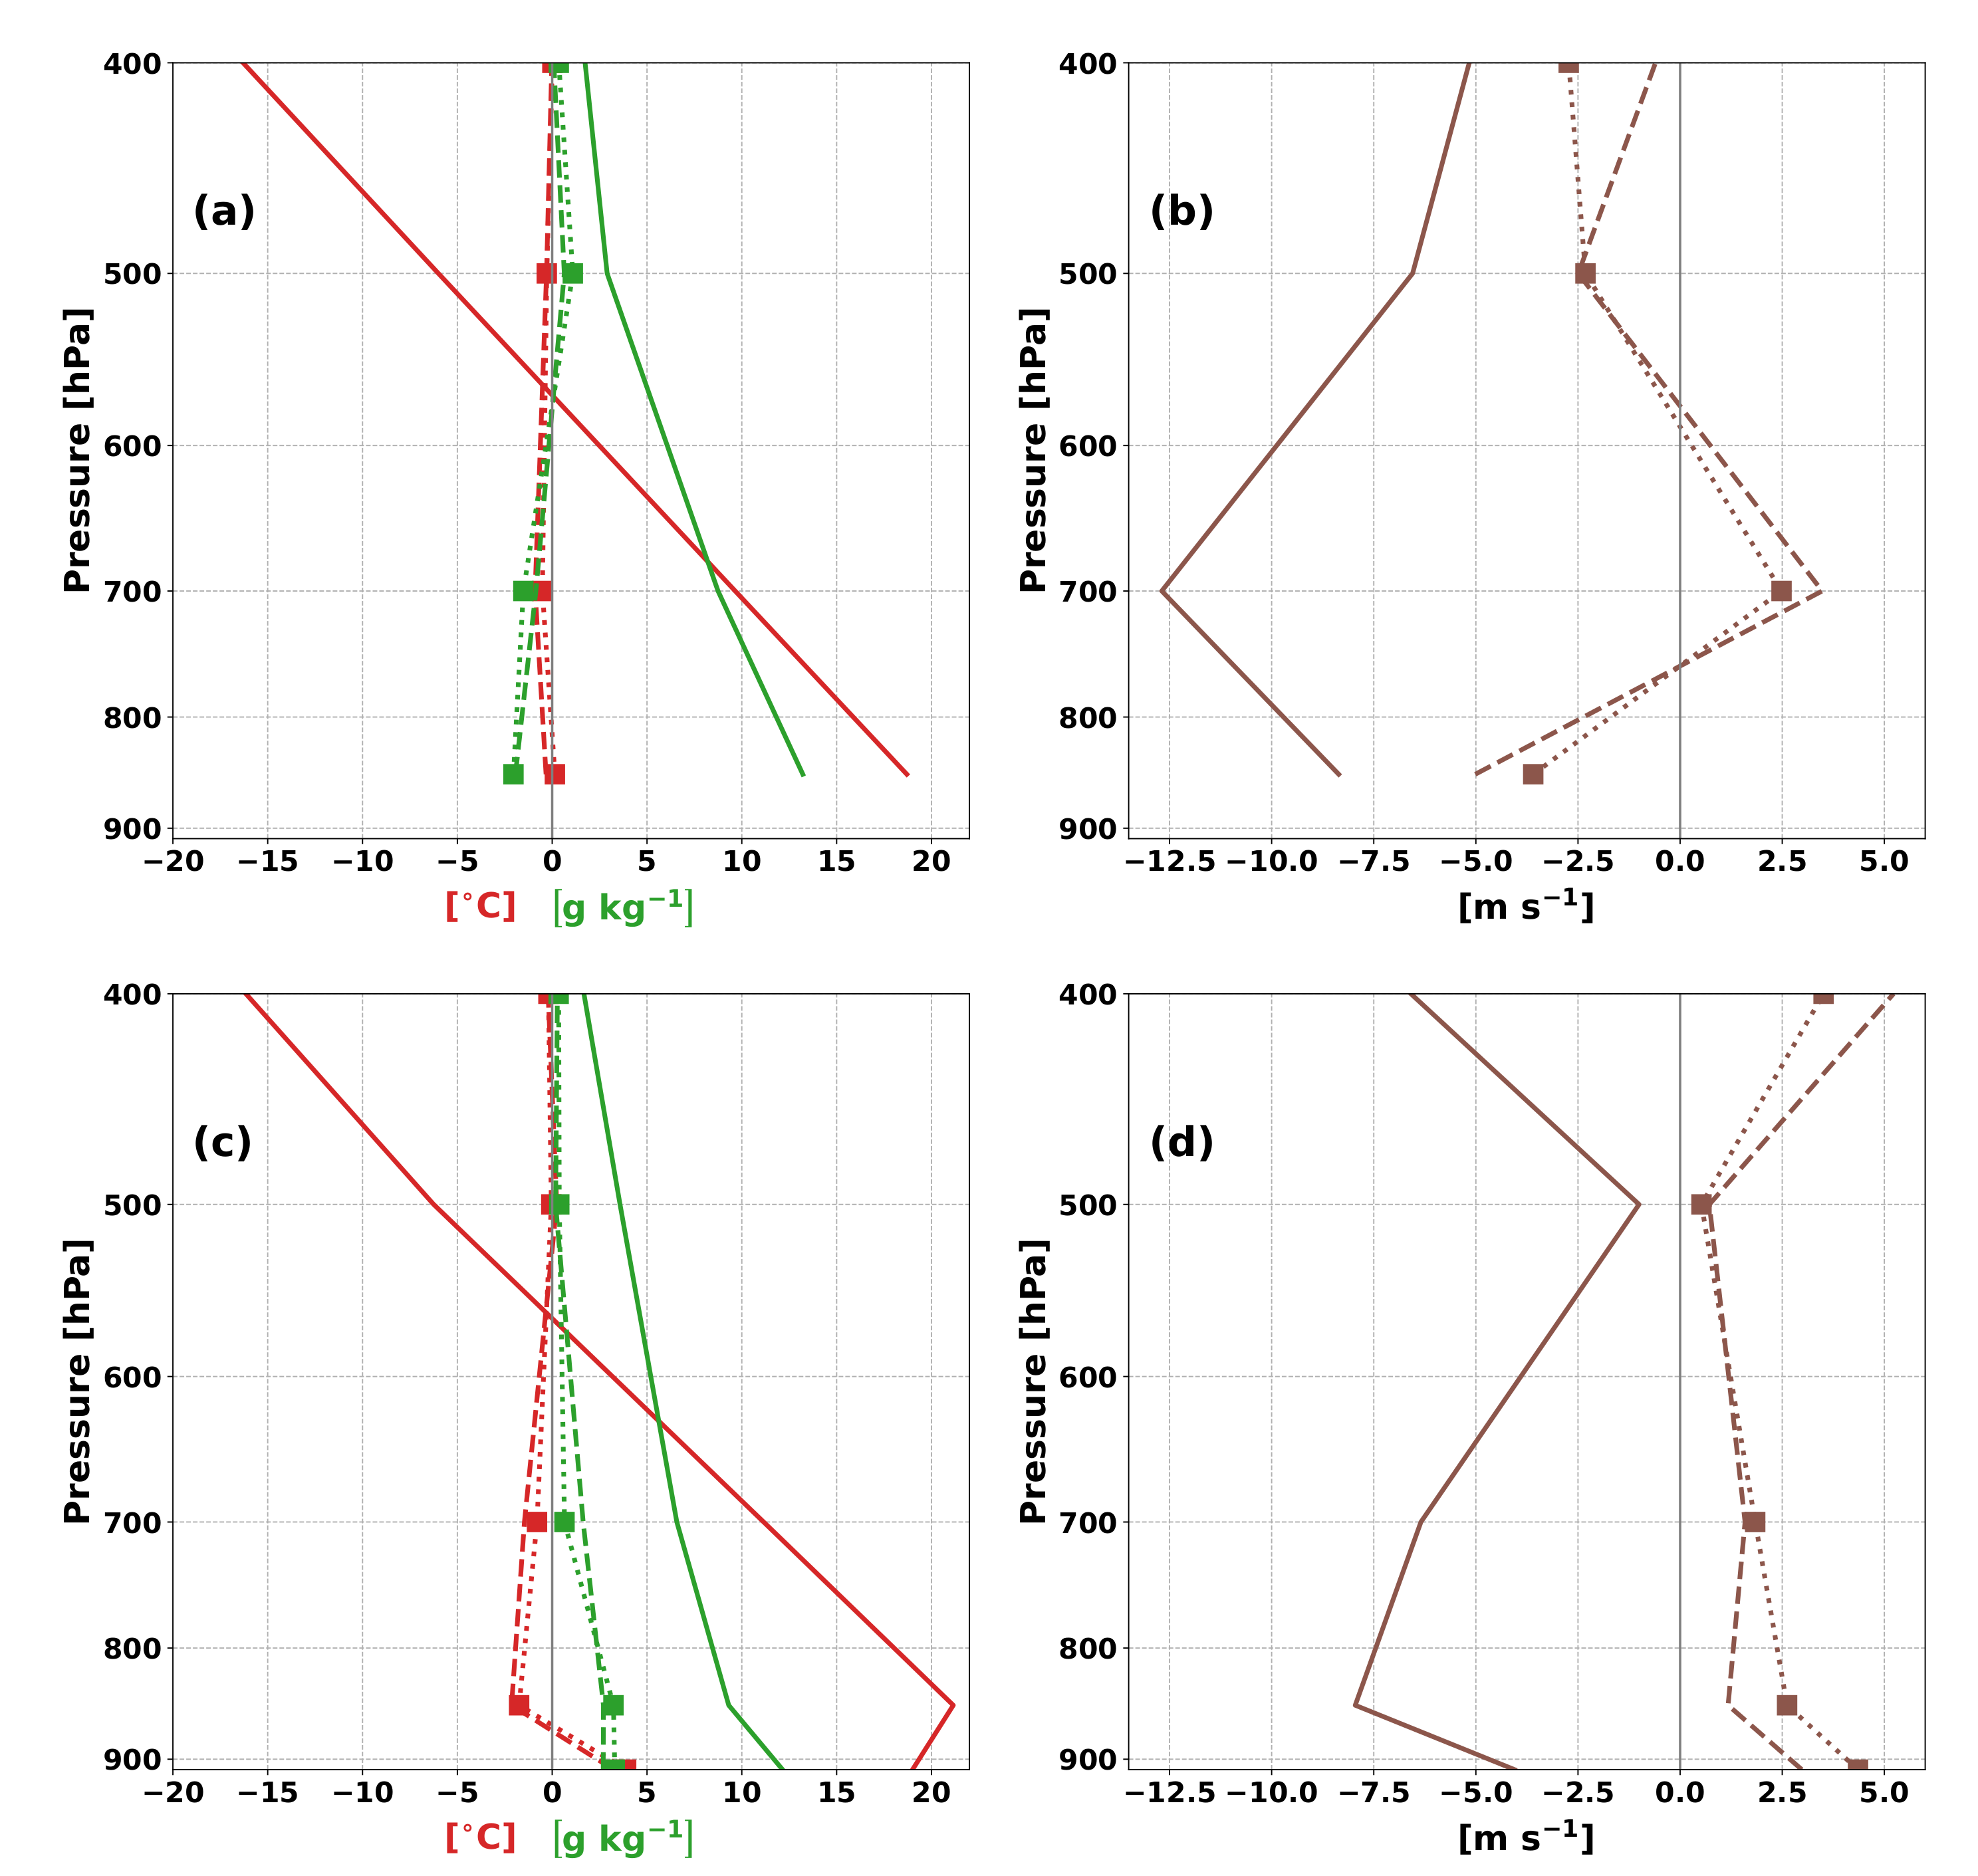
As part of the analysis for 11 July 2004, the simulated vertical profiles of temperature (red lines), specific humidity (green lines), and zonal wind (brown lines) at the model grid point closest to JSIA are compared with the radiosonde-derived profiles of those variables (Figure 7a,b). In Figure 7a, it can be seen that both numerical experiments adequately simulated the vertical distribution of temperature (small differences with respect to observations), being more realistic in KFGS (dotted line with square markers). The low-level specific humidity, on the other hand, is underestimated by both simulations. This could be explained by errors in the model’s initial humidity conditions and to the grid points selected for comparison. Furthermore, the representation of the PBL in the MRF and GS parameterization schemes can be partially responsible for this behavior. In the case of the zonal wind (Figure 7b), the two simulations produce a maximum at 850 hPa (large negative differences), while in the observations it is located at 700 hPa. This may be attributed to factors such as the altitude difference between the station and the model closest gridpoint, the complexity of the terrain and the influence of surrounding topography. Liu et al. [67], using a version of the WRF model, discussed in more detail some of the problems arising when using different PBL representations of wind fields in complex topography due, among other elements, to the development of turbulent flow.

4.3.2. Simulation of 1 September 2004

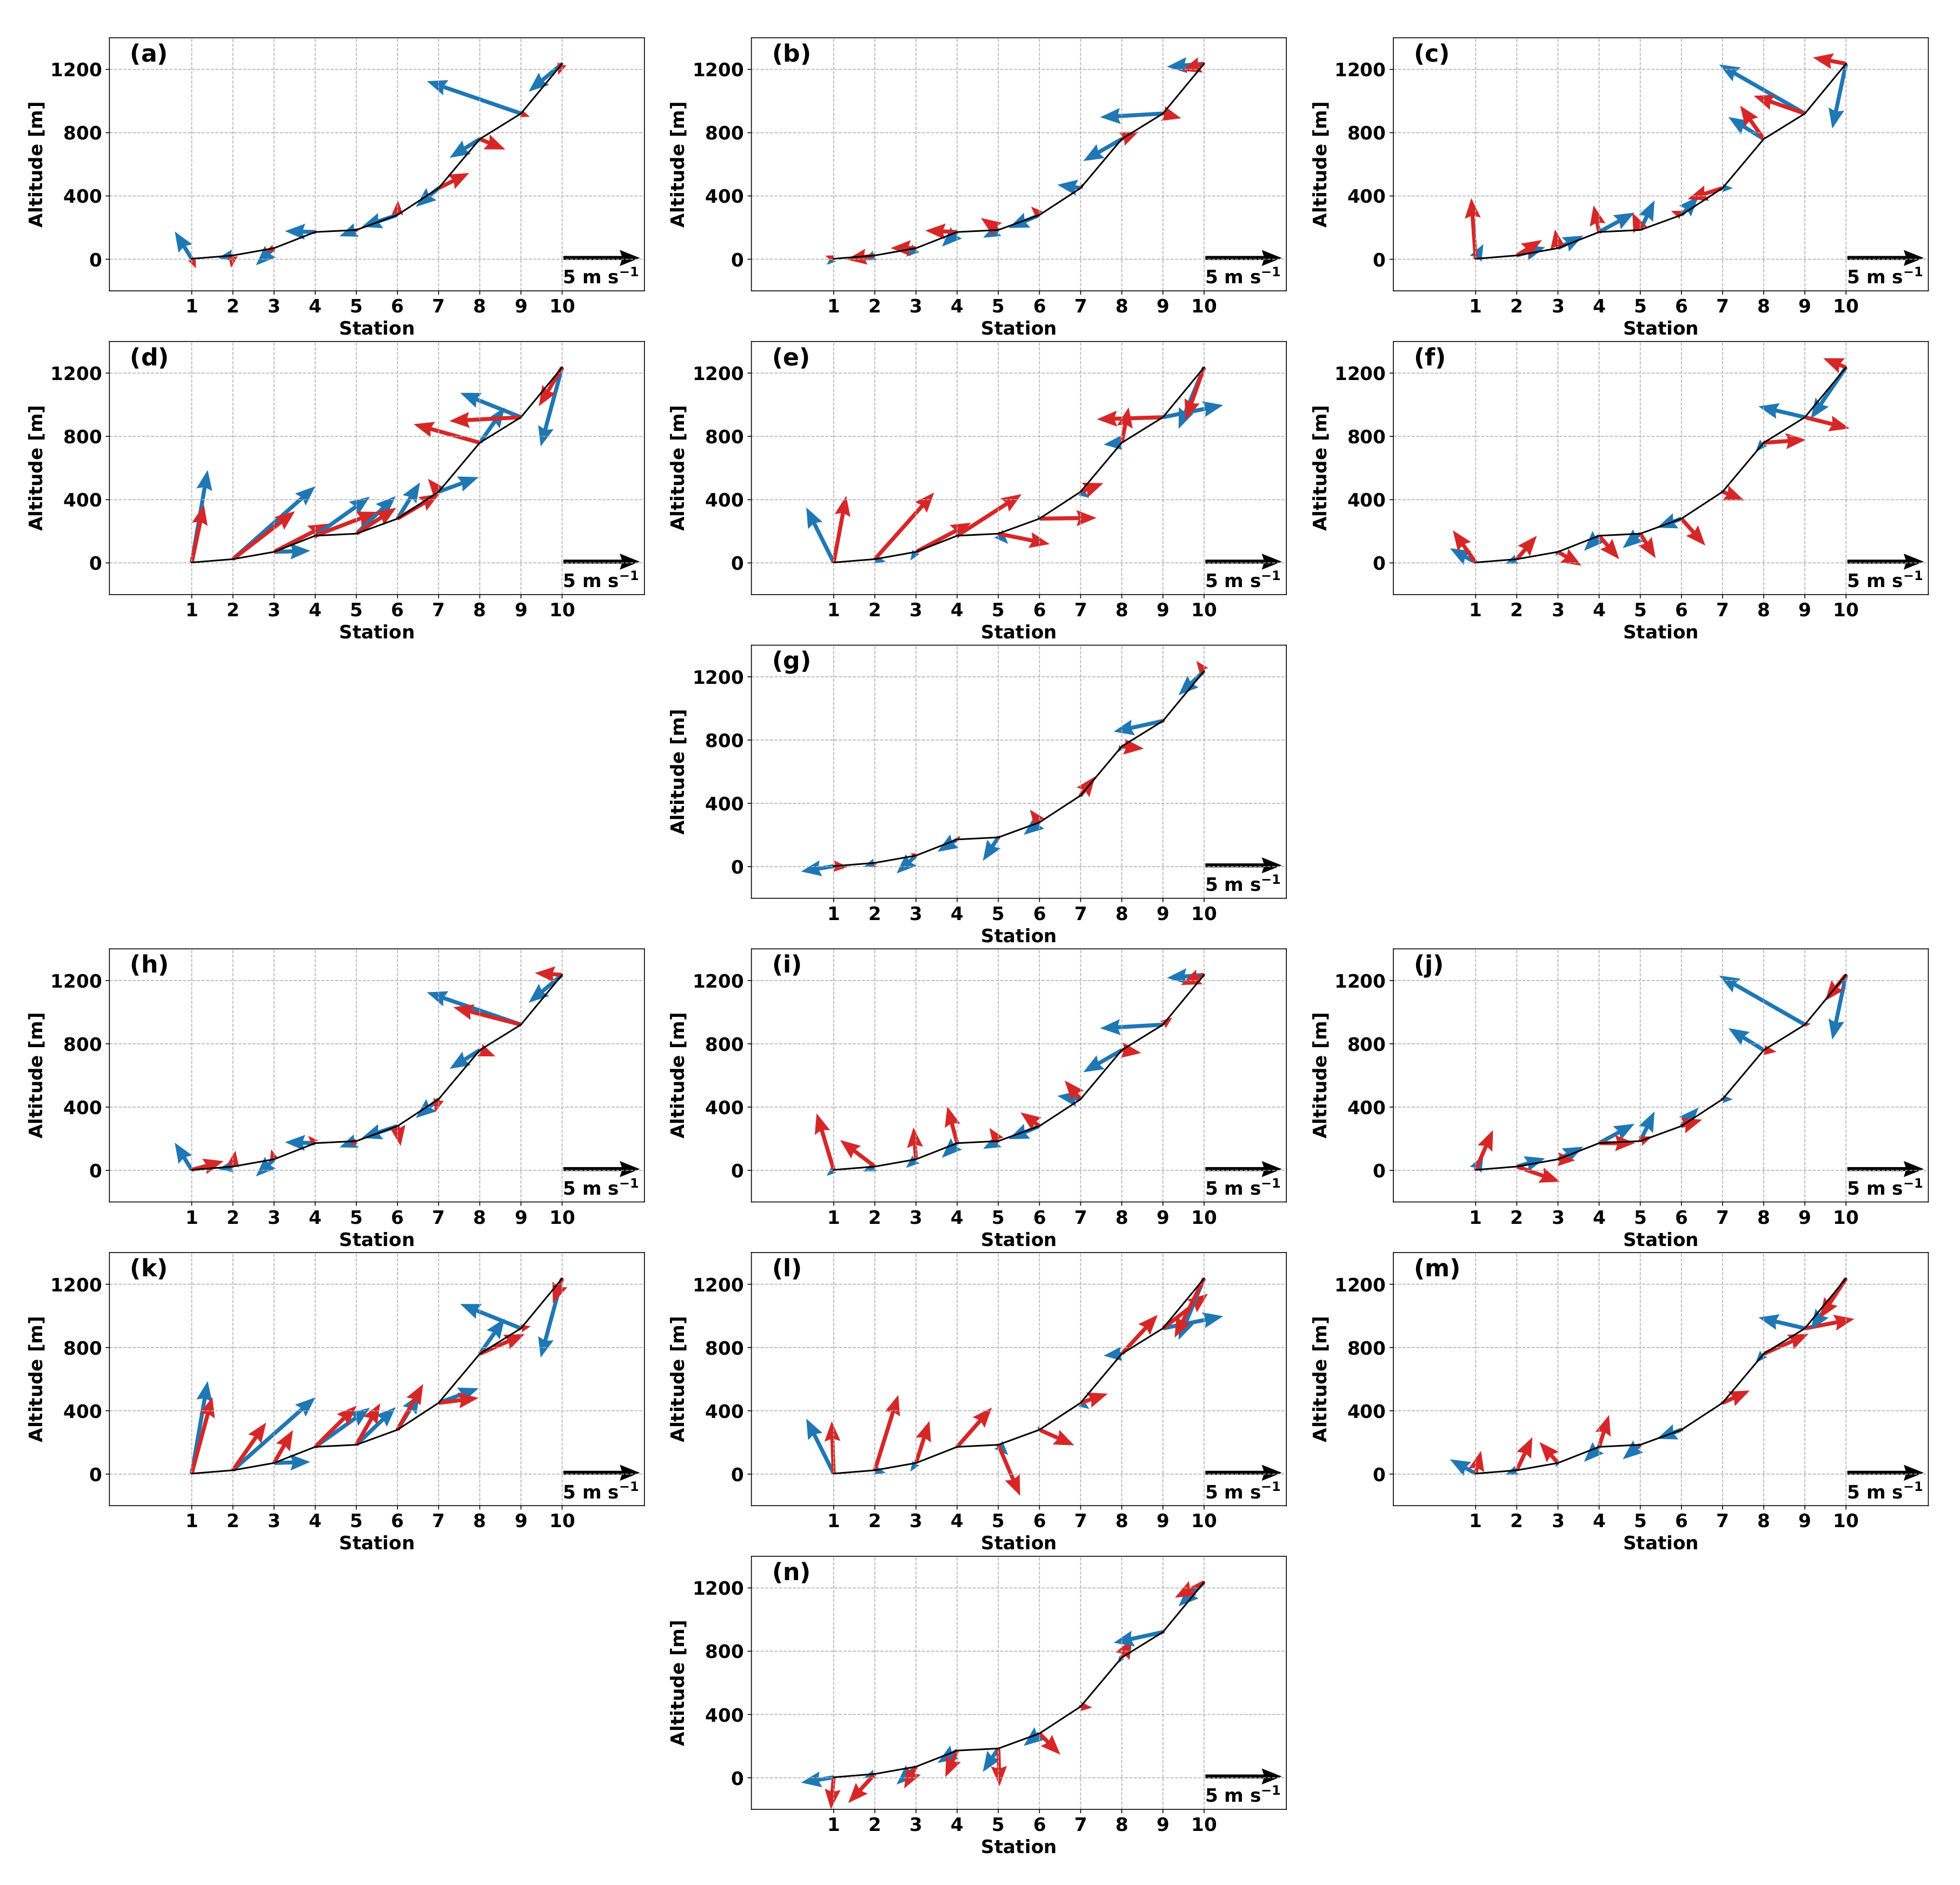
On 1 September 2004, westerly wind was observed over coastal stations at morning hours (09:00 LST) consistent with the development of a SB front, in contrast with 11 July 2004 that occurred after midday on a zonally strong CLLJ wind. The control simulation (GrMRF) for 1 September 2004 (Figure 8a–g) shows the influence of easterly synoptic winds across the study region, but they are not as strong as in the July case. During the early hours of this day (Figure 8a–c), there are large differences in the simulated wind direction with respect to observations. As seen in Figure 8d, the flow representation is more realistic as the land surface temperature gradient increases. From 15:00 LST to 21:00 LST (Figure 8e–g), GrMRF overestimates the wind magnitude. This experiment, as seen in Table 2, exhibits negative overall wind speed bias, which is smaller than in the simulation for 11 July 2004. The same occurs for the MSE values.
When using a KFGS physical configuration, an improvement in the simulated direction and magnitude of the wind is noticeable (Figure 8h–n). However, the model still shows difficulties in the estimation of the correct wind direction in the early morning hours (Figure 8h–j). This may be due to the model sensitivity to surface parameterization, to topographical PBL effects and initial conditions. As in GrMRF, the KFGS simulation is able to reproduce the inland flow from the Pacific coast at 12:00 LST (Figure 8k) and the easterly winds at higher elevations. In the afternoon and evening (Figure 8l,m), the performance of KFGS is limited, but it shows a more realistic representation of flow direction and intensity along the profile at 21:00 LST (Figure 8n). In both cases analyzed, the model fails to reproduce the transition from SB to land breeze that occurs at around 18:00 LST as observed in stations 1 to 9 (Figure 8m). Compared to GrMRF, the KFGS simulation for this day provides a better representation of the surface wind speed. The overall mean bias and the MSE in the latter are the smallest (−0.10 m s 1 and 3.21 m 2 s 2 , respectively, as shown in Table 2).
Figure 7c,d shows both the radiosonde-derived and the simulated atmospheric vertical structure for 1 September 2004. Between surface and 850 hPa, the MM5v3 simulations do not capture the thermal inversion layer (Figure 7c) which indicates deficiencies in the representation of PBL processes. In general, the model underestimation of the temperature (red line) from 850 hPa to mid tropospheric levels may be associated with problems in the physical representation of the diurnal range of temperature. Another reason may be that the model does not consider anthropogenic sources of heat, an important factor along areas of the GTRB as mentioned in Section 3.1 above. Contrary to temperature, the low-level specific humidity (green line) is overestimated as compared to radiosonde data (solid green line). According to the observations (solid brown line), the zonal wind on this day (Figure 7d) is underestimated by the simulations, and, as in the measurements, the modeled maximum of this variable occurs at 850 hPa. These results highlight the difficulties of the MM5v3 in simulating wind patterns and atmosphere–land interactions over complex terrain. However, this analysis provides a limited quality control of the model, as there is only one radiosonde station in the study region.

5. Conclusions

This paper represents an important contribution to the studies of SB in Costa Rica and CA. It is the first study in which observations and numerical modeling are used to analyze the dynamics and mechanisms of SB in the climate of Costa Rica. Furthermore, the performance of a numerical regional model, under different cumulus and PBL parameterizations, in the simulation of mesoscale processes such as the SB on the Pacific coast of Costa Rica has been evaluated. From the analysis of precipitation, it is found that maximum values at diurnal scale occurs approximately between 14:00–17:00 LST, showing a time lag of 2 to 3 h from the temperature maximum, suggesting that the local diurnal heating is a key factor for convection development. The analysis of precipitation also exhibited a decrease during the end of July–August, which demonstrates the strong influence of the CLLJ on local rainfall regimes and local processes such as SB. There is no evidence of SB penetration into the Central Valley; in addition, the inland incursion (24 km from the coast) of SB worsened due to the influence of the CLLJ in July–August.
Comparison of wind observations for 11 July and 1 September 2004 over the study region with results from MM5v3 simulations, indicates that the model is able to simulate the development and movement of the SB along part of the GTRB. The main deficiencies are found in the model representation of the surface flow in the morning hours, particularly at the stations located closest to the coast. These differences may be the result of a poor time lag response of the model to actual early morning boundary layer temperature gradients between sea and land. The MM5v3 showed sensitivity to the selection of PBL parameterizations.The mean bias and MSE show that simulations using the local GS scheme provided a more realistic depiction of the 3-hourly 10 m wind than those using the non-local MRF approach. Nonetheless, the MM5v3 configurations used in this work resulted in overall overestimation (underestimation) of the wind magnitude relative to observations during 11 July 2004 (1 September 2004). This may be due to biases in the synoptic-scale wind from the driving reanalysis (ERA-Interim), misrepresentations of the local topography and the development of turbulent flow under complex terrain. In general, the basic characteristics of the observed vertical profiles of temperature and specific humidity are adequately captured by the model, with larger differences between 910 hPa and 700 hPa. These discrepancies between observations and simulations at the lower troposphere arise from errors in the representation of near-surface atmospheric conditions. For both simulated days, there is low-level negative, or easterly, zonal wind, in agreement with observations. The model sensitivity to the choice of physical configurations illustrates the need of performing more numerical experiments to better determine the model ability to represent mesoscale circulations such as SB. One alternative to improve the understanding of these large-scale and mesoscale interaction processes is using, as discussed by the authors of [67], the WRF model capability to represent large-eddy simulations in this dynamical problem.

Author Contributions

Conceptualization, N.M. and J.A.A.; methodology, N.M. and J.A.A.; software, N.M., T.M., and E.R.R.; validation, N.M., J.A.A., E.R.R., and T.M.; formal analysis, N.M. and J.A.A.; investigation, N.M.; data processing, N.M.; writing—original draft preparation, N.M., J.A.A., E.R.R., and T.M.; writing—review and editing, N.M., J.A.A., E.R.R., and T.M.; visualization, N.M.; supervision, N.M., J.A.A., E.R.R., and T.M.; project administration, N.M.; funding acquisition, J.A.A. All authors have read and agreed to the published version of the manuscript.

Funding

This work was partially funded by projects VI-805-B9-454 and VI-805-B8-604 from the Center for Geophysical Research of the University of Costa Rica and by Academia Nacional de Ciencias of Costa Rica.

Acknowledgments

CIGEFI-UCR provided logistic support during the data compilation and analysis process. The Ticosonde/NAME program was possible through support from the Earth Science Enterprise at NASA, the NOAA Office for Global Programs, the Instituto Meteorólogico Nacional (IMN), UCR (CIGEFI and School of Physics), Universidad Nacional (UNA), Centro Nacional de Alta Tecnología (CeNAT), and Comité Regional de Recursos Hidráulicos (CRRH). The authors would also like to thank M.Sc. Paula Pérez-Briceño for the preparation of Figure 1.

Conflicts of Interest

The authors declare no conflict of interest.

References

  1. Atkinson, B. Meso-Scale Atmospheric Circulations; Academic Press: London, UK, 1981; p. 496. [Google Scholar]
  2. Simpson, J. Sea Breeze and Local Winds; Cambridge University Press: Cambridge, UK, 1994; p. 234. [Google Scholar]
  3. Peña, M.; Douglas, M. Characteristics of Wet and Dry Spells over the Pacific Side of Central America during the Rainy Season. Mon. Weather Rev. 2002, 130, 3054–3073. [Google Scholar] [CrossRef]
  4. Westerberg, I.; Walther, A.; Guerrero, J.; Coello, Z.; Halldin, S.; Xu, C.; Chen, D.; Lundin, L. Precipitation data in a mountainous catchment in Honduras: Quality assessment and spatiotemporal characteristics. J. Theor. Appl. Clim. 2010, 101, 381–396. [Google Scholar] [CrossRef]
  5. Rapp, A.D.; Peterson, A.G.; Frauenfeld, O.W.; Quiring, S.M.; Roark, E.B. Climatology of Storm Characteristics in Costa Rica using the TRMM Precipitation Radar. J. Hydrometeorol. 2014, 15, 2615–2633. [Google Scholar] [CrossRef]
  6. Carrasco-Díaz, M.; Roque, A.; Sánchez-Montante, O.; Rivas, D. Local Breeze Effects on the Wind Energy Generation in the Northern Coast of Cuba. Wind Eng. 2011, 35, 635–648. [Google Scholar] [CrossRef]
  7. Muppa, S.K.; Anandan, V.K.; Kesarkar, K.A.; Rao, S.V.B.; Reddy, P.N. Study on deep inland penetration of sea breeze over complex terrain in the tropics. Atmos. Res. 2012, 104, 209–216. [Google Scholar] [CrossRef]
  8. Srinivas, C.; Venkatesan, R.; Somayaji, K.; Bagavath Singh, A. A numerical study of sea breeze circulation observed at a tropical site Kalpakkam on the east coast of India, under different synoptic flow situations. J. Earth Syst. Sci. 2006, 115, 557–574. [Google Scholar] [CrossRef]
  9. Srinivas, C.; Venkatesan, R.; Bagavath Singh, A. Sensitivity of mesoscale simulations of land–sea breeze to boundary layer turbulence parameterization. Atmos. Environ. 2007, 41, 2534–2548. [Google Scholar] [CrossRef]
  10. Rakesh, V.; Singh, R.; Joshi, P.C. Intercomparison of the performance of MM5/WRF with and without satellite data assimilation in short-range forecast applications over the Indian region. Meteorol. Atmos. Phys. 2009, 105, 133–155. [Google Scholar] [CrossRef]
  11. Pushpadas, D.; Vethamony, P.; Kotteppad, S.; Ratheesh, S.; Babu, M.; Balakrishnan Nair, T. Simulation of coastal winds along the central west coast of India using MM5 mesoscale model. Meteorol. Atmos. Phys. 2010, 109, 91–106. [Google Scholar] [CrossRef]
  12. Azorin-Molina, C.; Chen, D.; Tijm, S.; Baldi, M. A Multi-Year Study of Sea Breezes in a Mediterranean Coastal Site: Alicante (Spain). Int. J. Climatol. 2011, 31, 468–486. [Google Scholar] [CrossRef]
  13. Reddy, T.V.R.; Mehta, S.K.; Ananthavel, A.; Ali, S.; Annamalai, V.; Rao, D.N. Seasonal characteristics of sea breeze and thermal internal boundary layer over Indian east coast region. Meteorol. Atmos. Phys. 2020, 1–16. [Google Scholar] [CrossRef]
  14. Amador, J.A. A climatic feature of the tropical Americas: The trade wind easterly jet. Top. Meteorol. Oceanogr 1998, 5, 91–102. [Google Scholar]
  15. Amador, J.A. The Intra-Americas Sea Low-level Jet. Ann. N. Y. Acad. Sci. 2008, 1146, 153–188. [Google Scholar] [CrossRef] [PubMed] [Green Version]
  16. Higgins, W.; Ahijevych, D.; Amador, J.; Barros, A.; Berbery, E.H.; Caetano, E.; Carbone, R.; Ciesielski, P.; Cifelli, R.; Cortez-Vazquez, M.; et al. The NAME 2004 field campaign and modelling strategy. Bull. Am. Meteorol. Soc. 2006, 87, 79–94. [Google Scholar] [CrossRef]
  17. Sáenz, F.; Amador, J.A. Características del ciclo diurno de la precipitación en el Caribe de Costa Rica. Rev. Climatol. 2016, 16, 21–34. [Google Scholar]
  18. Schultz, D.M.; Bracken, W.E.; Bosart, L.F.; Hakim, G.J.; Bedrick, M.A.; Dickinson, M.J.; Tyle, K.R. The 1993 Superstorm Cold Surge: Frontal Structure, Gap Flow, and Tropical Impact. Mon. Weather Rev. 1997, 125, 5–39. [Google Scholar] [CrossRef] [Green Version]
  19. Schultz, D.M.; Bracken, W.E.; Bosart, L.F. Planetary- and Synoptic-Scale Signatures Associated with Central American Cold Surges. Mon. Weather Rev. 1998, 126, 5–27. [Google Scholar] [CrossRef]
  20. Durán-Quesada, A.M.; Gimeno, L.; Amador, J.; Nieto, R. Moisture sources for Central America: Identification of moisture sources using a Lagrangian analysis technique. J. Geophys. Res. 2010, 115, D05103. [Google Scholar] [CrossRef]
  21. Hidalgo, H.; Durán-Quesada, A.; Amador, J.A.; Alfaro, E. The Caribbean Low-Level Jet, the Inter-Tropical Convergence Zone and Precipitation Patterns in the Intra-Americas Sea: A Proposed Dynamical Mechanism. Geogr. Ann. Ser. Aphys. Geogr. 2015, 97, 41–59. [Google Scholar] [CrossRef]
  22. Wang, C.; Enfield, D. The Tropical Western Hemisphere Warm Pool. Geophys. Res. Lett. 2001, 28, 1635–1638. [Google Scholar] [CrossRef]
  23. Wang, C.; Enfield, D. A Further Study of the Tropical Western Hemisphere Warm Pool. J. Clim. 2003, 16, 1476–1493. [Google Scholar] [CrossRef] [Green Version]
  24. Ramírez, P. Estudio Meteorológico de los Veranillos en Costa Rica; Nota de investigación # 5; Instituto Meteorológico Nacional y Ministerio de Agricultura y Ganadería: San José, Costa Rica, 1983.
  25. Magaña, V.; Amador, J.A.; Medina, S. The Midsummer Drought over Mexico and Central America. J. Clim. 1999, 12, 1577–1588. [Google Scholar] [CrossRef]
  26. Alfaro, E. Caracterización del “veranillo” en dos cuencas de la vertiente del Pacífico de Costa Rica, América Central. Rev. Biol. Trop. 2015, 62, 1–15. [Google Scholar] [CrossRef] [Green Version]
  27. Herrera, E.; Magaña, V.; Caetano, E. Air-sea interactions and dynamical processes associated with the midsummer drought. Int. J. Clim. 2015, 35, 1569–1578. [Google Scholar] [CrossRef]
  28. Maldonado, T.; Rutgersson, A.; Alfaro, E.; Amador, J.A.; Claremar, B. Interannual variability of the midsummer drought in Central America and the connection with sea surface temperatures. Adv. Geosci. 2016, 42, 35–50. [Google Scholar] [CrossRef] [Green Version]
  29. García-Martínez, I.; Bollasina, M. Sub-monthly evolution of the Caribbean Low-Level Jet and its relationship with regional precipitation and atmospheric circulation. Clim. Dyn. 2020, 54, 4423–4440. [Google Scholar] [CrossRef] [Green Version]
  30. Amador, J.A.; Chacón, R.; Laporte, S. Climate and Climate Variability in the Arenal River Basin of Costa Rica. In Climate and Water: Trans-Boundary Challenges in the Americas; Diaz, H.F., Morehouse, B., Eds.; Kluwer Academic Publishers: Dordrecht, The Netherlands, 2003; Volume 16, pp. 317–349. [Google Scholar] [CrossRef] [Green Version]
  31. Amador, J.A.; Alfaro, E.; Lizano, O.; Magaña, V. Atmospheric forcing of the eastern tropical Pacific: A review. Prog. Oceanogr. 2006, 69, 101–142. [Google Scholar] [CrossRef]
  32. Amador, J.A.; Alfaro, E.; Rivera, E.; Calderón, B. Climatic Features and Their Relationship with Tropical Cyclones Over the Intra-Americas Seas. In Hurricanes and Climate Change; Elsner, J.B., Hodges, R., Malmstadt, J., Scheitlin, K., Eds.; Springer: New York, NY, USA, 2010; Volume 2, pp. 149–173. [Google Scholar] [CrossRef]
  33. Alfaro, E. Some Characteristics of the Precipitation Annual Cycle in Central America And their Relationships with its Surrounding Tropical Oceans. Top. Meteorol. Oceanogr. 2002, 7, 88–103. [Google Scholar]
  34. Maldonado, T.; Alfaro, E.; Hidalgo, H. A Revision of the main drivers and variability of Central America Climate and seasonal forecast systems. Rev. Biol. Trop. 2018, 66, S153–S175. [Google Scholar] [CrossRef] [Green Version]
  35. Alfaro, E.; Amador, J.A. El Niño-Oscilación del sur y algunas series de temperatura máxima y brillo solar en Costa Rica. Top. Meteorol. Oceanogr. 1996, 3, 19–26. [Google Scholar]
  36. Alfaro, E.; Amador, J.A. Variabilidad y cambio climático en algunos parámetros sobre Costa Rica y su relación con fenómenos de escala sinóptica y planetaria. Top. Meteorol. Oceanogr. 1997, 4, 51–62. [Google Scholar]
  37. Amador, J.A.; Alfaro, E. La Oscilación Cuasi-bienal, ENOS y acoplamiento de algunos parámetros superficiales y estratosféricos sobre Costa Rica. Top. Meteorol. Oceanogr. 1996, 3, 45–53. [Google Scholar]
  38. Fernández, W.; Ramírez, P. El Niño, la Oscilación del Sur y sus efectos en Costa Rica: Una revisión. Tecnol. Marcha 1991, 11, 3–10. [Google Scholar]
  39. Mantua, N.; Hare, S. The Pacific Decadal Oscillation. J. Oceanogr. 2002, 58, 35–44. [Google Scholar] [CrossRef]
  40. Fallas-López, B.; Alfaro, E. Uso de herramientas estadísticas para la predicción estacional del campo de precipitación en América Central como apoyo a los Foros Climáticos Regionales. 1: Análisis de tablas de contingencia. Rev. Climatol. 2012, 12, 61–80. [Google Scholar]
  41. Maldonado, T.; Alfaro, E.; Fallas López, B.; Alvarado, L. Seasonal prediction of extreme precipitation events and frequency of rainy days over Costa Rica, Central America, using Canonical Correlation Analysis. Adv. Geosci. 2013, 33, 41–52. [Google Scholar] [CrossRef] [Green Version]
  42. Grell, G.; Dudhia, J.; Stauffer, D.R. A Description of the Fifth-Generation Penn State/NCAR Mesoscale Model (MM5); NCAR Technical Note 398 STR; National Center for Atmospheric Research: Boulder, CO, USA, 1994. [Google Scholar]
  43. Dee, D.; Uppala, S.; Simmons, A.; Berrisford, P.; Poli, P.; Kobayashi, S.; Andrae, U.; Balmaseda, M.; Balsamo, G.; Bauer, P.; et al. The ERA-Interim reanalysis: Configuration and performance of the data assimilation system. Q. J. R. Meteorol. Soc. 2011, 137, 553–597. [Google Scholar] [CrossRef]
  44. Liu, Y.; Warner, T. Comparison of the real time WRF and MM5 forecasts for the US army test ranges. In Proceedings of the 5th WRF/14th MM5 Users’ Workshop, Boulder, CO, USA, 22–25 June 2004. [Google Scholar]
  45. Deng, A.; Stauffer, D.R.; Zielonka, J.R.; Hunter, G.K. A Comparison of High-Resolution Mesoscale Forecasts using MM5 and WRF-ARW. In Proceedings of the 8th WRF Users’ Workshop, Boulder, CO, USA, 11–15 June 2007. [Google Scholar]
  46. Zielonka, J.; Gaudet, B.; Seaman, N.; Stauffer, D.; Deng, A.; Hunter, G. WRF and MM5 Real Time Systems: Statistical comparisons using the Model Evaluation Toolkit (MET). In Proceedings of the 9th WRF Users’ Workshop, Boulder, CO, USA, 23–27 June 2008. [Google Scholar]
  47. Wilmot, C.; Rappenglück, B.; Li, X. MM5 v3.6.1 and WRF v3.2.1 model comparison of standard and surface energy variables in the development of the planetary boundary layer. Geosci. Model Dev. 2014, 7, 2693–2707. [Google Scholar] [CrossRef] [Green Version]
  48. Rivera, E.; Amador, J. Predicción estacional del clima en Centroamérica mediante la reducción de escala dinámica. Parte II: Aplicación del modelo MM5V3. Rev. Mat. Teor. Apl. 2009, 16, 76–104. [Google Scholar] [CrossRef] [Green Version]
  49. Sáenz, F. El Ciclo Diurno de la Precipitación en el Caribe de Costa Rica: Observaciones y Simulaciones con un Modelo Dinámico Regional. Bachelor’s Thesis, Universidad de Costa Rica, San José, Costa Rica, 2014. [Google Scholar]
  50. Phadnis, M.; Robe, F.; Klausmann, A.; Scire, J. Importance of the spatial resolution of sea-surface-temperature data in meteorological modeling. In Proceedings of the 13th PSU/NCAR Mesoscale Model User’s Workshop, Boulder, CO, USA, 11 June 2003. [Google Scholar]
  51. Hong, S.Y.; Pan, H.L. Nonlocal Boundary Layer Vertical Diffusion in a Medium-Range Forecast Model. Mon. Weather Rev. 1996, 124, 2322–2339. [Google Scholar] [CrossRef] [Green Version]
  52. Dudhia, J. A Nonhydrostatic Version of the Penn State–NCAR Mesoscale Model: Validation Tests and Simulation of an Atlantic Cyclone and Cold Front. Mon. Weather Rev. 1993, 121, 1493–1513. [Google Scholar] [CrossRef] [Green Version]
  53. Grell, G.A. Prognostic Evaluation of Assumptions Used by Cumulus Parameterizations. Mon. Weather Rev. 1993, 121, 764–787. [Google Scholar] [CrossRef] [Green Version]
  54. Shafran, P.; Seaman, N.; Gayno, G. Evaluation of Numerical Predictions of Boundary Layer Structure during the Lake Michigan Ozone Study. J. Appl. Meteorol. 2000, 39, 412–426. [Google Scholar] [CrossRef]
  55. Kain, J.; Fritsch, J. A one-dimension al entraining/detraining plume model and its application in convective parameterization. J. Atmos. Sci. 1990, 47, 2784–2802. [Google Scholar] [CrossRef] [Green Version]
  56. Zhong, S.; In, H.; Clements, C. Impact of turbulence, land surface, and radiation parameterizations on simulated boundary layer properties in a coastal environment. J. Geophys. Res. 2007, 112, D13110. [Google Scholar] [CrossRef] [Green Version]
  57. Pearce, R.P. The calculation of a sea-breeze circulation in terms of the differential heating across the coastline. Q. J. R. Meteorol. Soc. 1955, 81, 351–381. [Google Scholar] [CrossRef]
  58. Schmidt, F.H. An elementary theory of the land and sea breeze circulation. J. Meteorol. 1947, 4, 9–20. [Google Scholar] [CrossRef]
  59. Oliphant, A.J.; Sturman, A.P.; Tapper, N.J. The evolution and structure of a tropical island sea/land-breeze system, northern Australia. Meteorol. Atmos. Phys. 2001, 78, 45–59. [Google Scholar] [CrossRef]
  60. Hastenrath, S.L. Rainfall Distribution and Regime in Central America. Arch. Met. Geoph. Biokl. B 1967, 15, 201–241. [Google Scholar] [CrossRef]
  61. Mendizábal, T. Distribución de la Precipitación con la Altura. Bachelor’s Thesis, Universidad de Costa Rica, San José, Costa Rica, 1973. [Google Scholar]
  62. Fernández, W.; Chacón, R.; José, M. On the rainfall distribution with altitude over Costa Rica. Rev. Geof. 1996, 44, 55–72. [Google Scholar]
  63. Zárate, E. Comportamiento del Viento en Costa Rica; Nota de Investigación # 2; Instituto Meteorológico Nacional: San José, Costa Rica, 1978. [Google Scholar]
  64. Muñoz, A.; Fernández, W.; Gutiérrez, J.A.; Zárate, E. Distribución horaria de la magnitud del viento en Costa Rica. Top. Meteorol. Oceanogr. 2002, 9, 14–28. [Google Scholar]
  65. Cook, K.H.; Vizy, E.K. Hydrodynamics of the Caribbean Low-Level Jet and Its Relationship to Precipitation. J. Clim. 2010, 23, 1477–1494. [Google Scholar] [CrossRef]
  66. Beven, J., II. Tropical Cyclone Report (AL062004), Hurricane Frances, 25 August–8 September 2004; Technical Report; National Hurricane Center: Miami, FL, USA, 2005. [Google Scholar]
  67. Liu, Y.; Liu, Y.; Muñoz-Esparza, D.; Hu, F.; Yan, C.; Miao, S. Simulation of Flow Fields in Complex Terrain with WRF-LES: Sensitivity Assessment of Different PBL Treatments. J. Appl. Meteorol. Climatol. 2020, 59, 1481–1501. [Google Scholar] [CrossRef]
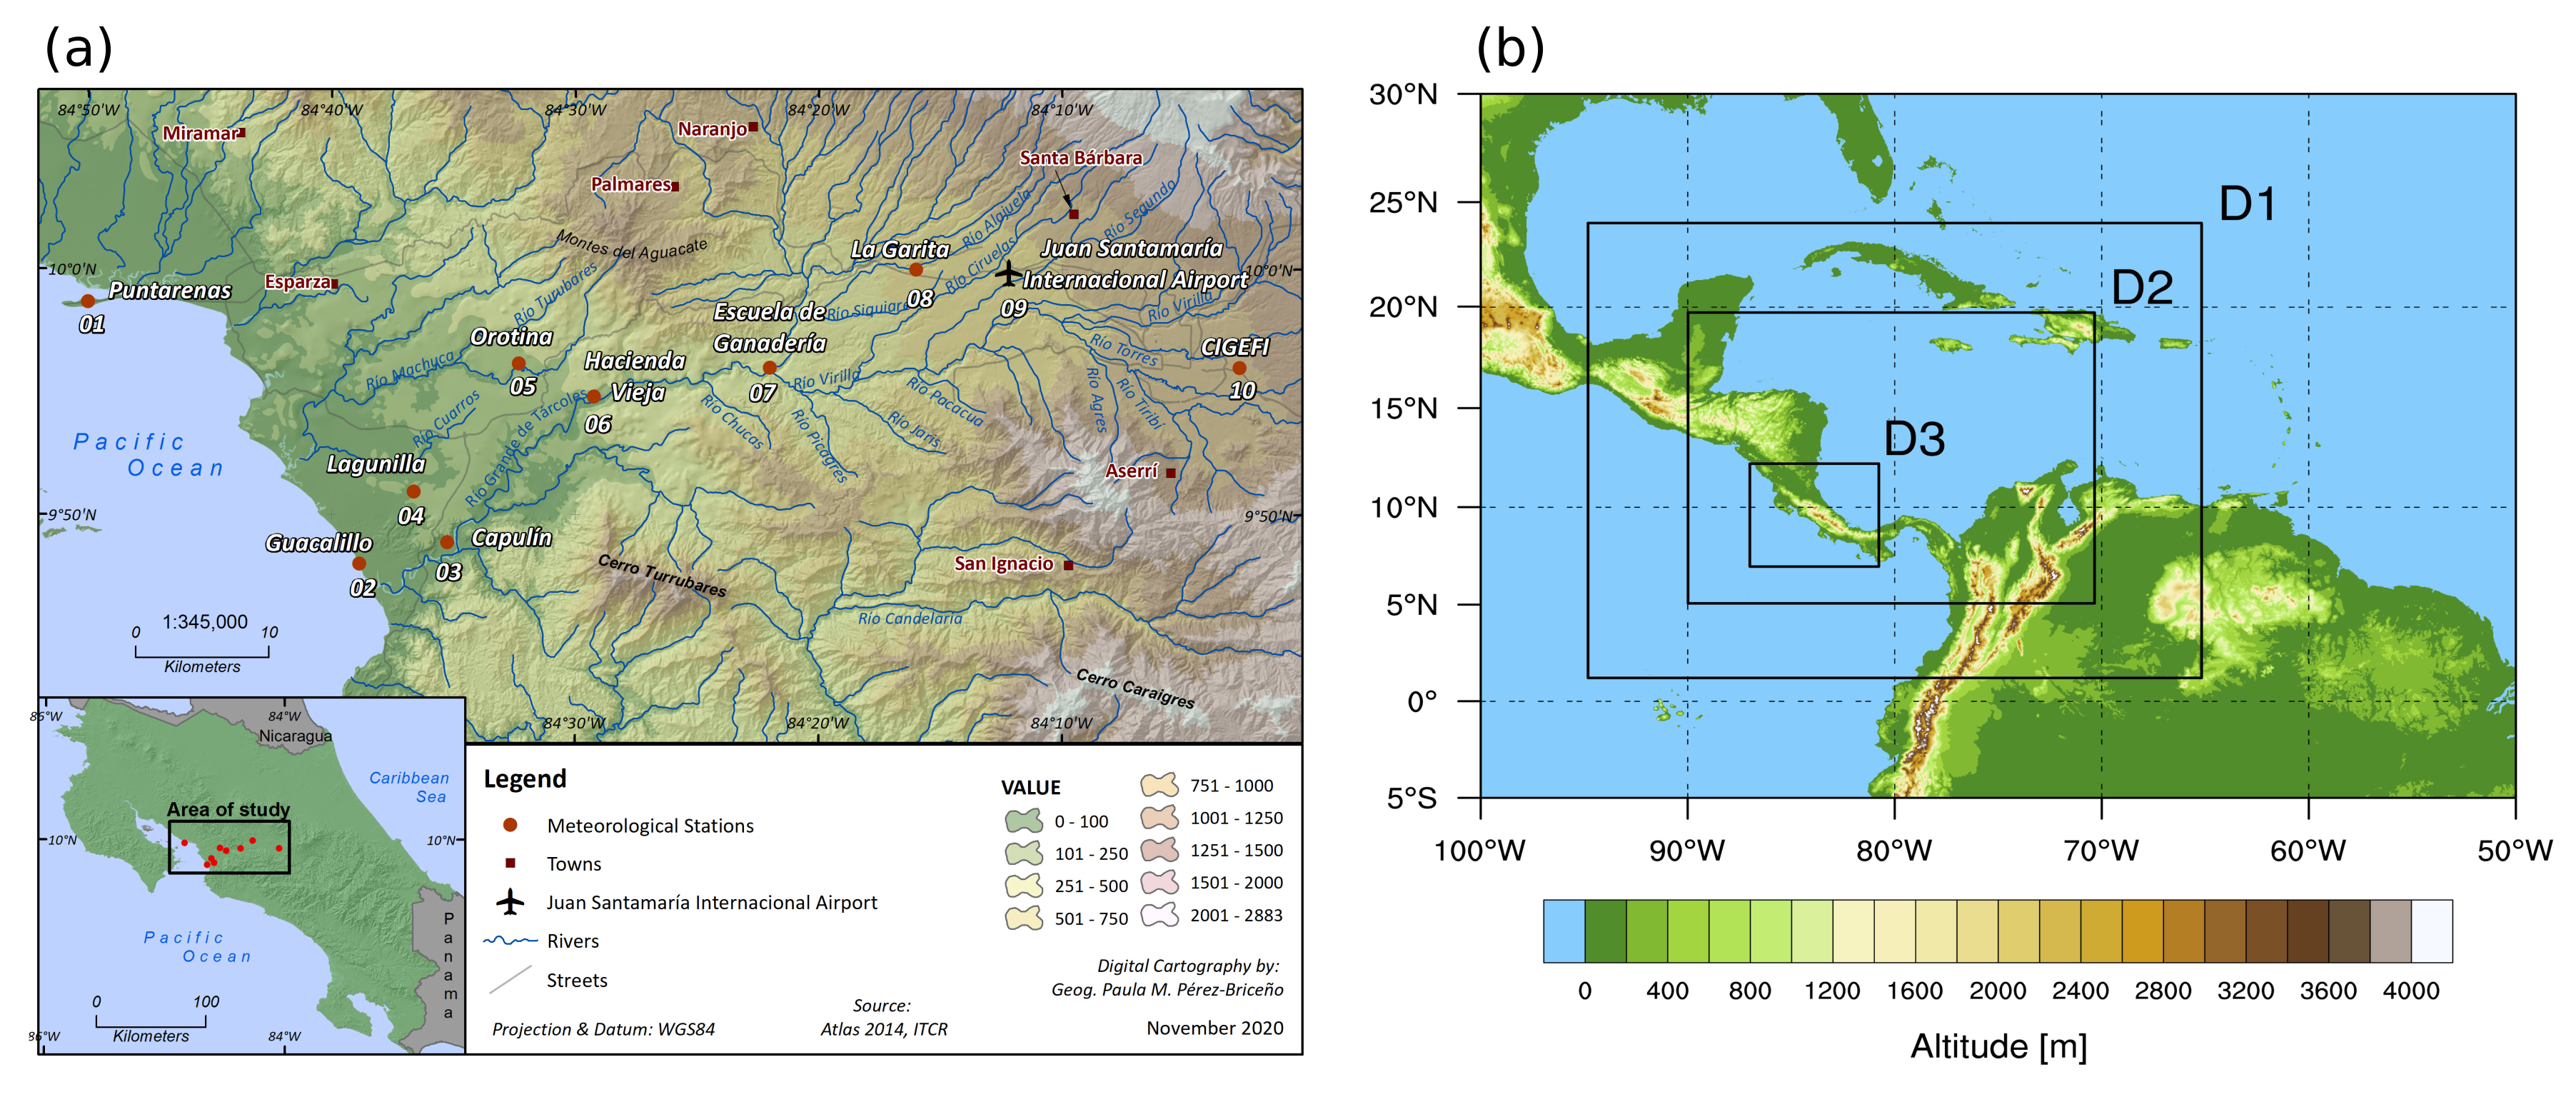
Figure 1. (a) Topographical map of the Grande de Tárcoles river basin. Red markers show the location of the meteorological stations used in this study. The numbers correspond to the station identifiers in Table 1. (b) The MM5v3 domain configuration. D1, D2, and D3 correspond to 27, 9, and 3 km grids, respectively.
Atmosphere 11 01333 g001
Figure 2. Hourly mean temperature anomalies ( C) with respect to daily mean (right axis; the red, vertical dashed line represents the hour of maximum temperature) and total hourly precipitation (mm) distribution (left axis) for (a) Puntarenas, (b) Guacalillo, (c) Capulín, (d) Lagunilla, (e) Orotina, (f) Hacienda Vieja, (g) Escuela de Ganadería, (h) La Garita, (i) JSIA, and (j) CIGEFI. Panel (k) shows the total precipitation (mm; left axis) at each station as a function of altitude (m; right axis and solid black line).
Atmosphere 11 01333 g002
Figure 3. Hourly distribution of the surface wind (m s 1 ) during the period 1 July 2004–16 September 2004 for (a) Puntarenas, (b) Guacalillo, (c) Capulín, (d) Lagunilla, (e) Orotina, (f) Hacienda Vieja, (g) Escuela de Ganadería, (h) La Garita, (i) JSIA, and (j) CIGEFI.
Atmosphere 11 01333 g003
Figure 4. Wind (m s 1 ) at 925 hPa for 11 July 2004 and 1 September 2004 at 06:00 LST as simulated by MM5v3 (D1 domain) using GrMRF (a,c) and KFGS (b,d).
Atmosphere 11 01333 g004
Figure 5. Simulated (GrMRF, D3) 10-m wind (m s 1 ) for 11 July 2004 and 1 September 2004 at 00:00 LST (a,e), 06:00 LST (b,f), 12:00 LST (c,g), and 18:00 LST (d,h). The circles denote the location of the meteorological stations used in this study. LST: Local Solar Time.
Atmosphere 11 01333 g005
Figure 6. Observed (blue arrows) and D3 simulated (GrMRF and KFGS; red arrows) 10-m wind vectors (m s 1 ) for 11 July 2004 at 03:00 LST (a,h), 06:00 LST (b,i), 09:00 LST (c,j), 12:00 LST (d,k), 15:00 LST (e,l), 18:00 LST (f,m), and 21:00 LST (g,n). LST: Local Solar Time.
Atmosphere 11 01333 g006
Figure 7. Daily mean vertical profiles of temperature ( C; red lines) and specific humidity (g kg 1 ; green lines) (a,c) and zonal wind (m s 1 ) (b,d) for 11 July and 1 September 2004, respectively. Solid lines represent radiosonde data, while the GrMRF (KFGS) D3 simulation data minus observations are shown with dashed lines (dotted lines with square markers).
Atmosphere 11 01333 g007
Figure 8. Observed (blue arrows) and D3 simulated (GrMRF and KFGS; red arrows) 10 m wind vectors (m s 1 ) for 1 September 2004 at 03:00 LST (a,h), 06:00 LST (b,i), 09:00 LST (c,j), 12:00 LST (d,k), 15:00 LST (e,l), 18:00 LST (f,m), and 21:00 LST (g,n). LST: Local Solar Time.
Atmosphere 11 01333 g008
Table 1. List of stations according to Figure 1a, their locations, altitude, and percentage of missing data. CS: Campbell Scientific, D: Davis.
StationStationLatitudeLongitudAltitudeMissingInstrument
NumberName (m)DataType
1Puntarenas9.93−84.77321.3CS
2Guacalillo9.80−84.652417.7D
3Capulin9.81−84.59702.8D
4Lagunilla9.85−84.6117211.7CS
5Orotina9.94−84.541855.8CS
6Hacienda Vieja9.91−84.492801.8CS
7Escuela Ganadería9.93−84.374500CS
8La Garita10.00−84.277602.9CS
9JSIA9.99−84.219210CS
10CIGEFI9.94−84.0512493.5CS
Table 2. Performance of GrMRF and KFGS in simulating the 3-hourly surface wind speed at each station during 11 July 2004 and 1 September 2004. The last row corresponds to the overall mean performance of the experiments. Bold numbers indicate the simulation with the smallest mean bias (m s 1 ) and MSE (m 2 s 2 ). N/A: observations not available.
11 July 20041 September 2004
GrMRFKFGSGrMRFKFGS
Station NumberBiasMSEBiasMSEBiasMSEBiasMSE
1N/AN/AN/AN/A0.142.520.442.16
21.312.841.304.350.684.731.096.04
31.022.100.883.560.632.900.471.45
40.811.610.743.340.313.960.451.94
50.851.290.310.88−0.111.600.051.64
61.263.520.450.470.052.550.011.42
72.607.811.254.480.451.830.331.00
82.187.050.420.790.501.730.182.81
91.089.450.679.102.038.80−2.6110.70
100.572.920.933.59−1.733.431.252.93
Overall1.173.860.703.06−0.143.410.103.21
Publisher’s Note: MDPI stays neutral with regard to jurisdictional claims in published maps and institutional affiliations.