Article

A Landscape Study of Sediment Formation and Transport in the Urban Environment

Institute of Industrial Ecology UB RAS, 620219 Ekaterinburg, Russia
*
Author to whom correspondence should be addressed.
Atmosphere 2020, 11(12), 1320; https://doi.org/10.3390/atmos11121320
Submission received: 27 October 2020 / Revised: 1 December 2020 / Accepted: 1 December 2020 / Published: 6 December 2020

Abstract

:
Background: Sediment deposition in the urban environment affects aesthetic, economic, and other aspects of city life, and through re-suspension of dust, may pose serious risks to human health. Proper environmental management requires further understanding of natural and anthropogenic factors influencing the sedimentation processes in urbanized catchments. To fill the gaps in the knowledge about the relationship between the urban landscape and sedimentation, field landscape surveys were conducted in the residential areas of the Russian cities of Ekaterinburg, Nizhniy Novgorod, Rostov-on-Don, Tyumen, Chelyabinsk, and Murmansk. Methods: In each city, six elementary urban residential landscapes were chosen in blocks of multi-story apartment buildings typical for Russian cities. The method of landscape survey involved delineating functional segments within the elementary landscapes and describing each segment according to the developed procedure during a field survey. Results: The complexity of sedimentation processes in the urban environment was demonstrated. The following main groups of factors have significant impacts on sediment formation and transport in residential areas in Russian cities: low adaptation of infrastructure to a high density of automobiles, poor municipal services, and bad urban environmental management in the course of construction and earthworks. Conclusion: A high sediment formation potential was found for a considerable portion of residential areas.

1. Introduction

A growing proportion of the planet’s population now resides in urban areas, and urbanization has become one of the key drivers of environmental processes in the Anthropocene [1,2,3]. Further enlargement of cities and urban agglomerations has been a significant trend in recent decades [4]. Geochemical transformation in the urban environment consists of modifications to the mineral and elemental composition and physicochemical properties of the urban soil [5,6,7], changes in the volume of the surface stormwater runoff [8], redistribution of pollutants [9,10], and forming geochemical barriers [11,12], among others. Given the complex interactions of nature, people, and the technosphere in cities, the development of a scientific basis for urban environmental management is a priority for humanity at the present stage of global development. Proper management of cities should ensure that they are ecologically, economically, and socially more sustainable places to live in the future [13,14].
Studies conducted in different regions demonstrated that contemporary sedimentation processes play a significant role in shaping the urban environment. Unlike natural landscapes, an intense anthropogenic impact on exposed surfaces supplies significant amounts of sedimentary material in the urban environment. As a result, the typical yield of sedimentation material in urban watersheds exceeds the rate of this process in natural and agricultural landscapes by an order of magnitude [15,16].
Due to their own physicochemical characteristics and the ability to carry various organic and inorganic toxicants, sediments deposited in streets and roads are characterized as a non-point source of pollution. Sediment deposition in urban areas has received considerable attention in recent years due to the ease of sampling of sediment material, and its potential to act as a proxy for urban pollution and an indicator of emissions of potentially harmful elements [17,18]. Many authors have noted elevated concentrations of heavy metals in road and sidewalk sediment [19,20,21]. Recently, contamination with microplastics [22] and organic compounds [23] was observed in urban wetland sediment samples.
The urban sedimentary system is a significant part of global waste and pollution transport, thereby changing the chemical composition and mineral content of streams, rivers, seas, and oceans [24,25,26].
Re-suspension of road dust by the wind or traffic-induced turbulence is an important source contributing to particulate atmospheric pollution [27,28]. Various pollutants present in urban sediment and suspended PM may pose serious risks to human health. Exposure to PM has been linked to increased mortality, and a wide range of diseases in several organ systems—in particular, cardiovascular and pulmonary diseases [29,30,31].
Particles of biological origin may be suspended in the air as attached to dust particles [32,33]. Evidence for the potential environmental sources of bacterial and viral species associated with airborne PM was provided in microbiome surveys in Beijing [34]. Acosta-Martínez et al. [35] reviewed studies of the microbial characteristics of wind-eroded sediments and distinguished microorganisms predominant in dust-sized sediment prone to removal by longer-range suspended transport and those more likely to be locally redistributed by saltation flux. Gardner et al. [36] suggested that dust-borne microorganisms can only affect human health if a combination of factors coincides with pathogenesis—in particular, inhalation of a substantial amount of dust occurs. Human exposure to environmental microbiota, including potentially opportunistic microbes carried indoors by dirt attached to shoes, was demonstrated in Finland [37].
Hong et al. [38] independently studied health effects of PM2.5 (combination of biomass smoke, industrial emissions, and vehicular exhaust gas) and PM10–2.5 (combination of sea salt, fugitive agricultural emissions, windblown crustal dust, and road dust) in British Columbia, Canada, and found statistically significant associations between the coarse fraction and non-accidental mortality during the spring season. Hong et al. [38] concluded that springtime road dust is of particular interest for health risk assessment in colder climates where snow can collect materials over the winter months.
Besides the health effects, sediment deposition in the urban environment affects aesthetic, economic, and other aspects of city life. Sedimentation is accompanied by the accumulation of dirt and dust over the urban surfaces, which reduce the quality of the urban environment. A high level of sediment accumulation in the urban landscape causes a negative perception of the environment by citizens. The negative aesthetic effects include the deterioration of the appearance of residential areas and objects of the urban landscape, buildings, vehicles, etc. Regular sediment supply increases costs for municipal services such as cleaning and stormwater system maintenance [11,39,40,41]. Siltation of stormwater systems, compaction of urban soils, lower fertility of the topsoil, etc., affect the urban infrastructure [10,42,43]. The accumulation of solid substances on street and sidewalks increases the wear and tear of vehicles, clothes, and shoes [44,45]. As dust deposits on insulators, pollution control is required to prevent electricity line outages [46].
In natural and agricultural systems, sedimentation starts with the detachment of soil particles due to soil erosion caused by wind, rainfall, and water flow. The rate of soil erosion is strongly dependent upon soil type, vegetation, and such topographic characteristics as slope, land use, etc. [35,47]. Part of eroded soil is deposited in different sub-areas of a catchment before it reaches the catchment outlet [47,48,49]. Sediment storage in catchments causes a discrepancy between estimates of catchment sediment erosion and sediment yield [48,50]. Sediment budget and the ratio of sediment yield to total surface erosion (sediment delivery ratio) characterize catchment sediment cascades [49,50,51]. Quantification of the sedimentary cascade, including the internal dynamics of sediment supply, transport, and storage in various catchments, may be performed through analysis of sediment connectivity between different landscape compartments, which has become a key interdisciplinary concept in the study of processes acting both in natural and human-impacted hydro-geomorphic systems [8,51,52,53]. As sediment connectivity is hardly measurable, indices and classification schemes (high/moderate/low) have been proposed for the investigation of connectivity drivers [51,53]. Study of connectivity within a catchment may be performed by means of a field survey of erosion, transport, and deposition signs that can be visually observed (rills, local deposits, splash pedestals, flow lines, etc.) [54].
Some specific factors have to be considered in studies of erosion, sedimentation, and anthropogenic-derived sediment deposition in urban environments [11,44]. The sources of nearly all sediments in urban areas are engineering materials and urban soils exposed to erosion [44]. Large proportions of urban areas are fully protected by the impermeable cap provided by buildings, roads, and other structures [44]. Runoff from impervious onto pervious surfaces produces concentrated flow paths and increases lateral connectivity in the urban landscape [8,41]. Urban pervious surfaces are potentially more erodible than is natural due to concentrated runoff, bare soil (e.g., construction and landscaping), and unstable slope conditions (e.g., earthworks) [12,55]. Construction is considered as a major source of sediment supply in the urban environment [56,57]. Accelerated erosion due to construction-related activities was observed in Korea [58], China [59], the USA [57,60], Brazil [61], and other countries. Mechanical sediment removal (extraction) by human activity (street sweeping, cleaning out of the stormwater network, sediment control at construction sites, etc.) is another specific feature of the urbanized landscape [60,62,63]. Comparing the urban sediment budget and natural catchment conditions, Russel et al. [41] concluded that urban catchments have specific extraction fluxes, higher hillslope erosion, less storage, and higher transport capacities than natural sediment cascades. Generally, sediment yields in urban catchments increase by an order of magnitude in a period of development and then remain higher than in natural and agricultural landscapes [16].
Historically, such terms as “street dirt,” “street dust,” “road dust,” and “road deposited sediment” were used to define urban sediment as an object to control or study in different situations. The term “street dirt” was used in the context of street cleaning [62]. The term “road dust” implies fine, fugitive, and respirable material and can be applied in studies of dust suspended in the air [64]. However, this term is not appropriate for urban sediment that has shown to be composed of a full range of particle sizes [11,65]. Road-deposited sediment has become an important environmental sampling medium for assessing anthropogenic metal levels [19,66]. The term “urban sediment” refers to urban environmental sedimentology and it is applied in a broader manner to mean any sediments present within the urban environment [11,18].
The urban environment is considered as a separate landscape type that has been formed as a result of human activities and further develops under the influences of natural, human, and socio-cultural factors. The urban landscape accommodates natural (biotic and abiotic) and artificial components, such as buildings, engineering, and transport structures. The study of landscape heterogeneity was shown to be beneficial to evaluate various natural and anthropogenic processes in the urban areas, e.g., PM pollution [67,68], biodiversity [69,70], heat island effect [71], social behavior [69,72], and ecosystem services [73]. Like other urban-related processes, sediment formation, transport, and surface deposition are closely linked to landscape properties such as geomorphology, landscape connectivity, land cover, and land use [47,50,51,52,74,75].
The intrinsic heterogeneity of urban landscapes has been taken into account only in a few studies of the urban sediment. Russell et al. [76] considered the following land cover categories within the urban and sub-urban catchments in Melbourne: roofs, impervious areas, grass surfaces, gravel surfaces, and areas with low sediment connectivity. Land cover mapping for nine street-scale stormwater catchments (average area about 1700 m2) was undertaken, using aerial imagery and field inspection. In the study based on the coarse-grained sediment sampling, it was obtained that most of the sediment was supplied by impervious surfaces and small-scale construction areas [12]. Construction sites and unpaved roads were identified as two major contributors to fugitive dust emission in Nanjing, China [77]. In Stockholm, Sweden, the dust load varies between streets and is dependent on pavement surface properties [64]. A study of the peri-urban catchment in Coimbra, Portugal pointed out that most of the catchment sediment is derived from small parts of the catchment subject to the constructional activity or active landscape change [78].
To summarize, we can say that a comprehensive understanding of the complex interactions of natural and anthropogenic factors in the sedimentation processes in heterogeneous urbanized catchments has not yet been achieved. In particular, it is important to analyze different parts of the urban landscape as potential sources and sinks of urban sediment, to estimate the total value and variability of urban sediment deposition over residential areas, to assess large-scale sediment connectivity, to reveal anthropogenic factors specific in different regions, etc. The aim of this study is to fill the gaps in the knowledge about the relationship between the urban landscape and sedimentation processes. The factors influencing the processes of sediment supply, its further wash off, sediment migration, and the accumulation of urban sediment in residential areas were qualitatively studied by means of landscape surveys in large Russian cities. The novelty of this research is associated with the potential to reveal significant micro-landscape characteristics and factors by applying high spatial resolution field study.

2. Experiments

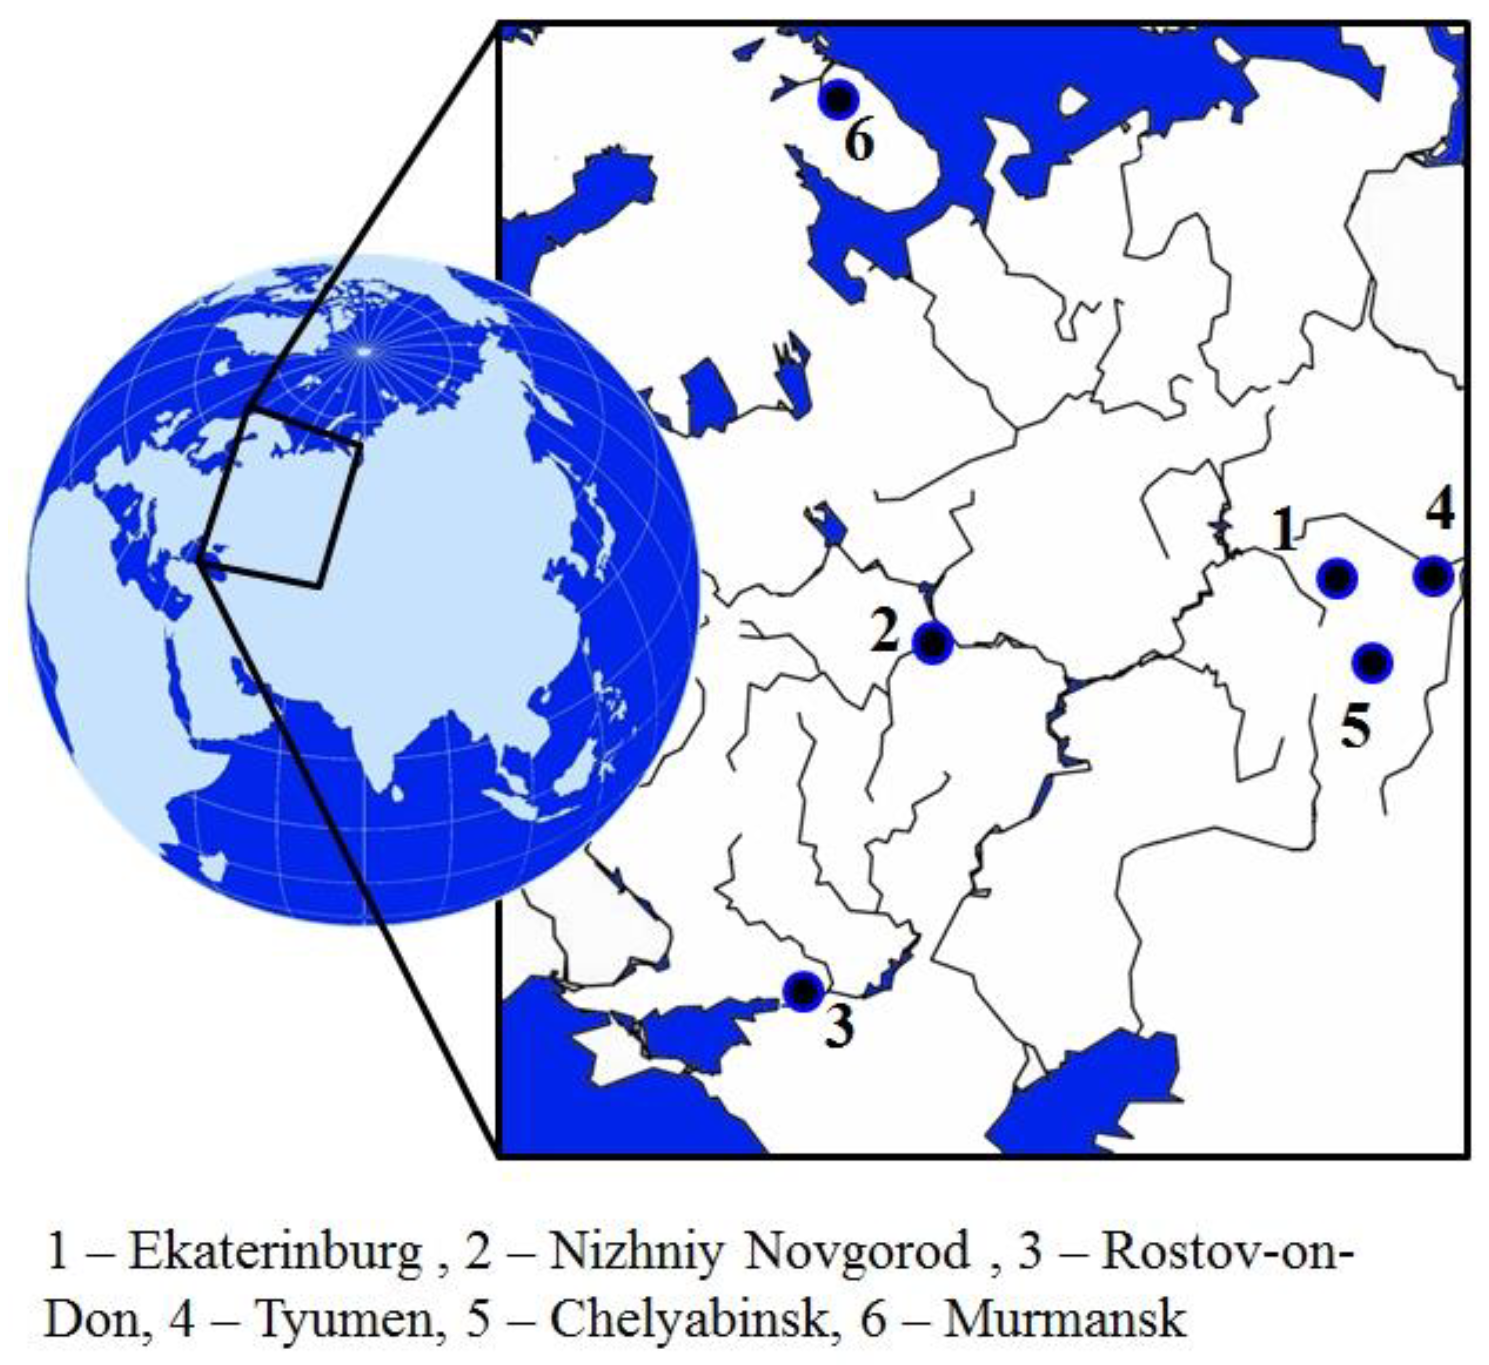
2.1. Descriptions of the Studied Cities

The study was conducted in six Russian cities located in different climatic and geographical zones (Table 1 and Figure 1). The southernmost city was Rostov-on-Don (47°14′ N); the northernmost was Murmansk (68°58′ N). The average January and July temperatures in the surveyed cities range from −15 to −3 and from 12.8 to 23.4 °C, respectively. Of the six cities surveyed, four have populations of more than 1 million people. The most populated is Ekaterinburg (about 1.5 million people), while 0.3 million people live in the least populated, Murmansk. All the cities are the administrative centers of their regions and play significant socio-economic roles. Ekaterinburg, Chelyabinsk, Nizhniy Novgorod, and Rostov-on-Don are major centers of industry, transport, and engineering. In Murmansk, the main economic focus is associated with the seaport (ship repair, fishing, fish processing); Tyumen is largely oriented towards oil refining. Three cities lie in the valleys of large rivers (Nizhniy Novgorod, Rostov-on-Don, and Tyumen), two cities (Ekaterinburg and Chelyabinsk) are located in the foothills of the Ural Mountains, and one city (Murmansk) occupies hills along a sea bay.
The municipalities’ budgets for the year 2018 ranged from 26.5 to 46.2 thousand rubles (approximately 400–750 USD) per citizen. The relatively large size of the city budget of Murmansk is due to its location in the Arctic region and high transport expenses. Among the other cities, the largest budget in 2018 was in the city of Tyumen, whose economy is related to the oil and gas industry. In other cities, the per capita budget was 20–30% less.

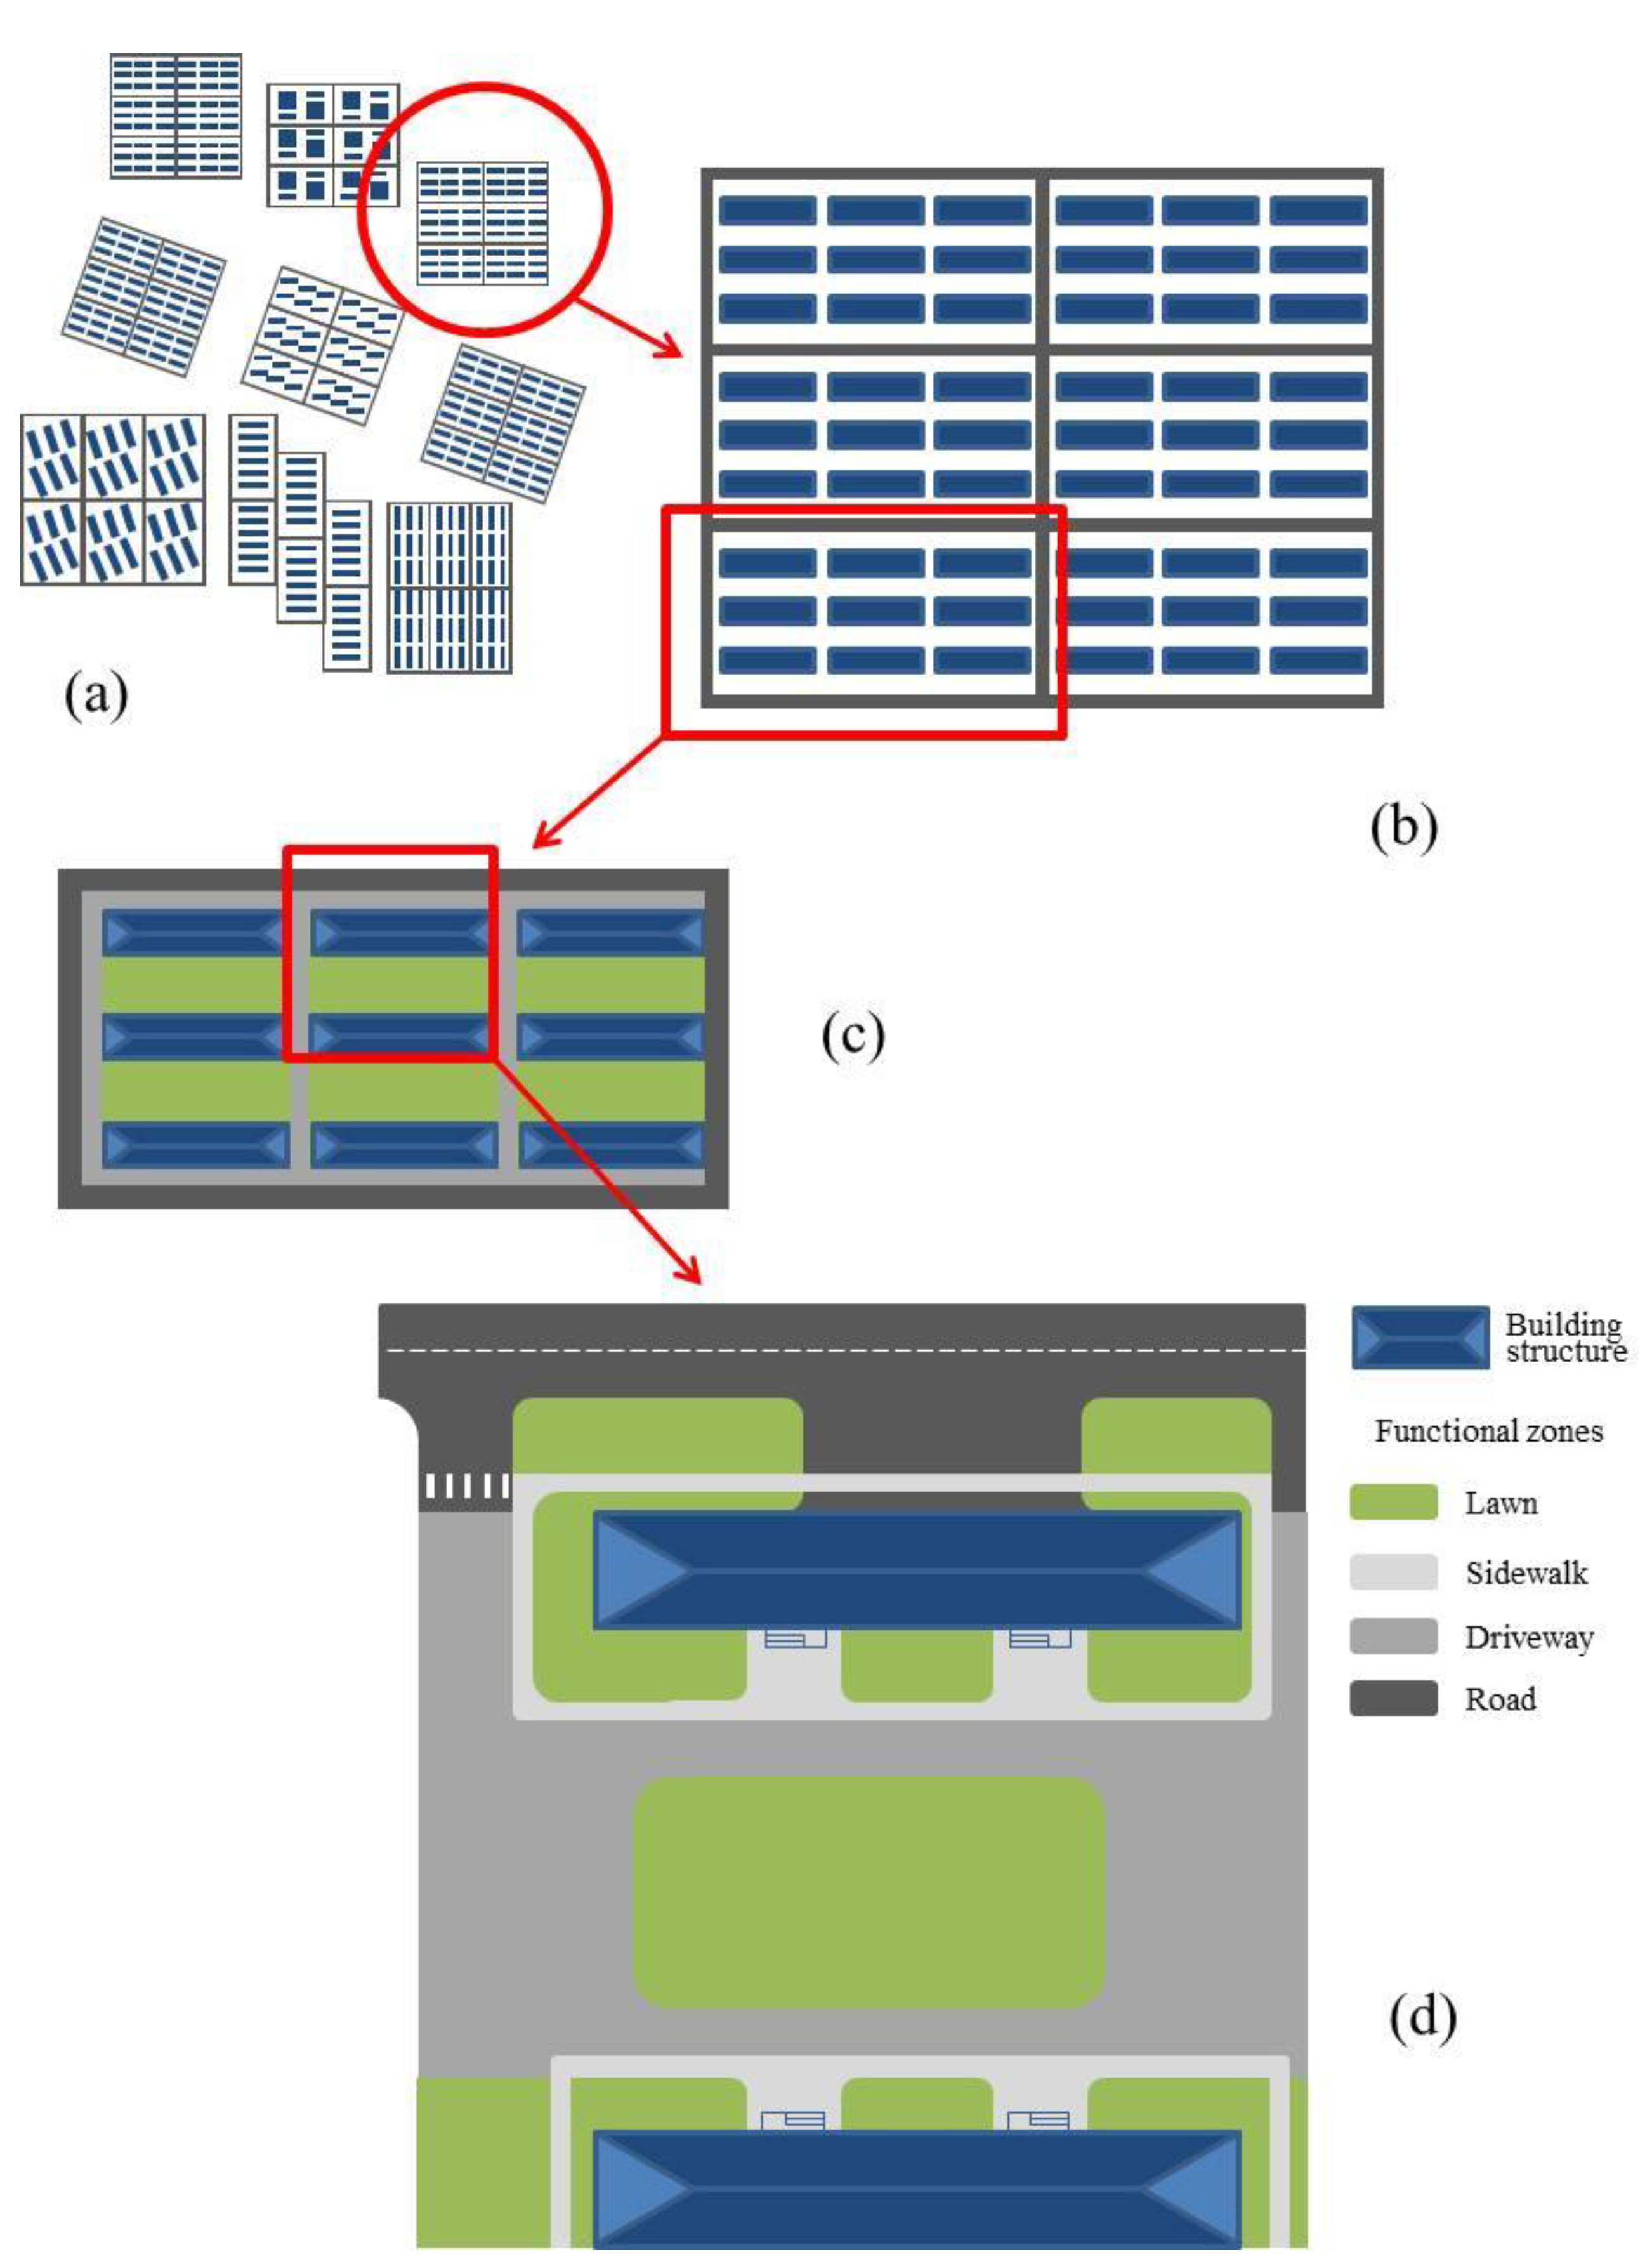
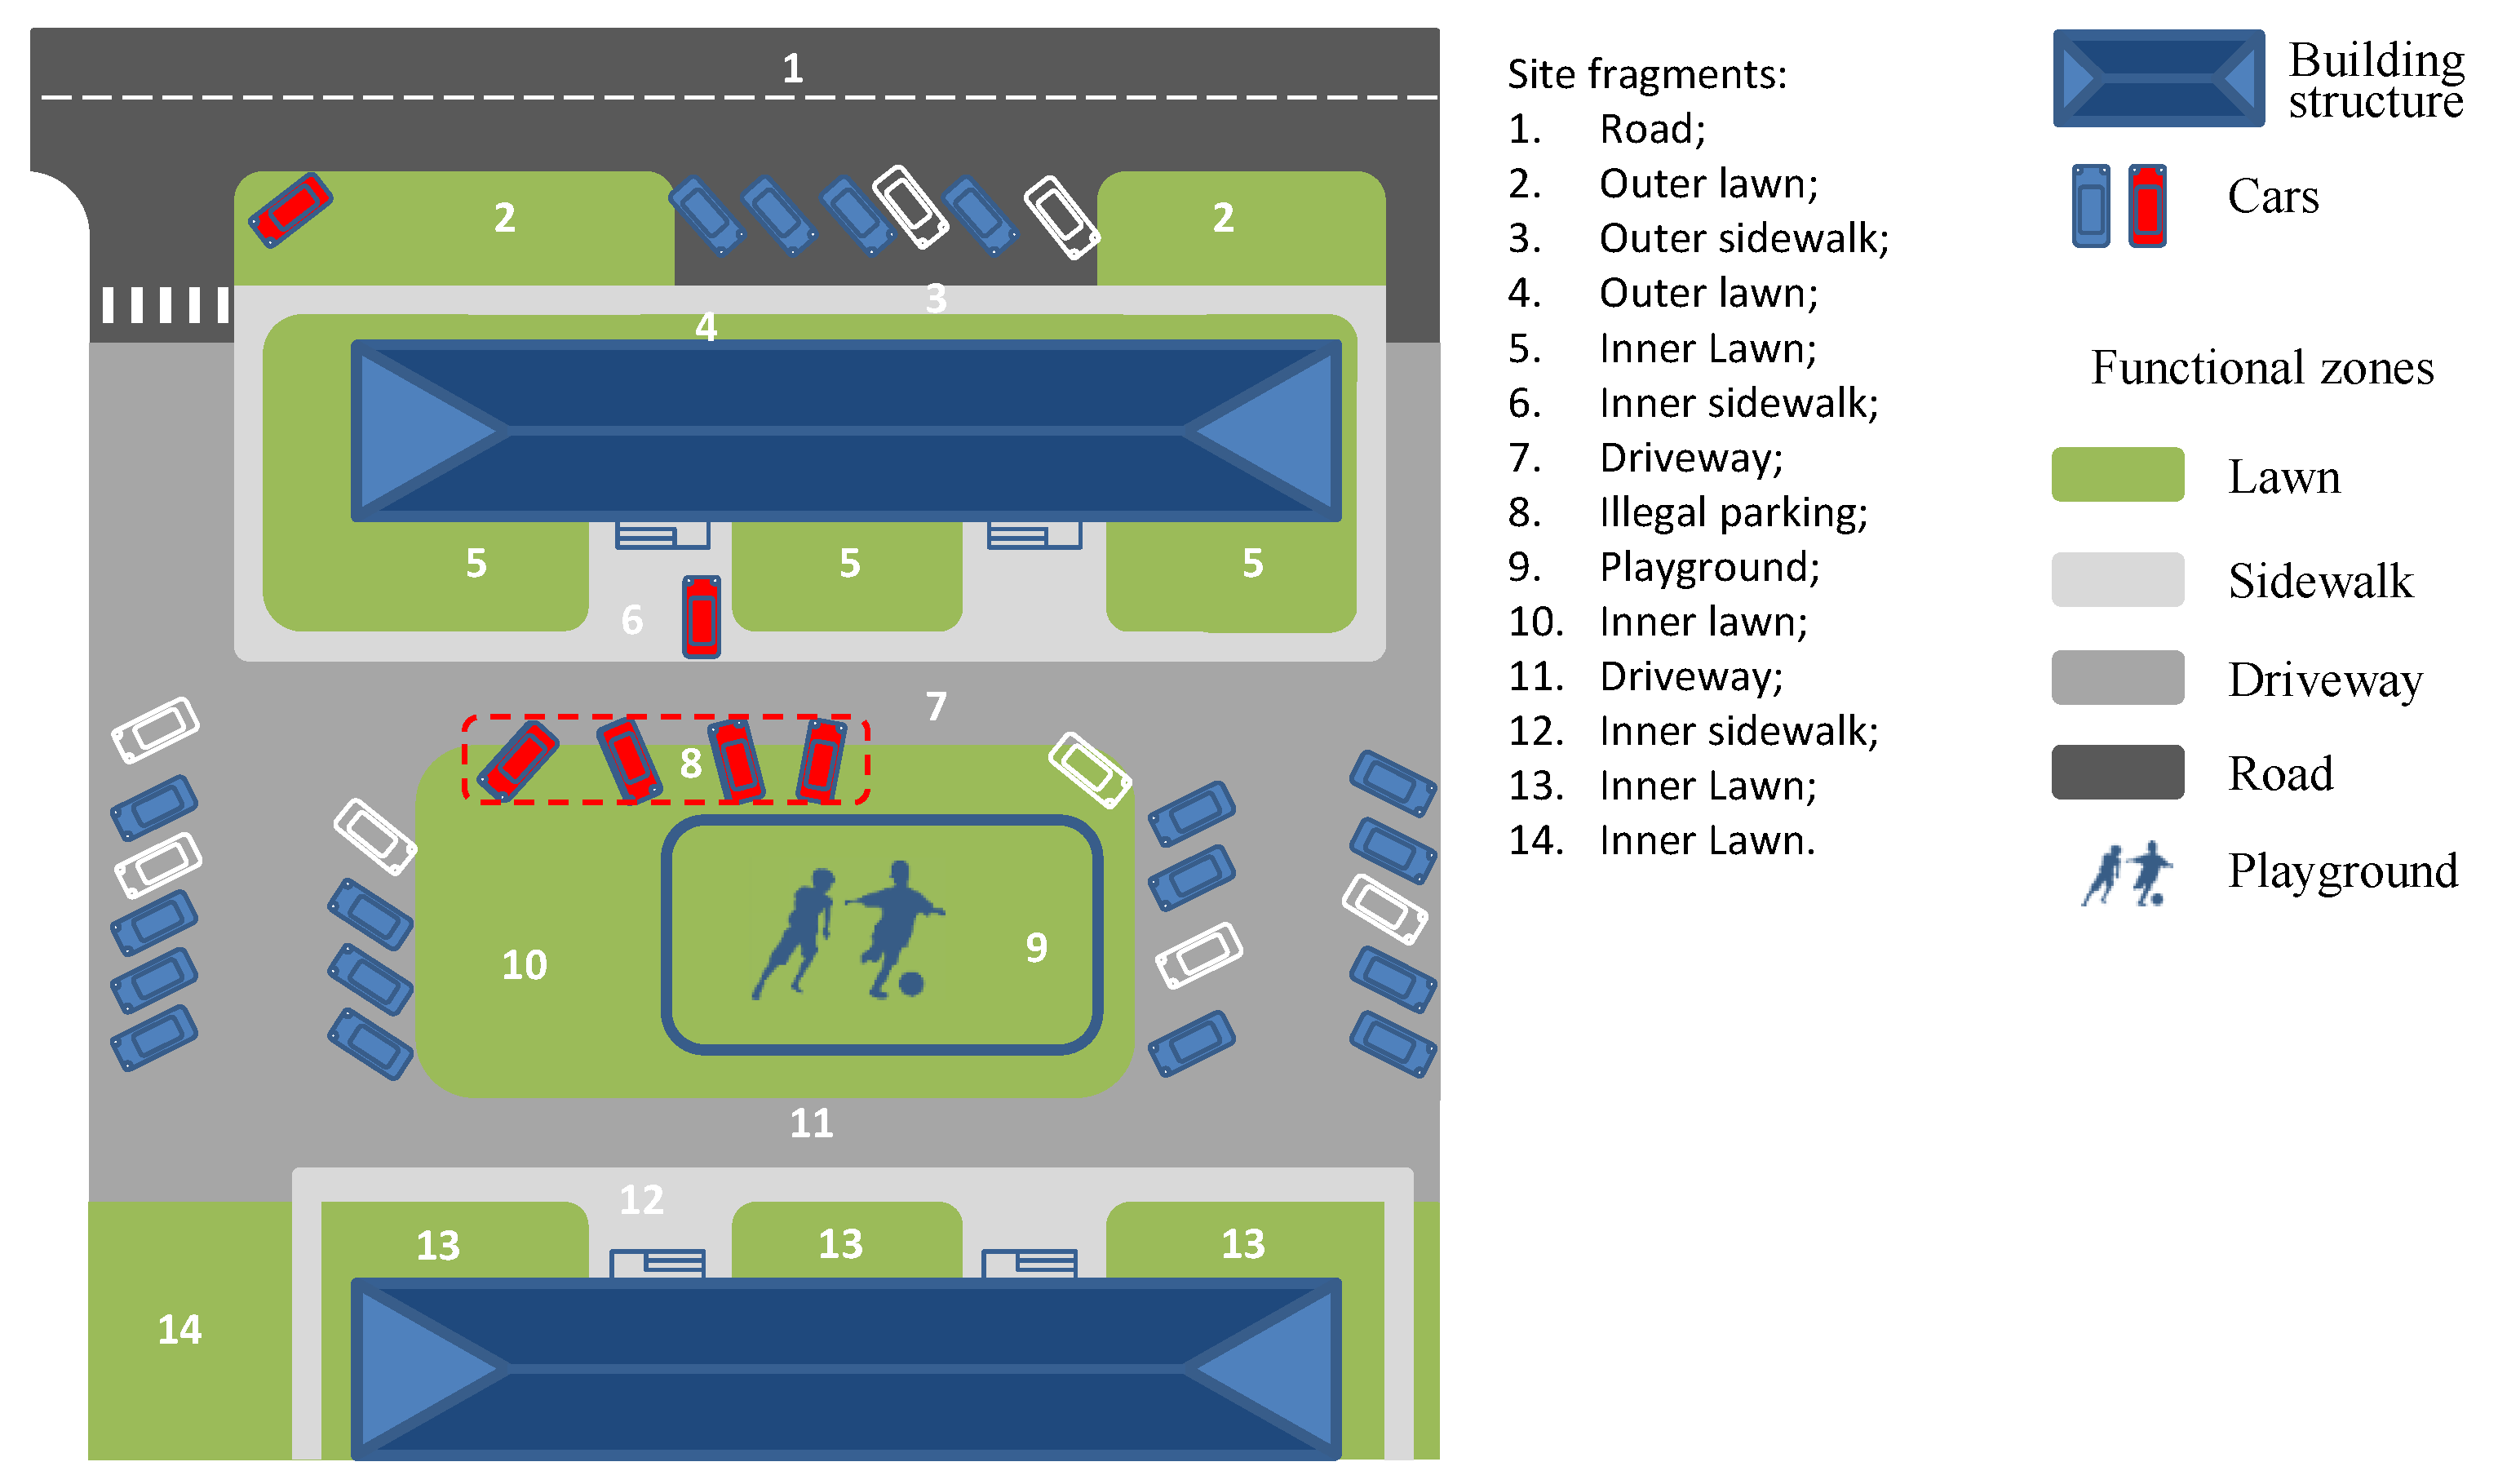
2.2. Description of the Surveyed Sites

Multi-story apartment buildings are the main type of residential development in all cities. The residential districts consist of microrayons, which were the primary structural element of urban residential area construction in the former Soviet Union (Figure 2). The development of microrayons was mainly made up of blocks of apartment buildings of the same type. A group of apartment buildings (part of a block) with a common front yard and courtyard (back yard) including an adjacent part of a street was chosen as an elementary urban residential landscape (EURL). Such decomposition of the urban residential district, where EURL represents the minimal urban landscape element (micro-landscape), reflects typical apartment block development in Russia.
A two-stage, semi-random procedure was used to select sites for the field landscape survey in each city. In the first stage, 30 typical EURLs were selected in different geographical areas associated with various historical periods of city development. Then six sites were chosen randomly from the list of 30 EURLs in each city.

2.3. Method of the Field Landscape Survey

Preliminary site plans were created based on city maps, satellite images, and street view images available on Google maps and Yandex maps services. The field surveys of the selected sites were performed in accordance with the developed protocol. In the first step, the preliminary site plan was split into disjointed segments providing particular functions or services within the EURL. The segments were assigned to one of the main functional zones:
  • Road (a section of the street road network connecting residential areas, and public and industrial areas of the city);
  • Green zone, including areas with pervious cover: lawns, flower beds, and playgrounds with a grass cover;
  • Sidewalks and adjacent pedestrian paths;
  • Vehicle zone (driveways connecting courtyard spaces with the road network, parking spaces, and illegal parking places that are areas of other functional zones illegally used for parking).
Additionally, sports grounds and communal service zones can be found in the EURLs.
The front yard and adjacent street, which are supposed to experience significant loads from vehicles and people, are considered as external parts of the EURL. A courtyard area separated from the street was considered as an internal part of the elementary urban landscape. As a rule, the courtyard is isolated by residential buildings, a fence, driveways, or landscape units. Each segment can be assigned to either the external or internal parts of the EURL.
After the site segmentation, the following characteristics and indicators were analyed for each segment during field inspection:
  • Functional purpose (functional zone);
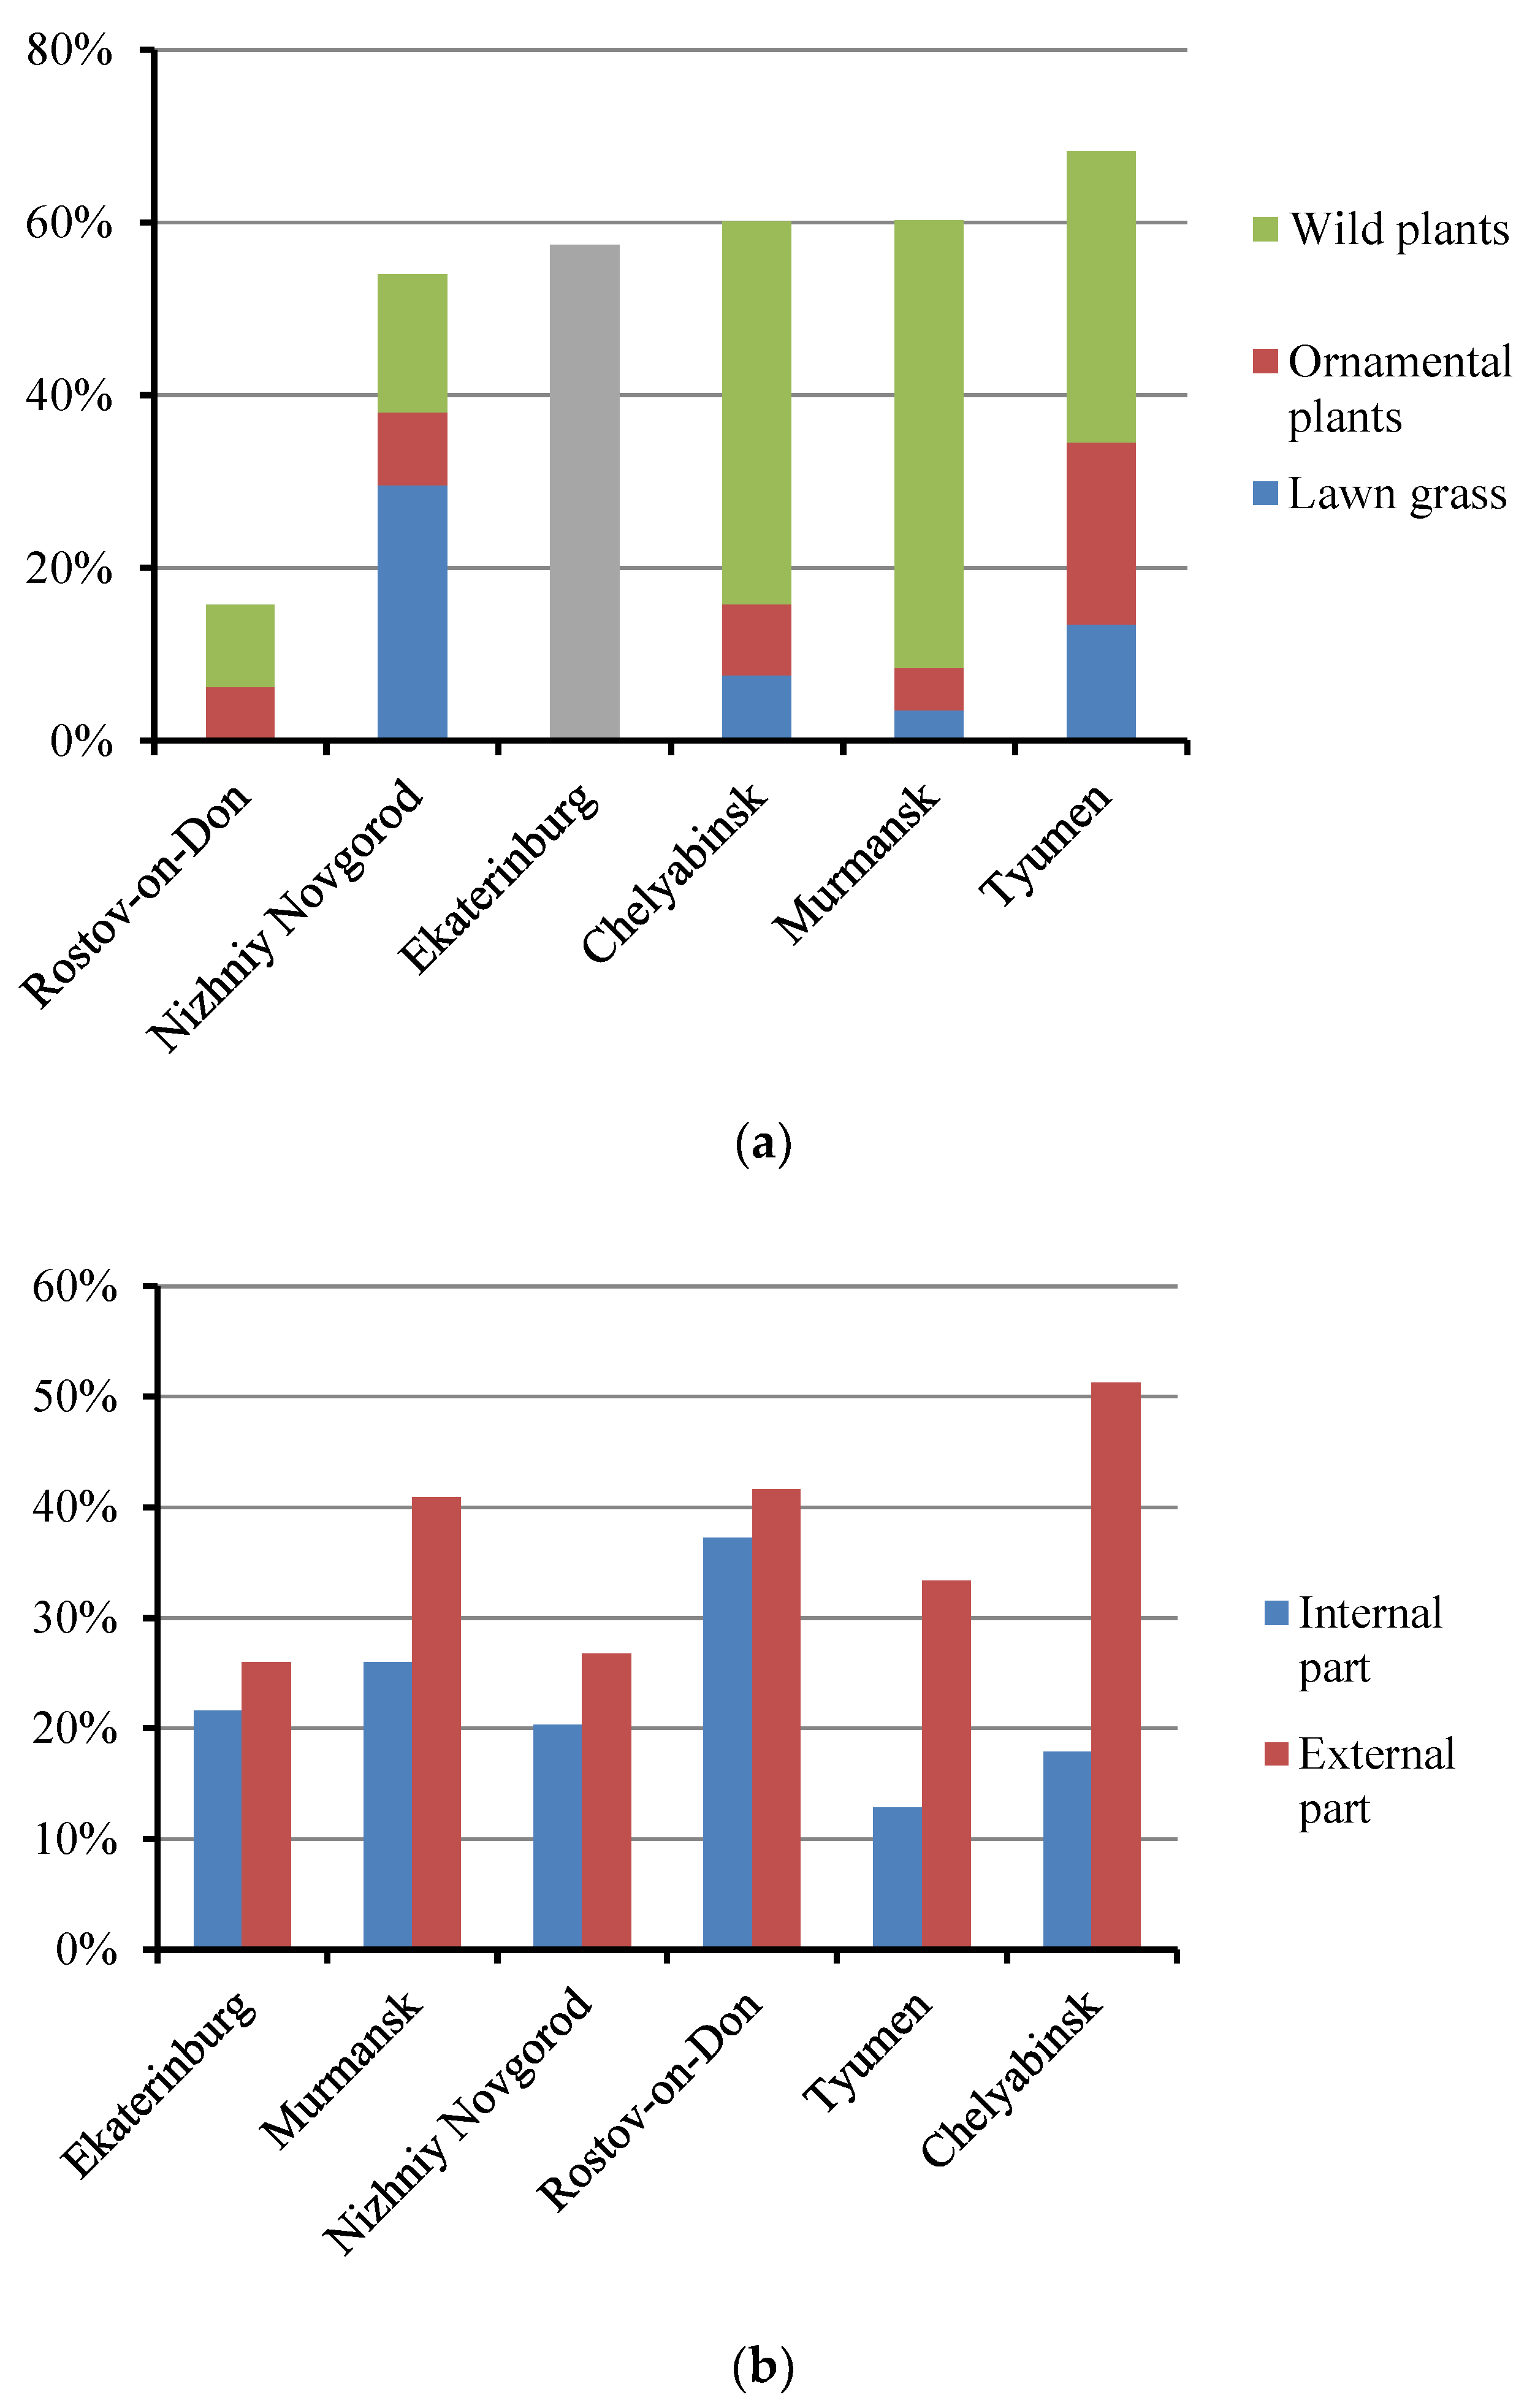
  • Association with external or internal parts of the EURL;
  • Type of surface cover, paving (asphalt, gravel, grass, etc.);
  • Percentage of disturbed surface cover (expert’s evaluation);
  • Overall technical condition of the paving and infrastructure element (five-point expert’s evaluation);
  • Quality of the cleaning (five-point expert’s evaluation);
  • The number of parked cars;
  • The number of parking spaces;
  • Presence and type of earthworks, construction, and landscaping works;
  • Slope gradient (yes/no);
  • Local depressions(yes/no);
  • Causes of soil erosion and sediment formation;
  • Visual signs of external sources of sediment entry.
For some characteristics and indicators, the classification schemes were developed by applying five-point evaluations by experts basing on the visual observations during a field study.
For segments related to the green functional zone, the projective cover of trees, the projective cover of grasses, the type of vegetation (wild plants, lawn grass, ornamental plants), and insolation within the site segments were also evaluated.
A special questionnaire was developed that includes the site address and coordinates, segment ID marked on the site plan, date and time of the survey, and a formalized description of the main characteristics of the segment. The questionnaire was filled out for each site segment at each site. Expert grades were assigned by the agreement of two experts. To achieve consistency in the expert assessments in different cities, the field surveys were carried out by the same researchers according to the same procedure.

3. Results

Field surveys of 36 sites in six cities were performed in warm seasons 2017–2019 (Ekaterinburg—August 2017, Nizhniy Novgorod—August 2018, Rostov-on-Don—October 2018, Tyumen—July 2019, Chelyabinsk—August 2019, Murmansk—August 2019). The average area of a site excluding buildings was 7900 m2, the minimum area was 1500 m2, and the maximum area was 17,600 m2. Buildings occupied an additional 2400 m2 on average. At each site, 14 segments on average were delineated. A schematic division of a site into segments is presented in Figure 3. The average area for the segments was approximately 560 m2; 75% of the segments had areas of more than 135 m2.

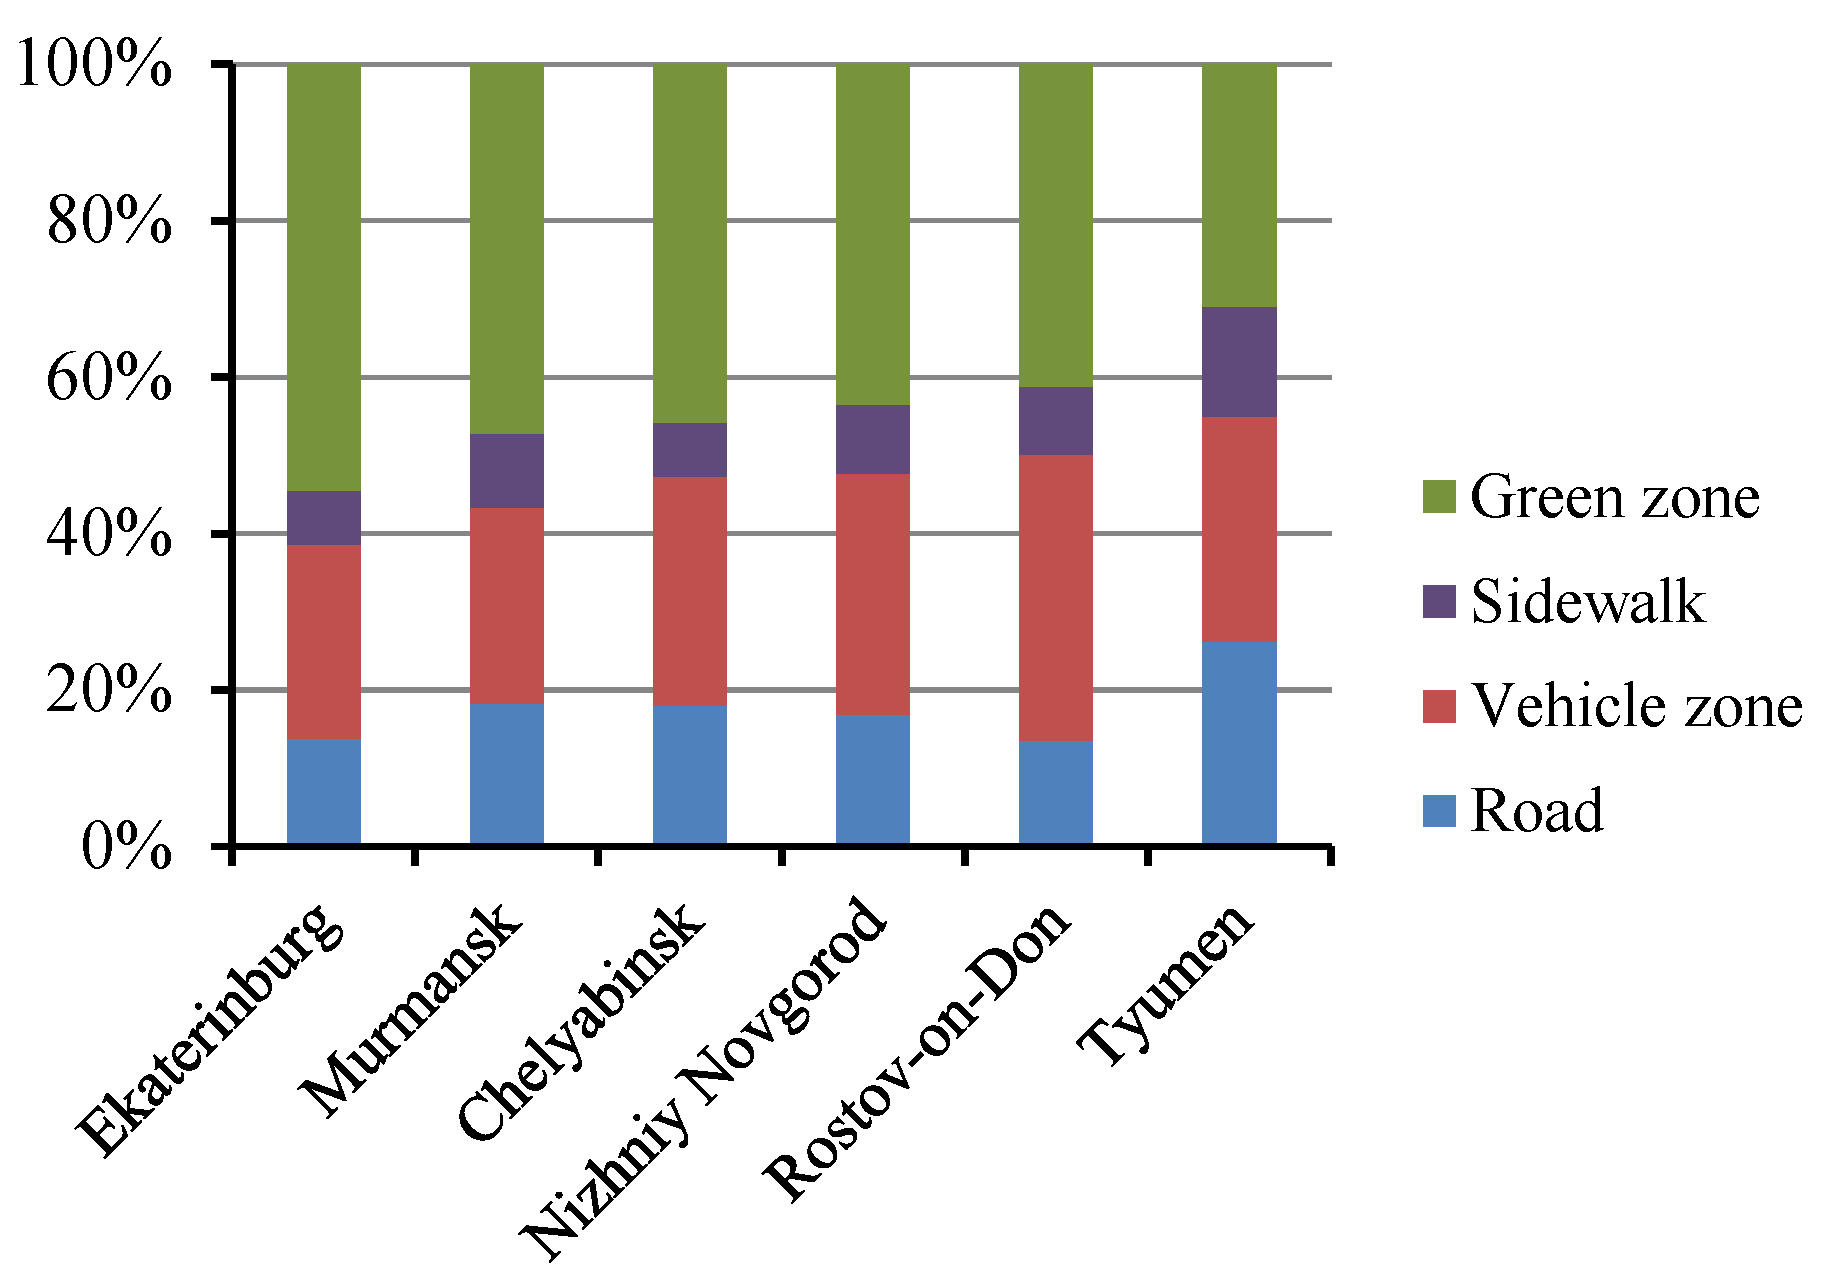
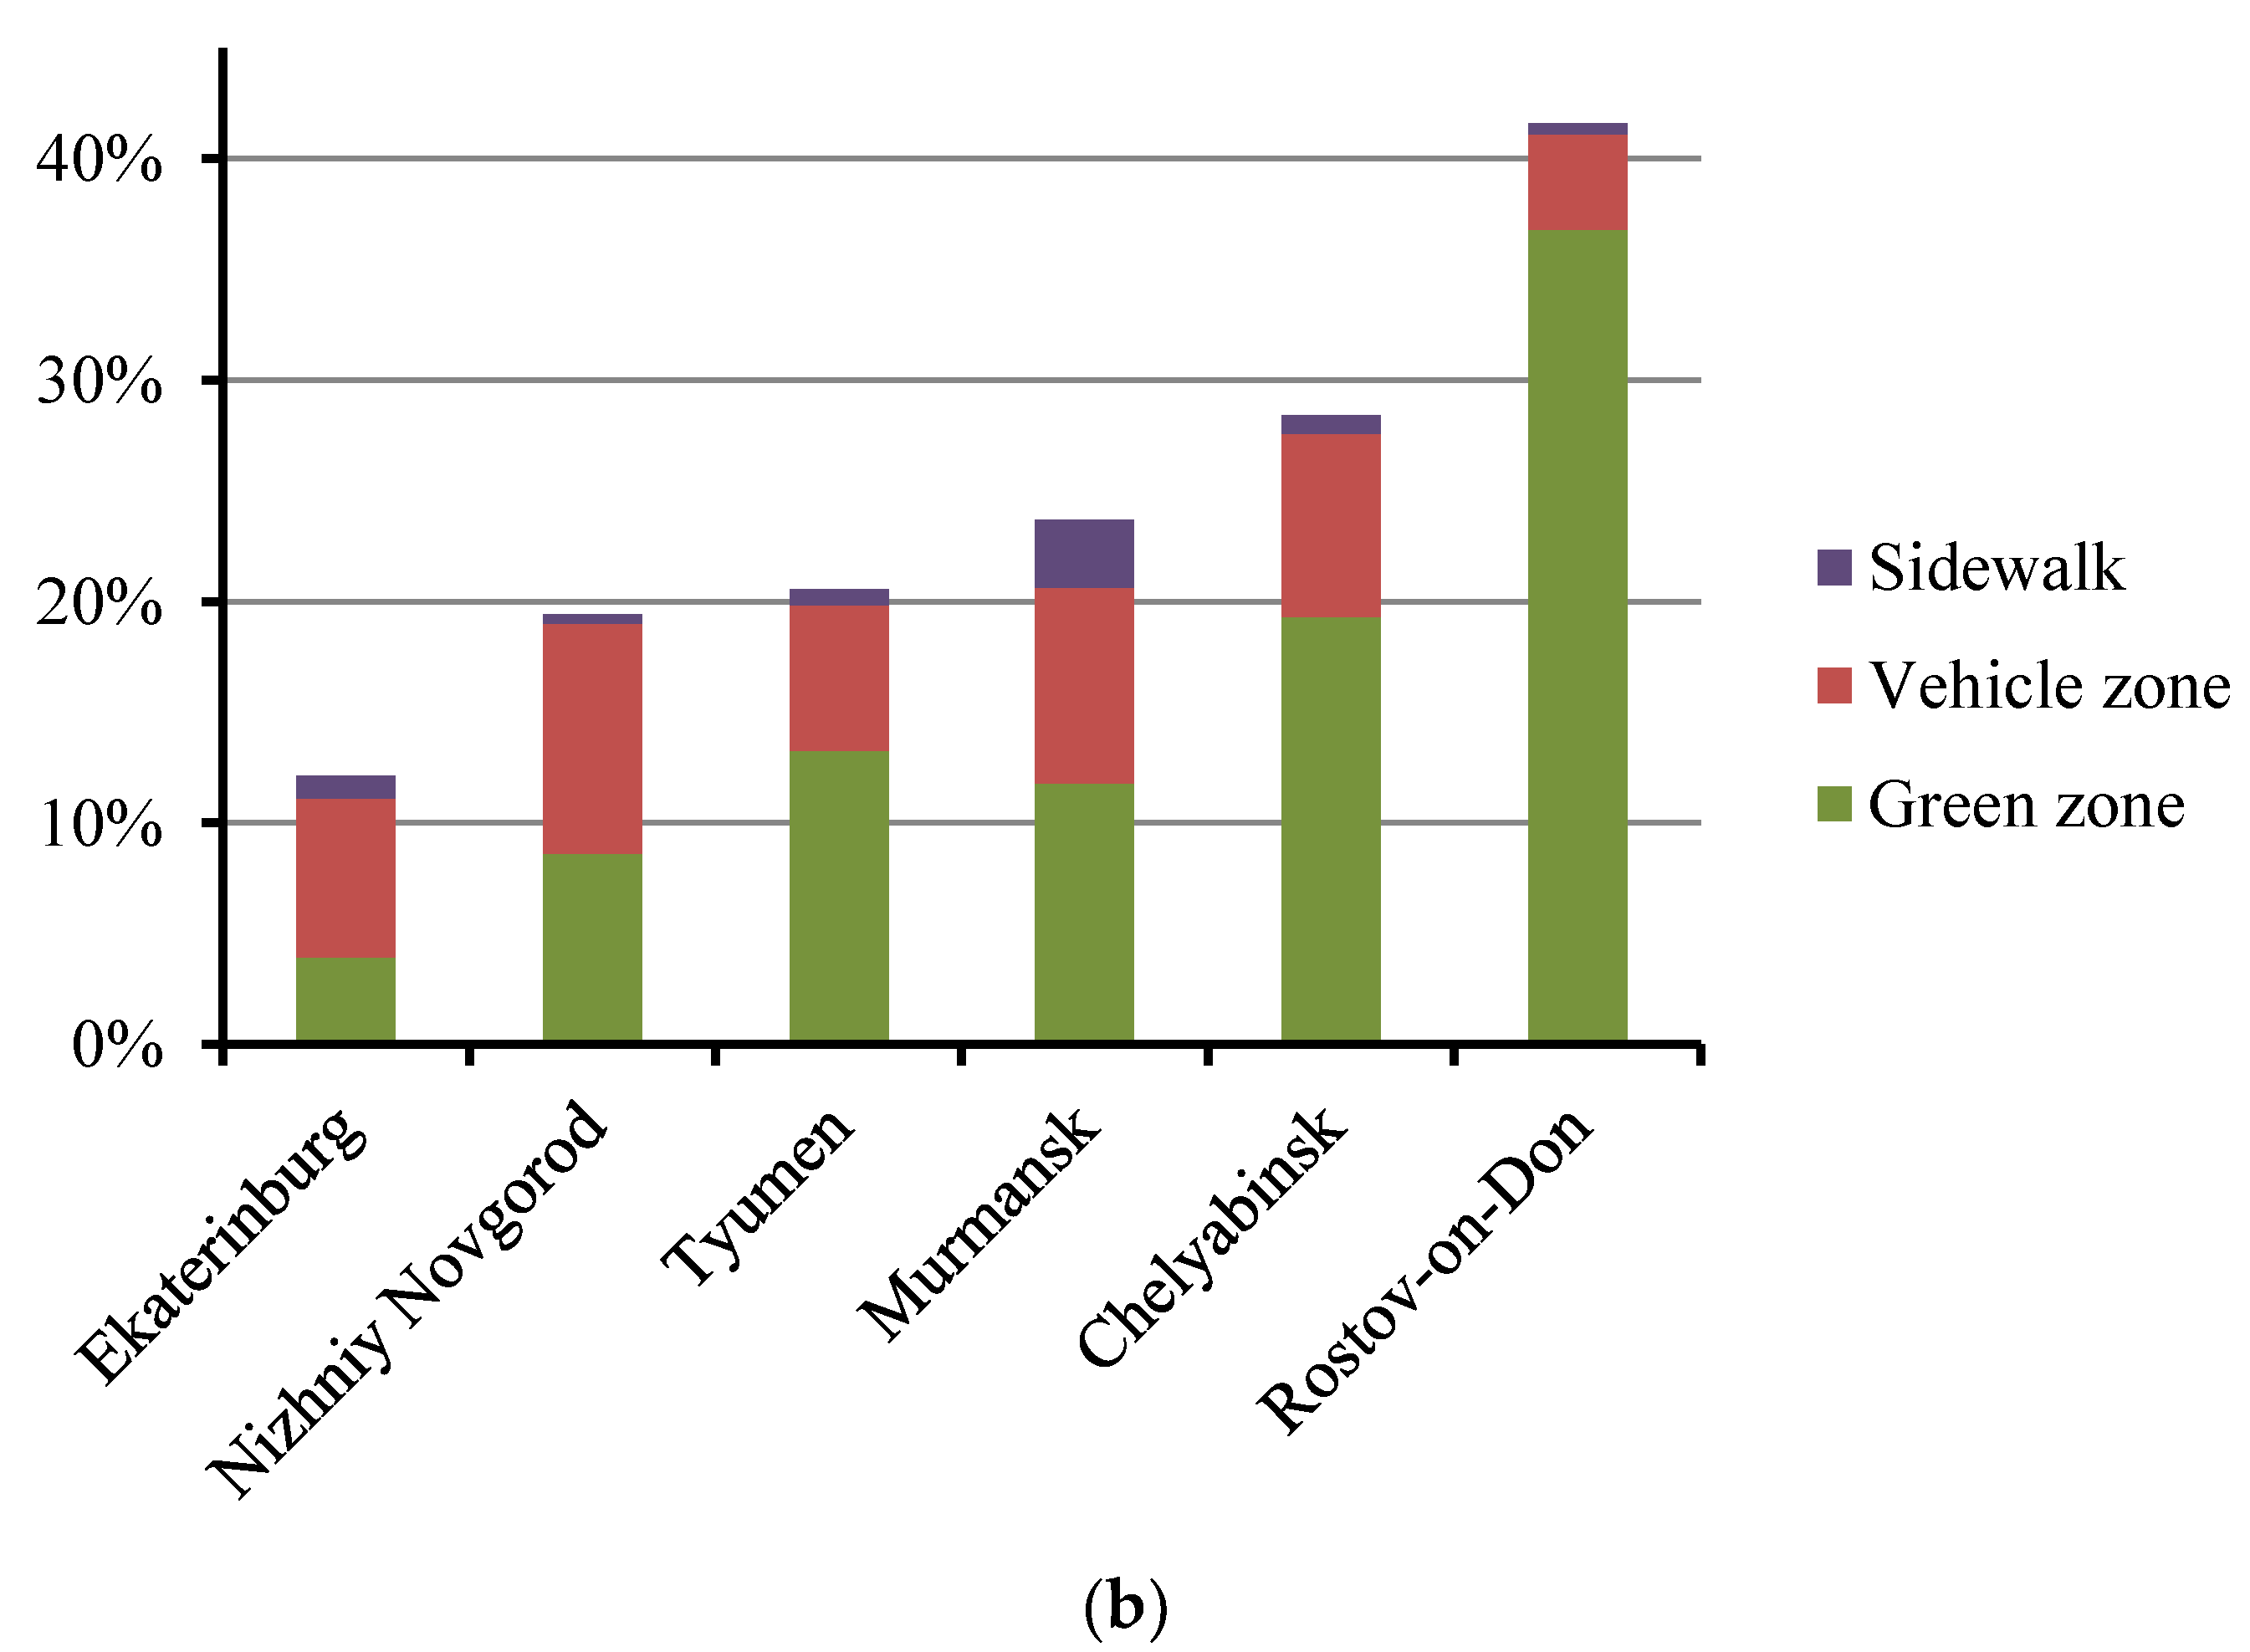
3.1. Functional Zones

Division of the EURL area by functional zones is presented in Figure 4. An average of 18% of the residential area is related to the roads, from 13% in Rostov-on-Don to 26% in Tyumen. On average, the green zone occupies 53% of the area of the site excluding the road network. The smallest contribution of the green zone to the area was 42% in Tyumen; the largest was 63% in Ekaterinburg. The average area of the vehicle zone (Figure S1), including driveways, parking, and illegal parking places is 35%, from 29% in Ekaterinburg to 42% in Rostov-on-Don. On average, 59% of the area of a site belongs to the courtyard space.

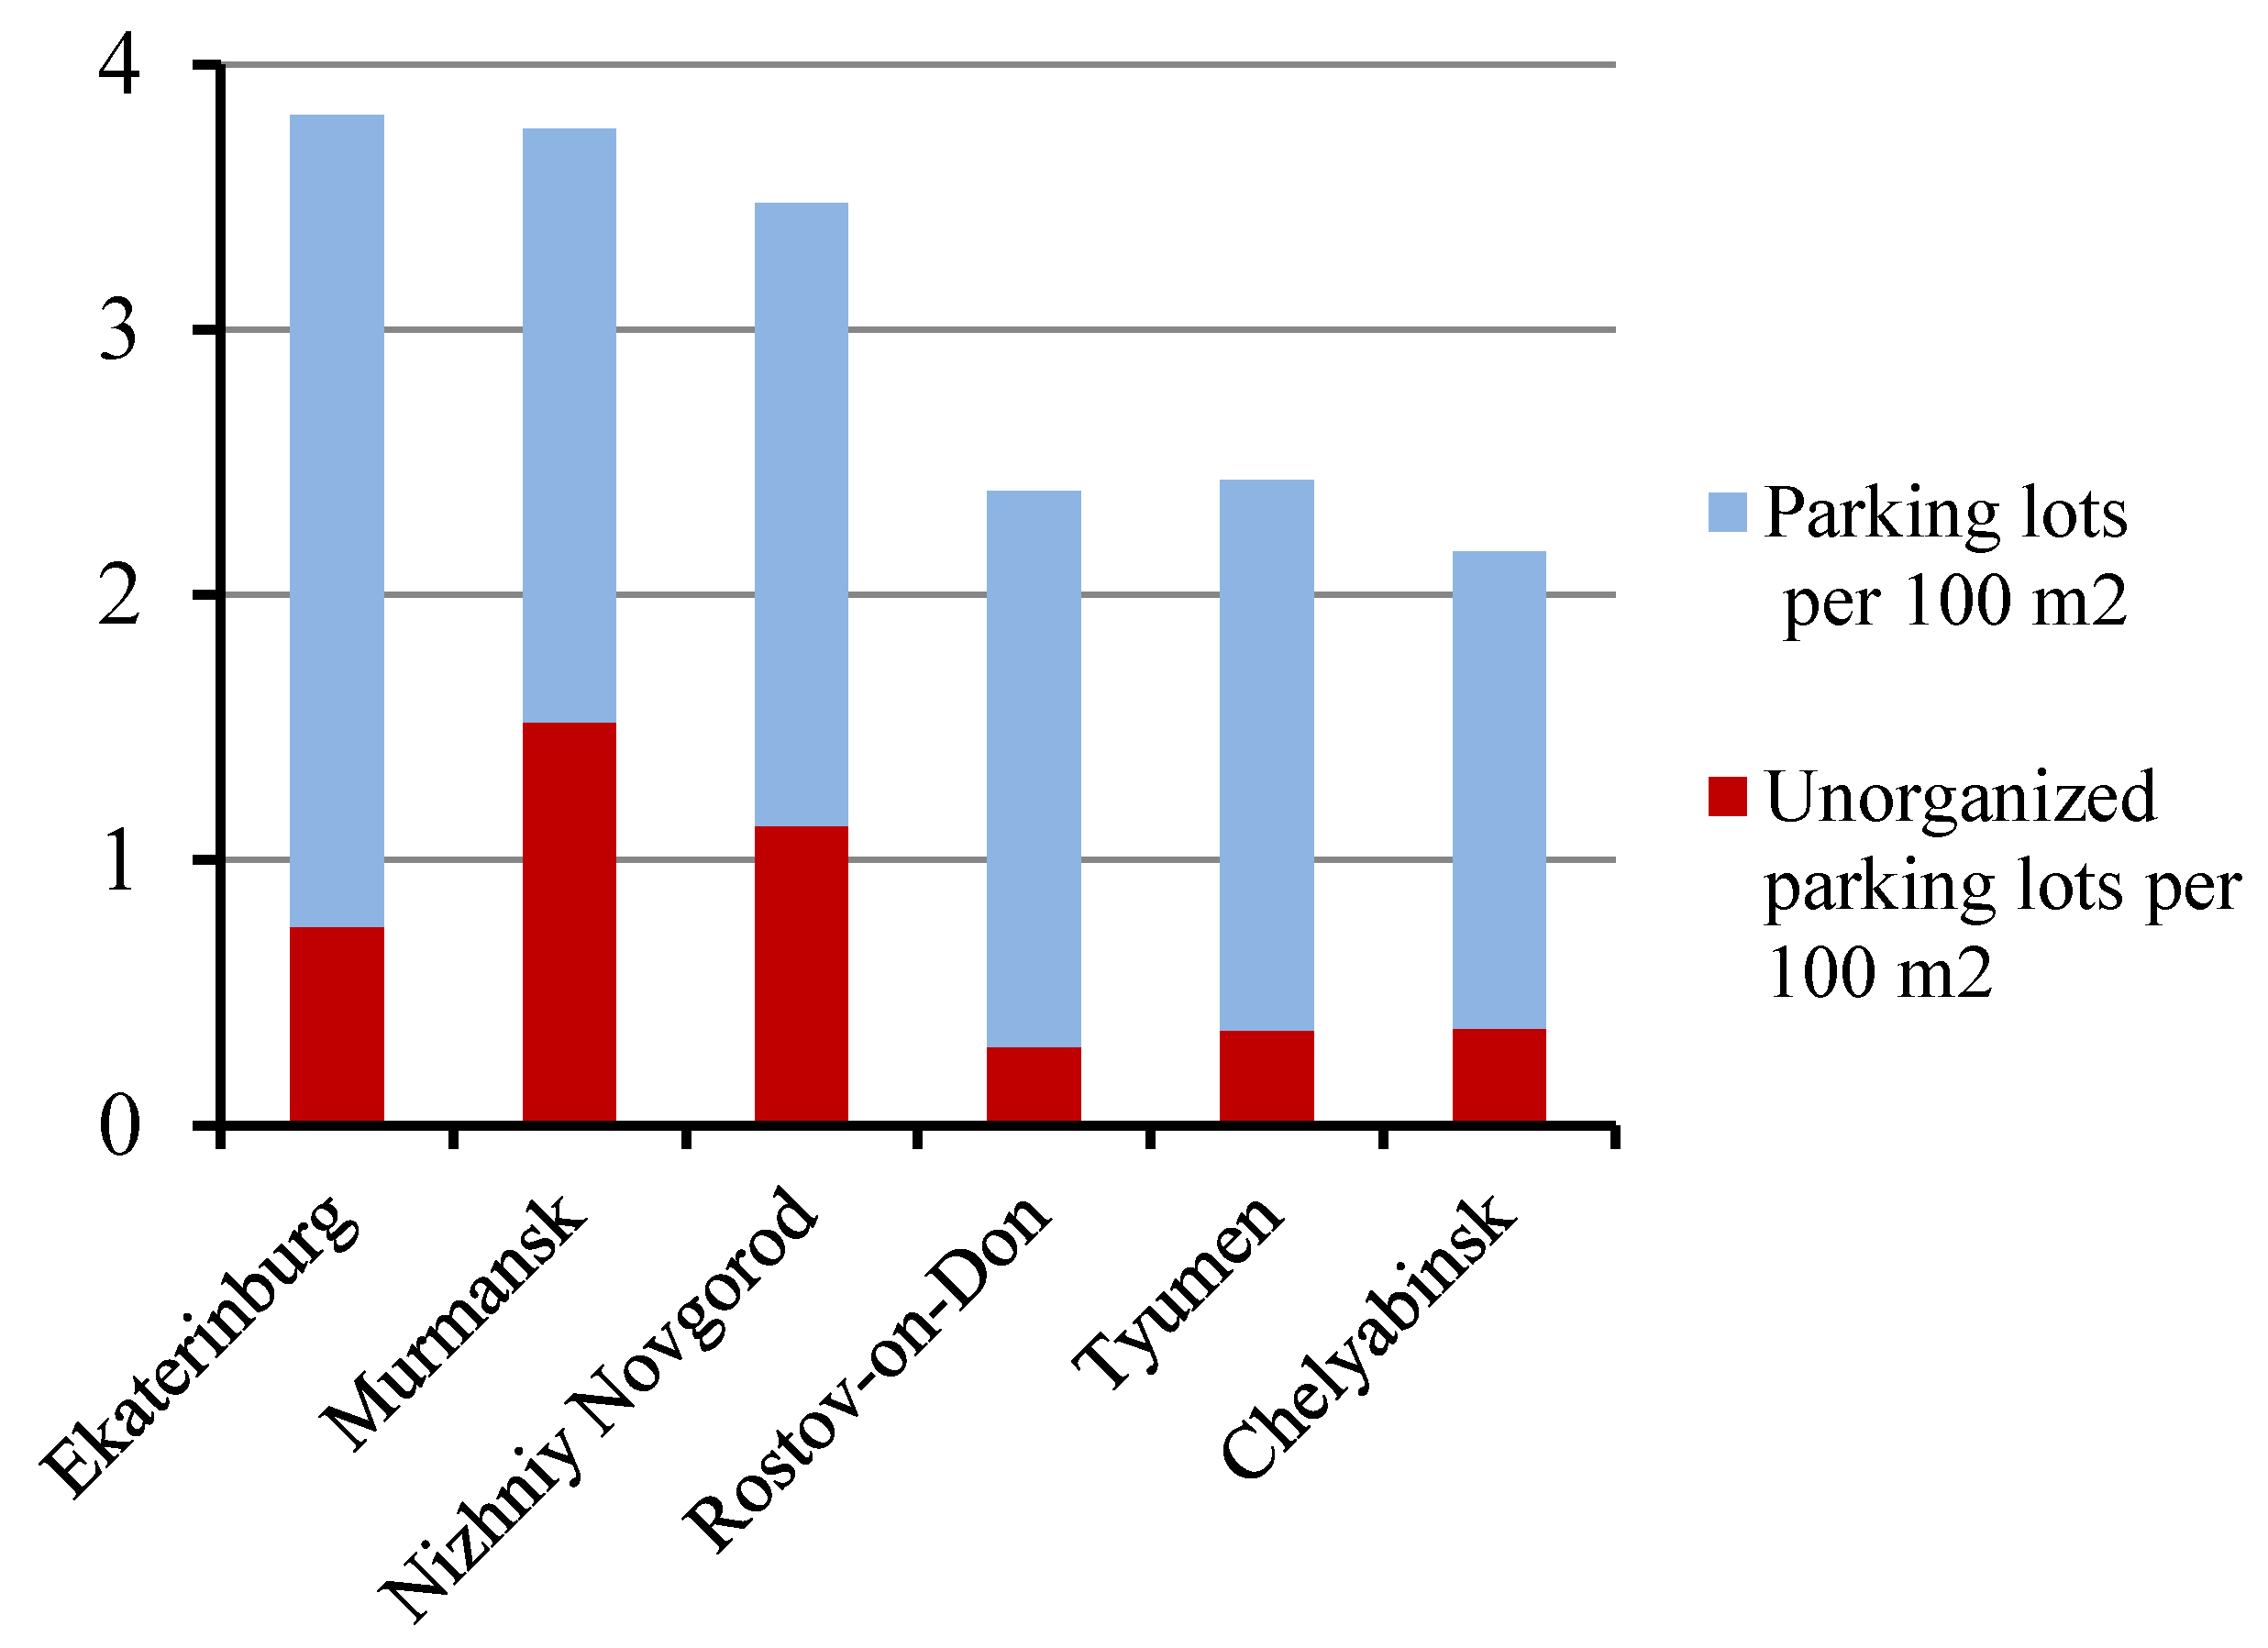
3.2. Motor Transport
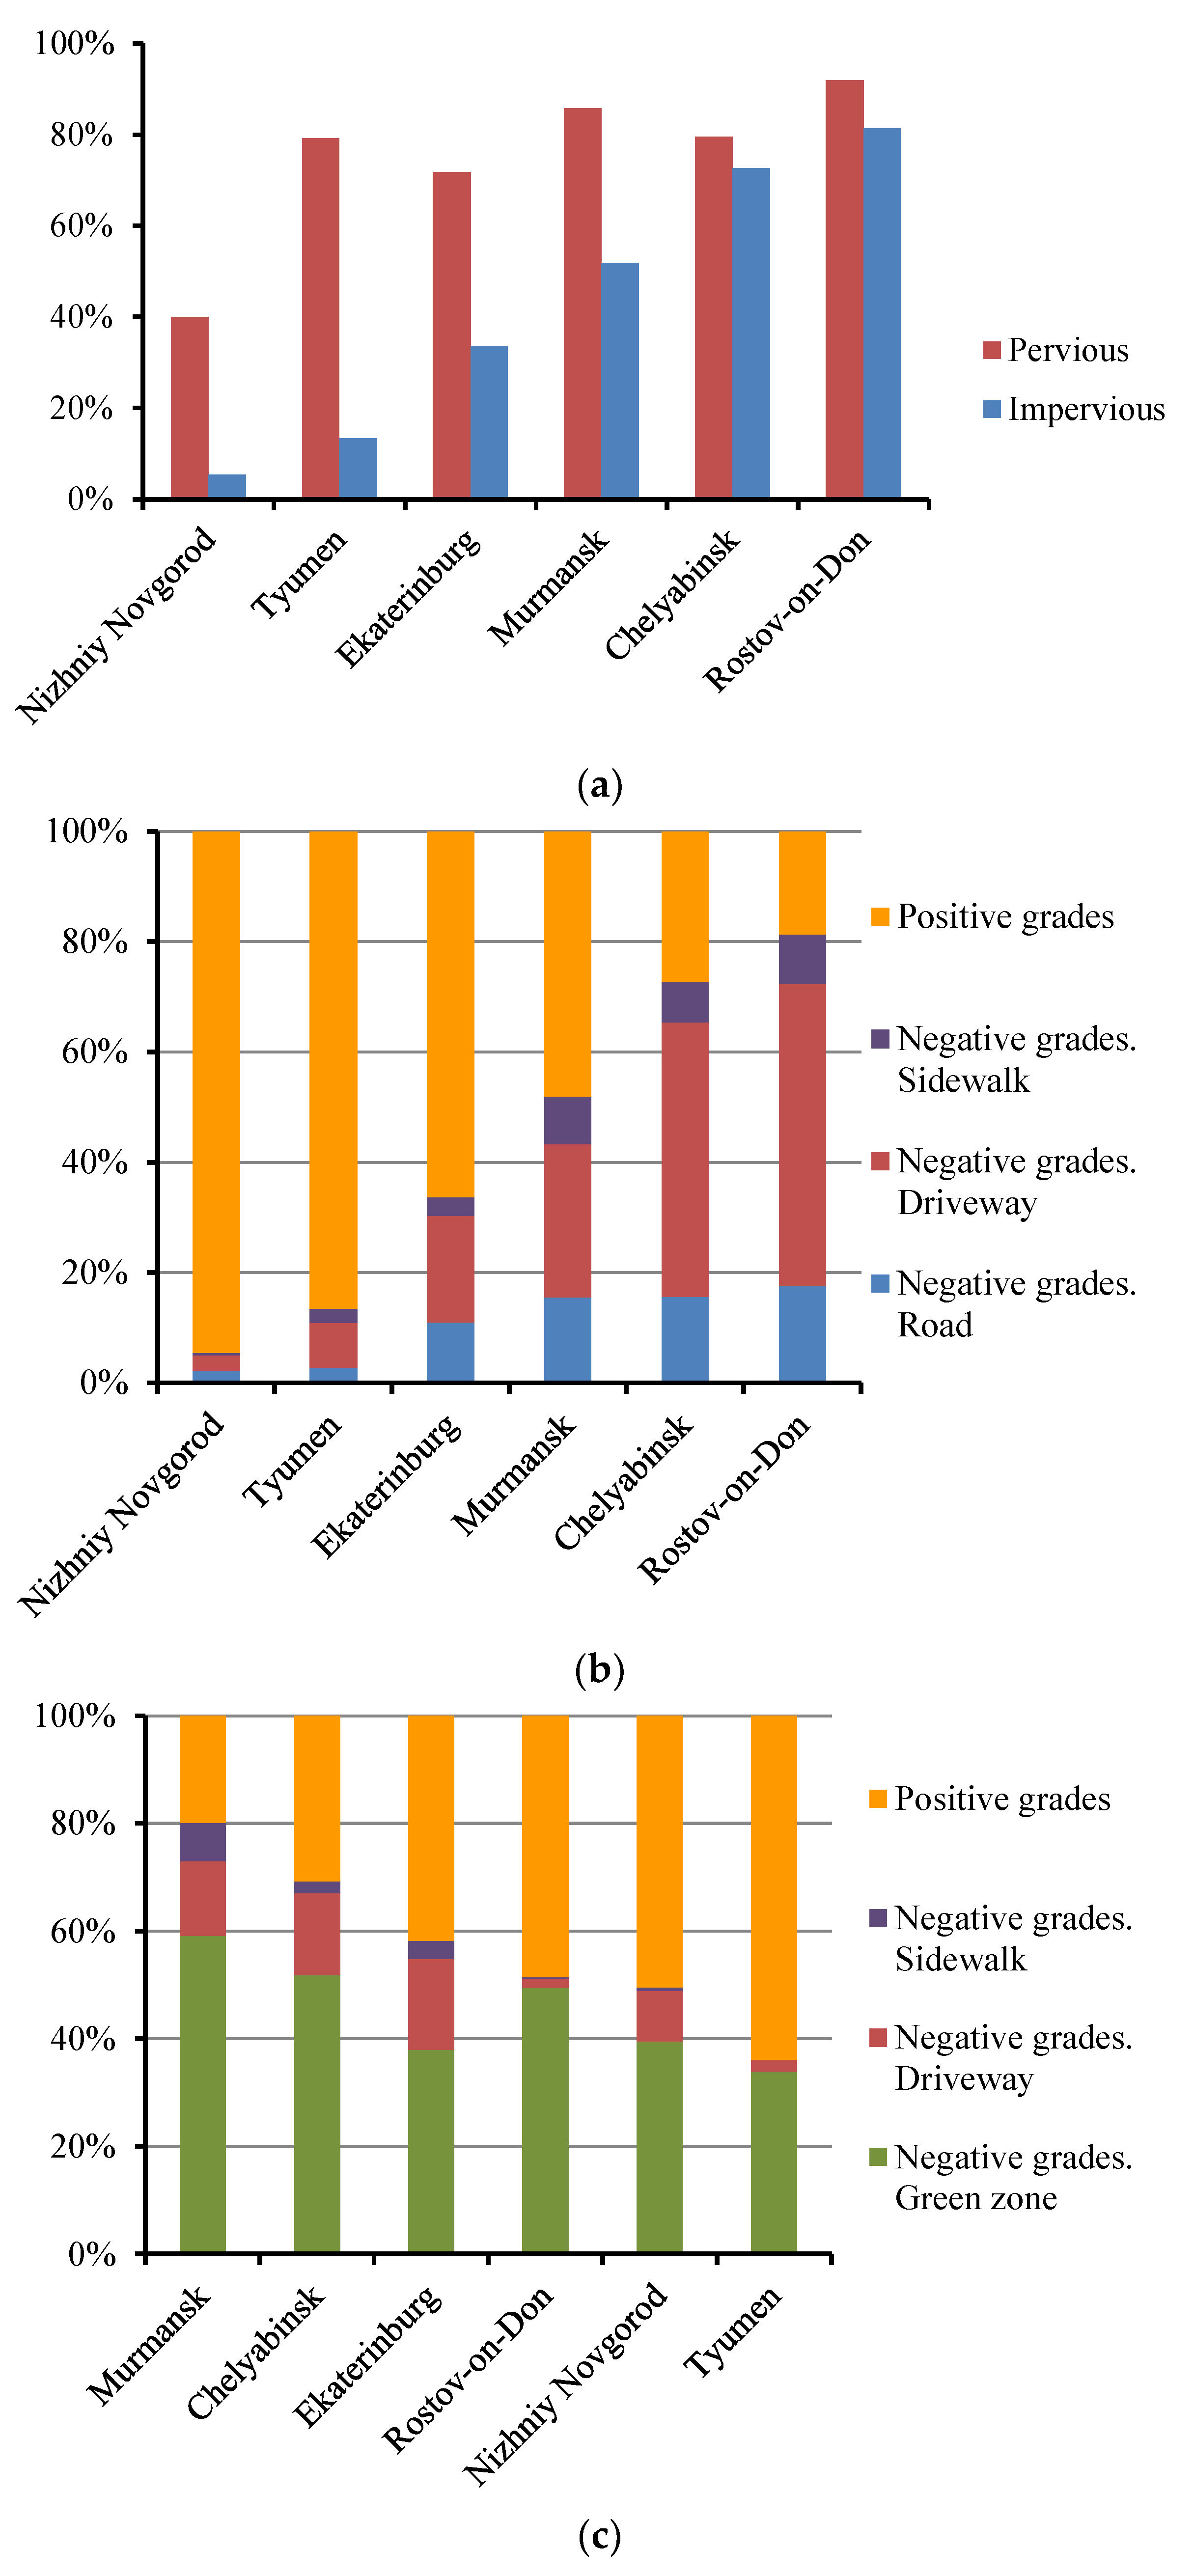
On average, 64 parking spaces determined by visual signs of parked vehicles were recorded at each site, of which 40 parking spaces were occupied by cars during the survey; 80% of the cars were parked in the courtyard. This constitutes 2.9 parking spaces, from 2.2 in Chelyabinsk to 3.8 in Ekaterinburg, per 100 m2 of the area of the courtyards, driveways, and parking spaces (the vehicle zone of the courtyards) (Figure 5). In the daytime, when the survey was carried out, there was an average of 1.1 parking spaces and 0.7 cars per 100 m2 of the courtyard area. The minimum number of cars was in Chelyabinsk (0.5), and the maximum in Tyumen (0.8).
Of the approximately 2300 parking spaces, 487 (21%) are illegal parks on the lawns, sidewalks, and playgrounds (Figure S2). The number of illegal parking places varies significantly by city (Figure 5), from 11% in Tyumen to 36% in Murmansk. One car parked on the lawn disturbs soil in an area of approximately 27 m2. Illegal parking places occupy about 8% of the green area, sports and children’s playgrounds, and sidewalks; in Murmansk and Nizhniy Novgorod—about 14%; in Ekaterinburg, Chelyabinsk, and Tyumen—from 4 to 6%.

3.3. Soils

Soils at the sites are mainly represented by technosols. Natural landscapes within residential areas are almost never found. Soils of natural origin are preserved in separate places with complex topography and elevation, for example, in Murmansk. The upper soil layers are represented by artificial lawn soils, peat, etc., formed as a result of landscaping.

3.4. Disturbed Cover

According to the survey results, the majority of the surfaces in residential areas are disturbed by natural and anthropogenic factors. Areas with visual signs of erosion and mechanical disturbance, bare ground, and paving in poor condition were assigned to the damaged surface cover category. In general, 24% of surfaces in the residential areas of all the cities together are disturbed. Assessment of the condition of surfaces showed that the total proportions of disturbed cover were 27% and 16% in the inner courtyards and the external parts of the sites, respectively. The damaged cover was the possible source of the urban sediment in 319 segments of the urban landscape, which is 2/3 of all those examined.
As can be seen in Figure 6b, the smallest proportion of damaged cover was found in Ekaterinburg—12%. In other cities, except Rostov-on-Don, it did not exceed 30%, and in Rostov-on-Don, more than 40% of EURL surfaces had disturbed cover. In all cities except Ekaterinburg and Murmansk, the largest share of damaged surfaces refers to the disturbed lawn cover. The contribution of the green zone to the total area of damaged cover in Rostov-on-Don reached 90%, while in other cities it was below 70%. The vehicle zones (illegal parking places and disturbed areas of driveways and parking lots) make up the majority of the disturbed cover for Ekaterinburg and Nizhniy Novgorod (Figure S3). In all cities, the portion of damaged cover areas was higher in courtyards than in external parts of the EURLs (Figure 6a).

3.5. Vegetation

The lowest grass projective cover in lawns was found in Rostov-on-Don—only 16% (Figure 7a), where the bare soil in lawns was partly associated with the arid summer of steppe climate. The largest projective cover was found in Tyumen (68%). In other cities, projective coverage was in the range of 54–60%. In Tyumen, the largest area of lawns with high projective cover was observed: 27% of the total area of lawns had grass cover of more than 75%, whereas in Rostov-on-Don almost two-thirds of lawns had projective grass cover of less than 25%. In other cities, more than 50% of the lawn area had projective grass cover of more than 50%. The projective grass cover does not depend on the type of vegetation (wild specimens, lawn grass, and ornamental plants). In Tyumen, each type of vegetation makes a significant contribution to the total projective grass cover of green areas. In Chelyabinsk and Murmansk, the greatest contribution is associated with wild species of grass. In Nizhniy Novgorod, the wide use of a cultivated variety of grass was observed. An example of the contribution of low grass projective cover to soil erosion and sediment formation in the urban environment is presented in Figure S4.
According to a rough assessment of the insolation of lawns, it was found that approximately a third of the lawns can be attributed to areas with low insolation (the shadows of buildings and trees). In these areas, projective coverage is on average 14% lower than in areas with less shadowing.
The average tree canopy cover was 26% of the total area excluding buildings and roads (Figure 7b). In Rostov-on-Don, the largest projective coverage of trees was observed—38%, and the smallest in Tyumen—21%. In all cities, the coverage of the external part of the EURL was higher than in the courtyard (Figure 7b).

3.6. Cleaning and Technical Condition

To characterize the quality of cleaning and the technical condition, expert grades were qualitatively divided into two categories, satisfactory and low quality. Low quality of cleaning was demonstrated by the presence of large amounts of debris, communal waste, broken glass, cigarette butts, and leaf fragments (Figure S5 left). Observations show that under poor quality cleaning, urban sediment accumulates on surfaces, near curbs, and in relief depressions. The share of low-quality grades of cleaning varies significantly by city—from 40% in Nizhniy Novgorod to 80% in Rostov-on-Don. Lower quality of cleaning at pervious paving was observed in all cities (Figure 8a).
The quality of cleaning impervious ground surfaces is considered separately (Figure 8b). For this characteristic, the difference between cities is even greater: from 5% to 81% of areas with poor cleaning in Nizhniy Novgorod and Rostov-on-Don, respectively. Poorly cleaned driveways and parking places in yards make the greatest contributions; more than 50% of all impervious areas in Rostov-on-Don and Chelyabinsk have poor cleaning quality.
An expert assessment of the technical condition of the street, and of front and back yard infrastructure, showed that on average 59% of the areas, excluding the roads, are in unsatisfactory condition. The major visual signs of the unsatisfactory technical condition are as follows. On lawns: low projective grass cover, insufficient mowing, weed overgrowth, lawn damage by vehicles, earthwork with storage of excavated soil on lawns, and lack of restoration or landscaping. On driveways, parking places, and sidewalks: damaged asphalt or other paving, damage or lack of curbs, earthworks with storage of the excavated soil on the pavement, the presence of a large number of depressions with the formation of puddles and deposits of high thickness (Figure S5 right). In all cities, a large contribution to negative grades (<4) of technical condition relates to the green zones, on average 46%. In all cities except Tyumen and Rostov-on-Don, the contribution of driveways was quite large as well—10 to 15% (Figure 8c). In some cities (Murmansk, Chelyabinsk, Ekaterinburg) sidewalks make an additional contribution to the surface area with unsatisfactory technical condition. In general, 84% of the green zones area was in unsatisfactory technical condition (negative grades). About 32% and 22% of the areas of driveways and sidewalks, respectively, were associated with the unsatisfactory condition.

3.7. Earthworks and Construction on Sites

One of the most intense sources of surface contamination by sediment is earth and construction work. Under such activities, the destruction of surfaces, the storage of building materials, and piles of excavated soil without proper shelter occur. In some cases, proper restoration after completion of the earthwork was not undertaken in a timely way (delayed restoration, Figure S6). In total, various works affected 43 site segments (out of 484). Observed earthworks and construction included installing communications cables, sewage works, installing electricity cables, landscaping, road resurfacing, etc. Of all the cases of earthworks and construction documented at the sites, the storage of construction materials and waste on site occurred in 13 site segments (30%), and proper restoration was not carried out in 20 cases (47%). At 20 of the 36 sites, the consequences of such works associated with the formation and transfer of sediment were observed (55%). In total, earthworks and construction in residential areas affects about 9% of the territory. The largest number of segments with the delayed restoration was found in Ekaterinburg (Figure 9). In Tyumen, such sites were not identified at all.

3.8. Gradient

Assessment of the gradient in the surveyed sites showed that on average 56% of the urban landscape has a visible slope and visual signs of stormwater runoff. The smallest proportion of areas with a registered gradient within sites was observed in Nizhniy Novgorod (34%), the largest was in Murmansk (81%), and it was 53–59% in other cities. The presence of the gradient could be associated with the features of the natural landscape and the architectural solutions. In Murmansk, residential neighborhoods are integrated into the existing mountainous terrain of the Murmansk bay region. In Nizhniy Novgorod, the landscape of residential areas is mostly flat, though some of the residential areas are also located on a hilly shore.

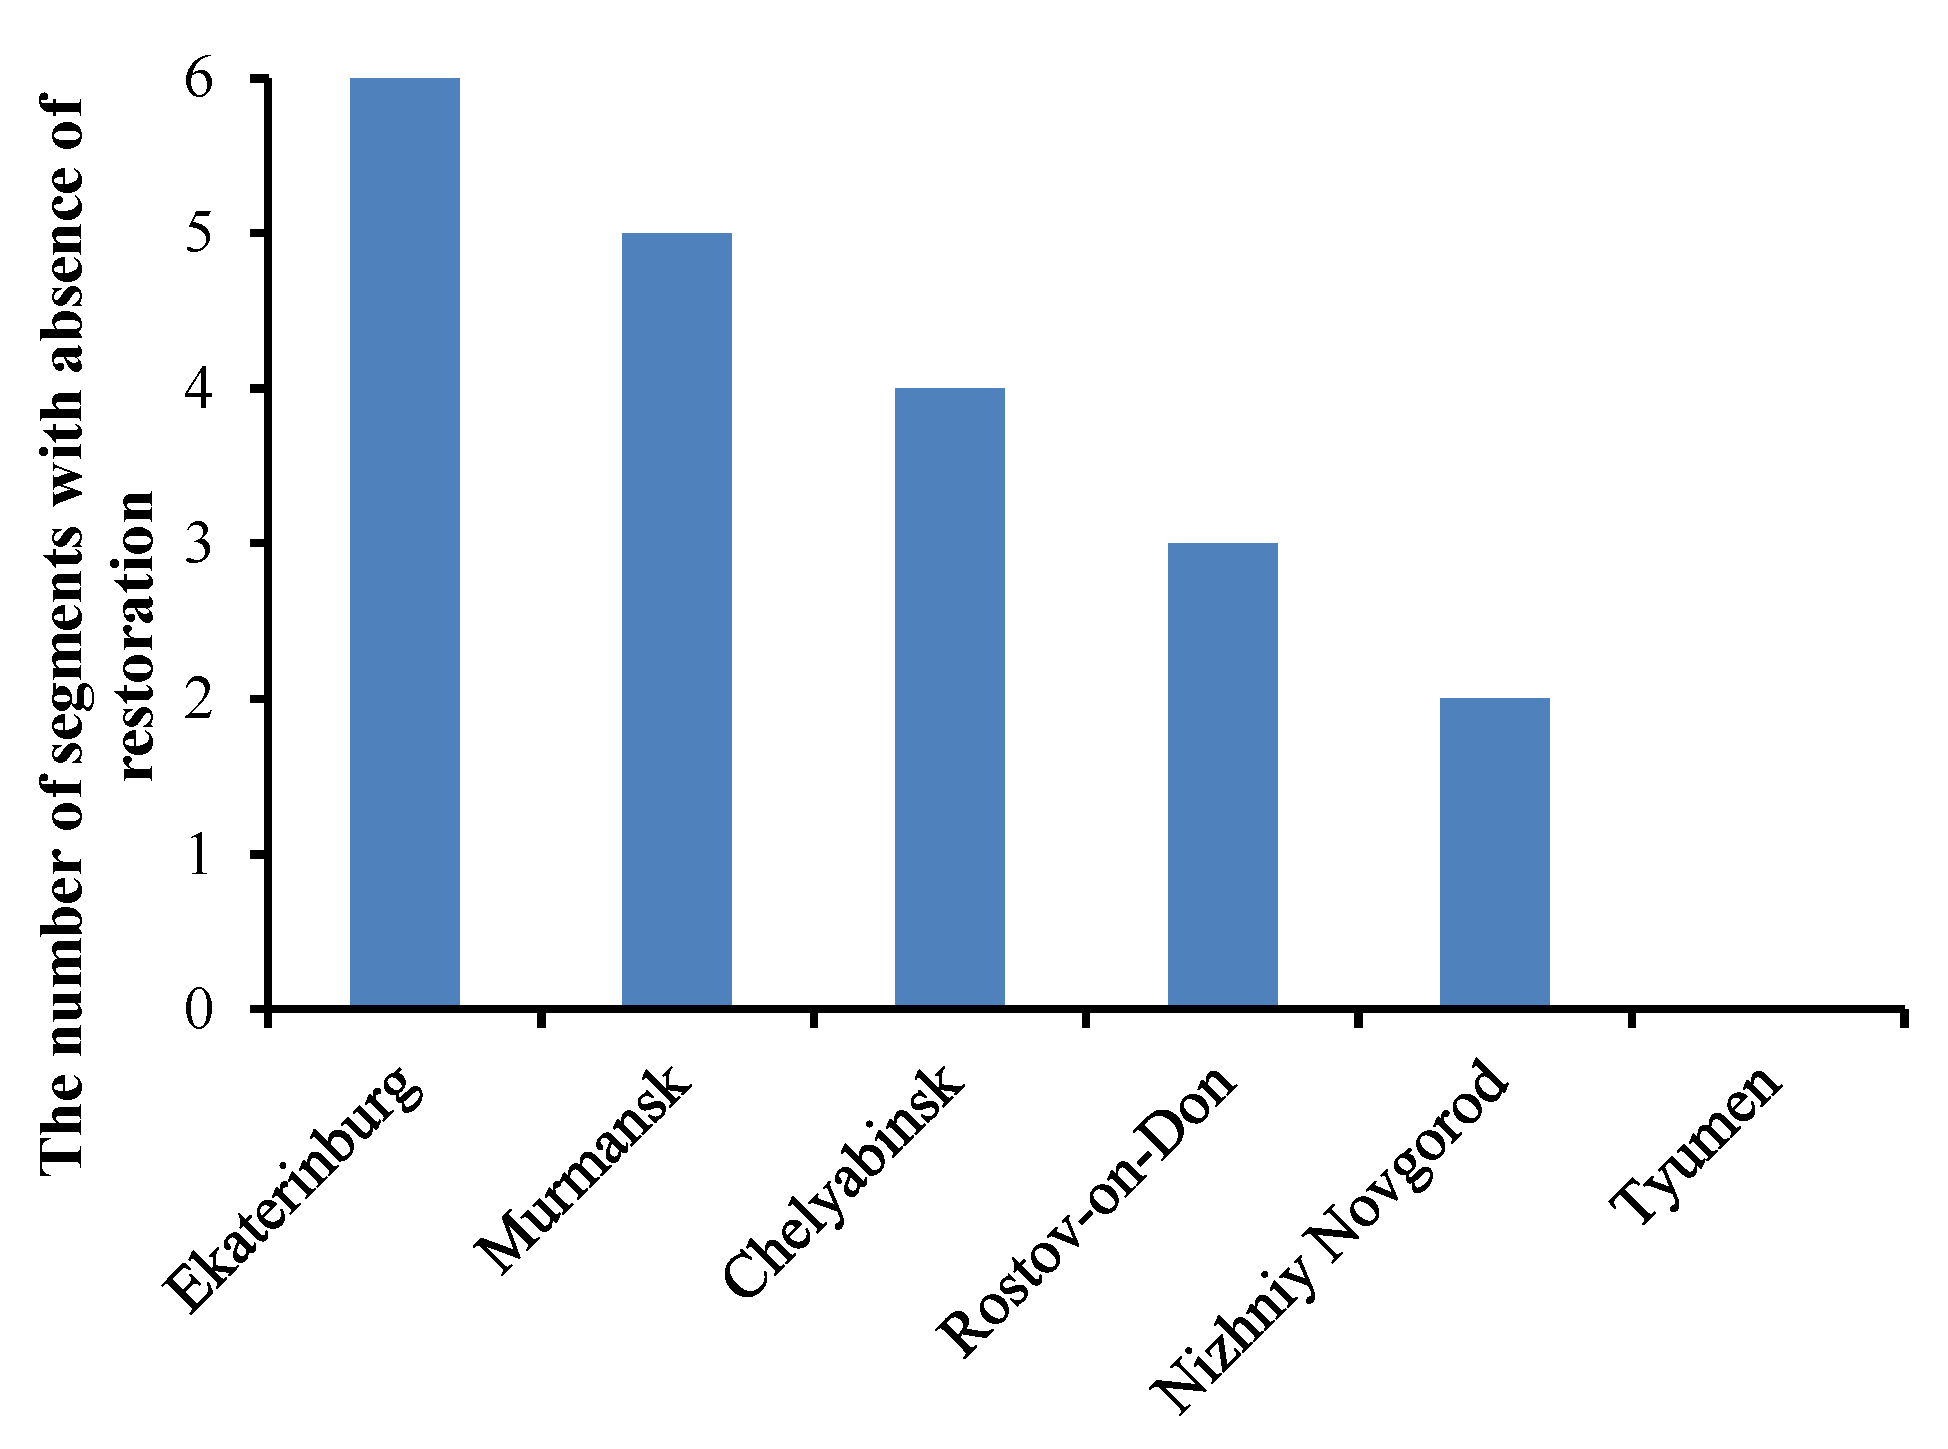
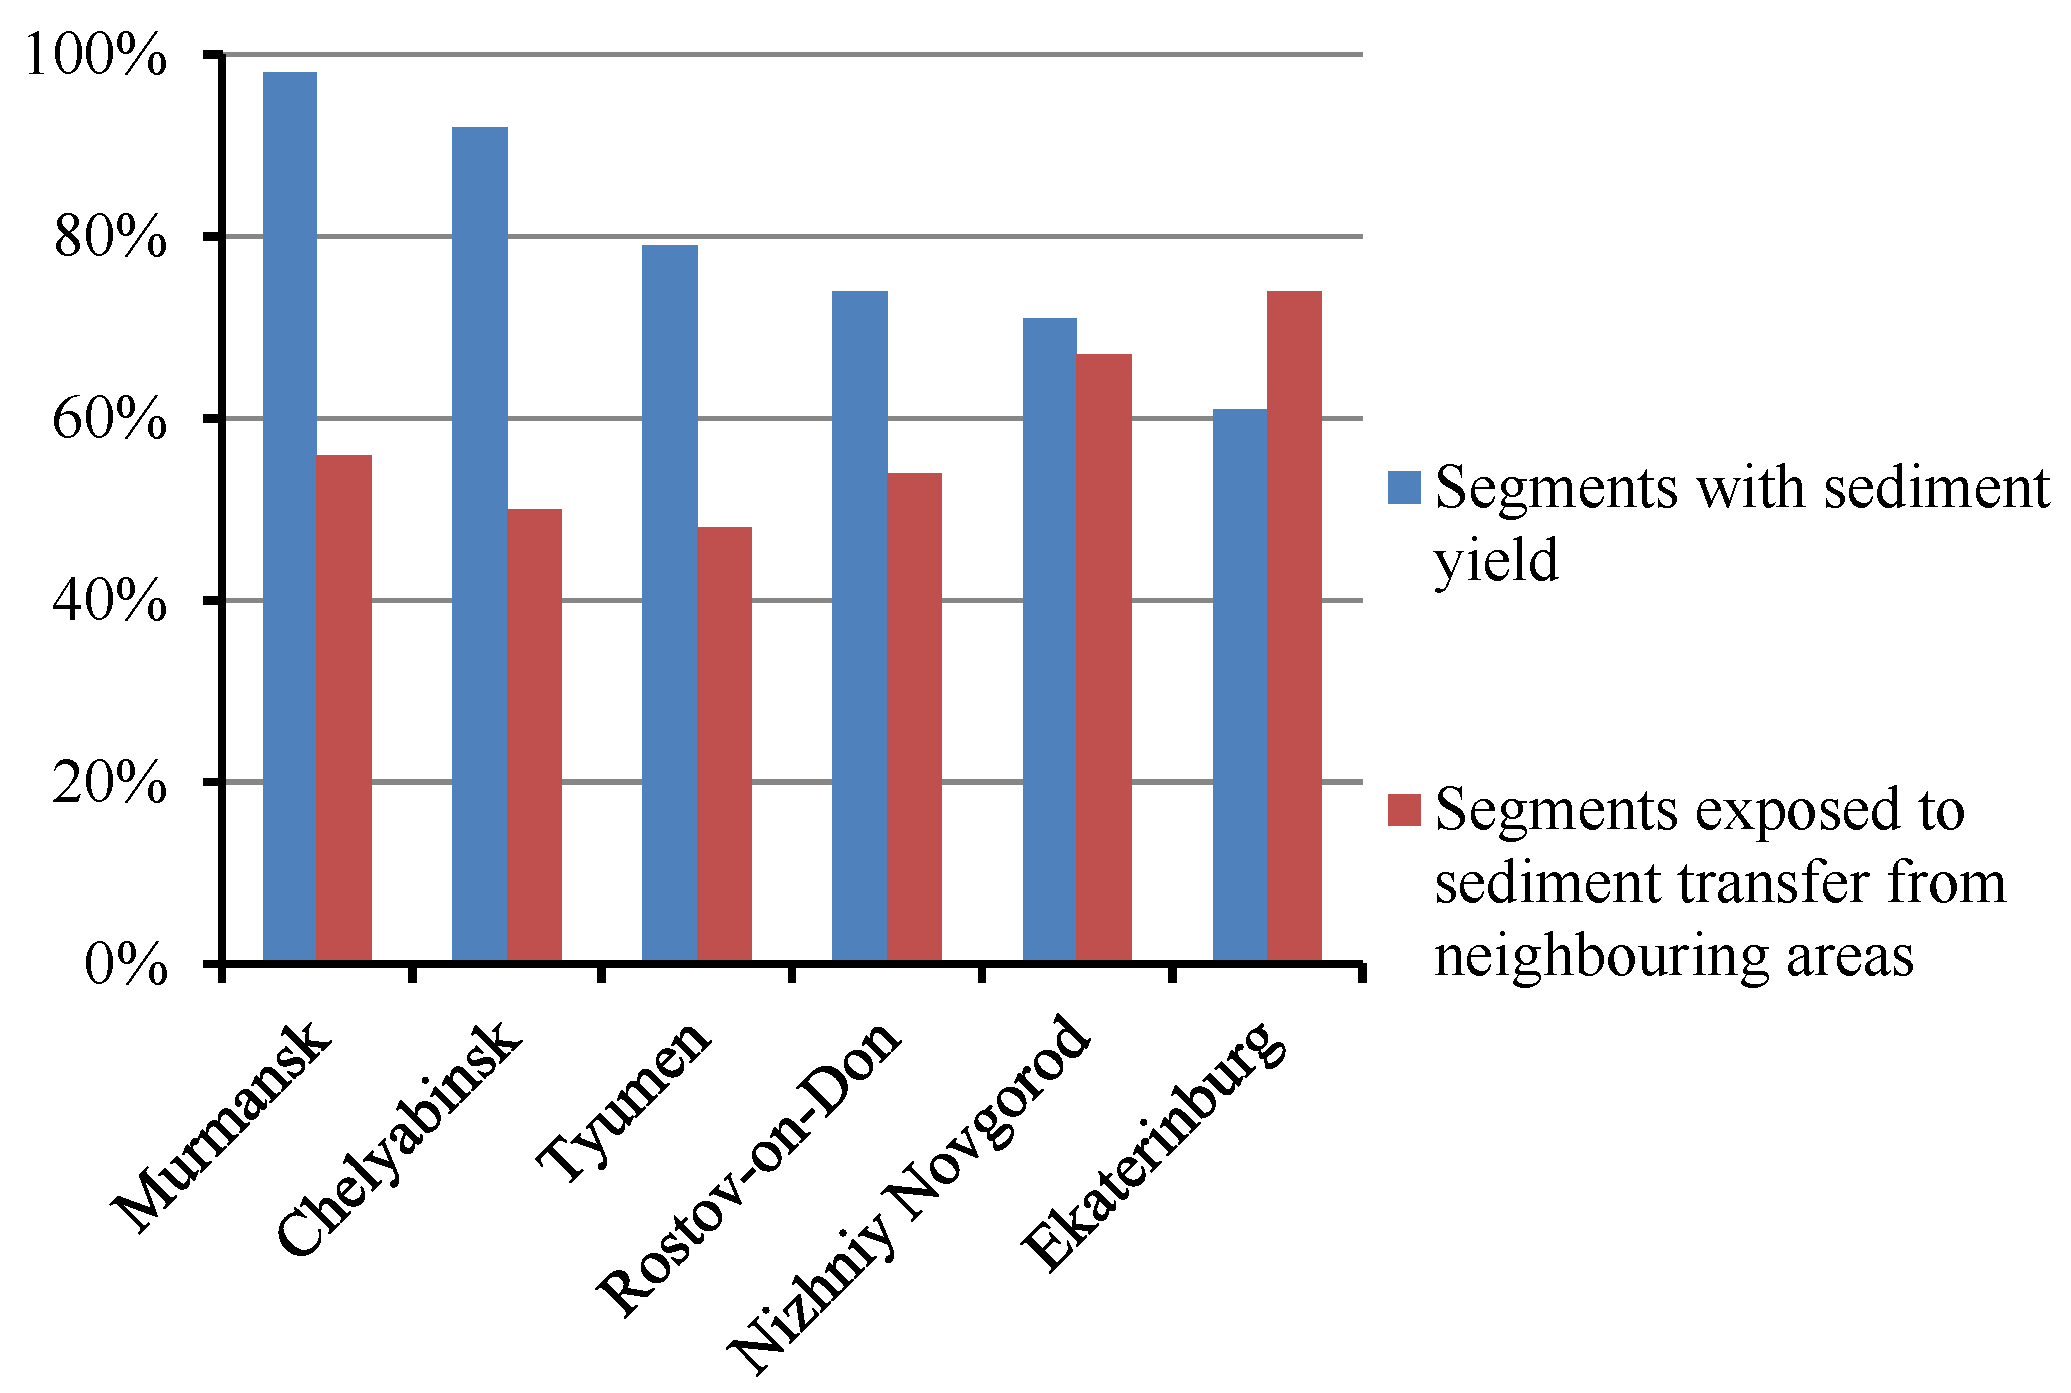
3.9. Sediment Formation and Transport

Where the soil erosion or mechanical destruction due to automobile impact occurred, segments were considered as places of sedimentation formation. As can be seen in Figure 10, the proportion of segments that were sources of sediment material was at least 60% of segments surveyed in all cities. In Murmansk and Chelyabinsk, more than 90% of the segments were sources of sediment. The smallest share of such segments was found in Ekaterinburg (61%).
Sediment connectivity in the urban micro-landscape is characterized by the presence of sediment transfer between neighboring segments of the EURL. As can be seen in Figure 10, at least 48% of the segments were polluted with material transferred from adjacent areas. The maximum proportion of site segments with sediment supply due to transfer from neighboring areas was also found in Ekaterinburg (74%). In total, 430 of 484 site segments (80%) were subject to sediment formation or sediment transport that resulted in pollution of the urban environment with urban sediment.
The transport of deposited sediments together with the removal of degraded soil from places of illegal parking on the wheels of cars to the courtyards, driveways, and streets was noted at 26 of the 36 sites. The vehicles provide transport for sediment in both directions, from courtyards to roads and from roads to courtyards. Another factor of sediment connectivity in the urban landscape is the organization of runoff over landscape and equipment with a drainage system. According to the results of the surveys, courtyards are mostly designed to provide surface runoff without water stagnation. The flow of water is intentionally directed from courtyards to streets, which are usually equipped with municipal drainage systems. Among 36 surveyed sites, considerable water stagnation was observed at one site, and courtyard drainage systems were found at two sites.

4. Discussion

Field surveys of the urban residential environment conducted in six Russian cities revealed factors that significantly impact sediment formation, transport, and sediment surface deposition in residential areas.

4.1. Motor Transport

The landscape survey showed that significant portions of residential blocks, including courtyards, are occupied by motor vehicles. Intensive motorization is a feature of the socio-economic development of the last few decades in Russia. The Russian car parks amounted to 52.4 million units in 2019 with a growth of about 50% in the last decade. Intensive motorization gave rise to a number of urban problems. The city road networks were not designed for the increased traffic, which was also observed in many cities around the world during similar periods of development. Attempts to solve this problem by increasing the role of public transport have not yet yielded the expected results in Russian cities.
The second problem is the lack of parking spaces for an increasing number of cars. Unlike in low-rise residential areas in other regions of the world, parking problems exist not only “near the office,” but also “near homes” in blocks of mid and high-rise buildings during non-working-hours. The survey results confirmed that the high density of automobiles increases sediment formation. By blocks of apartment buildings, not only are roadsides and designated asphalt areas used for parking, but any available piece of land that is not fenced is used as well. Car owners aggressively occupy lawns, sidewalks, playgrounds, and sports grounds.
In three cities—Ekaterinburg, Murmansk, and Nizhniy Novgorod—the largest number of cars per 100 m2 of vehicle infrastructure area (driveways and parking places) inside yards was observed—3.7 parking places, of which 1.1 were illegal. It can be concluded that in the cities of Ekaterinburg, Murmansk, and Nizhniy Novgorod, the existing vehicle zone is almost completely occupied by private vehicle units. In these cities, the landscape experiences the maximum vehicle load—one car per 27 m2 of the transport infrastructure (driveways and parking) of the yard. In the cities of Rostov-on-Don, Tyumen, and Chelyabinsk, there is one vehicle per 43 m2 of vehicle zone of the internal part of the EURL. In these cities, the number of cars parked on lawns, sidewalks, and playgrounds is 3.3 times less (per 100 m2 of the vehicle zone of the courtyard). At the same time, the number of cars parked within the vehicle zone is almost the same in both groups of cities, 2–2.5 parking spaces per 100 m2 of the vehicle zone. It can be assumed that in Rostov-on-Don, Tyumen, and Chelyabinsk, a large proportion of cars are located outside the courtyards in legal parking spaces.
Estimates showed that one car illegally parked on a lawn or sidewalk occupies an area of about 27 m2, taking into account the area necessary for driving. Lawns and sidewalks, places that do not have special cover, are mechanically damaged by the wheels of illegally parked cars. Every fifth car in the courtyard is fully or partially parked on a lawn, sidewalk, or playground. To ensure proper conditions for all the cars currently used in yards, an increase in the area of the vehicle zone by about 30% is required.

4.2. Management—Technical Condition

Poor technical condition of the landscape infrastructure increases the potential for the sediment formation. Attributes of the unsatisfactory technical condition of sidewalks, lawns, curbs, asphalt surfacing of driveways, building structures, and other elements were observed in all cities. These structures are exposed to weathering and the impacts of vehicles, and supply destructive products to the environment. The low technical condition of the green zones contributes to the negative assessment of the urban landscape in all cities as well. The technical condition of the vehicle zones in courtyards is unsatisfactory in most cities.
The technical condition of infrastructure varies significantly across the cities. The reasons for such differences are not precisely established and only to some extent may be related to the size of the municipal budget and climatic conditions.

4.3. Management—Vegetation

The total area occupied by green zones in cities is relatively high, and more than 50% of the area of courtyard spaces belongs to green zones. The presence of large pervious areas allocated for vegetation helps to solve the problem of surface water drainage, which plays an important role in the surface transport of solid sediment and runoff.
The grass cover is the major characteristic of lawns and other pervious surfaces in relation to protection against erosion and mechanical destruction. Given the low average projective grass cover (less than 60% in five cities), the low proportion (about 50%) of lawns with high projective cover, the rare use of cultivated varieties of lawn grasses, and the high proportion of lawns in low light conditions, the quality of lawns in Russian cities was assessed as unsatisfactory. Low projective grass cover and poor technical conditions of the green zone reduce the potential positive effect of green spaces.

4.4. Management—Cleaning

Unsatisfactory cleaning in considerable portions of residential areas leads to low extraction and high deposition of sediment on surfaces with suitable conditions. It turned out that the greatest difference between the cities was observed in the expert assessments of the quality of cleaning, especially on impervious surfaces. Despite the lowest municipal budget per capita, the best cleaning quality was noted in Nizhniy Novgorod. A characteristic feature of all the cities surveyed was the low quality of cleaning of a significant portion of the lawns and other elements of the green zone compared to paved surfaces.

4.5. Earthworks

Approximately 9% each of the green zones and the vehicle zones in the surveyed cities are affected by earthworks and construction. The main factors that pollute the environment with sediment during works are the placement of building materials and excavated soil on the ground and the lack of timely and proper restoration. The disposal of the excavated soil and building materials on the ground without shelter makes the soil and materials susceptible to wash off by runoff and to mechanical transfer on car wheels and biological transport by pedestrians.
The negative impact of earthworks and construction on the environment takes place due to the insufficient application of the principles and standards of environmental management. The introduction of such principles into companies involved in any works in the urban environment is not inspired by municipal authorities.

4.6. Sediment Production

The area of disturbed cover may be considered as an integral factor influencing sediment production in urban areas. This parameter summarizes the area with low projective grass cover, lack of grass cover on pervious surfaces, and poor technical condition of paving. The present study found that about 24% of the surfaces of residential areas are potential sources of solid sediment supply. Assuming erosion of 1 mm/year/m2 of disturbed surfaces on land with a soil density of 2000 kg/m3, sediment supply (all size fractions) in the city may be roughly estimated as 0.5 kg/year/m2. This estimate corresponds to the range of sediment yield in urban areas made in [16]. According to observations, for individual segments with high vehicle load, the layer of soil removed annually may be even larger. In this case, the rough assessment of sediment yield may reach a few kg/year/m2. Earlier, the amount of solid sedimentation material deposited in the urban environment was estimated from the accumulation of solid sediment in snow-dirt sludge in Ekaterinburg [65]. Snow-dirt sludge is a material formed as a result of the mixing of snow and urban sediment through the actions of vehicles’ wheels and pedestrians’ feet. The total amount of urban sediment deposited in residential land use areas in Ekaterinburg was estimated as 320,000 t or 3.2 kg/m2 [65]. This estimate corresponds to the rough assessment of the present study—a few kg/year/m2.
According to an assessment of sediment supply potential, the greater prevalence for sedimentation was observed in the internal courtyard parts of the urban landscape than in the external parts. The courtyard is characterized by a larger disturbed cover area, worse technical condition, lower quality of cleaning, and a larger area of green zones, on which these negative factors are more pronounced. It is also necessary to mention illegal parking on lawns as another negative factor. Higher sediment supply potential of courtyards is to some extent related to principles of responsibilities division between municipal authorities and owners of residential buildings in the Russian Federation.

4.7. Connectivity, Sediment Transport

In the framework of the present study, it is possible to qualitatively assess the sediment connectivity in the EURL by the number of segments exposed to contamination due to sediment transfer from neighboring areas. The sediment connectivity in the EURL can be considered as high, since about half of the segments have a significant gradient and half of the segments are contaminated due to sediment transport. In some cities, the number of segments contaminated due to migration is approximately equal to or greater than the number of segments in which sediment is produced. The largest numbers of segments subject to supply from neighboring areas were observed in the cities of Ekaterinburg and Nizhniy Novgorod, in which the largest number of parked cars per unit area of EURL was recorded. Thus, it can be assumed that motor transport plays an active role in migration and increasing landscape connectivity in the urban environment in addition to sediment wash off. Taking into account the directions of traffic flow and stormwater runoff, the sediment cascade is formed; it carries sediment outside the courtyards into the road network. The connection of the elements of the urban landscape into a single sediment cascade, which forms the urban landscape catena, is determined both by the slope gradient and mechanical sediment transport.

4.8. Representativeness of the Study

The total area surveyed in six cities was about 370,000 m2 (including the area of residential buildings), which is approximately equal to the area of a small town such as Monte Carlo. At the same time, this area does not exceed 0.5% of the total residential area in Ekaterinburg alone. The representativeness of this study is enhanced by the fact that the most typical residential blocks of each city were considered when choosing the sites. The total perimeter of the site segments, i.e., the approximate route covered by the researchers during the surveys, which was about 50 km, also characterizes the size of the study.
During the Soviet era, standardized construction methods and regulatory approaches were applied throughout the country, which contributed to the homogeneity of the urban landscape in different cities. After the collapse of the USSR and changes in socio-economic policies, tenants of municipal housing were allowed to privatize their units with responsibility for managing adjacent courtyards. Homeowners of flats in multi-household residences cooperatively hire service organizations that maintain entire blocks of houses. The state partly continues to control and regulate the municipal service sphere, promoting common standards. Thus, the urban landscape remains relatively homogeneous and the results of the landscape surveys in the six cities can be considered representative for all major cities in Russia.
The study included cities located in various climatic zones. For urban studies in Russia, it is important to reflect the change in climatic conditions from south to north and from west to east. In the current study, the first vector is represented by the axis Rostov-on-Don–Nizhniy Novgorod–Murmansk, and the second, Nizhniy Novgorod–Ekaterinburg/Chelyabinsk–Tyumen. When comparing the survey results in different cities, it is necessary to take into account the effects of local climatic factors.
A landscape survey of Russian cities was carried out in the warm season. When analyzing the data obtained, it is necessary to take into account the significant seasonality of meteorological conditions in Russia. In all the cities surveyed, in winter the temperature is below zero degrees Celsius. In all cities except Rostov-on-Don, months-long snow cover is established. In the winter period, factors affecting sedimentation processes are significantly modified. Some aspects of sedimentation processes in an urban environment in the winter were presented in recent works [65,79].
It is appropriate to develop a model of a typical EURL for a Russian city. Table 2 shows the main parameters of EURL model according to the results of the present study, which are partly demonstrated in Figure 3 as well. By consecutively stacking the model units of external and internal parts of the elementary landscape to model blocks, microrayons, and an entire city, such a model can be used for various purposes in land use studies, estimates of sediment yield, and sediment accumulation at various scales. In particular, modeling of the sediment yield and dust dispersion in the urban environment may be performed by applying some specific coefficients in different segments. Such coefficients should take into account both the natural processes and the anthropogenic activity’s influence on the sedimentation. The EURL model can be used to verify the results of urban research that can be performed using remote sensing methods as well.

4.9. Limitations of the Study

There are several of limitations and sources of uncertainty that could be taken into account to evaluate the obtained results. The study was conducted within the residential areas of the cities, and other land uses were not considered. At the same time, industrial and commercial land uses occupy a significant proportion of the urban territories and contribute to the urban sediment supply. Sediment formation and transport in the city, as a complex system, has to be studied in all specific urban landscapes. The field observations in this study were based in part on expert assessments of some landscape characteristics and indicators that are not free from subjectivity. While attempts to achieve the consistency of results of the field observations in different cities were undertaken, difficulties likely will arise when comparing with the work of other researchers in other regions of the world.
The urban landscape in this study was intentionally considered as a constant, non-dynamic system. This is not true. Two types of temporal variation of the urban landscape should not be missed for a more comprehensive understanding of the natural and anthropogenic influences on the sediment cascade. The first one is seasonality, which is a significant modifying factor. In the case of the northern cities, the snow cover interacts with urban sediment and inevitably transforms the erosion, transport, and depositional processes during cold winters [79]. Seasonality is an important factor determining an increase in surface runoff and sediment transport during the springtime melt [80]. In this study, the observations were made during the summer and early autumn, when soil erosion is not hidden by snow cover, and sediment transport is not restrained. It could be taken into account that the characteristics of recognized influencing factors may change throughout the year. The second type consists of permanent changes to the urban landscape and land cover in course of time. In order to study the effects of the long-term transformation of urban areas, repetitive monitoring for several years is required.

5. Conclusions

According to the results of the present study, the formation of sediment in the urban environment is a complex process involving the interaction of various natural and anthropogenic physical processes. The life cycle of the urban sediment starts with soil erosion and mechanical destruction and continues with the removal of degraded soil by wind, runoff, car wheels, and pedestrians. Significant storage of surface sediment in the urban environment may occur due to low removal rate. The following main groups of factors have significant impacts on sediment supply, transport, and deposition in residential areas of Russian cities: low adaptation of residential areas’ infrastructure to the high density of automobiles, unsatisfactory municipal services, and bad environmental management in the course of construction and earthworks. The significant impact of motor vehicles in the urban environment includes mechanical sediment transport that sharply increases the sediment connectivity within the urban landscape. Results of the study approve negative trends in urban sedimentation caused by the mismatch between the current level of urban planning and management and the needs of residents in a high-quality environment in growing cities that can arise in different regions of the world.

Supplementary Materials

The following are available online at https://www.mdpi.com/2073-4433/11/12/1320/s1. Figure S1: Example of a vehicle zone (all photos were taken during the field survey). Figure S2: Examples of illegal parking on lawns and playgrounds. Figure S3: Examples of disturbed cover from illegal parking (left) and damaged driveway (right). Figure S4: Example of low grass projective cover. Figure S5: Examples of segments with negative grades of cleaning (left) and technical condition (right). Figure S6: Example of delayed restoration after earthwork.

Author Contributions

Conceptualization, I.Y. and A.S.; methodology, I.Y. and G.M.; formal analysis, I.Y. and G.M.; field study, I.Y., G.M., E.B., and A.S.; data curation, G.M.; writing—original draft preparation, I.Y. and G.M.; writing—review and editing, E.B. and A.S.; visualization, I.Y. and G.M.; supervision, I.Y.; project administration, A.S.; funding acquisition, A.S. All authors have read and agreed to the published version of the manuscript.

Funding

The study was supported by Russian Science Foundation (grant number 18-77-10024).

Conflicts of Interest

The authors declare no conflict of interest.

References

  1. Chin, A.; Beach, T.; Luzzadder-Beach, S.; Solecki, W.D. Challenges of the “Anthropocene”. Anthropocene 2017, 20, 1–3. [Google Scholar] [CrossRef]
  2. Ford, J.R.; Price, S.J.; Cooper, A.H.; Waters, C.N. An assessment of lithostratigraphy for anthropogenic deposits. Geol. Soc. Lond. Spec. Publ. 2014, 395, 55–89. [Google Scholar] [CrossRef] [Green Version]
  3. Waters, C.N.; Zalasiewicz, J.; Summerhayes, C.; Barnosky, A.D.; Poirier, C.; Galuszka, A.; Cearreta, A.; Edgeworth, M.; Ellis, E.C.; Ellis, M.; et al. The Anthropocene is functionally and stratigraphically distinct from the Holocene. Science 2016, 351, aad2622. [Google Scholar] [CrossRef]
  4. Gerten, C.; Fina, S.; Rusche, K. The Sprawling Planet: Simplifying the Measurement of Global Urbanization Trends. Front. Environ. Sci. 2019, 7, 140. [Google Scholar] [CrossRef]
  5. Kosheleva, N.E.; Vlasov, D.V.; Korlyakov, I.D.; Kasimov, N.S. Contamination of urban soils with heavy metals in Moscow as affected by building development. Sci. Total Environ. 2018, 636, 854–863. [Google Scholar] [CrossRef]
  6. Tresch, S.; Moretti, M.; Le Bayon, R.-C.; Mäder, P.; Zanetta, A.; Frey, D.; Stehle, B.; Kuhn, A.; Munyangabe, A.; Fliessbach, A. Urban Soil Quality Assessment—A Comprehensive Case Study Dataset of Urban Garden Soils. Front. Environ. Sci. 2018, 6, 136. [Google Scholar] [CrossRef]
  7. Konstantinova, E.; Minkina, T.; Sushkova, S.; Konstantinov, A.; Rajput, V.D.; Sherstnev, A. Urban soil geochemistry of an intensively developing Siberian city: A case study of Tyumen, Russia. J. Environ. Manag. 2019, 239, 366–375. [Google Scholar] [CrossRef]
  8. Poeppl, R.E.; Keesstra, S.D.; Maroulis, J. A conceptual connectivity framework for understanding geomorphic change in human-impacted fluvial systems. Geomorphology 2017, 277, 237–250. [Google Scholar] [CrossRef]
  9. Chambers, L.G.; Chin, Y.-P.; Filippelli, G.M.; Gardner, C.B.; Herndon, E.M.; Long, D.T.; Lyons, W.B.; MacPherson, G.L.; McElmurry, S.P.; McLean, C.E.; et al. Developing the scientific framework for urban geochemistry. Appl. Geochem. 2016, 67, 1–20. [Google Scholar] [CrossRef]
  10. Muthusamy, M.; Tait, S.; Schellart, A.; Beg, M.N.A.; Carvalho, R.F.; de Lima, J.L.M.P. Improving understanding of the underlying physical process of sediment wash-off from urban road surfaces. J. Hydrol. 2018, 557, 426–433. [Google Scholar] [CrossRef]
  11. Taylor, K. Urban environments. In Environmental Sedimentology; Perry, C., Taylor, K., Eds.; Wiley-Blackwell: Hoboken, NJ, USA, 2007; pp. 190–222. [Google Scholar]
  12. Russell, K.L.; Vietz, G.J.; Fletcher, T.D. Urban sediment supply to streams from hillslope sources. Sci. Total Environ. 2019, 653, 684–697. [Google Scholar] [CrossRef] [PubMed]
  13. Pickett, S.T.A.; Cadenasso, M.L.; Grove, J.M.; Boone, C.G.; Groffman, P.M.; Irwin, E.; Kaushal, S.S.; Marshall, V.; McGrath, B.; Nilon, C.H.; et al. Urban ecological systems: Scientific foundations and a decade of progress. J. Environ. Manag. 2011, 92, 331–362. [Google Scholar] [CrossRef] [PubMed]
  14. Platt, R.H. The ecological city: Introduction and overview. In The Ecological City: Preserving and Restoring Urban Biodiversity; Platt, R.H., Rowntree, R.A., Muick, P.C., Eds.; University of Massachusetts Press: Amherst, MA, USA, 1994; pp. 1–17. [Google Scholar]
  15. Chin, A. Urban transformation of river landscapes in a global context. Geomorphology 2006, 79, 460–487. [Google Scholar] [CrossRef]
  16. Russell, K.L.; Vietz, G.J.; Fletcher, T.D. Global sediment yields from urban and urbanizing watersheds. Earth Sci. Rev. 2017, 168, 73–80. [Google Scholar] [CrossRef]
  17. Taylor, K.G.; Owens, P.N. Sediments in urban river basins: A review of sediment–contaminant dynamics in an environmental system conditioned by human activities. J. Soils Sediments 2009, 9, 281–303. [Google Scholar] [CrossRef]
  18. Seleznev, A.A.; Yarmoshenko, I.V.; Malinovsky, G.P. Urban geochemical changes and pollution with potentially harmful elements in seven Russian cities. Sci. Rep. 2020, 10, 1668. [Google Scholar] [CrossRef]
  19. Sutherland, R.A. Lead in grain size fractions of road-deposited sediment. Environ. Pollut. 2003, 121, 229–237. [Google Scholar] [CrossRef]
  20. Padoan, E.; Romè, C.; Ajmone-Marsan, F. Bioaccessibility and size distribution of metals in road dust and roadside soils along a peri-urban transect. Sci. Total Environ. 2017, 601–602, 89–98. [Google Scholar] [CrossRef]
  21. Adamiec, E.; Jarosz-Krzemińska, E. Human Health Risk Assessment associated with contaminants in the finest fraction of sidewalk dust collected in proximity to trafficked roads. Sci. Rep. 2019, 9, 16364. [Google Scholar] [CrossRef]
  22. Townsend, K.R.; Lu, H.-C.; Sharley, D.J.; Pettigrove, V. Associations between microplastic pollution and land use in urban wetland sediments. Environ. Sci. Pollut. Res. 2019, 26, 22551–22561. [Google Scholar] [CrossRef]
  23. Marshall, S.; Sharley, D.; Jeppe, K.; Sharp, S.; Rose, G.; Pettigrove, V. Potentially Toxic Concentrations of Synthetic Pyrethroids Associated with Low Density Residential Land Use. Front. Environ. Sci. 2016, 4, 75. [Google Scholar] [CrossRef]
  24. Froger, C.; Ayrault, S.; Evrard, O.; Monvoisin, G.; Bordier, L.; Lefèvre, I.; Quantin, C. Tracing the sources of suspended sediment and particle-bound trace metal elements in an urban catchment coupling elemental and isotopic geochemistry, and fallout radionuclides. Environ. Sci. Pollut. Res. 2018, 25, 28667–28681. [Google Scholar] [CrossRef] [PubMed] [Green Version]
  25. Zhu, Y.; Huang, L.; Li, J.; Ying, Q.; Zhang, H.; Liu, X.; Liao, H.; Li, N.; Liu, Z.; Mao, Y.; et al. Sources of particulate matter in China: Insights from source apportionment studies published in 1987–2017. Environ. Int. 2018, 115, 343–357. [Google Scholar] [CrossRef] [PubMed]
  26. Owens, P.N.; Blake, W.H.; Gaspar, L.; Gateuille, D.; Koiter, A.J.; Lobb, D.A.; Petticrew, E.; Reiffarth, D.; Smith, H.; Woodward, J. Fingerprinting and tracing the sources of soils and sediments: Earth and ocean science, geoarchaeological, forensic, and human health applications. Earth Sci. Rev. 2016, 162, 1–23. [Google Scholar] [CrossRef] [Green Version]
  27. Alves, C.A.; Evtyugina, M.; Vicente, A.M.P.; Vicente, E.D.; Nunes, T.V.; Silva, P.M.A.; Duarte, M.; Pio, C.; Amato, F.; Querol, X. Chemical profiling of PM10 from urban road dust. Sci. Total Environ. 2018, 634, 41–51. [Google Scholar] [CrossRef] [PubMed]
  28. Chen, S.; Zhang, X.; Lin, J.; Huang, J.; Zhao, D.; Yuan, T.; Huang, K.; Luo, Y.; Jia, Z.; Zang, Z.; et al. Fugitive Road Dust PM2.5 Emissions and Their Potential Health Impacts. Environ. Sci. Technol. 2019, 53, 8455–8465. [Google Scholar] [CrossRef] [PubMed] [Green Version]
  29. Landrigan, P.J.; Fuller, R.; Acosta, N.J.R.; Adeyi, O.; Arnold, R.; Basu, N.; Baldé, A.B.; Bertollini, R.; Bose-O’Reilly, S.; Boufford, J.I.; et al. The Lancet Commission on pollution and health. Lancet 2018, 391, 462–512. [Google Scholar] [CrossRef] [Green Version]
  30. Cohen, A.J.; Brauer, M.; Burnett, R.; Anderson, H.R.; Frostad, J.; Estep, K.; Balakrishnan, K.; Brunekreef, B.; Dandona, L.; Dandona, R. Estimates and 25-year trends of the global burden of disease attributable to ambient air pollution: An analysis of data from the Global Burden of Diseases Study 2015. Lancet 2017, 389, 1907–1918. [Google Scholar] [CrossRef] [Green Version]
  31. WHO. Review of Evidence on Health Aspects of Air Pollution–REVIHAAP Project: Final Technical Report; The WHO European Centre for Environment and Health: Bonn, Switzerland, 2013. [Google Scholar]
  32. Alghamdi, M.A.; Shamy, M.; Redal, M.A.; Khoder, M.; Awad, A.H.; Elserougy, S. Microorganisms associated particulate matter: A preliminary study. Sci. Total Environ. 2014, 479–480, 109–116. [Google Scholar] [CrossRef]
  33. Groulx, N.; Urch, B.; Duchaine, C.; Mubareka, S.; Scott, J.A. The Pollution Particulate Concentrator (PoPCon): A platform to investigate the effects of particulate air pollutants on viral infectivity. Sci. Total Environ. 2018, 628–629, 1101–1107. [Google Scholar] [CrossRef]
  34. Qin, N.; Liang, P.; Wu, C.; Wang, G.; Xu, Q.; Xiong, X.; Wang, T.; Zolfo, M.; Segata, N.; Qin, H.; et al. Longitudinal survey of microbiome associated with particulate matter in a megacity. Genome Biol. 2020, 21, 55. [Google Scholar] [CrossRef] [PubMed] [Green Version]
  35. Acosta-Martínez, V.; Van Pelt, S.; Moore-Kucera, J.; Baddock, M.C.; Zobeck, T.M. Microbiology of wind-eroded sediments: Current knowledge and future research directions. Aeolian Res. 2015, 18, 99–113. [Google Scholar] [CrossRef] [Green Version]
  36. Gardner, T.; Acosta-Martinez, V.; Calderón, F.J.; Zobeck, T.M.; Baddock, M.; Van Pelt, R.S.; Senwo, Z.; Dowd, S.; Cox, S. Pyrosequencing Reveals Bacteria Carried in Different Wind-Eroded Sediments. J. Environ. Qual. 2012, 41, 744–753. [Google Scholar] [CrossRef]
  37. Hui, N.; Parajuli, A.; Puhakka, R.; Grönroos, M.; Roslund, M.I.; Vari, H.K.; Selonen, V.A.; Yan, G.; Siter, N.; Nurminen, N.; et al. Temporal variation in indoor transfer of dirt-associated environmental bacteria in agricultural and urban areas. Environ. Int. 2019, 132, 105069. [Google Scholar] [CrossRef] [PubMed]
  38. Hong, K.Y.; King, G.H.; Saraswat, A.; Henderson, S.B. Seasonal ambient particulate matter and population health outcomes among communities impacted by road dust in British Columbia, Canada. J. Air Waste Manag. Assoc. 2017, 67, 986–999. [Google Scholar] [CrossRef] [Green Version]
  39. Sevilla, A.; Rodríguez, M.L.; García-Maraver, Á.; Zamorano, M. An index to quantify street cleanliness: The case of Granada (Spain). Waste Manag. 2013, 33, 1037–1046. [Google Scholar] [CrossRef]
  40. Yuen, J.Q.; Olin, P.H.; Lim, H.S.; Benner, S.G.; Sutherland, R.A.; Ziegler, A.D. Accumulation of potentially toxic elements in road deposited sediments in residential and light industrial neighborhoods of Singapore. J. Environ. Manag. 2012, 101, 151–163. [Google Scholar] [CrossRef]
  41. Russell, K.L.; Vietz, G.J.; Fletcher, T.D. A suburban sediment budget: Coarse-grained sediment flux through hillslopes, stormwater systems and streams. Earth Surf. Process. Landf. 2019, 44, 2600–2614. [Google Scholar] [CrossRef]
  42. Butler, D.; Davies, J.W. Urban. Drainage, 3rd ed.; Spon Press: London, UK, 2011. [Google Scholar]
  43. Murakami, M.; Fujita, M.; Furumai, H.; Kasuga, I.; Kurisu, F. Sorption behavior of heavy metal species by soakaway sediment receiving urban road runoff from residential and heavily trafficked areas. J. Hazard. Mater. 2009, 164, 707–712. [Google Scholar] [CrossRef]
  44. Knox, E.G.; Bouchard, C.E.; Barrett, J.G. Erosion and Sedimentation in Urban Areas. In Agronomy Monographs; American Society of Agronomy; Crop Science Society of America; Soil Science Society of America: Madison, WI, USA, 2015; pp. 179–197. [Google Scholar]
  45. Hewett, C.J.M.; Simpson, C.; Wainwright, J.; Hudson, S. Communicating risks to infrastructure due to soil erosion: A bottom-up approach. Land Degrad. Dev. 2018, 29, 1282–1294. [Google Scholar] [CrossRef] [Green Version]
  46. Volpov, E.; Kishcha, P. An advanced technique for outdoor insulation pollution mapping in the israel electric company power grid. IEEE Trans. Dielectr. Electr. Insul. 2017, 24, 3539–3548. [Google Scholar] [CrossRef]
  47. Jain, M.K.; Kothyari, U.C. Estimation of soil erosion and sediment yield using GIS. Hydrol. Sci. J. 2000, 45, 771–786. [Google Scholar] [CrossRef] [Green Version]
  48. Bhattarai, R.; Dutta, D. Estimation of Soil Erosion and Sediment Yield Using GIS at Catchment Scale. Water Resour. Manag. 2006, 21, 1635–1647. [Google Scholar] [CrossRef]
  49. Fryirs, K. (Dis) Connectivity in catchment sediment cascades: A fresh look at the sediment delivery problem. Earth Surf. Process. Landforms 2012, 38, 30–46. [Google Scholar] [CrossRef]
  50. Walling, D.E. The sediment delivery problem. J. Hydrol. 1983, 65, 209–237. [Google Scholar] [CrossRef]
  51. Wohl, E.; Brierley, G.; Cadol, D.; Coulthard, T.J.; Covino, T.; Fryirs, K.A.; Grant, G.; Hilton, R.G.; Lane, S.N.; Magilligan, F.J.; et al. Connectivity as an emergent property of geomorphic systems. Earth Surf. Process. Landf. 2018, 44, 4–26. [Google Scholar] [CrossRef]
  52. Mahoney, D.T.; Fox, J.F.; Al Aamery, N. Watershed erosion modeling using the probability of sediment connectivity in a gently rolling system. J. Hydrol. 2018, 561, 862–883. [Google Scholar] [CrossRef]
  53. Heckmann, T.; Cavalli, M.; Cerdan, O.; Foerster, S.; Javaux, M.; Lode, E.; Smetanová, A.; Vericat, D.; Brardinoni, F. Indices of sediment connectivity: Opportunities, challenges and limitations. Earth Sci. Rev. 2018, 187, 77–108. [Google Scholar] [CrossRef] [Green Version]
  54. Borselli, L.; Cassi, P.; Torri, D. Prolegomena to sediment and flow connectivity in the landscape: A GIS and field numerical assessment. Catena 2008, 75, 268–277. [Google Scholar] [CrossRef]
  55. Ferreira, C.S.S.; Walsh, R.P.D.; Ferreira, A.J.D. Degradation in urban areas. Curr. Opin. Environ. Sci. Health 2018, 5, 19–25. [Google Scholar] [CrossRef] [Green Version]
  56. Santikari, V.P.; Murdoch, L.C. Effects of construction-related land use change on streamflow and sediment yield. J. Environ. Manag. 2019, 252, 109605. [Google Scholar] [CrossRef] [PubMed]
  57. Perez, M.A.; Zech, W.C.; Donald, W.N.; Turochy, R.; Fagan, B.G. Transferring Innovative Erosion and Sediment Control Research Results into Industry Practice. Water 2019, 11, 2549. [Google Scholar] [CrossRef] [Green Version]
  58. Yoon, B.; Woo, H. Sediment Problems in Korea. J. Hydraul. Eng. 2000, 126, 486–491. [Google Scholar] [CrossRef]
  59. Yan, H.; Ding, G.; Feng, K.; Zhang, L.; Li, H.; Wang, Y.; Wu, T. Systematic evaluation framework and empirical study of the impacts of building construction dust on the surrounding environment. J. Clean. Prod. 2020, 275, 122767. [Google Scholar] [CrossRef]
  60. Perez, M.A.; Zech, W.C.; Donald, W.N.; Fang, X. Design Methodology for the Selection of Temporary Erosion and Sediment Control Practices Based on Regional Hydrological Conditions. J. Hydrol. Eng. 2016, 21, 05016001. [Google Scholar] [CrossRef]
  61. Ercoli, R.F.; Matias, V.R.S.; Zago, V.C.P. Urban Expansion and Erosion Processes in an Area of Environmental Protection in Nova Lima, Minas Gerais State, Brazil. Front. Environ. Sci. 2020, 8, 52. [Google Scholar] [CrossRef]
  62. Pitt, R.E.; Williamson, D.; Voorhees, J.; Clark, S.; Harrisburg, P.S. Review of Historical Street Dust and Dirt Accumulation and Washoff Data. JWMM 2005. [Google Scholar] [CrossRef] [Green Version]
  63. Zafra, C.A.; Temprano, J.; Tejero, I. Particle size distribution of accumulated sediments on an urban road in rainy weather. Environ. Technol. 2008, 29, 571–582. [Google Scholar] [CrossRef]
  64. Gustafsson, M.; Blomqvist, G.; Järlskog, I.; Lundberg, J.; Janhäll, S.; Elmgren, M.; Johansson, C.; Norman, M.; Silvergren, S. Road dust load dynamics and influencing factors for six winter seasons in Stockholm, Sweden. Atmos. Environ. X 2019, 2, 100014. [Google Scholar] [CrossRef]
  65. Seleznev, A.A.; Yarmoshenko, I.V.; Malinovsky, G.P. Assessment of Total Amount of Surface Sediment in Urban Environment Using Data on Solid Matter Content in Snow-Dirt Sludge. Environ. Process. 2019, 6, 581–595. [Google Scholar] [CrossRef]
  66. Hong, N.; Guan, Y.; Yang, B.; Zhong, J.; Zhu, P.; Ok, Y.S.; Hou, D.; Tsang, D.C.; Guan, Y.; Liu, A. Quantitative source tracking of heavy metals contained in urban road deposited sediments. J. Hazard. Mater. 2020, 393, 122362. [Google Scholar] [CrossRef] [PubMed]
  67. Guo, L.; Luo, J.; Yuan, M.; Huang, Y.; Shen, H.; Li, T. The influence of urban planning factors on PM2.5 pollution exposure and implications: A case study in China based on remote sensing, LBS, and GIS data. Sci. Total Environ. 2019, 659, 1585–1596. [Google Scholar] [CrossRef] [PubMed]
  68. Fan, S.; Li, X.; Dong, L. Field assessment of the effects of land-cover type and pattern on PM10 and PM2.5 concentrations in a microscale environment. Environ. Sci. Pollut. Res. 2018, 26, 2314–2327. [Google Scholar] [CrossRef] [PubMed]
  69. Cook, E.M.; Hall, S.J.; Larson, K.L. Residential landscapes as social-ecological systems: A synthesis of multi-scalar interactions between people and their home environment. Urban. Ecosyst. 2011, 15, 19–52. [Google Scholar] [CrossRef]
  70. Cadenasso, M.L.; Pickett, S.T.A.; Schwarz, K. Spatial heterogeneity in urban ecosystems: Reconceptualizing land cover and a framework for classification. Front. Ecol. Environ. 2007, 5, 80–88. [Google Scholar] [CrossRef]
  71. Ziter, C.D.; Pedersen, E.J.; Kucharik, C.J.; Turner, M.G. Scale-dependent interactions between tree canopy cover and impervious surfaces reduce daytime urban heat during summer. Proc. Natl. Acad. Sci. USA 2019, 116, 7575–7580. [Google Scholar] [CrossRef] [Green Version]
  72. Zhang, A.; Xia, C.; Chu, J.; Lin, J.; Li, W.; Wu, J. Portraying urban landscape: A quantitative analysis system applied in fifteen metropolises in China. Sustain. Cities Soc. 2019, 46, 101396. [Google Scholar] [CrossRef]
  73. Rioux, J.-F.; Cimon-Morin, J.; Pellerin, S.; Alard, D.; Poulin, M. How Land Cover Spatial Resolution Affects Mapping of Urban Ecosystem Service Flows. Front. Environ. Sci. 2019, 7, 93. [Google Scholar] [CrossRef]
  74. Bogdan, S.-M.; Pătru-Stupariu, I.; Zaharia, L. The Assessment of Regulatory Ecosystem Services: The Case of the Sediment Retention Service in a Mountain Landscape in the Southern Romanian Carpathians. Procedia Environ. Sci. 2016, 32, 12–27. [Google Scholar] [CrossRef] [Green Version]
  75. Apitz, S.E. Conceptualizing the role of sediment in sustaining ecosystem services: Sediment-ecosystem regional assessment (SEcoRA). Sci. Total Environ. 2012, 415, 9–30. [Google Scholar] [CrossRef]
  76. Russell, K.L.; Vietz, G.J.; Fletcher, T.D. Urban catchment runoff increases bedload sediment yield and particle size in stream channels. Anthropocene 2018, 23, 53–66. [Google Scholar] [CrossRef]
  77. Cui, M.; Lu, H.; Etyemezian, V.; Su, Q. Quantifying the emission potentials of fugitive dust sources in Nanjing, East China. Atmos. Environ. 2019, 207, 129–135. [Google Scholar] [CrossRef]
  78. Ferreira, C.S.S.; Walsh, R.P.D.; Blake, W.H.; Kikuchi, R.; Ferreira, A.J.D. Temporal Dynamics of Sediment Sources in an Urbanizing Mediterranean Catchment. Land Degrad. Dev. 2017, 28, 2354–2369. [Google Scholar] [CrossRef]
  79. Seleznev, A.; Yarmoshenko, I.; Malinovsky, G.; Ilgasheva, E.; Baglaeva, E.; Ryanskaya, A.; Kiseleva, D.; Gulyaeva, T. Snow-dirt sludge as an indicator of environmental and sedimentation processes in the urban environment. Sci. Rep. 2019, 9, 17241. [Google Scholar] [CrossRef] [PubMed] [Green Version]
  80. Seleznev, A.A.; Teterin, A.F.; Yarmoshenko, I.V. Meteorological conditions of surface sediment runoff formation during spring snowmelt in urban environment. Bull. Tomsk Polytech. Univ. Geo Assets Eng. 2020, 331, 7–16. [Google Scholar] [CrossRef]
Figure 1. The locations of cities studied.
Atmosphere 11 01320 g001
Figure 2. Typical structure of a residential area in a Russian city. (a) City’s residential area; (b) Microrayon; (c) Block of buildings; (d) EURL.
Atmosphere 11 01320 g002
Figure 3. Schematic division of an elementary urban residential landscape (EURL) into segments and functional zones.
Atmosphere 11 01320 g003
Figure 4. The division of residential quarters into the main types of functional zones.
Atmosphere 11 01320 g004
Figure 5. The numbers of proper and illegal parking places per 100 m2 of the motor transport infrastructure zone of the EURL internal part.
Atmosphere 11 01320 g005
Figure 6. (a) Disturbed cover areas in courtyards and external parts of EURLs; (b) the share of disturbed cover areas on the site (excluding the area of roads), and the contribution of the main functional zones to the total area of damaged cover.
Atmosphere 11 01320 g006aAtmosphere 11 01320 g006b
Figure 7. (a) Projective grass cover in lawns, taking into account the contributions of wild plants, lawn grass, and ornamental plants. In Ekaterinburg, the study was conducted according to another scheme. (b) Projective tree canopy cover of external and internal parts of the EURL.
Atmosphere 11 01320 g007
Figure 8. Grades of cleaning quality and technical condition. (a) Negative grades of cleaning in segments with pervious and impervious surfaces; (b) quality of cleaning by functional zones with impervious surfaces; (c) contributions of the main functional zones to the negative grades of the technical condition.
Atmosphere 11 01320 g008
Figure 9. The number of segments with delayed restoration after earthworks and construction.
Atmosphere 11 01320 g009
Figure 10. The proportions of site segments that were sources of sediment yield and the proportions of segments contaminated due to transfer from neighboring areas.
Atmosphere 11 01320 g010
Table 1. Characteristics of cities studied.
City,
Population,
×103
Cars, ×103/Cars Per 103 People (2017)Coor-
Dinates
Average Jan/Jul
Temp., °C
Average Precipitation Summer Months/Year, mmClimate ZoneGeographical RegionGeneral ReliefIndustriesMunicipal Budget in 2018 Per Capita,
×103 RUB
Ekaterinburg
1480
446.5/30256°50′ N
60°35′ E
−12.6
/19.0
213/501Temperate continentalEastern slope of the Middle UralsFloodplain terraces along the river, hilly plains, low mountainsMachinery, metallurgy, research and development.27.2
Nizhniy Novgorod
1260
352/27656°19′ N
44°00′ E
−8.9
/19.4
224/648Humid continentalValley of the Volga and Oka riversFloodplains and hilly plainsMachinery, river shipping26.5
Rostov-on-Don
1130
319.2/28547°14′ N
39°42′ E
−3.0
/23.4
127/596Moderate continental, steppeValley of the Don riverFloodplain terraces along the riverMachinery, river shipping, food industry29.2
Tyumen
770
279/36357°09′ N
65°32′ E
−15.0
/18.8
204/485Temperate continentalValley of the Tura riverFloodplain terraces along the riverMetal processing, machinery, oil processing, gas-fired power plants34.7
Chelyabinsk
1200
320.4/26955°09′ N
61°24′ E
−14.1
/19.3
186/430TemperateEastern slope of the South UralsFloodplain terraces along the river, hilly plainsFerrous and non-ferrous metallurgy, chemical industry, machinery, coal-fired power plants29.4
Murmansk
292
96.5/330 *68°58′ N
33°05′ E
−10.1
/12.8
201/547Subarctic climateThe Kola Peninsula, bank Kola BayLow mountains along sea baySeaport, ship repair, fishing, fish processing46.2
* Data for Murmansk oblast.
Table 2. Characteristics of the typical EURL in a large Russian city.
ParameterValue
Total area10,000 m2
Areas of road/front yard green zone/internal courtyard/buildings,%14/17/46/23
Areas of green and sidewalks zones/vehicle zone in internal courtyard, %57/43
Number of segments at the site/the average area of the segment14/560 m2
Number of parking spaces in internal/external parts50/13
Number of illegal parking in internal/external parts12/1
Area of segments with unsatisfactory technical condition59%
Area of segments with impervious cover with poor cleaning60%
Area of lawns with projective grass cover less than 50%50%
Tree canopy cover (excluding the area of buildings and roads)26%
Area affected by earthworks and construction9%
Area of impervious cover/lawn/disturbed cover (roads and buildings excluded), %38/38/24
Segments connectivity: probability of solid sediment transfer from neighbouring segments to the given one0.5
Publisher’s Note: MDPI stays neutral with regard to jurisdictional claims in published maps and institutional affiliations.

