Article

Comparative Analysis of the Cloud Behavior over Inland and Coastal Regions within Single Climate Characteristics

1
Research Center for Atmospheric Environment, Hankuk University of Foreign Studies, Oedae-ro 81, Mohyeon-eop, Cheoin-gu, Yongin-si 17035, Gyeonggi-do, Korea
2
Department of Astronomy, Yonsei University, 50 Yonsei-ro, Seodaemun-gu, Seoul 03722, Korea
3
Center for Galaxy Evolution Research & Department of Astronomy, Yonsei University, Seoul 03722, Korea
4
Earth System Research Division, National Institute of Meteorological Sciences, Seohobuk-ro 33, Seogwipo-si 63568, Jeju-do, Korea
5
The 5th Research & Development Institute, Agency for Defense Development, Chungnam, Taean 32143, Korea
*
Authors to whom correspondence should be addressed.
Atmosphere 2020, 11(12), 1316; https://doi.org/10.3390/atmos11121316
Submission received: 10 November 2020 / Revised: 1 December 2020 / Accepted: 2 December 2020 / Published: 4 December 2020
(This article belongs to the Section Meteorology)

Abstract

:
Continuous and accurate ceilometer measurements can provide the sky-condition such as cloud base height (CBH), cloud vertical structure (CVS), and cloud cover at around the sites of meteorological stations. In this study, ceilometer measurement data over a period of 3 years (January 2017 to December 2019) were analyzed to compare the characteristics of CBH at inland and coastal stations sharing the same climate characteristics in Korea. The annual averaged frequency of cloud occurrence between 0 and 7750 m at the first CBH is similar in both inland (41.8 ± 10.2%) and coastal (40.3 ± 9.5%) areas. However, there are differences in monthly and seasonal trends. The maximum cloud occurrence appears in summer (winter) of 64.3% (60.1%) in inland (coastal) areas, while the minimum of 25.6% (21.9%) shows in transient seasons of spring and autumn. In winter, the cold surge of northwest wind tends to increase the cloud occurrence from the ocean at coastal rather than in the inland area. It is shown that monthly cloud occurrence in each station is closely related to its monthly precipitation variation. The CVS frequency calculated from the total number of CBH with 250 m vertical bins shows the maximum between 500 to 1500 m (0 to 1000 m) in inland (coastal) areas, indicating more frequent occurrence at a lower height in the coastal area. It is mainly caused by the seasonal variability of the low-level clouds in the coastal region, which occurs two to three times higher in spring and summer than in other seasons. The study implies that long-term measurements of ceilometer would provide a better understanding of the characteristics of cloud behaviors in inland and coastal areas.

1. Introduction

Clouds are one of the important players in both climate and weather [1,2], but their roles vary depending on regional characteristics [3,4,5]. Cloud occurrence and vertical distribution are the main factors to understand the effects of the cloud on Earth’s radiation budget and climate change. To estimate the impact of climate change and Earth’s radiation budget by clouds, it is essential to understand regional cloud characteristics such as cloud base height (CBH), cloud vertical structure (CVS), and their vertical occurrences.
Historically, cloud information has been obtained by naked eye observation since meteorological observations began. However, over the last few decades, many automated instruments such as the ceilometer, rawinsonde, sky-imager, infrared cloud imager, and satellite have been developed and used to observe the cloud properties in real-time [6,7,8,9,10]. Among them, studies using datasets from rawinsonde observations or the International Satellite Cloud Climatology Project (ISCCP) have focused on cloud-top height, CBH and CVS of global and long-term scales (i.e., [11,12,13,14,15]). In addition, some field experiments using several datasets of radar, lidar, and ceilometer have been carried out (i.e., [16,17]). Probst et al. (2012) compared model simulations with the ISCCP D2 dataset to obtain the global and zonal mean cloud fraction (CF) and found that CF at two stations of Seoul in the middle latitude in the Northern Hemisphere (NH) was about 66%. Wang et al. (1999) studied the CVS at Porto Santo Island during the Atlantic Stratocumulus Transition Experiment (ASTEX) using ceilometer, rawinsonde, radar, and satellite data [16]. As a result, low clouds below 3 km appeared, predominantly followed by high clouds around 7–8 km with a peak of about 20%. A number of studies present the basic cloud climatology from model research and various observations(i.e., [5,11,18,19,20,21,22,23,24]).
Recently, several studies using ceilometer measurements, one of the commonly used pieces of equipment for real-time cloud observations, analyzed the short-term characteristics of cloud at dedicated observation sites (i.e., [25,26]). Among the instruments to observe cloud properties, the ceilometer can provide continuous cloud characteristics with high temporal and spatial variability. Moreover, the World Meteorological Organization and previous studies recommended that the laser ceilometer is the most accurate and efficient instrument for measuring CBH and CVS compared to other equipment [10,25,27]. In the previous studies of Costa-Surós et al. (2013) [25] and Lee et al. (2018) [2] using ceilometer measurements, seasonal variation of cloud occurrence over Spain (Girona, northeast area of the Iberian Peninsula, the station is close to Balearic Sea located in the middle latitude of NH) and Korea (Seoul, urban inland) clearly showed different trends due to the geographical location; Girona (Seoul) shows a minimum in summer (spring and autumn) and a maximum in winter (summer). Another study [28] using ceilometer observations showed the seasonal CBHs variation together with annual cloud occurrence frequency over western India (Ahmedabad, urban area). However, these existing studies do not address the comparison of cloud occurrence between inland and coastal areas within the same climate characteristics in spite of CBH evaluation in North American regional reanalysis using ceilometers [5].
In this study, we try to analyze the CBH and CVS from the ceilometer observations in Seoul (urban inland area, Vaisala’s CL51) and in Taean (rural coastal area, CL31) over the Korean peninsula for a period of three years from 2017 to 2019. Seoul and Taean are located within the geographically single climate characteristics in the middle latitude belt of westerlies of the NH, which is influenced by the air mass of mainland China. The comparison of ceilometer observations shows the different behavior of cloudiness in urban inland and non-urban coastal areas that share the same climate characteristics on the western side of Korea.
A brief description of the instruments and data used in this analysis are presented in Section 2. The characteristics of CBH and CVS in Seoul and Taean station are reviewed and the comparison of CBH and CVS between two stations are performed in Section 3. In addition, the case studies of typical seasonal cloudiness are discussed in Section 3. The summary and discussion of the research are presented in Section 4.

2. Measurement and Data

Currently, a number of ceilometer instruments have been in operation at around 90 stations by the Korea Meteorological Administration (KMA) in Korea [2], but the publically released data are limited to the values of CBH and cloud cover.
Since 20 November 2013, two ceilometers of model CL51 (Vaisala Inc., Vantaa, Finland) have been operating for continuous sky monitoring over Seoul. They are installed on the roof of buildings at the Jungnang (hereinafter Seoul_S1) and Gwanghwamun (hereinafter Seoul_S2) stations in Seoul, Korea (Figure 1 and see the detail in Figure 1 of [2] (p. 47)). The two stations in Seoul are 9.8 km away. Two ceilometers of model CL31 (Vaisala Inc., Finland) in Taean [hereinafter Taean_S1 and Taean_S2] have been operating for monitoring the sky over the west coast area of Korea. Taean_S1 and Taean_S2 stations are located at about 800 m separations from each other, e.g., one along the coastal line and the other in one of the island. The distance between the two stations in Seoul is farther than those in Taean. We note that CBHs correlation between two Seoul stations (correlation coefficients (R) = 0.91, RMSE = 80.5 m in case of 2017 with 100% data availability) without considering time lags is relatively high. This implies that it is reasonable to compare regions even though the two stations in Seoul seem to be farther away. Figure 1 shows the location of Seoul and Taean in Korea, which is close to the Yellow Sea.
Both Vaisala CL51 and CL31 ceilometers using laser light detection and ranging (lidar) are capable of measuring the optical backscatter intensity of the air at the center wavelength of 910 nm with a vertical resolution of 5 or 10 m (Table 1) [2,25,29]. The ceilometers observe backscatter profiles and three CBHs are stored every 1 min and 30 s, respectively (Table 1). According to the Vaisala ceilometer user’s guide, CBH is retrieved by the time delay between the launch of the laser pulse and detection of the backscatter signal [29]. Furthermore, the performance of the CL51 model has been enhanced more accurately with high-resolution due to the improved algorithm by a more powerful laser source and smaller divergence products than that of the ceilometer CL31 [26]. In other words, CL51 model has doubling samples by the return signal of 0–100 μm than CL31 of 0–50 μm under the normal full-range operation [1]. CL51 also provides a six-times greater signal-to-noise ratio than the CL31 model according to the field campaign report from Morris and Winston (2016) [30]. Unlike the CBH reports up to 7750 m by the CL31, the CL51 can detect CBHs and backscatter profiles up to 13,000 m and 15,000 m, respectively [26,29]. In this study, the maximum range of CBHs, retrieved by the Vaisala’s algorithm, has been reported 13,000 m in two Seoul stations and 7750 m in two Taean stations.
In the previous study [2] for a period of 2014–2016 in Seoul, it was found that CBH observations with CL31 and CL51 were similar up to 7750 m although CL51 is an updated version of the ceilometer. Thus, it would be reasonable to compare quantitative CBH analysis up to 7750 m from different versions of ceilometers.
The measurement availability of Seoul (Taean) over the whole period of 3 years from January 2017 to December 2019 reaches 94.2% (93.5%). Such high availability of both observations indicates a good coverage of whole observation period. Table 2 shows the monthly data available at each station for this study. We note that the periods without observation datasets are due to the software’s malfunction and power problem caused by a thunderstorm. Nevertheless, they could complement each other even if one station suffers from insufficient observations from time to time, because the characteristics of the clouds show the similarity of two nearby stations.
In addition, monthly precipitation and temperature data are used to compare with cloud occurrence from ceilometer observation at each station area. The datasets of monthly precipitation and temperature at the Seoul station of the KMA are used. The monthly climatology is also used for the period of 30-years (1981–2010) at the Seoul station of KMA [30].

3. Results and Analysis

The cloud occurrence and cloud vertical distribution are analyzed from the measured CBHs in this section. Firstly, CBHs between Seoul and Taean are compared in Section 3.1 and Section 3.2 and secondly, case studies of seasonal CBH behaviors in both the two areas are presented in Section 3.3.
Cloud occurrence is an appropriate factor to understand the regional characteristics of the cloud. Cloud occurrence is defined as the ratio between the number of at least one detected CBH and the total available observations, i.e.,
Cloud Occurrence = (the number of CBH at first layer/total available records) × 100 [%]
This definition has been widely used where cloud occurrence is derived from ceilometers or radiosondes(i.e., [2,11,12,16,25,26,31]).

3.1. Comparison of Cloud Occurrence over Seoul and Taean

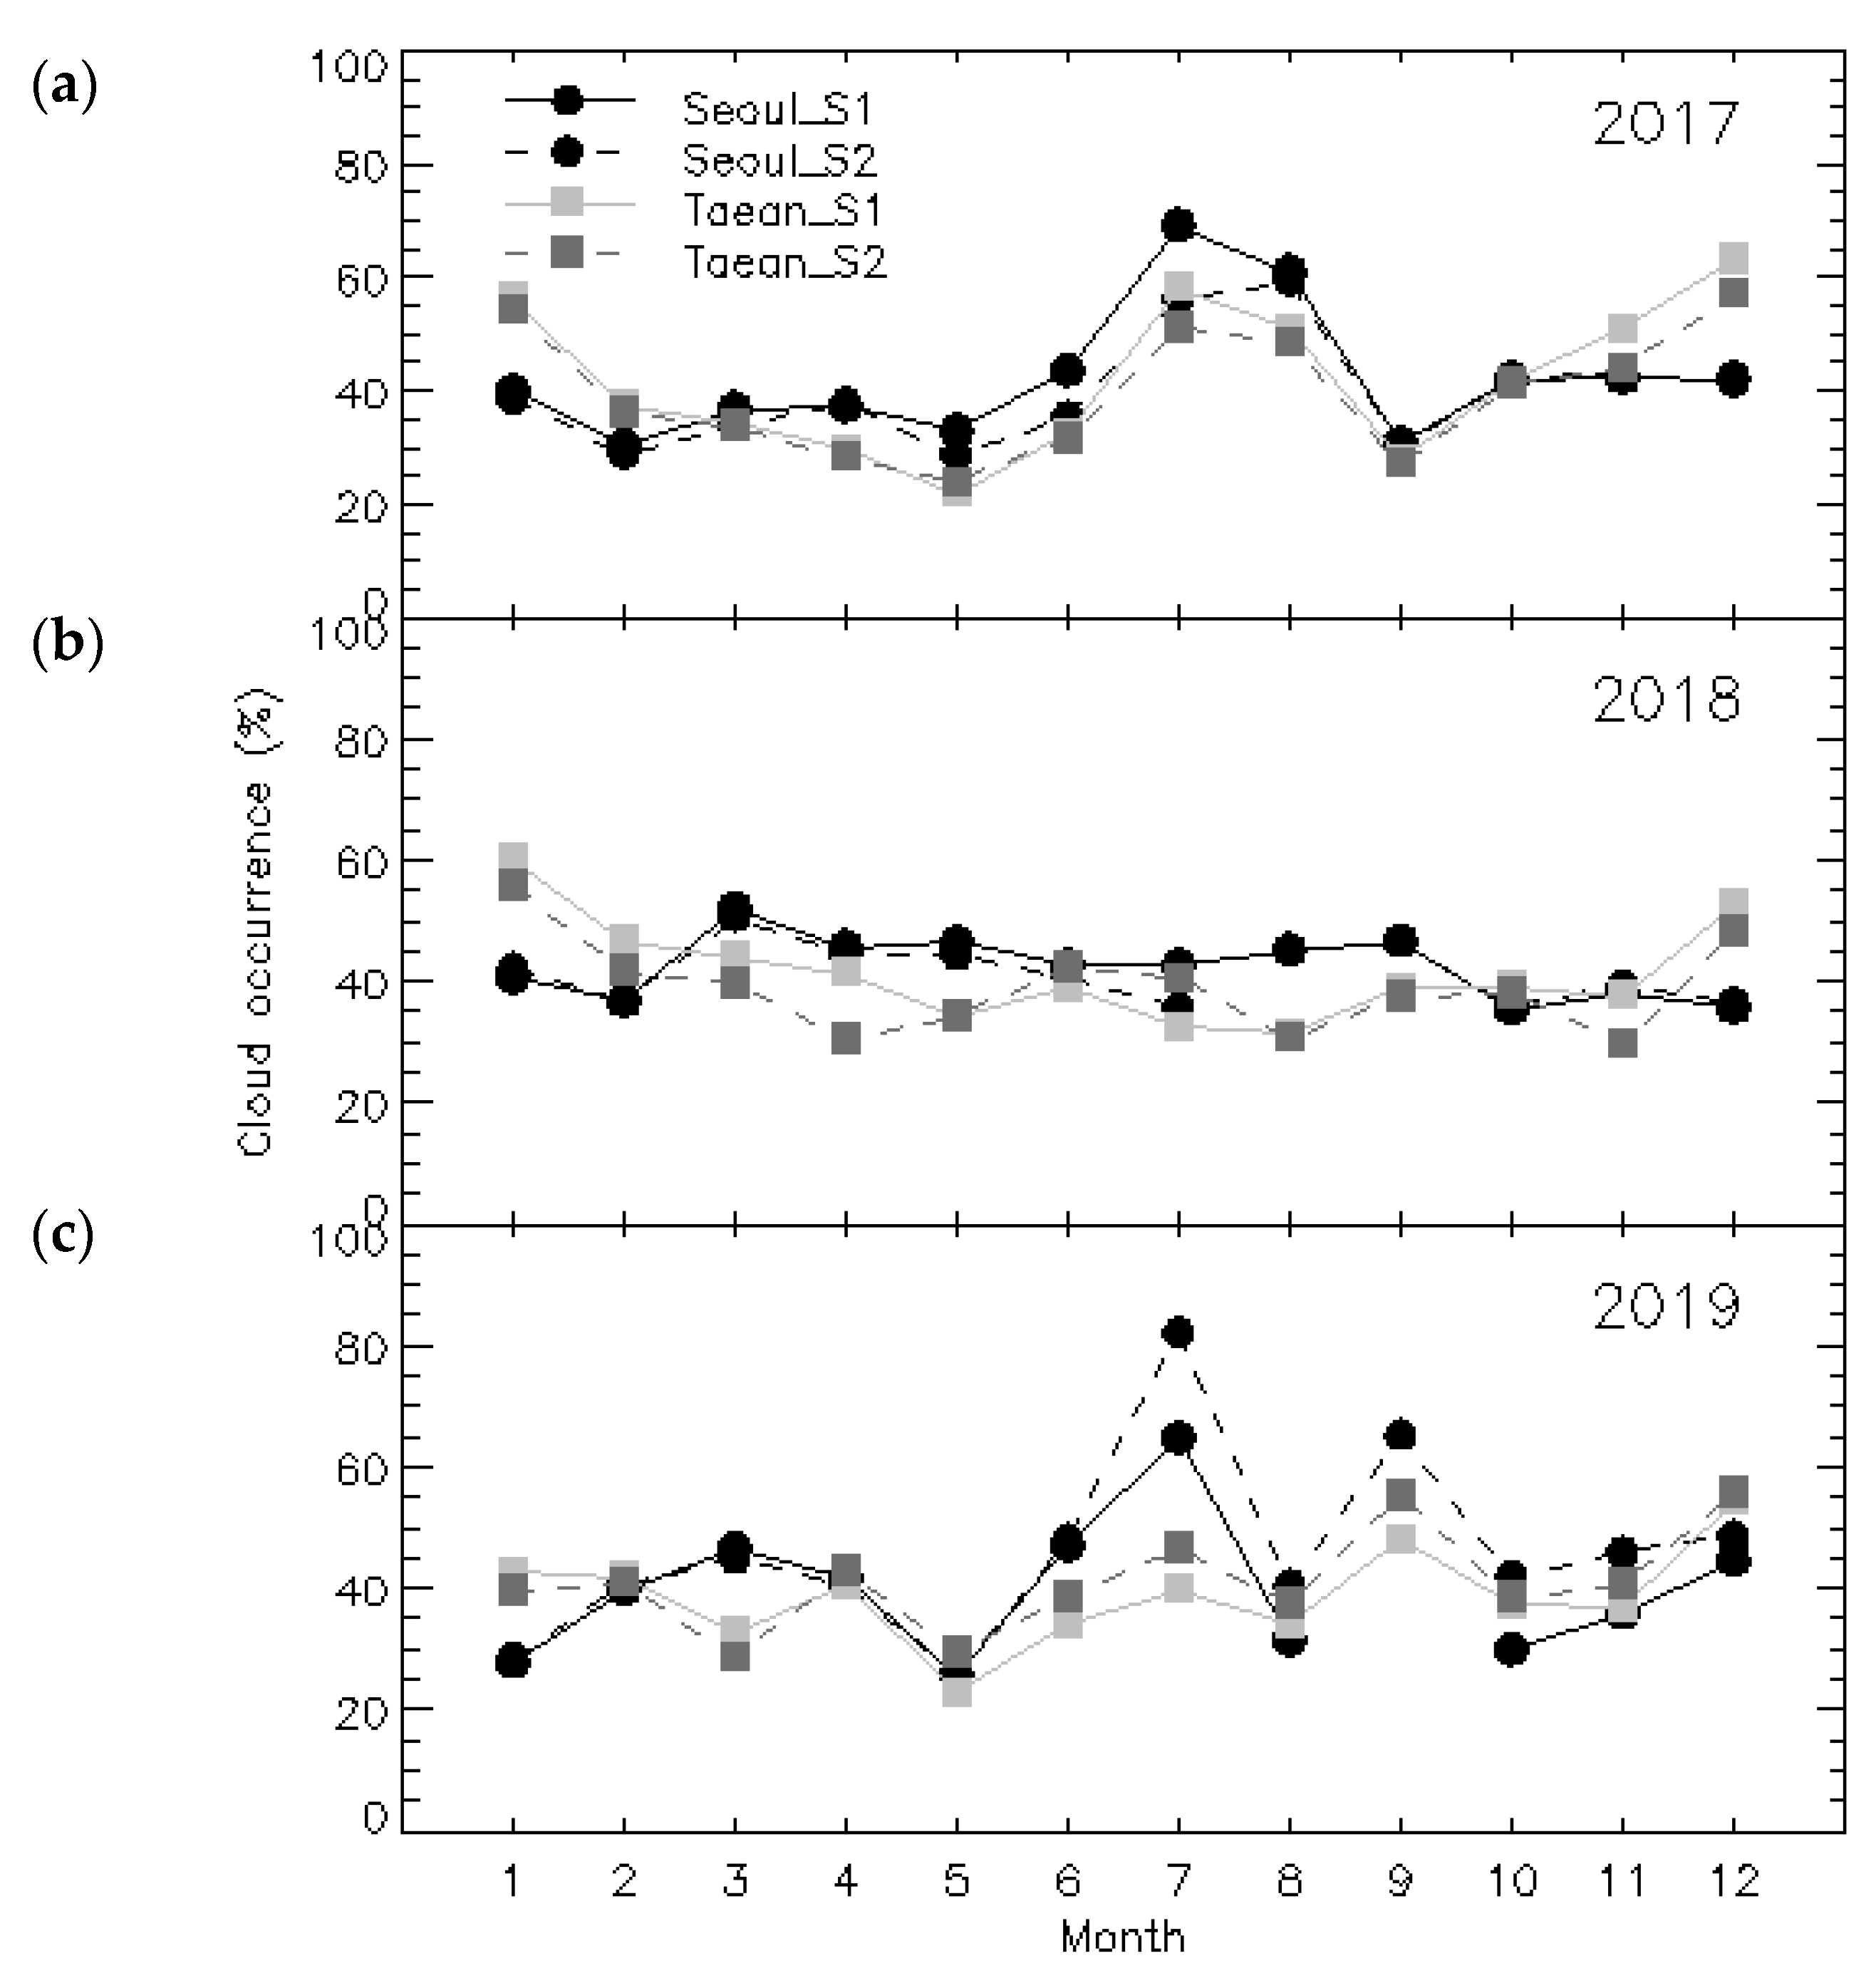
Figure 2 shows monthly distributions of cloud occurrence in percentage over a period of 3 years at the two stations in Seoul and Taean, respectively. We note that there are no available data in August 2018 at Seoul_S2 and September 2019 at Seoul_S1 stations. This is caused by low data availability of less than 25%. Moreover, the results of cloud occurrence over Seoul_S1 and Seoul_S2 stations in summer and autumn 2019 reflect in lower availabilities between 38% and 75%, as mentioned in Section 2 and Table 2.
The average frequency of cloud occurrence over Seoul (Taean) was 41.8 ± 10.2% (40.3 ± 9.5%) for the whole period of 3 years. The average annual frequency of cloud occurrence over Taean is within a 3% lower margin than that of Seoul, implying that the annual frequencies of cloud occurrence in inland and coastal areas are similar to each other; 41.0% (40.9%) in 2017, 41.7% (40.3%) in 2018, and 42.9% (39.9%) in 2019 over Seoul (Taean). However, seasonal variation of cloud occurrence shows that there is interannual variability and that the maximum occurrence appears in summer (winter) at Seoul (Taean), as shown in Figure 2. The cold surge of northwest wind over Korea in winter tends to increase the cloud occurrence from the ocean in Taean. Overall, the lowest occurrence is found to be in the spring and autumn seasons in both areas.
It can also be found that cloud occurrence in a certain year is related to specific climate characteristics of that year. Even though there are some missing data and year to year variability, the cloud occurrences over Seoul in 2017 and 2019 show similar features; the variations of cloud occurrence in spring and autumn show a minimum of around 20–30% and summer has a maximum of around 70–80% (Figure 2a,c). However, the cloud behavior of 2018 does not show a maximum peak of July both in inland and coastal areas unlike other years (Figure 2b). We understand that the main cause is likely to be the summer (July-August) heatwave in 2018 recorded as the second hottest summer in modern meteorological history in Korea, and mean daily maximum temperature was, on average, 2.6 °C higher than long term averaged climatology (1981–2010) over South Korea [32,33,34]. It was the second-highest record after 1994 [32]. It resulted in the lowest cloud occurrence in that summer. This finding demonstrates that the cloud occurrence from ceilometer measurements reflect the specific climate variation each year relatively well.
The monthly variability of cloud occurrence both at Seoul_S1 and Seoul_S2 and at Taean_S1 and Taean_S2 is consistent except for the months when data availability varies significantly, as shown in Table 2. However, the frequency difference of cloud occurrence between the two stations in Seoul is influenced by localized small-scale clouds occurring in some seasons. The difference of about 10% in June and July 2017 at Seoul_S1 and Seoul_S2 stations is noticed, while similar cycles of cloud behaviors at both two stations (Figure 2a). Note that the data availability rate is 100% and there is no loss of data during this period.
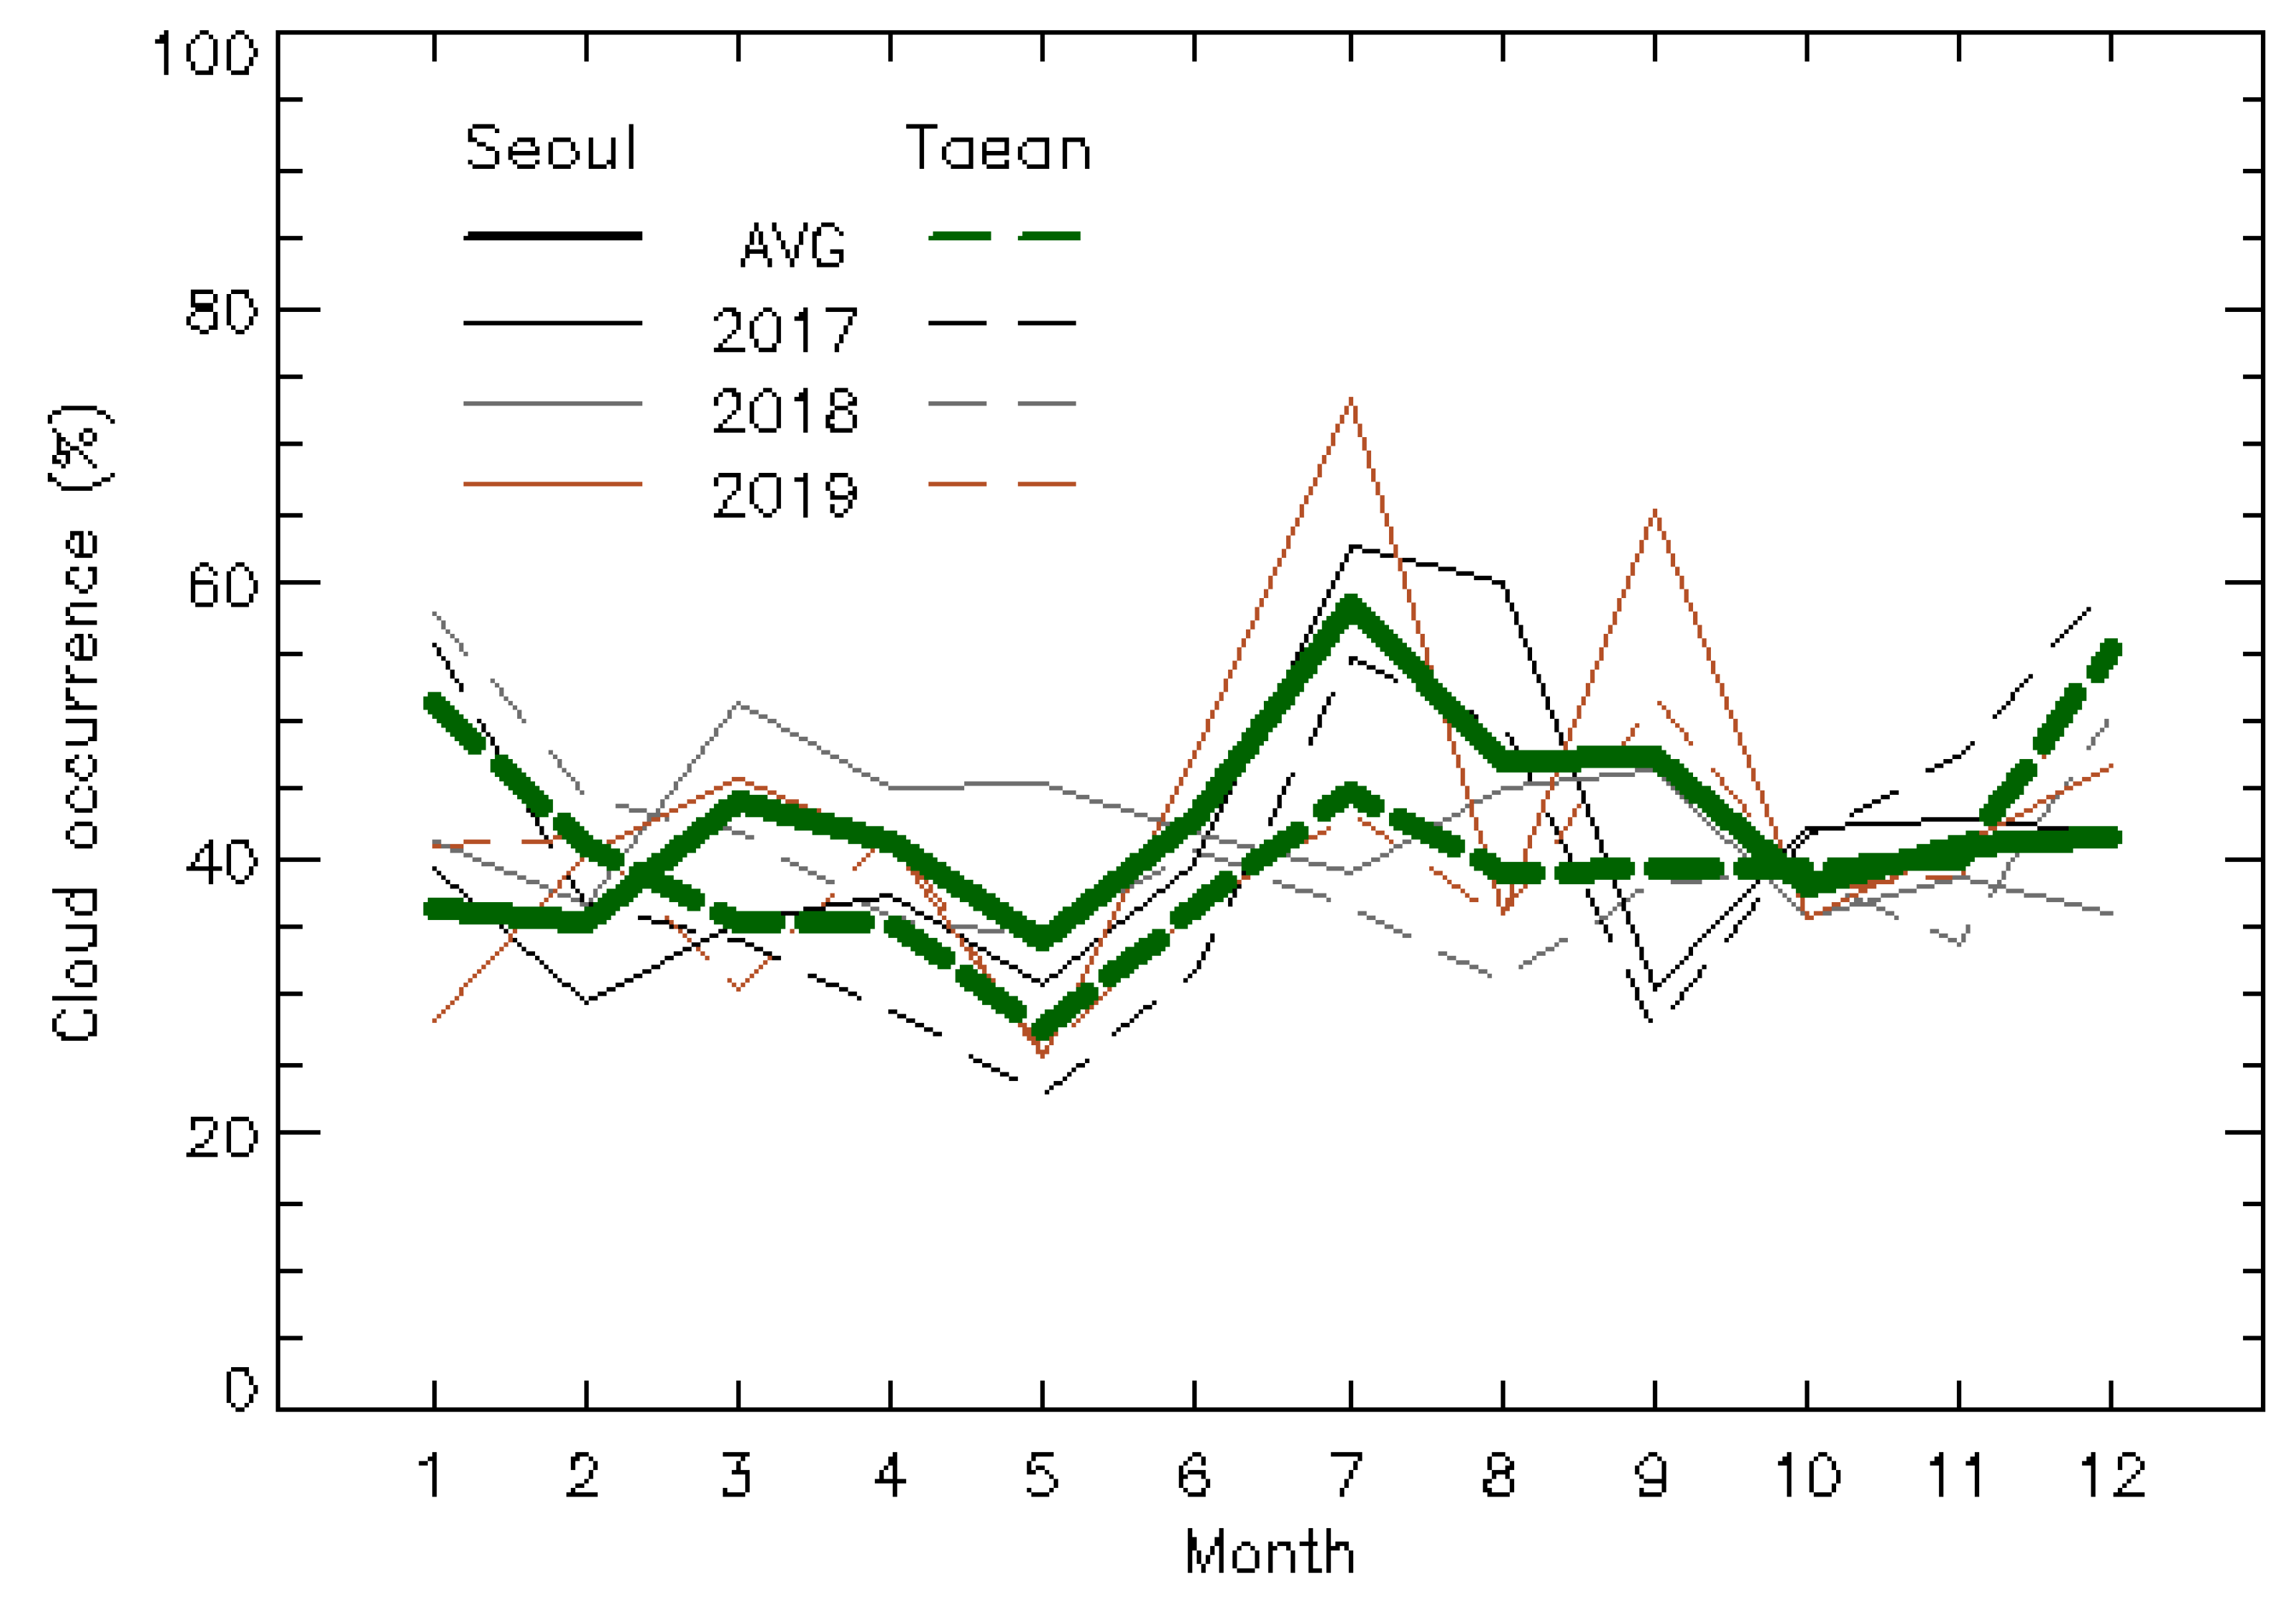
Figure 3 shows the monthly variations of average cloud occurrence. The measurements were made at the two stations in Seoul and Taean, representing inland and coastal areas. Monthly variations show different features between Seoul and Taean, and such trends are more clearly visible in inland and coastal areas; the maximum of cloud occurrence occurs in winter in coastal areas whereas that represents in summer in inland areas. Of the three summers, the monthly frequencies of cloud occurrence in 2017 summer (July–August, 50–55%) are the highest, but still lower than 2017 winter (January and December, 55–60%). Long-term analysis of cloud occurrence in Korea was performed using rawinsonde datasets for 14 years (1975–1988) by Poore et al. (1995); the maximum of cloud occurrence was derived in summer at Osan station [37.10° N, 127.03° E, approximately 46 km (88 km) away from Seoul (Taean)], Korea [12]. While seasonal variations over Seoul presented in the previous study [2] and this study are a good agreement with Poore et al. (1995), those over Taean show the inconsistency with Poore et al. (1995) [12]. It might be because both Seoul and Osan are inland areas, while Taean is a coastal area.
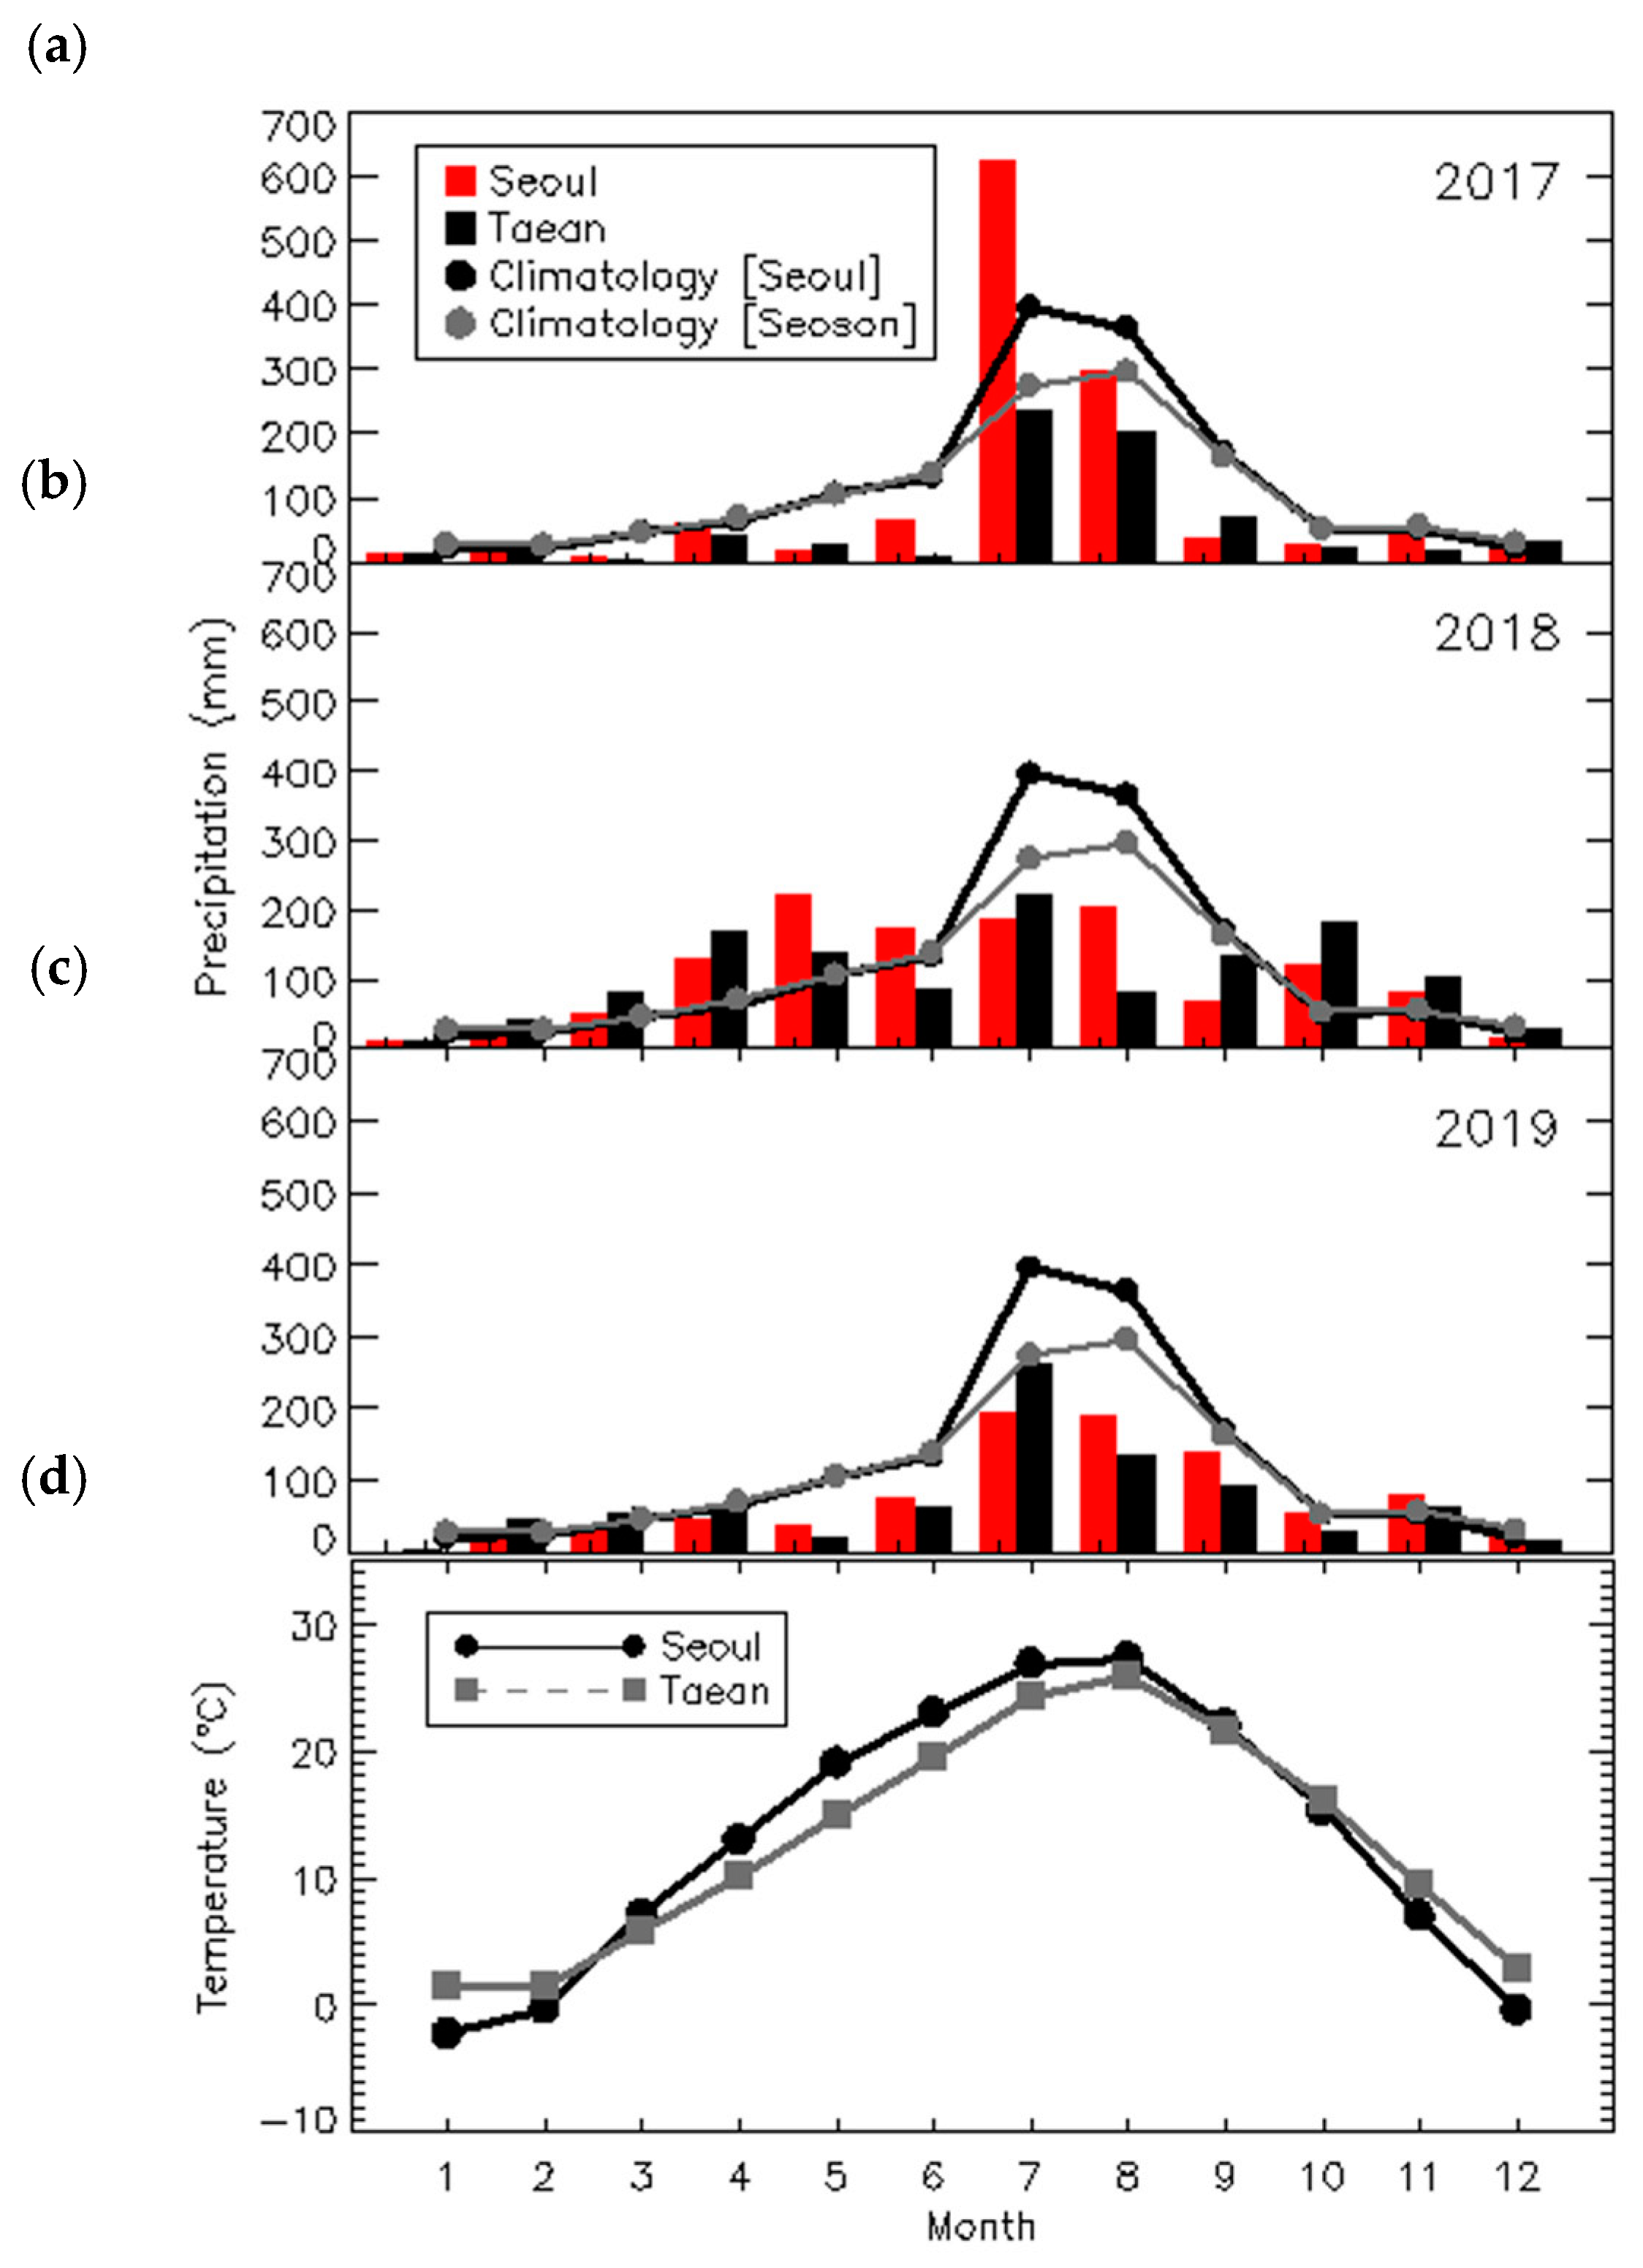
Figure 4 shows the monthly variations of precipitation and temperature in Seoul (red bar) and Taean (black bar) for a period of 2017 through 2019. The climatology during 30-years (1981–2010) of the precipitation at Seoul (KMA108) and Seosan (KMA129) stations of KMA nearest to Seoul and Taean are presented, respectively [30,35]. Monthly precipitation in 2017 and in 2019 has the peak in summer (July–August) (Figure 4a,c), but precipitation in 2018 does not have a dominant peak (Figure 4b). Compared with Figure 4a,c, the monthly variation of precipitation in Seoul behaves very similarly to that of cloud occurrence (Figure 4b). In particular, dry summer and wet spring and autumn of 2018 is consistent with the result of the monthly frequencies of cloud occurrence. In contrast, the precipitation amount (621 mm) in July 2017 over Seoul was up to 50% higher than the climatology (1981–2010), reflecting frequent rainfall (23 days per month) accompanied by occasionally heavy rains in July in Seoul.
As in the previous study [2], it can be confirmed again that the relationship between cloud occurrence and precipitation varies depending on the season; frequencies of cloud occurrence and precipitations show a similar trend in summer, whereas their relationship is weak in winter. This can be understood with precipitation amount that is mainly related to cloud vertical growth and convective strength of cloud. However, it is consistent with the previous study [2], showing that the annual mean frequencies of cloud occurrence in Seoul have recently decreased compared to the late 20th century.
On the contrary, the monthly variation of precipitation in Taean does not show a distinctive relationship with cloud occurrence. This indicates that there might be more cloud occurrence without precipitation in coastal areas such as intruding clouds originating from the ocean in winter.
Figure 4d shows the monthly temperature averaged for the period 2017–2019 in Seoul (black dot-line) and Taean (gray square-line). The monthly temperature in Seoul is warmer of 2.39 ± 1.28 °C than that in Taean in spring and summer (March–September), whereas the monthly temperature in Taean is warmer of 2.18 ± 2.06 °C than that in Seoul in winter. This is due to the geographical location of Taean stations, located on the coastline. It seems that the influence of the sea and land breeze tends to produce a high frequency of cloud occurrence in Taean.

3.2. Comparison of Cloud Vertical Distribution between Seoul and Taean

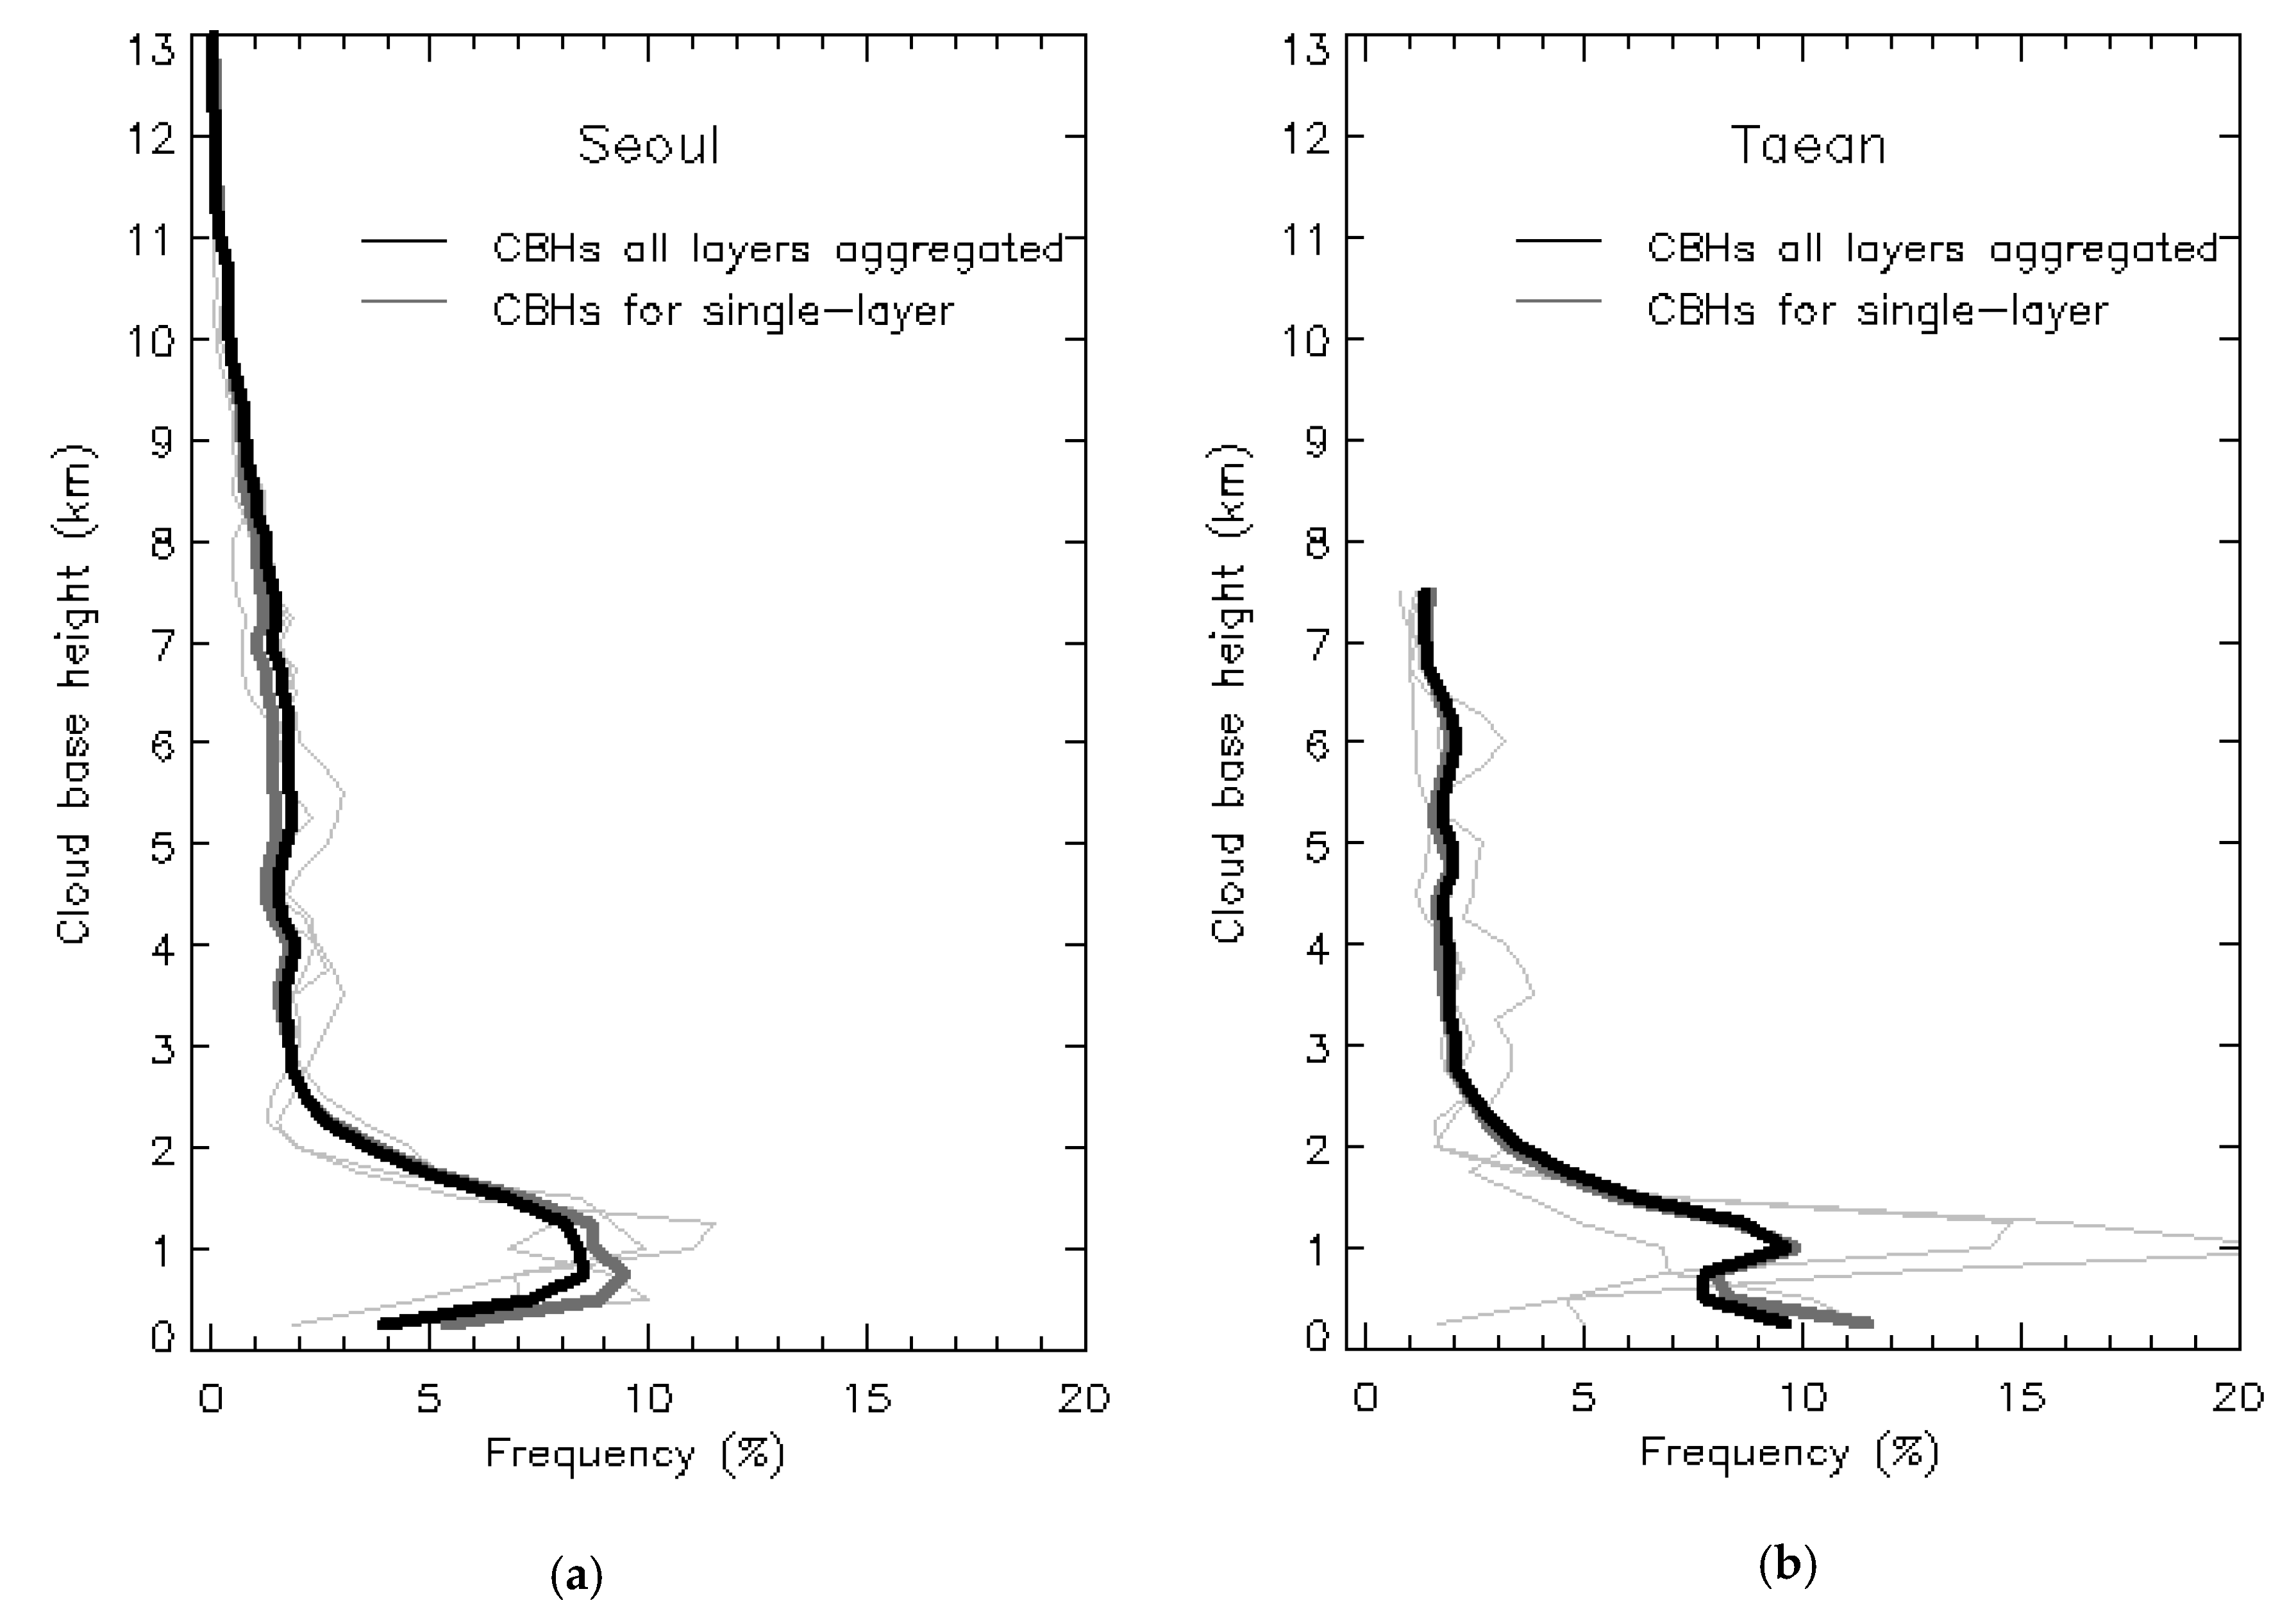
Figure 5 shows the vertical distributions of CBHs for all layers aggregated (bold black) such as single-layered, two-layered, and three-layered cases and a single layer (bold gray) at both Seoul and Taean for the period 2017–2019. Each frequency of their vertical distributions is determined from the total number of CBHs with 250 m intervals. They are estimated to 65.7%, 27.5%, and 6.8% of the total CBHs, single-layered, two-layered, and three-layered for the whole period at Seoul, respectively. The results (2017–2019) in Seoul in this study along with the results (65.7% for single-layered, 26.7% for two-layered, and 7.2% for three-layered) of the previous study for a period 2014–2016 [2] are consistent. It has also similar results of rawinsonde measurements (about 60% in single-layered clouds and about 26% in multilayered clouds from a 20-year (1975–1995)) by Wang et al. (1999, 2000) [11,16] in spite of the time and instrument differences.
As shown in Figure 5a,b, the peak frequency appears between 500 m and 1500 m at Seoul while the first and second peaks represent between 0 m and 1000 m at Taean, the vertical frequency gradually decreases up to 7750 m with a similar value of CVS at both areas. However, the variation of CVS frequencies below 1500 m shows differences in two areas. Looking at Figure 5 in more detail, low clouds below 1000 m are detected the 28.6% (35.9%) of the all CBHs together and the 33.5% (38.1%) of single-layered CBHs over Seoul (Taean). It indicates that low clouds occur more frequently in coastal areas than inland, regardless of the different annual cloud frequency. In particular, the annual variability around 1000 m in Taean is greater than that in Seoul, implying that frequent low-level clouds in the coastal area can contribute more actively than in inland. The average frequency below 1500 m for each bin occurs more within 0.2 to 2%, although the vertical feature of distributions for a single layer at each area also appears almost similar to that of all CBHs aggregated. This result is consistent with the previous study of Korea [2].
Low clouds detected below 2000 m over Seoul (Taean) represent 53.1% (60.6%) and 58.2% (60.5%) at all CBHs aggregated and single-layered CBHs for the whole period, respectively. The results of low clouds (below 2000) over Taean (coastal) is approximately 10% greater than the frequencies (49.6% for multilayered systems, 52% for single-layered systems) at Girona, Spain (about 30 km from the Balearic Sea) of Costa-Surós et al. (2013) [25]. It seems to be the geographical influence of Taean, which is located nearer to the coastline rather than Girona, although the two studies do not share the same period.
CBHs above 7000 m for the whole analysis period are found to be 10.9–13.7% over Seoul and 2.8–5.6% over Taean, respectively, reflecting the ceilometer CL51′s ability to observe up to 13,000 m. From this study and the previous study [2], it can be seen that most ceilometers generally used with a vertical resolution between the surface to 7750 m are likely to have about 8–10% of cloud information undetected and lost.
With the analysis of distribution for CVS, each distance between CBHs of adjacent layers is analyzed for the characteristics at both Seoul and Taean when a multilayered cloud system is present. For this case, the distance between consecutive CBHs for two- and three-layered cloud systems located within 500 m with 70–76% at both Seoul and Taean (not shown). It indicates that most of the distances between adjacent CBHs are within 1000 m margins regardless of inland or coastal areas.
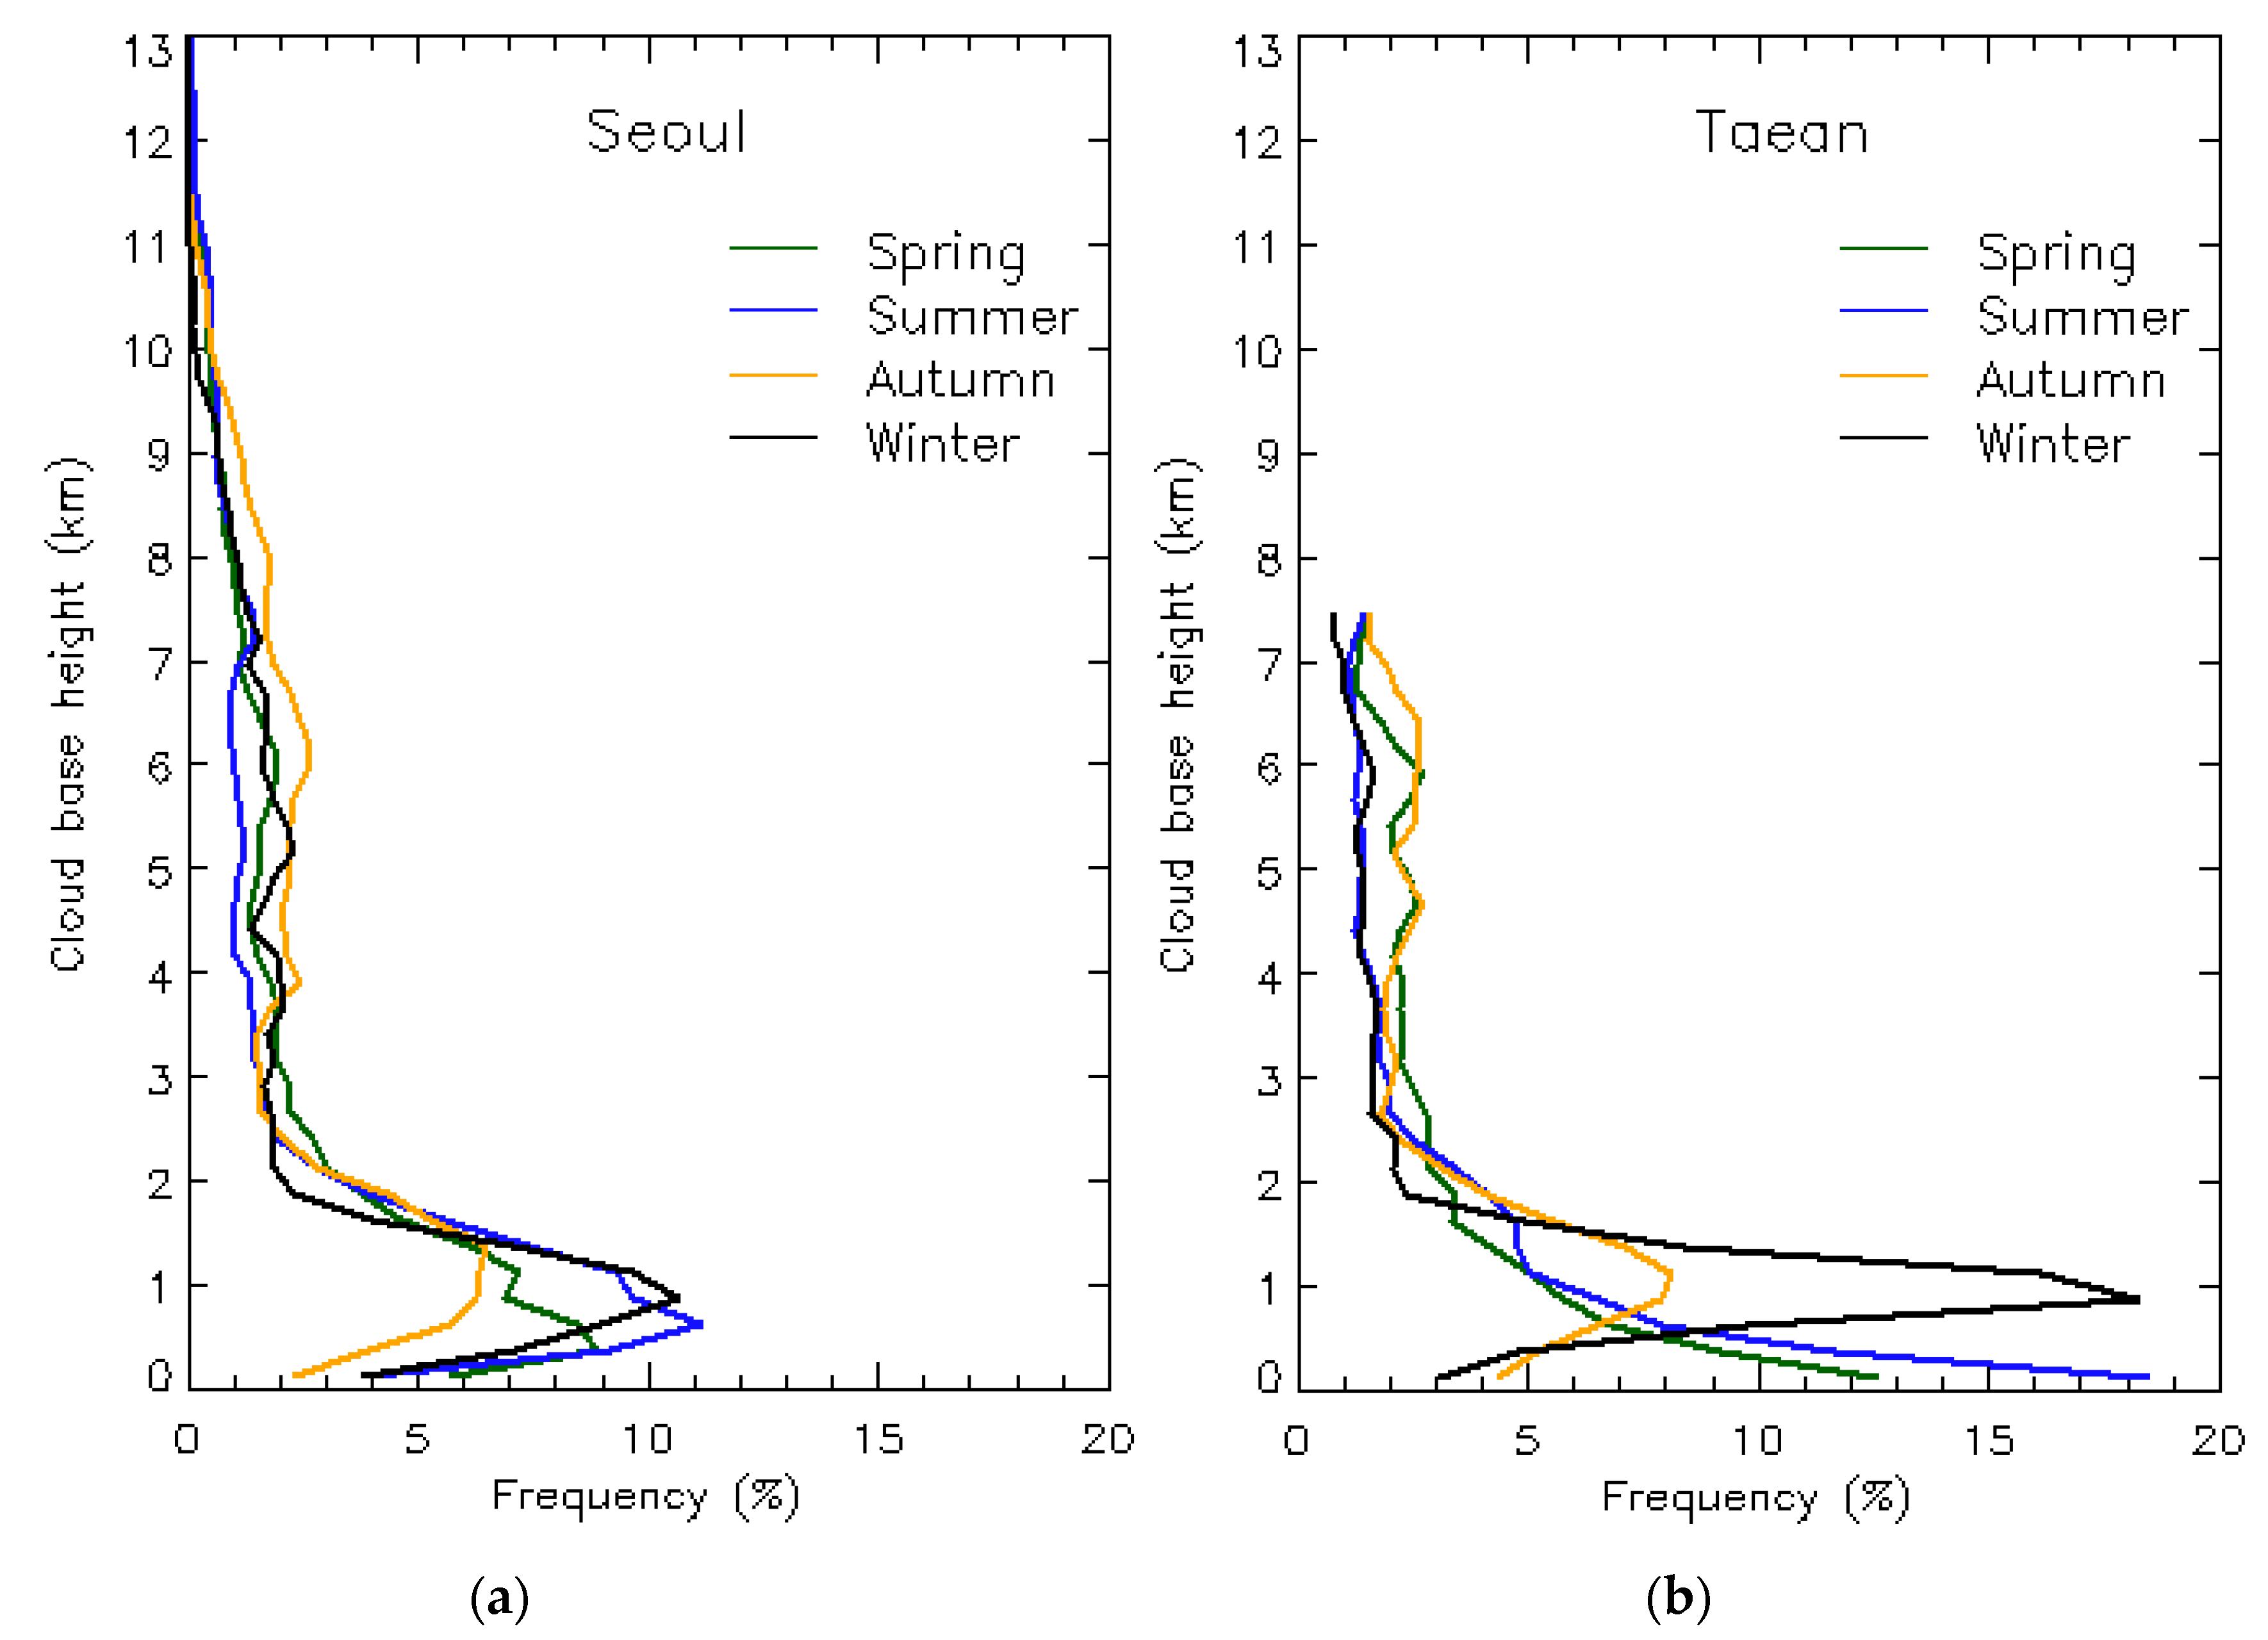
Annual averaged CVS in the previous section is re-organized to the CVS of four seasons to be compared in terms of seasonal distribution. Figure 6 shows the seasonal distributions of CBH between the surface to 13,000 m (7750 m) over Seoul (Taean) for the whole studied period. The lower level CBH frequency appears depending on the season in both areas; more CBHs at lower levels in summer and winter than those in spring and autumn. In addition, the seasonal and vertical difference is more pronounced than in Taean. The variation of the CBH below 500 m in Taean than Seoul appears greatly (two to three times) except for autumn. In Taean, CBHs in spring and summer show the maximum peak below 500 m and those in autumn and winter are around 1000 m as in Seoul. It demonstrates a distinct difference in the seasonal distributions of clouds below 1500 m in both areas. More clouds at lower levels in Taean than in Seoul can be explained by the circulation patterns over East Asia in summer and winter monsoons. During the summer, East Asia including South Korea is under the influence of southwest surface winds associated with a generally hot and humid climate [36]. This supply of very humid air crossing over the ocean could provide better conditions for an increase in cloud formation at the very low level along coast areas such as Taean. During the winter, the predominant northwesterlies in the lowest troposphere, originating from a huge anticyclonic circulation over Siberia, have a tendency to push the cold dry continental air mass to northeastern Asia [36,37]. This cold air mass traveling over a relatively warm ocean tends to produce clouds at a low level and associated snowfall, caused by large temperature differences between air and ocean. It is similar to lake effect snowfall occurred across Great Lakes [38,39]. Such clouds are found in Taean right next to the ocean as well.
The difference between the spring and autumn seasons is also observed. Very low-level clouds are often observed only in Taean. It can be assumed that they are driven by the circulation mechanisms from the land-sea contrast around the coast, such as sea breeze [40].
Unlike the seasonal variability of the lower-level CBHs, the frequency of the upper-level CBHs appears more frequently in autumn in both areas. In particular, the frequency of the upper-level CBHs in spring at Taean also similar to those in autumn. This is because of the dominant influence of the warm and dry air mass from tropical continents in the spring and autumn of the Korean peninsula.
In terms of monthly distribution, more than 47% of CBHs for multilayered systems are observed below 2000 m except for autumn seasons, i.e., in September (Seoul: 35.0% for multi, 42.5% for single, Taean: 42.3% for multi, 45.5% for single) and October (Seoul: 32.4% for multi, 39.5 for single, Taean: 39.3% for multi, 40.6% for single).

3.3. Case Studies of Seasonal CBH Behavior

3.3.1. Winter Case

Figure 7 shows an example of winter sky conditions over Seoul and Taean during 24–31 January 2019. Figure 7a,b show daily variations of the backscatter profiles (top) and CBH observations (bottom) up to 15,000 m (CL51) and 7750 m (CL31). Cyan, purple, and red triangles represent the 1st, 2nd, and 3rd CBHs for the cloud detected from ceilometers, respectively. Even with the same day cloud detection, the CL51 backscattering measurement is more pronounced than that of CL31.
The cloud diurnal variations at Seoul and Taean show a typical pattern and similar tendency in winter, i.e., alto-type cloud formation in middle-level after cirrus-type clouds pass in the upper-level (>6000 m) on 27–28 and 29–31 January 2019. Because few clouds in the upper troposphere appear in winter, there is little difference in cloud occurrence at this altitude level between inland and coastal area. However, CBHs for a single layer created over the western sea by expanding cold Siberian anticyclone are clearly shown in the satellite images (not shown) on those days.

3.3.2. Summer Case

Figure 8 shows an example of typical rainy days on 24–31 July 2019 in Seoul and Taean. The rainfall in Seoul and Taean during this period was recorded at 160.9 mm and 86.7 mm, respectively. It is associated with the Jangma (stationary) front under the influence of the Asian-Pacific summer monsoon [41]. In summer, clouds with low CBH below 500 m appear frequently for most of the days, these being accompanied by the concentration of precipitation over the inland area (Figure 8a). On the other hand, CBHs in the upper-level are observed occasionally over the coastal area, which implies rain-free clouds such as Cirrus and alto-type clouds for this summer period. In particular, it was raining between 20–65 mm in Seoul on 26, 28, and 31 July 2019 because the wet air mass was concentrated in Seoul and cumulonimbus clouds were especially well developed vertically with heavy precipitation of 60.0 and 62.3 mm on 26 and 31 July 2019. It was also confirmed with features of vertical backscatter signals of top of Figure 8a. When there is a thick cloud, noise returning signals of ceilometer measurements are increased and finally removed.

3.3.3. Autumn case

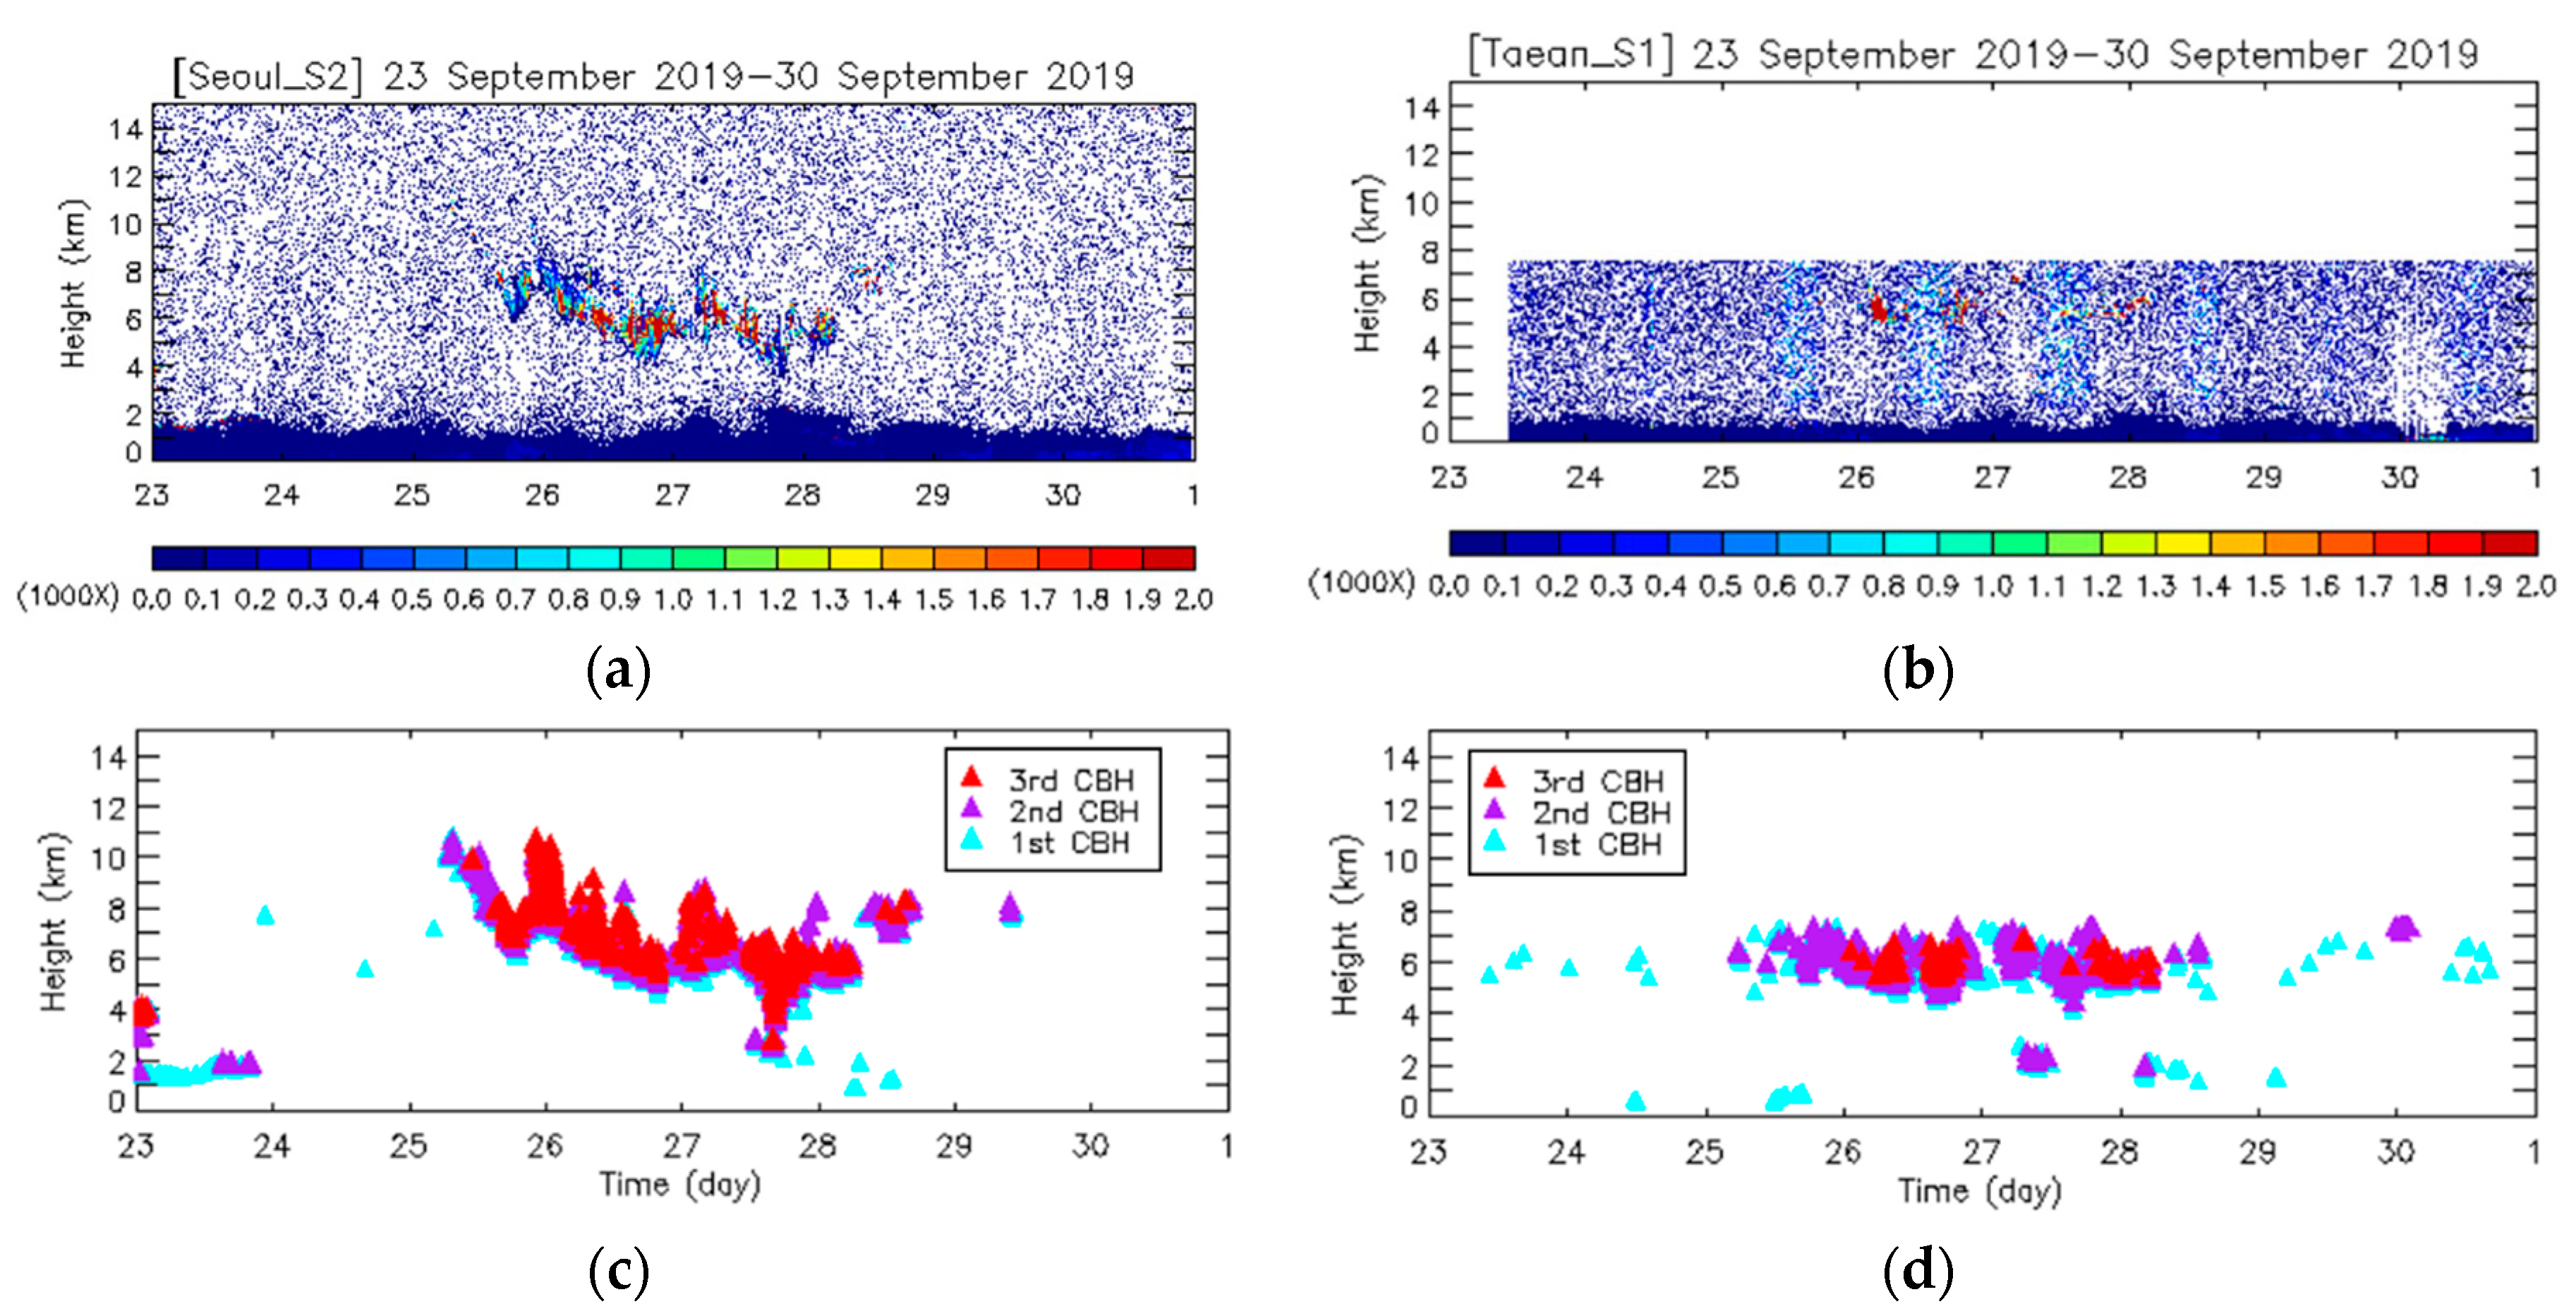
As discussed in previous sections, the lowest frequency of cloud occurrence appears in spring and autumn. Most CBHs are observed under the multilayered system during this period at both Seoul and Taean (Figure 9a,b). As can be seen in Figure 9, the CBH frequencies above the middle altitude are higher than in other seasons.
In particular, a large number of CBHs above 7750 m appear over Seoul (Figure 9a), but, for Taean, these CBHs are not detected due to the limitation of the vertical resolution of the instrument over Taean (Figure 9b). Although autumn shows the best weather condition for the observation of clouds occurring above the middle altitude, it indicates that the high-level clouds that could have been detected with the other version instrument are undetected.

4. Summary and Discussion

Using the high-resolution data from ceilometers CL51 and CL31, this study shows, for the first time, a detailed analysis of the different cloud behavior over inland and coastal areas that share the single climate characteristics in Korea. The key importance is such that the study can provide a clearer understanding on more accurate and finer spatial scale cloud behaviors within the single climate characteristics. The annual frequencies of cloud occurrence over inland and coastal area was 41.8 ± 10.2% and 40.3 ± 9.5% for the whole study period of 2017–2019, respectively. The maximum of cloud occurrence was in summer (winter) over the inland (coastal) area, while the minimum was found in spring and autumn for both areas. The correlation between cloud occurrence and precipitation is relatively higher inland than in coastal areas.
The CVS analysis exhibits the maximum of CBHs in the bins between 500 to 1500 m in inland and 0 to 1000 m in coastal areas. More frequent cloud occurrence in the lower level is observed in spring and summer over coastal areas. This is likely due to local wind systems such as breeze as well as incoming clouds from the ocean to land by cold air mass in the winter season. The difference of CBHs between the spring and autumn is also observed, with very low-level clouds occurring only in Taean, seemingly caused by the circulation mechanism from the land–sea contrasts around the coast such as sea breeze. CBH frequency of the upper level was represented more frequently in autumn (both inland and coastal areas) and spring (coastal area).
The distance between CBHs of adjacent layers occurring the multilayered clouds was located 500 m up to 70% and 76% at inland and coastal area, respectively. This indicates that most of the distance between adjacent CBHs are within 1000 m regardless of inland or coastal areas, although they are slightly different. Each seasonal characteristic of clouds was obtained by means of case studies. They were well detected, such as few clouds during a summer heatwave period and continuous low-level clouds during rainy seasons and so on. This also shows the difference between the cloud behaviors over inland and coastal area. Ceilometers are useful because they reflect well the seasonal and vertical cloud characteristics of each region. Thus, they will be very helpful in the construction of cloud climatology through a long period of data collection.
Despite these findings, the results have some limitations: (1) the results of this study include the limitation of comparison according to the different version of instruments because identical instruments were not installed in both stations; (2) along with the differences of performance between ceilometer CL51 and CL31, a period of three-year that can be collected is not long enough for comparison in regional characteristics of clouds; and (3) there are geographical limitations of the Korean peninsula in the middle latitude.
The different cloud behaviors are shown clearly from the inland and coastal areas in this study even under such limitations. Different results could be produced if comparisons of cloud behaviors over inland and coastal areas would be applied to different regions. Nevertheless, this study shows that cloud characteristics of inland and coastal areas appear distinctly different even in the Korean peninsula.
We note that this study lays the foundation for possible future studies including the cloud characteristics of the entire Korean peninsula with the long-term data. In addition, it would be able to expand to other research fields, e.g., cloud model corrections of Earth’s energy budget, developing a new method for determination of the mixing height and modeling method reflecting regional meteorological characteristics.

Author Contributions

Conceptualization, S.L. and S.-W.K.; formal analysis, S.L.; resources and data curation, J.K.; writing—original draft preparation, S.L.; writing—review and editing, S.-O.H. and S.-W.K.; supervision, S.-W.K.; methodology and project administration, J.N.C. and K.-B.A. All authors have read and agreed to the published version of the manuscript.

Funding

This research was funded by the Agency for Defense Development, 14-201-103-030. This research was supported by Basic Science Research Program through the National Research Foundation of Korea (NRF) funded by the Ministry of Education, No. 2018R1D1A1B07048991. Support for this work was provided by the National Research Foundation of Korea to the Center for Galaxy Evolution Research (No. 2017R1A5A1070354).

Acknowledgments

Authors would like to thank Jhoon Kim for helping with the scientific background and advices for this study.

Conflicts of Interest

The authors declare no conflict of interest.

References

  1. Boucher, O.; Randall, D.; Artaxo, P.; Bretherton, C.; Feingold, G.; Forster, P.; Kerminen, V.-M.; Kondo, Y.; Liao, H.; Lohmann, U.; et al. Clouds and aerosols. In Climate Change 2013: The Physical Science Basis; Contribution of Working Group I to the Fifth Assessment Report of the Intergovernmental Panel on Climate Change; Stocker, T.F., Qin, D., Plattner, G.-K., Tignor, M., Allen, S.K., Boschung, J., Nauels, A., Xia, Y., Bex, V., Midgley, P.M., Eds.; Cambridge University Press: Cambridge, UK; New York, NY, USA, 2013; pp. 571–658. [Google Scholar]
  2. Lee, S.; Hwang, S.-O.; Kim, J.; Ahn, M.-H. Characteristics of cloud occurrence using ceilometer measurements and its relationship to precipitation over seoul. Atmos. Res. 2018, 201, 46–57. [Google Scholar] [CrossRef]
  3. Hong, Y.; Liu, G. The characteristics of ice cloud properties derived from cloudsat and calipso measurements. J. Clim. 2015, 28, 3880–3901. [Google Scholar] [CrossRef]
  4. Nakajima, T.; Yoon, S.C.; Ramanathan, V.; Shi, G.Y.; Takemura, T.; Higurashi, A.; Takamura, T.; Aoki, K.; Sohn, B.J.; Kim, S.W. Overview of the atmospheric brown cloud east asian regional experiment 2005 and a study of the aerosol direct radiative forcing in east asia. J. Geophys. Res. Atmos. 2007, 112, D24S91. [Google Scholar] [CrossRef]
  5. An, N.; Pinker, R.T.; Wang, K.; Rogers, E.; Zuo, Z. Evaluation of cloud base height in the north american regional reanalysis using ceilometer observations. Int. J. Climatol. 2020, 40, 3161–3178. [Google Scholar] [CrossRef]
  6. Gaumet, J.; Heinrich, J.; Cluzeau, M.; Pierrard, P.; Prieur, J. Cloud-base height measurements with a single-pulse erbium-glass laser ceilometer. J. Atmos. Ocean. Technol. 1998, 15, 37–45. [Google Scholar] [CrossRef]
  7. Shields, J.E.; Karr, M.E.; Johnson, R.W.; Burden, A.R. Day/night whole sky imagers for 24-h cloud and sky assessment: History and overview. Appl. Opt. 2013, 52, 1605–1616. [Google Scholar] [CrossRef]
  8. Cazorla, A.; Olmo, F.; Alados-Arboledas, L. Development of a sky imager for cloud cover assessment. JOSA A 2008, 25, 29–39. [Google Scholar] [CrossRef]
  9. Sun, X.; Gao, T.; Zhai, D.; Zhao, S.; Lian, J. Whole sky infrared cloud measuring system based on the uncooled infrared focal plane array. Infrared Laser Eng. 2008, 37, 761–764. [Google Scholar]
  10. Wiegner, M.; Madonna, F.; Binietoglou, I.; Forkel, R.; Gasteiger, J.; Geiß, A.; Pappalardo, G.; Schäfer, K.; Thomas, W. What is the benefit of ceilometers for aerosol remote sensing? An answer from earlinet. Atmos. Meas. Tech. 2014, 7, 1979–1997. [Google Scholar] [CrossRef] [Green Version]
  11. Wang, J.; Rossow, W.B.; Zhang, Y. Cloud vertical structure and its variations from a 20-yr global rawinsonde dataset. J. Clim. 2000, 13, 3041–3056. [Google Scholar] [CrossRef]
  12. Poore, K.D.; Wang, J.; Rossow, W.B. Cloud layer thicknesses from a combination of surface and upper-air observations. J. Clim. 1995, 8, 550–568. [Google Scholar] [CrossRef] [Green Version]
  13. Rossow, W.B.; Schiffer, R.A. Isccp cloud data products. Bull. Am. Meteorol Soc. 1991, 72, 2–20. [Google Scholar] [CrossRef]
  14. Probst, P.; Rizzi, R.; Tosi, E.; Lucarini, V.; Maestri, T. Total cloud cover from satellite observations and climate models. Atmos. Res. 2012, 107, 161–170. [Google Scholar] [CrossRef]
  15. Wang, J.; Rossow, W.B. Determination of cloud vertical structure from upper-air observations. J. Appl. Meteorol. 1995, 34, 2243–2258. [Google Scholar] [CrossRef] [Green Version]
  16. Wang, J.; Rossow, W.B.; Uttal, T.; Rozendaal, M. Variability of cloud vertical structure during astex observed from a combination of rawinsonde, radar, ceilometer, and satellite. Mon. Weather. Rev. 1999, 127, 2484–2502. [Google Scholar] [CrossRef]
  17. Randall, D.A.; Albrecht, B.; Cox, S.; Johnson, D.; Minnis, P.; Rossow, W.; Starr, D.C. On fire at ten. Adv. Geophys. 1996, 38, 37–177. [Google Scholar]
  18. Starr, D.O.C. A cirrus-cloud experiment: Intensive field observations planned for fire. Bull. Am. Meteorol. Soc. 1987, 68, 119–124. [Google Scholar] [CrossRef] [Green Version]
  19. Schiffer, R.A.; Rossow, W.B. The international satellite cloud climatology project (isccp): The first project of the world climate research programme. Bull. Am. Meteorol Soc. 1983, 64, 779–784. [Google Scholar] [CrossRef] [Green Version]
  20. Liou, K.-N. Radiation and Cloud Processes in the Atmosphere. Theory, Observation, and Modeling. Available online: https://www.osti.gov/biblio/7081459 (accessed on 3 December 2020).
  21. Rasmussen, R.M.; Smolarkiewicz, P.; Warner, J. On the dynamics of hawaiian cloud bands: Comparison of model results with observations and island climatology. J. Atmos. Sci. 1989, 46, 1589–1608. [Google Scholar] [CrossRef] [Green Version]
  22. Kollias, P.; Tselioudis, G.; Albrecht, B.A. Cloud climatology at the southern great plains and the layer structure, drizzle, and atmospheric modes of continental stratus. J. Geophys. Res Atmos. 2007, 112, D09116. [Google Scholar] [CrossRef]
  23. Van Tricht, K.; Gorodetskaya, I.; Lhermitte, S.; Turner, D.; Schween, J.; Van Lipzig, N. An improved algorithm for polar cloud-base detection by ceilometer over the ice sheets. Atmos. Meas. Tech. 2014, 7, 1153–1167. [Google Scholar] [CrossRef] [Green Version]
  24. Martucci, G.; Milroy, C.; O’Dowd, C.D. Detection of cloud-base height using jenoptik chm15k and vaisala cl31 ceilometers. J. Atmos Ocean. Technol. 2010, 27, 305–318. [Google Scholar] [CrossRef]
  25. Costa-Surós, M.; Calbó, J.; González, J.; Martin-Vide, J. Behavior of cloud base height from ceilometer measurements. Atmos. Res. 2013, 127, 64–76. [Google Scholar] [CrossRef] [Green Version]
  26. Liu, L.; Sun, X.-J.; Liu, X.-C.; Gao, T.-C.; Zhao, S.-J. Comparison of cloud base height derived from a ground-based infrared cloud measurement and two ceilometers. Adv. Meteorol. 2015, 2015, 853861. [Google Scholar] [CrossRef] [Green Version]
  27. Jarraud, M. Guide to Meteorological Instruments and Methods of Observation; World Meteorological Organization: Geneva, Switzerland, 2008. [Google Scholar]
  28. Vaishnav, R.; Sharma, S.; Shukla, K.; Kumar, P.; Lal, S. A comprehensive statistical study of cloud base height using ceilometer over western india. Adv. Space Res. 2019, 63, 1708–1718. [Google Scholar] [CrossRef]
  29. Oyj, V. Vaisala Ceilometer cl51 User’s Guide; Vaisala Oyj: Helsinki, Finland, 2012; Available online: https://www.raimet.ru/imgs/db/catalog2_files/file_106.pdf (accessed on 3 December 2020).
  30. KMA. Annual Climatological Report. Available online: http://www.weather.gov.sg/wp-content/uploads/2018/03/Annual-Climatological-Report-2017.pdf (accessed on 3 December 2020).
  31. Morris, V.; Winston, H.A. Laser Ceilometer cl51 Demonstration Field Campaign Report. Available online: https://www.osti.gov/biblio/1254298-laser-ceilometer-cl51-demonstration-field-campaign-report (accessed on 3 December 2020).
  32. Min, S.-K.; Kim, Y.-H.; Lee, S.-M.; Sparrow, S.; Li, S.; Lott, F.C.; Stott, P.A. Quantifying human impact on the 2018 summer longest heat wave in south korea. Bull. Am. Meteorol. Soc. 2020, 101, S103–S108. [Google Scholar] [CrossRef] [Green Version]
  33. Lee, H.-D.; Min, K.-H.; Bae, J.-H.; Cha, D.-H. Characteristics and comparison of 2016 and 2018 heat wave in korea. Atmosphere 2020, 30, 1–15. [Google Scholar]
  34. Yoon, D.; Cha, D.-H.; Lee, M.-I.; Min, K.-H.; Kim, J.; Jun, S.-Y.; Choi, Y. Recent changes in heatwave characteristics over korea. Clim. Dyn. 2020, 55, 1685–1696. [Google Scholar] [CrossRef]
  35. KMA. Annual Climatological Report. Available online: http://www.weather.gov.sg/wp-content/uploads/2020/03/Annual-Climate-Assessment-Report-2019.pdf (accessed on 3 December 2020).
  36. Lau, K.-M.; Li, M.-T. The monsoon of east asia and its global associations—A survey. Bull. Am. Meteorol. Soc. 1984, 65, 114–125. [Google Scholar] [CrossRef]
  37. Jhun, J.-G.; Lee, E.-J. A new east asian winter monsoon index and associated characteristics of the winter monsoon. J. Clim. 2004, 17, 711–726. [Google Scholar] [CrossRef]
  38. Eichenlaub, V.L. Lake effect snowfall to the lee of the great lakes: Its role in michigan. Bull. Am. Meteorol. Soc. 1970, 51, 403–413. [Google Scholar] [CrossRef]
  39. Niziol, T.A.; Snyder, W.R.; Waldstreicher, J.S. Winter weather forecasting throughout the eastern united states. Part iv: Lake effect snow. Weather. Forecast. 1995, 10, 61–77. [Google Scholar] [CrossRef] [Green Version]
  40. Lee, H.Y.; Chang, E.C. Impact of land-sea thermal contrast on the inland penetration of sea fog over the coastal area around the korean peninsula. J. Geophys. Res. Atmos. 2018, 123, 6487–6504. [Google Scholar] [CrossRef]
  41. Wang, B. Rainy season of the asian–pacific summer monsoon. J Clim. 2002, 15, 386–398. [Google Scholar] [CrossRef] [Green Version]
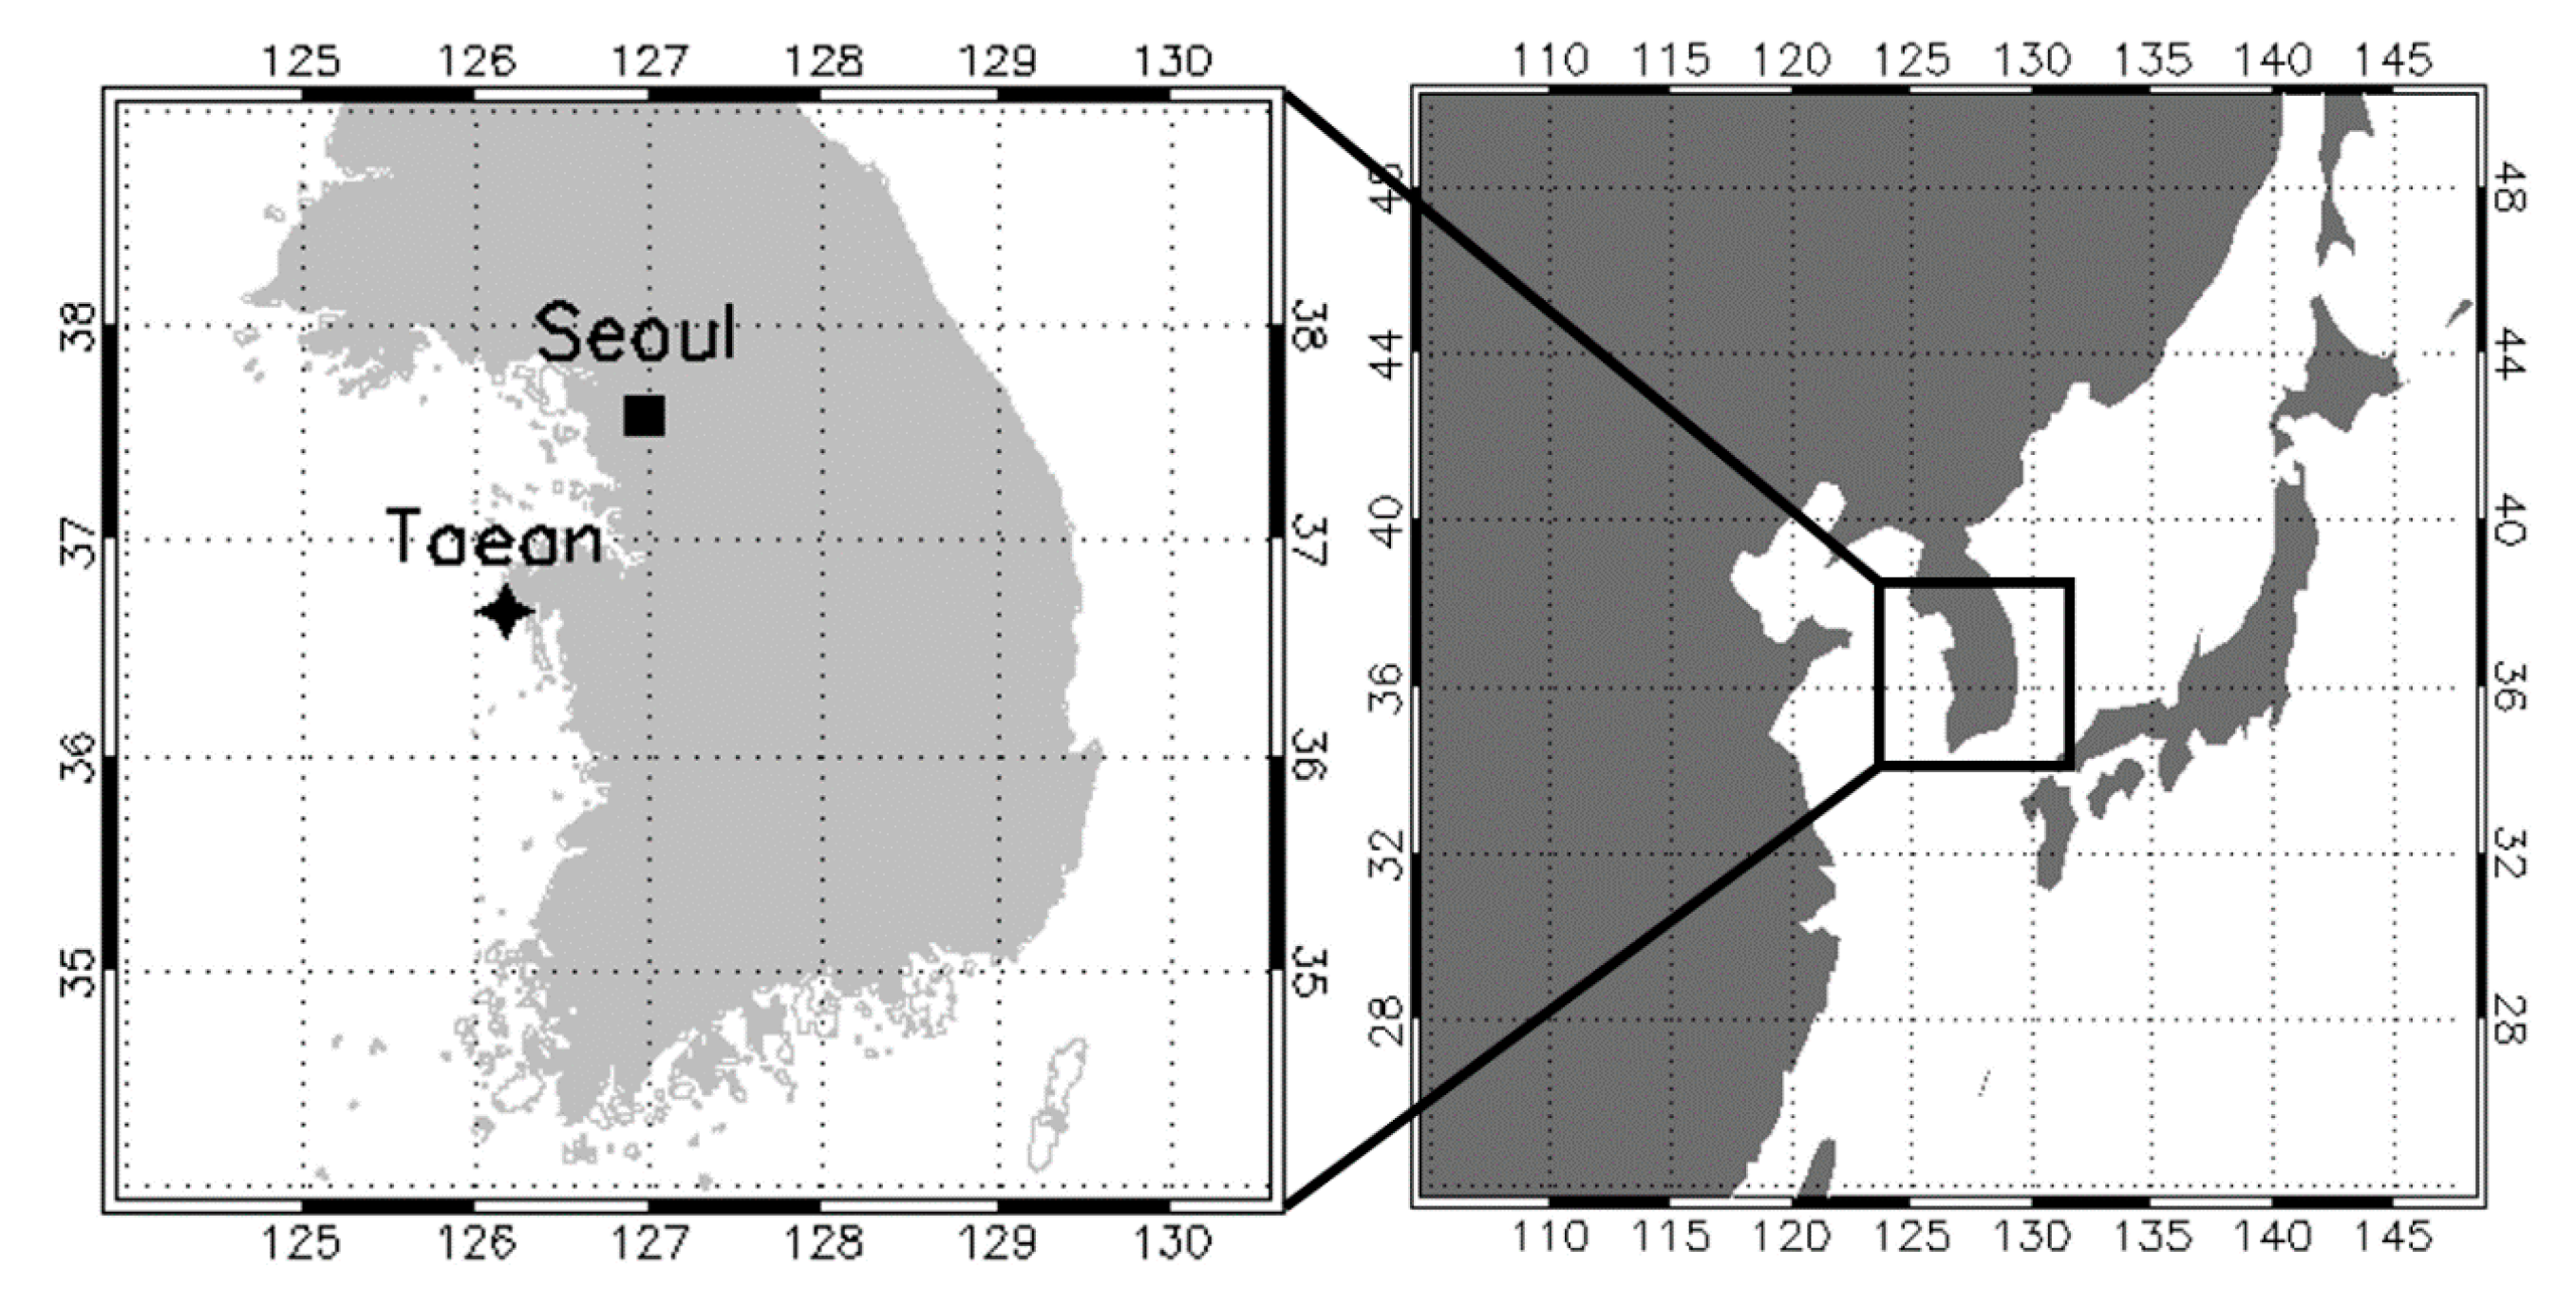
Figure 1. Map of Seoul and Taean locations of ceilometers. Solid square symbol is the Seoul (Seoul_S1 and Seoul_S2, 126.98° E, 37.58° N) station areas. Solid star is the Taean (Taean_S1 and Taean_S2, 126.29° E, 36.75° N) station areas.
Atmosphere 11 01316 g001
Figure 2. Annual variations of monthly cloud occurrence (0–7750 m) derived from ceilometer measurements at Seoul (Seoul_S1, Seoul_S2) and Taean (Taean_S1, Taean_S2) stations: (a) 2017, (b) 2018, and (c) 2019.
Atmosphere 11 01316 g002
Figure 3. Annual variations of monthly averaged cloud occurrence (AVG) (0–7750 m) derived from ceilometer measurements at Seoul and Taean from 2017 to 2019. Each annual variation of monthly cloud occurrence is averaged at both Seoul (Seoul_S1 and Seoul_S2) and Taean (Taean_T1 and Tanean_T2) stations.
Atmosphere 11 01316 g003
Figure 4. Monthly precipitation in Seoul (red bar) and in Taean (black bar) for (a) 2017, (b) 2018, and (c) 2019. Black and gray lines represent monthly climatology of precipitation during 30-years (1981–2010) at Seoul (black dot-line) and Seosan (gray dot-line), respectively. (d) The monthly temperature averaged during the period of 2017–2019 in Seoul (black dot-line) and Taean (gray square-line).
Atmosphere 11 01316 g004
Figure 5. Frequency distributions of aggregated cloud base heights (CBHs) for all layers (bold black) and a single layer (bold gray) retrieved by the ceilometers at (a) Seoul and (b) Taean during a period 2017–2019. Thin vertical thin gray lines represent the annual averages.
Atmosphere 11 01316 g005
Figure 6. Seasonal vertical distributions of cloud occurrence at (a) Seoul and (b) Taean for the entire period.
Atmosphere 11 01316 g006
Figure 7. Examples of a winter case on 24–31 January 2019 at (a,c) Seoul (Seoul_S2 station), (b,d) Taean (Taean_S1 station); (a,b) backscatter profiles and (c,d) CBHs detected by ceilometer over Seoul detected by ceilometer over Seoul. The colorbar represents the intensity of backscatter signals. The cyan, purple, and red triangles indicate the 1st, 2nd, and 3rd CBHs, respectively.
Atmosphere 11 01316 g007
Figure 8. Examples of a summer case on 24–31 July 2019 at (a,c) Seoul (Seoul_S2 station), (b,d) Taean (Taean_S1 station); (a,b) backscatter profiles and (c,d) CBHs detected by ceilometer over Seoul. detected by ceilometer over Seoul. The color bar represents the intensity of backscatter signals. The cyan, purple, and red triangles represent the 1st, 2nd, and 3rd CBHs, respectively.
Atmosphere 11 01316 g008aAtmosphere 11 01316 g008b
Figure 9. Examples of an autumn case on 23–30 September 2017 at (a,c) Seoul (Seoul_S2 station), (b,d) Taean (Taean_S1 station); (a,b) backscatter profiles and (c,d) CBHs detected by ceilometer over Seoul detected by ceilometer over Seoul. The color bar represents the intensity of backscatter signals. The cyan, purple, and red triangles represent the 1st, 2nd, and 3rd CBHs, respectively.
Atmosphere 11 01316 g009
Table 1. Technical details of the ceilometers at Seoul and Taean stations.
InstrumentCeilometer
ModelVaisala CL51Vaisala CL31
Measurement rangeBackscatter profiles 0–15,000 m
Cloud base height 0–13,000 m
Backscatter profiles 0–7750 m
Cloud base height 0–7750 m
Vertical resolution10 m5 m
Temporal resolution1 min30 s
Laser sourceInGaAs pulsed diodeInGaAs pulsed diode
Wavelength910 nm910 nm
Operating periodNovember 2013–presentJanuary 2017–present
Table 2. Monthly data availability at each station. Data availability rates of less than 80% are shown in bold.
YearStationMonth
123456789101112Total
2017Seoul_S1100100100100100100100100100100100100100
Seoul_S2100100100100100100100100100100100100100
Taean_S110099.887.199.999.999.899.999.499.899.899.997.198.5
Taean_S299.699.394.898.399.798.398.496.899.799.893.379.796.5
2018Seoul_S110010010010010093.810010010010010010099.5
Seoul_S210010010010010010010024.710010010010093.7
Taean_S187.799.999.896.099.998.785.595.597.096.899.797.196.1
Taean_S290.399.540.654.799.699.867.793.596.098.151.743.577.9
2019Seoul_S110010010099.995.010010074.2036.810098.883.7
Seoul_S210010010010010065.638.710010075.573.310087.8
Taean_S199.099.910095.399.988.797.799.994.799.594.394.897.1
Taean_S294.599.999.896.099.790.790.099.485.398.493.394.595.1
Publisher’s Note: MDPI stays neutral with regard to jurisdictional claims in published maps and institutional affiliations.