Spatial Distribution and Biomonitoring of Atmospheric Mercury Concentrations over a Contaminated Coastal Lagoon (Northern Adriatic, Italy)

 , ,
, , 
 ,
, 
Abstract
1. Introduction
2. Material and Methods
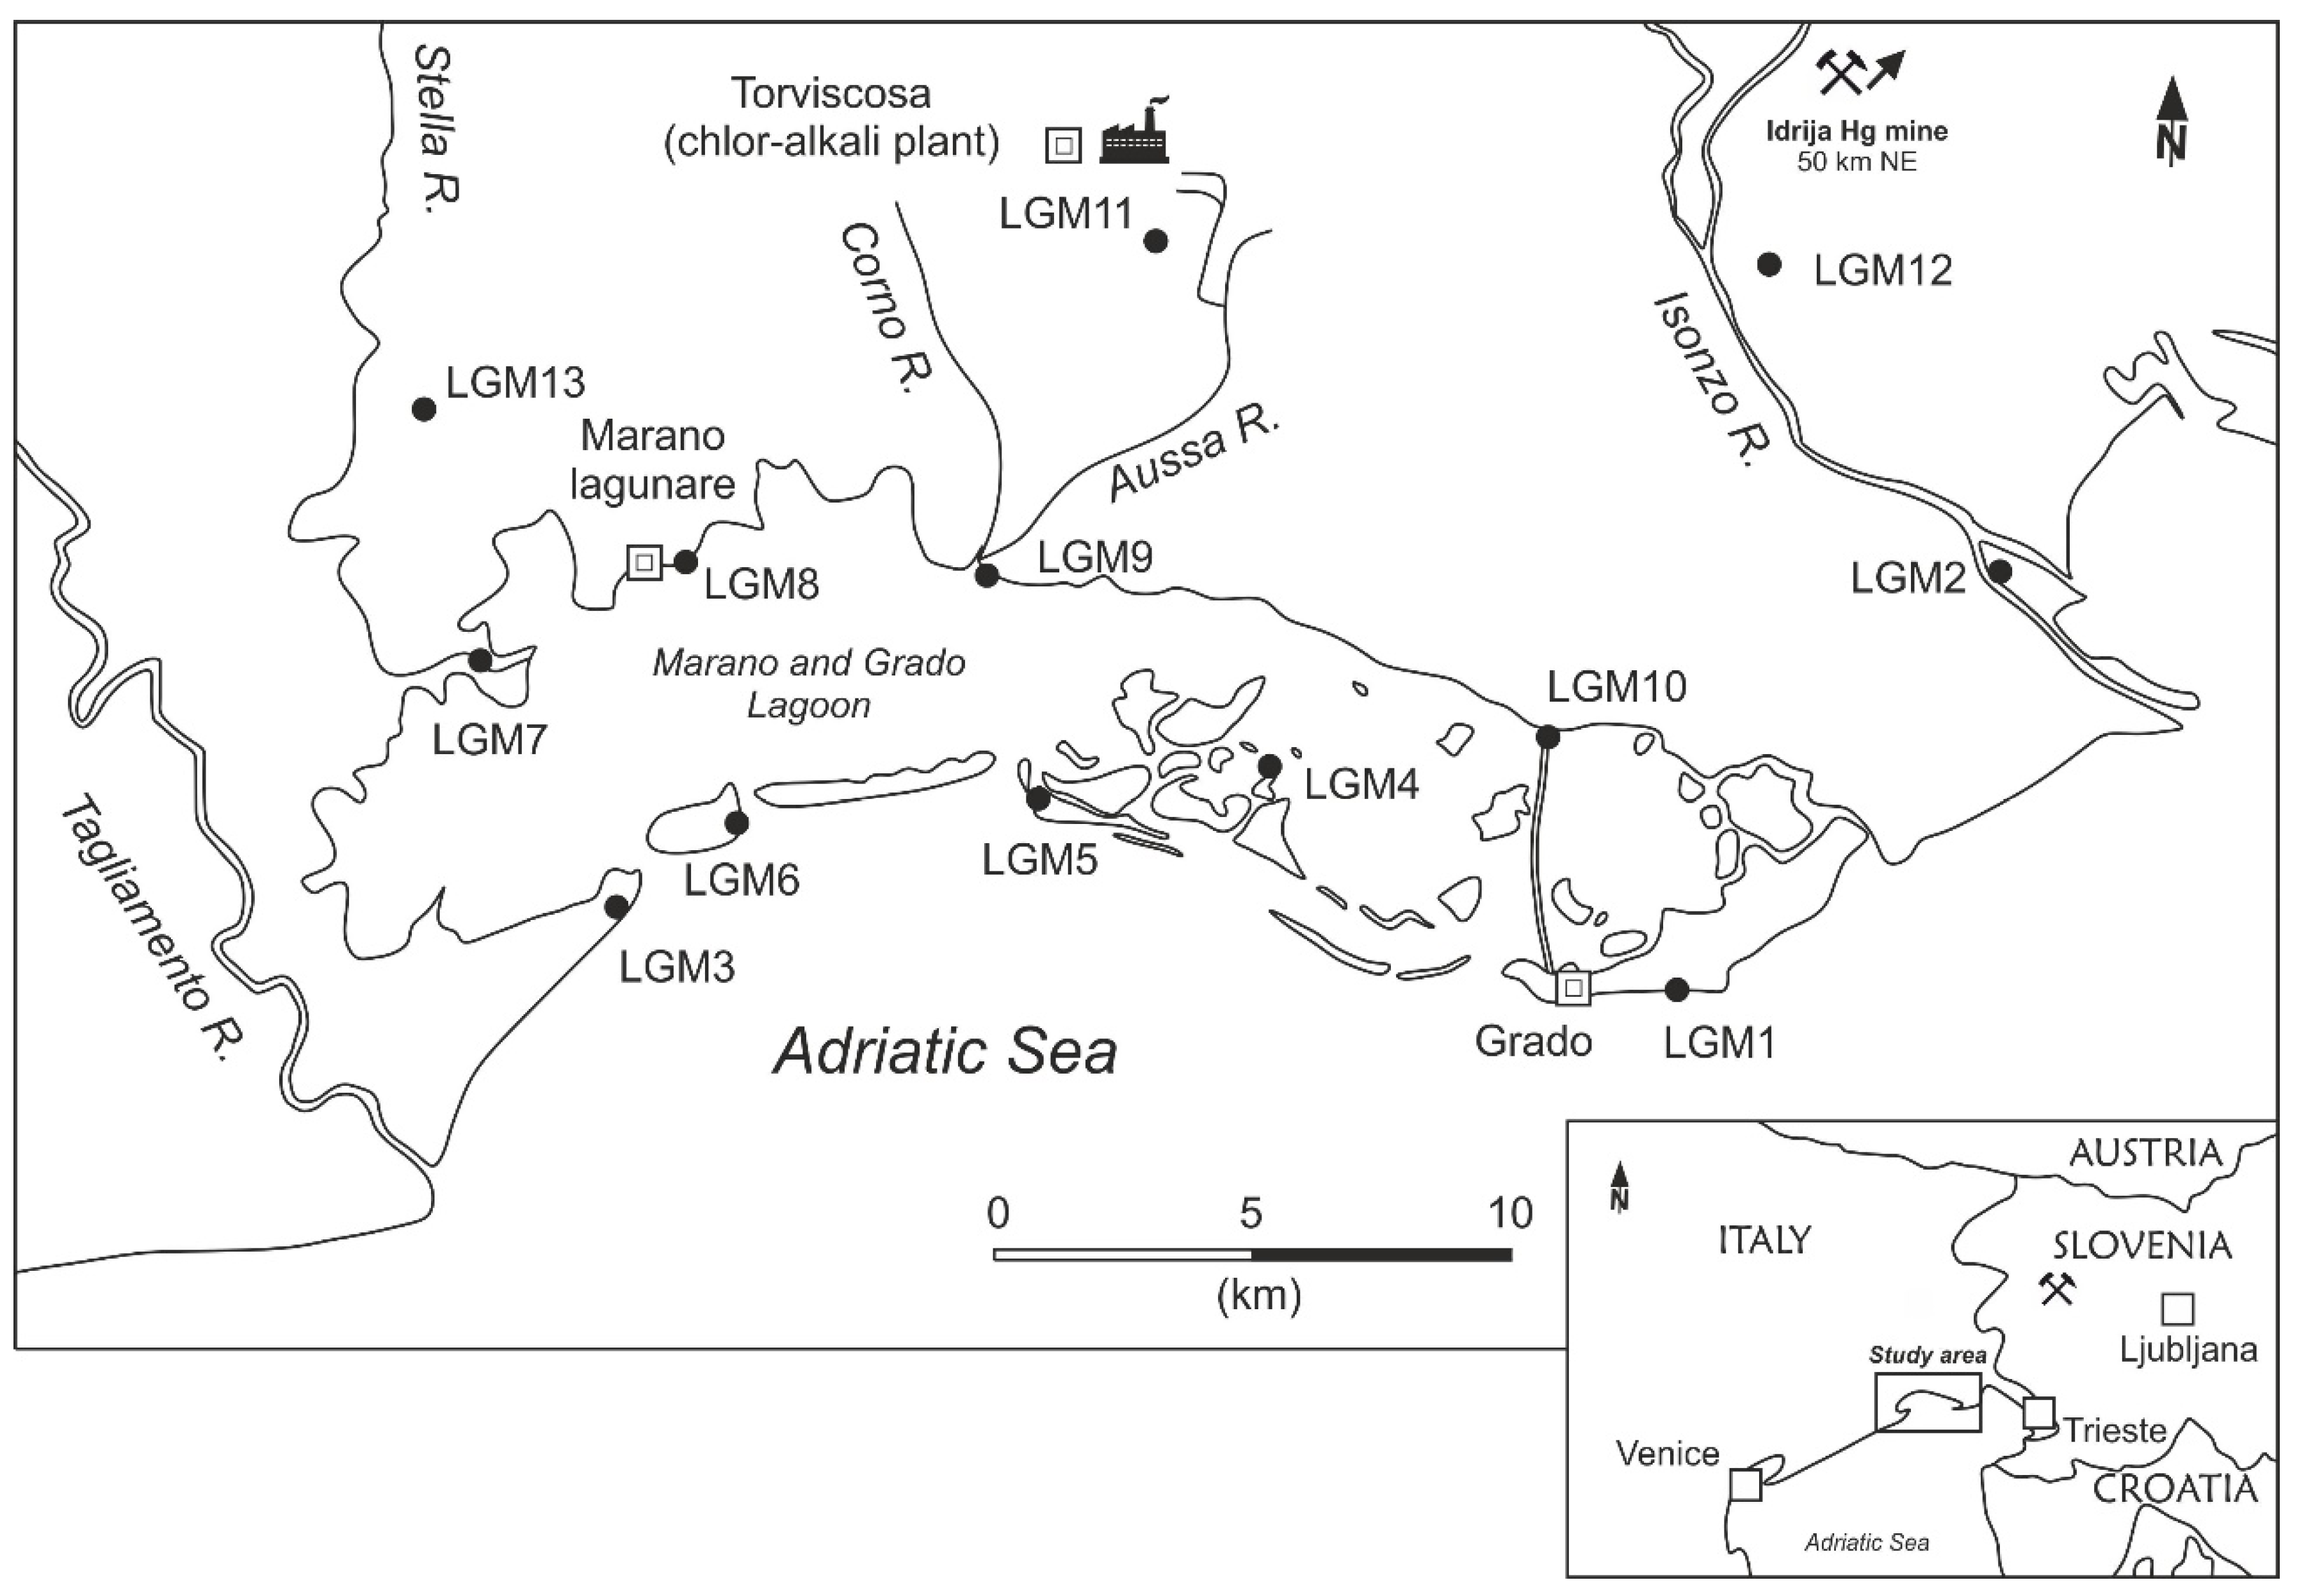
2.1. Study Area
2.2. Gaseous Elemental Mercury (GEM) Measurements
2.3. Lichen Survey
3. Results and Discussions
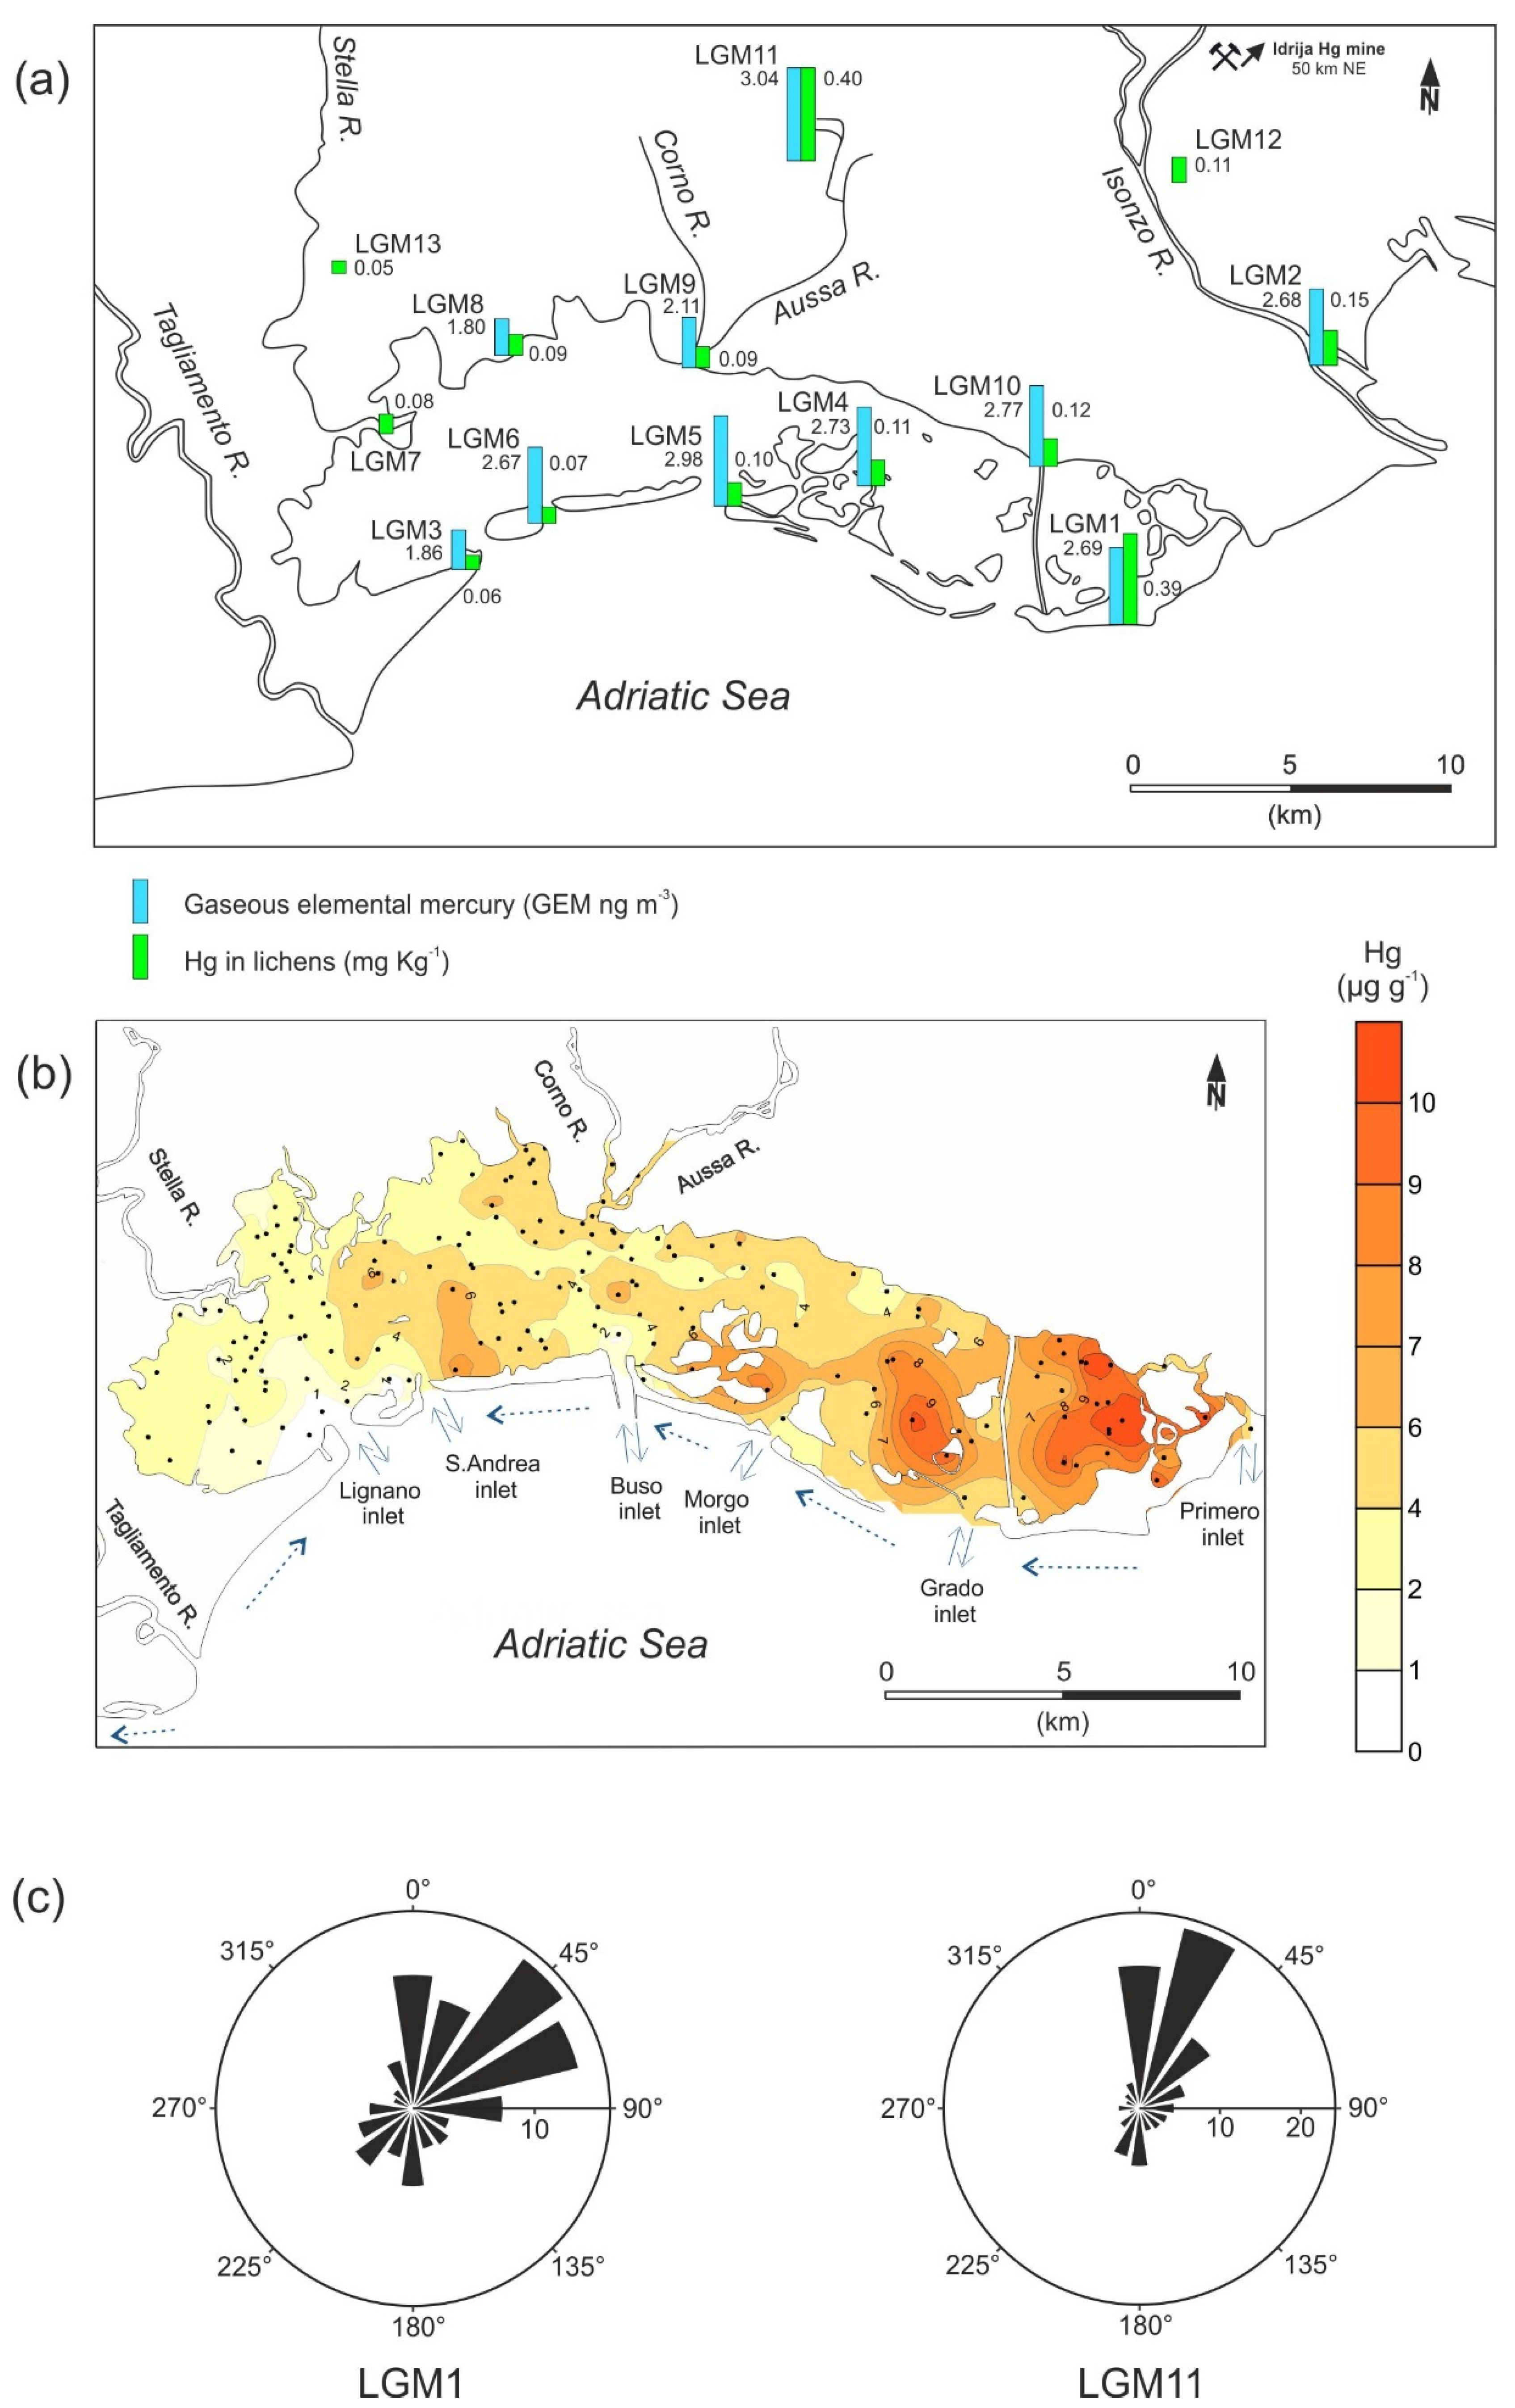
3.1. GEM Level and Distribution
3.2. Total Hg in Lichens
4. Conclusions
Supplementary Materials
Author Contributions
Funding
Acknowledgments
Conflicts of Interest
References
- Wright, L.P.; Zhang, L.; Cheng, I.; Aherne, J.; Wentworth, G.R. Impacts and Effects Indicators of Atmospheric Deposition of Major Pollutants to Various Ecosystems—A Review. Aerosol Air Qual. Res. 2018, 18, 1953–1992. [Google Scholar] [CrossRef]
- Bernhoft, R.A. Mercury Toxicity and Treatment: A Review of the Literature. J. Environ. Public Health 2012, 2012. [Google Scholar] [CrossRef]
- Selin, N.E. Global Biogeochemical Cycling of Mercury: A Review. Annu. Rev. Environ. Resour. 2009, 34, 43–63. [Google Scholar] [CrossRef]
- Travnikov, O. Atmospheric Transport of Mercury. In Environmental Chemistry and Toxicology of Mercury; Liu, G., Cai, Y., O’Driscoll, N., Eds.; John Wiley and Sons: Hoboken, NJ, USA, 2011; pp. 329–365. [Google Scholar] [CrossRef]
- Kalinchuk, V.V.; Lopatnikov, E.A.; Astakhov, A.S.; Ivanov, M.V.; Hu, L. Distribution of Atmospheric Gaseous Elemental Mercury (Hg(0)) from the Sea of Japan to the Arctic, and Hg(0) Evasion Fluxes in the Eastern Arctic Seas: Results from a Joint Russian-Chinese Cruise in Fall 2018. Sci. Total Environ. 2018, 753, 142003. [Google Scholar] [CrossRef]
- Schroeder, W.H.; Munthe, J. Atmospheric Mercury-An Overview. Atmos. Environ. 1998, 32, 809–822. [Google Scholar] [CrossRef]
- Saiz-Lopez, A.; Sitkiewicz, S.P.; Roca-Sanjuán, D.; Oliva-Enrich, J.M.; Dávalos, J.Z.; Notario, R.; Jiskra, M.; Xu, Y.; Wang, F.; Thackray, C.P.; et al. Photoreduction of Gaseous Oxidized Mercury Changes Global Atmospheric Mercury Speciation, Transport and Deposition. Nat. Commun. 2018, 9, 4796. [Google Scholar] [CrossRef]
- Travnikov, O. Contribution of the Intercontinental Atmospheric Transport to Mercury Pollution in the Northern Hemisphere. Atmos. Environ. 2005, 39, 7541–7548. [Google Scholar] [CrossRef]
- Fitzgerald, W.F.; Engstrom, D.R.; Mason, R.P.; Nater, E.A. The Case for Atmospheric Mercury Contamination in Remote Areas. Environ. Sci. Technol. 1998, 32, 1–7. [Google Scholar] [CrossRef]
- Yin, R.; Lepak, R.F.; Krabbenhoft, D.P.; Hurley, J.P. Sedimentary Records of Mercury Stable Isotopes in Lake MichiganMercury Isotopic Records in Sediment Cores of Lake Michigan. Elementa 2016, 2016, 1–12. [Google Scholar] [CrossRef]
- Kurz, A.Y.; Blum, J.D.; Washburn, S.J.; Baskaran, M. Changes in the Mercury Isotopic Composition of Sediments from a Remote Alpine Lake in Wyoming, USA. Sci. Total Environ. 2019, 669, 973–982. [Google Scholar] [CrossRef]
- Leopold, K.; Foulkes, M.; Worsfold, P. Methods for the Determination and Speciation of Mercury in Natural Waters—A Review. Anal. Chim. Acta 2010, 663, 127–138. [Google Scholar] [CrossRef]
- Celo, V.; Lean, D.R.S.; Scott, S.L. Abiotic Methylation of Mercury in the Aquatic Environment. Sci. Total Environ. 2006, 368, 126–137. [Google Scholar] [CrossRef]
- Fitzgerald, W.F.; Clarkson, T.W. Mercury and Monomethylmercury: Present and Future Concerns. Environ. Health Perspect. 1991, 96, 159–166. [Google Scholar] [CrossRef]
- Beckers, F.; Rinklebe, J. Cycling of Mercury in the Environment: Sources, Fate, and Human Health Implications: A Review. Crit. Rev. Environ. Sci. Technol. 2017, 47, 693–794. [Google Scholar] [CrossRef]
- Poissant, L.; Pilote, M.; Beauvais, C.; Constant, P.; Zhang, H.H. A Year of Continuous Measurements of Three Atmospheric Mercury Species (GEM, RGM and Hgp) in Southern Québec, Canada. Atmos. Environ. 2005, 39, 1275–1287. [Google Scholar] [CrossRef]
- Mao, H.; Talbot, R.W.; Sigler, J.M.; Sive, B.C.; Hegarty, J.D. Seasonal and Diurnal Variations of Hg° over New England. Atmos. Chem. Phys. 2008, 8, 1403–1421. [Google Scholar] [CrossRef]
- Amos, H.M.; Jacob, D.J.; Holmes, C.D.; Fisher, J.A.; Wang, Q.; Yantosca, R.M.; Corbitt, E.S.; Galarneau, E.; Rutter, A.P.; Gustin, M.S.; et al. Gas-Particle Partitioning of Atmospheric Hg (II) and Its Effect on Global Mercury Deposition. Atmos. Chem. Phys. 2012, 591–603. [Google Scholar] [CrossRef]
- Zhang, L.; Zhou, P.; Cao, S.; Zhao, Y. Atmospheric Mercury Deposition over the Land Surfaces and the Associated Uncertainties in Observations and Simulations: A Critical Review. Atmos. Chem. Phys. 2019, 19, 15587–15608. [Google Scholar] [CrossRef]
- Timonen, H.; Ambrose, J.L.; Jaffe, D.A. Oxidation of Elemental Hg in Anthropogenic and Marine Airmasses. Atmos. Chem. Phys. 2013, 13, 2827–2836. [Google Scholar] [CrossRef]
- Driscoll, C.T.; Mason, R.P.; Chan, H.M.; Jacob, D.J.; Pirrone, N. Mercury as a Global Pollutant: Sources, Pathways, and Effects. Environ. Sci. Technol. 2013, 47, 4967–4983. [Google Scholar] [CrossRef]
- Mason, R.P. Mercury Emissions from Natural Processes and Their Importance in the Global Mercury Cycle. In Mercury Fate and Transport in the Global Atmosphere: Emissions, Measurements and Models; Pirrone, N., Mason, R.P., Eds.; Springer: New York, NY, USA, 2009; pp. 173–191. [Google Scholar] [CrossRef]
- UN Environment. Global Mercury Assessment 2018; United Nations Environment Programme, Chemicals and Health Branch: Geneva, Switzerland, 2019; p. 62. [Google Scholar]
- Pacyna, E.G.; Pacyna, J.M.; Sundseth, K.; Munthe, J.; Kindbom, K.; Wilson, S.; Steenhuisen, F.; Maxson, P. Global Emission of Mercury to the Atmosphere from Anthropogenic Sources in 2005 and Projections to 2020. Atmos. Environ. 2010, 44, 2487–2499. [Google Scholar] [CrossRef]
- Amos, H.M.; Jacob, D.J.; Streets, D.G.; Sunderland, E.M. Legacy Impacts of All-Time Anthropogenic Emissions on the Global Mercury Cycle. Glob. Biogeochem. Cycles 2013, 27, 410–421. [Google Scholar] [CrossRef]
- Enrico, M.; Le Roux, G.; Heimbürger, L.E.; Van Beek, P.; Souhaut, M.; Chmeleff, J.; Sonke, J.E. Holocene Atmospheric Mercury Levels Reconstructed from Peat Bog Mercury Stable Isotopes. Environ. Sci. Technol. 2017, 51, 5899–5906. [Google Scholar] [CrossRef]
- Mason, R.P.; Sheu, G.R. Role of the Ocean in the Global Mercury Cycle. Glob. Biogeochem. Cycles 2002, 16, 40. [Google Scholar] [CrossRef]
- Sprovieri, F.; Pirrone, N.; Ebinghaus, R.; Kock, H.; Dommergue, A. A Review of Worldwide Atmospheric Mercury Measurements. Atmos. Chem. Phys. 2010, 10, 8245–8265. [Google Scholar] [CrossRef]
- Slemr, F.; Brunke, E.G.; Ebinghaus, R.; Kuss, J. Worldwide Trend of Atmospheric Mercury since 1995. Atmos. Chem. Phys. 2011, 11, 4779–4787. [Google Scholar] [CrossRef]
- Sprovieri, F.; Pirrone, N.; Bencardino, M.; D’Amore, F.; Carbone, F.; Cinnirella, S.; Mannarino, V.; Landis, M.; Ebinghaus, R.; Weigelt, A.; et al. Atmospheric Mercury Concentrations Observed at Ground-Based Monitoring Sites Globally Distributed in the Framework of the GMOS Network. Atmos. Chem. Phys. 2016, 16, 11915–11935. [Google Scholar] [CrossRef]
- Obrist, D.; Kirk, J.L.; Zhang, L.; Sunderland, E.M.; Jiskra, M.; Selin, N.E. A Review of Global Environmental Mercury Processes in Response to Human and Natural Perturbations: Changes of Emissions, Climate, and Land Use. Ambio 2018, 47, 116–140. [Google Scholar] [CrossRef]
- Lyman, S.N.; Cheng, I.; Gratz, L.E.; Weiss-penzias, P.; Zhang, L. An Updated Review of Atmospheric Mercury. Sci. Total Environ. 2020, 707, 55–75. [Google Scholar] [CrossRef]
- Lan, X.; Talbot, R.; Laine, P.; Lefer, B.; Flynn, J.; Torres, A. Seasonal and Diurnal Variations of Total Gaseous Mercury in Urban Houston, TX, USA. Atmosphere 2014, 5, 399–419. [Google Scholar] [CrossRef]
- Mao, H.; Cheng, I.; Zhang, L. Current Understanding of the Driving Mechanisms for Spatiotemporal Variations of Atmospheric Speciated Mercury: A Review. Atmos. Chem. Phys. 2016, 16, 12897–12924. [Google Scholar] [CrossRef]
- Higueras, P.; Oyarzun, R.; Kotnik, J.; Esbrí, J.M.; Martínez-Coronado, A.; Horvat, M.; López-Berdonces, M.A.; Llanos, W.; Vaselli, O.; Nisi, B.; et al. A Compilation of Field Surveys on Gaseous Elemental Mercury (GEM) from Contrasting Environmental Settings in Europe, South America, South Africa and China: Separating Fads from Facts. Environ. Geochem. Health 2014, 36, 713–734. [Google Scholar] [CrossRef]
- Acquavita, A.; Biasiol, S.; Lizzi, D.; Mattassi, G.; Pasquon, M.; Skert, N.; Marchiol, L. Gaseous Elemental Mercury Level and Distribution in a Heavily Contaminated Site: The Ex-Chlor Alkali Plant in Torviscosa (Northern Italy). Water. Air. Soil Pollut. 2017, 228. [Google Scholar] [CrossRef]
- Esbrí, J.M.; Martínez-Coronado, A.; Higueras, P.L. Temporal Variations in Gaseous Elemental Mercury Concentrations at a Contaminated Site: Main Factors Affecting Nocturnal Maxima in Daily Cycles. Atmos. Environ. 2016, 125, 8–14. [Google Scholar] [CrossRef]
- Vaselli, O.; Nisi, B.; Rappuoli, D.; Cabassi, J.; Tassi, F. Gaseous Elemental Mercury and Total and Leached Mercury in Building Materials from the Former Hg-Mining Area of Abbadia San Salvatore (Central Italy). Int. J. Environ. Res. Public Health 2017, 14, 425. [Google Scholar] [CrossRef]
- Kotnik, J.; Horvat, M.; Dizdarevič, T. Current and Past Mercury Distribution in Air over the Idrija Hg Mine Region, Slovenia. Atmos. Environ. 2005, 39, 7570–7579. [Google Scholar] [CrossRef]
- Gosar, M.; Žibret, G. Mercury Contents in the Vertical Profiles through Alluvial Sediments as a Reflection of Mining in Idrija (Slovenia). J. Geochem. Explor. 2011, 110, 81–91. [Google Scholar] [CrossRef]
- Horvat, M.; Covelli, S.; Faganeli, J.; Logar, M.; Mandić, V.; Rajar, R.; Širca, A.; Žagar, D. Mercury in Contaminated Coastal Environments; a Case Study: The Gulf of Trieste. Sci. Total Environ. 1999, 237–238, 43–56. [Google Scholar] [CrossRef]
- Covelli, S.; Faganeli, J.; Horvat, M.; Brambati, A. Mercury Contamination of Coastal Sediments as the Result of Long-Term Cinnabar Mining Activity (Gulf of Trieste, Northern Adriatic Sea). Appl. Geochem. 2001, 16, 541–558. [Google Scholar] [CrossRef]
- Covelli, S.; Fontolan, G.; Faganeli, J.; Ogrinc, N. Anthropogenic Markers in the Holocene Stratigraphic Sequence of the Gulf of Trieste (Northern Adriatic Sea). Mar. Geol. 2006, 230, 29–51. [Google Scholar] [CrossRef]
- Foucher, D.; Ogrinc, N.; Hintelmann, H. Tracing Mercury Contamination from the Idrija Mining Region (Slovenia) to the Gulf of Trieste Using Hg Isotope Ratio Measurements. Environ. Sci. Technol. 2009, 43, 33–39. [Google Scholar] [CrossRef] [PubMed]
- Covelli, S.; Piani, R.; Acquavita, A.; Predonzani, S.; Faganeli, J. Transport and Dispersion of Particulate Hg Associated with a River Plume in Coastal Northern Adriatic Environments. Mar. Pollut. Bull. 2007, 55, 436–450. [Google Scholar] [CrossRef] [PubMed]
- Piani, R.; Covelli, S.; Biester, H. Mercury Contamination in Marano Lagoon (Northern Adriatic Sea, Italy): Source Identification by Analyses of Hg Phases. Appl. Geochem. 2005, 20, 1546–1559. [Google Scholar] [CrossRef]
- Covelli, S.; Acquavita, A.; Piani, R.; Predonzani, S.; De Vittor, C. Recent Contamination of Mercury in an Estuarine Environment (Marano Lagoon, Northern Adriatic, Italy). Estuar. Coast. Shelf Sci. 2009, 82, 273–284. [Google Scholar] [CrossRef]
- Acquavita, A.; Covelli, S.; Emili, A.; Berto, D.; Faganeli, J.; Giani, M.; Horvat, M.; Koron, N.Ž.; Rampazzo, F. Mercury in the Sediments of the Marano and Grado Lagoon (Northern Adriatic Sea): Sources, Distribution and Speciation. Estuar. Coast. Shelf Sci. 2012, 113, 20–31. [Google Scholar] [CrossRef]
- Covelli, S.; Petranich, E.; Langone, L.; Emili, A.; Acquavita, A. Historical Sedimentary Trends of Mercury and Other Trace Elements from Two Saltmarshes of the Marano and Grado Lagoon (Northern Adriatic Sea). J. Soils Sediments 2017, 17, 1972–1985. [Google Scholar] [CrossRef]
- Turritto, A.; Acquavita, A.; Bezzi, A.; Covelli, S.; Fontolan, G.; Petranich, E.; Piani, R.; Pillon, S. Suspended Particulate Mercury Associated with Tidal Fluxes in a Lagoon Environment Impacted by Cinnabar Mining Activity (Northern Adriatic Sea). J. Environ. Sci. 2018, 68, 100–113. [Google Scholar] [CrossRef]
- Bargagli, R. Moss and Lichen Biomonitoring of Atmospheric Mercury: A Review. Sci. Total Environ. 2016, 572, 216–231. [Google Scholar] [CrossRef]
- Esbrí, J.M.; López-Berdonces, M.A.; Fernández-Calderón, S.; Higueras, P.; Díez, S. Atmospheric Mercury Pollution around a Chlor-Alkali Plant in Flix (NE Spain): An Integrated Analysis. Environ. Sci. Pollut. Res. 2015, 22, 4842–4850. [Google Scholar] [CrossRef]
- Brunialti, G.; Frati, L. Bioaccumulation with Lichens: The Italian Experience. Int. J. Environ. Stud. 2014, 71, 15–26. [Google Scholar] [CrossRef]
- Barago, N.; Floreani, F.; Acquavita, A.; Esbrí, J.M.; Covelli, S.; Higueras, P. Spatial and Temporal Trends of Gaseous Elemental Mercury over a Highly Impacted Coastal Environment (Northern Adriatic, Italy). Atmosphere 2020, 11, 935. [Google Scholar] [CrossRef]
- Ferrarin, C.; Umgiesser, G.; Bajo, M.; Bellafiore, D.; De Pascalis, F.; Ghezzo, M.; Mattassi, G.; Scroccaro, I. Hydraulic Zonation of the Lagoons of Marano and Grado, Italy. A Modelling Approach. Estuar. Coast. Shelf Sci. 2010, 87, 561–572. [Google Scholar] [CrossRef]
- Brambati, A. Provenienza, Trasporto e Accumulo Dei Sedimenti Recenti Nelle Lagune Di Marano e Grado e Nei Litorali Tra i Fiumi Isonzo e Tagliamento. Mem. Della Soc. Geol. Ital. 1970, 9, 281–329. (In Italian) [Google Scholar]
- Covelli, S.; Langone, L.; Acquavita, A.; Piani, R.; Emili, A. Historical Flux of Mercury Associated with Mining and Industrial Sources in the Marano and Grado Lagoon (Northern Adriatic Sea). Estuar. Coast. Shelf Sci. 2012, 113, 7–19. [Google Scholar] [CrossRef]
- Acquavita, A.; Aleffi, I.F.; Benci, C.; Bettoso, N.; Crevatin, E.; Milani, L.; Tamberlich, F.; Toniatti, L.; Barbieri, P.; Licen, S.; et al. Annual Characterization of the Nutrients and Trophic State in a Mediterranean Coastal Lagoon: The Marano and Grado Lagoon (Northern Adriatic Sea). Reg. Stud. Mar. Sci. 2015, 2, 132–144. [Google Scholar] [CrossRef]
- Petranich, E.; Covelli, S.; Acquavita, A.; Faganeli, J.; Horvat, M.; Contin, M. Evaluation of Mercury Biogeochemical Cycling at the Sediment–Water Interface in Anthropogenically Modified Lagoon Environments. J. Environ. Sci. 2018, 68, 5–23. [Google Scholar] [CrossRef]
- ARPAFVG-OSMER. Schede Climatiche Del Friuli Venezia Giulia. 2015. Available online: http://www.clima.fvg.it (accessed on 13 October 2020). (In Italian).
- Sholupov, S.E.; Ganeyev, A.A. Zeeman Atomic Absorption Spectrometry Using High Frequency Modulated Light Polarization. Spectrochim. Acta Part B At. Spectrosc. 1995, 50, 1227–1236. [Google Scholar] [CrossRef]
- U.S. Environmental Protection Agency Office of Environmental Information. Guidance for Data Quality Assessment: Practical Methods for Data Analysis EPA QA/G-9 QA00 UPDATE; EPA/600/R-96/084; U.S. Environmental Protection Agency Office: San Francisco, CA, USA, 2000.
- López Berdonces, M.A.; Higueras, P.L.; Fernández-Pascual, M.; Borreguero, A.M.; Carmona, M. The Role of Native Lichens in the Biomonitoring of Gaseous Mercury at Contaminated Sites. J. Environ. Manag. 2017, 186, 207–213. [Google Scholar] [CrossRef]
- Vannini, A.; Nicolardi, V.; Bargagli, R.; Loppi, S. Estimating Atmospheric Mercury Concentrations with Lichens. Environ. Sci. Technol. 2014, 48, 8754–8759. [Google Scholar] [CrossRef]
- Nimis, P.L.; Bargagli, R. Linne Guida per l’utilizzo Di Licheni Epifiti Come Bioaccumulatori Di Metalli in Traccia. In Biomonitoraggio Della Qualità Dell’aria sul Territorio Nazionale; ANPA Serie Atti: Rome, Italy, 1999. (In Italian) [Google Scholar]
- Oyarzun, R.; Higueras, P.; Esbrí, J.M.; Pizarro, J. Mercury in Air and Plant Specimens in Herbaria: A Pilot Study at the MAF Herbarium in Madrid (Spain). Sci. Total Environ. 2007, 387, 346–352. [Google Scholar] [CrossRef]
- Vaselli, O.; Higueras, P.; Nisi, B.; María Esbrí, J.; Cabassi, J.; Martínez-Coronado, A.; Tassi, F.; Rappuoli, D. Distribution of Gaseous Hg in the Mercury Mining District of Mt. Amiata (Central Italy): A Geochemical Survey Prior the Reclamation Project. Environ. Res. 2013, 125, 179–187. [Google Scholar] [CrossRef] [PubMed]
- Wängberg, I.; Munthe, J.; Amouroux, D.; Andersson, M.E.; Fajon, V.; Ferrara, R.; Gårdfeldt, K.; Horvat, M.; Mamane, Y.; Melamed, E.; et al. Atmospheric Mercury at Mediterranean Coastal Stations. Environ. Fluid Mech. 2008, 8, 101–116. [Google Scholar] [CrossRef]
- Sprovieri, F.; Pirrone, N. Spatial and Temporal Distribution of Atmospheric Mercury Species over the Adriatic Sea. Environ. Fluid Mech. 2008, 8, 117–128. [Google Scholar] [CrossRef]
- Kruskal, W.H.; Wallis, W.A. Use of Ranks in One-Criterion Variance Analysis. J. Am. Stat. Assoc. 1952, 47, 583–621. [Google Scholar] [CrossRef]
- Bagnato, E.; Sproveri, M.; Barra, M.; Bitetto, M.; Bonsignore, M.; Calabrese, S.; Di Stefano, V.; Oliveri, E.; Parello, F.; Mazzola, S. The Sea-Air Exchange of Mercury (Hg) in the Marine Boundary Layer of the Augusta Basin (Southern Italy): Concentrations and Evasion Flux. Chemosphere 2013, 93, 2024–2032. [Google Scholar] [CrossRef] [PubMed]
- Gibičar, D.; Horvat, M.; Logar, M.; Fajon, V.; Falnoga, I.; Ferrara, R.; Lanzillotta, E.; Ceccarini, C.; Mazzolai, B.; Denby, B.; et al. Human Exposure to Mercury in the Vicinity of Chlor-Alkali Plant. Environ. Res. 2009, 109, 355–367. [Google Scholar] [CrossRef]
- Marumoto, K.; Hayashi, M.; Takami, A. Atmospheric Mercury Concentrations at Two Sites in the Kyushu Islands, Japan, and Evidence of Long-Range Transport from East Asia. Atmos. Environ. 2015, 117, 147–155. [Google Scholar] [CrossRef]
- ISO/IEC. Proficiency Testing by Interlaboratory Comparisons Part 1: Development and Operation of Laboratory Proficiency Testing. 1997. Available online: http://www.iso.org/iso/iso_catalogue/catalogue_tc/catalogue_detail.htm?csnumber=27216 (accessed on 18 March 2015).
- Fernández-Patier, R.; Ramos-Díaz, M.C. Informe Del Ejercicio de Lntercomparacion de Mercurio Gaseoso Total En Aire Ambiente BIN SITU^ (Año 2011); Ined. Repport: Paris, France, 2011. (In Spanish) [Google Scholar]
- Custodio, D.; Ebinghaus, R.; Gerard Spain, T.; Bieser, J. Source Apportionment of Atmospheric Mercury in the Remote Marine Atmosphere: Mace Head GAW Station, Irish Western Coast. Atmos. Chem. Phys. 2020, 20, 7929–7939. [Google Scholar] [CrossRef]
- Slemr, F.; Angot, H.; Dommergue, A.; Magand, O.; Barret, M.; Weigelt, A.; Ebinghaus, R.; Brunke, E.G.; Pfaffhuber, K.A.; Edwards, G.; et al. Comparison of Mercury Concentrations Measured at Several Sites in the Southern Hemisphere. Atmos. Chem. Phys. 2015, 15, 3125–3133. [Google Scholar] [CrossRef]
- Xu, L.; Chen, J.; Yang, L.; Niu, Z.; Tong, L.; Yin, L.; Chen, Y. Characteristics and Sources of Atmospheric Mercury Speciation in a Coastal City, Xiamen, China. Chemosphere 2015, 119, 530–539. [Google Scholar] [CrossRef]
- Li, Z.; Xia, C.; Wang, X.; Xiang, Y.; Xie, Z. Total Gaseous Mercury in Pearl River Delta Region, China during 2008 Winter Period. Atmos. Environ. 2011, 45, 834–838. [Google Scholar] [CrossRef]
- Yi, H.; Tong, L.; Lin, J.M.; Cai, Q.L.; Wang, K.Q.; Dai, X.R.; Li, J.R.; Chen, J.S.; Xiao, H. Temporal Variation and Long–Range Transport of Gaseous Elemental Mercury (GEM) over a Coastal Site of East China. Atmos. Res. 2020, 233, 104699. [Google Scholar] [CrossRef]
- Song, X.; Cheng, I.; Lu, J. Annual Atmospheric Mercury Species in Downtown Toronto, Canada. J. Environ. Monit. 2009, 11, 660–669. [Google Scholar] [CrossRef] [PubMed]
- Floreani, F.; Acquavita, A.; Petranich, E.; Covelli, S. Diurnal Fluxes of Gaseous Elemental Mercury from the Water-Air Interface in Coastal Environments of the Northern Adriatic Sea. Sci. Total Environ. 2019, 668. [Google Scholar] [CrossRef]
- Narukawa, M.; Sakata, M.; Marumoto, K.; Asakura, K. Air-Sea Exchange of Mercury in Tokyo Bay. J. Oceanogr. 2006, 62, 249–257. [Google Scholar] [CrossRef]
- Weiss-Penzias, P.S.; Williams, E.J.; Lerner, B.M.; Bates, T.S.; Gaston, C.; Prather, K.; Vlasenko, A.; Li, S.M. Shipboard Measurements of Gaseous Elemental Mercury along the Coast of Central and Southern California. J. Geophys. Res. Atmos. 2013, 118, 208–219. [Google Scholar] [CrossRef]
- Cheng, I.; Zhang, L.; Mao, H.; Blanchard, P.; Tordon, R.; Dalziel, J. Seasonal and Diurnal Patterns of Speciated Atmospheric Mercury at a Coastal-Rural and a Coastal-Urban Site. Atmos. Environ. 2014, 82, 193–205. [Google Scholar] [CrossRef]
- McLagan, D.S.; Mitchell, C.P.J.; Steffen, A.; Hung, H.; Shin, C.; Stupple, G.W.; Olson, M.L.; Luke, W.T.; Kelley, P.; Howard, D.; et al. Global Evaluation and Calibration of a Passive Air Sampler for Gaseous Mercury. Atmos. Chem. Phys. 2018, 18, 5905–5919. [Google Scholar] [CrossRef]
- Ren, X.; Luke, W.T.; Kelley, P.; Cohen, M.D.; Olson, M.L.; Walker, J.; Cole, R.; Archer, M.; Artz, R.; Stein, A.A. Long-Term Observations of Atmospheric Speciated Mercury at a Coastal Site in the Northern Gulf of Mexico during 2007–2018. Atmosphere 2020, 11, 268. [Google Scholar] [CrossRef]
- Müller, D.; Wip, D.; Warneke, T.; Holmes, C.D.; Dastoor, A.; Notholt, J. Sources of Atmospheric Mercury in the Tropics: Continuous Observations at a Coastal Site in Suriname. Atmos. Chem. Phys. 2012, 12, 7391–7397. [Google Scholar] [CrossRef]
- Kock, H.H.; Bieber, E.; Ebinghaus, R.; Spain, T.G.; Thees, B. Comparison of Long-Term Trends and Seasonal Variations of Atmospheric Mercury Concentrations at the Two European Coastal Monitoring Stations Mace Head, Ireland, and Zingst, Germany. Atmos. Environ. 2005, 39, 7549–7556. [Google Scholar] [CrossRef]
- Schmolke, S.R.; Schroeder, W.H.; Kock, H.H.; Schneeberger, D.; Munthe, J.; Ebinghaus, R. Simultaneous Measurements of Total Gaseous Mercury at Four Sites on a 800 Km Transect: Spatial Distribution and Short-Time Variability of Total Gaseous Mercury over Central Europe. Atmos. Environ. 1999, 33, 1725–1733. [Google Scholar] [CrossRef]
- Nguyen, H.T.; Kim, K.H.; Kim, M.Y.; Hong, S.; Youn, Y.H.; Shon, Z.H.; Lee, J.S. Monitoring of Atmospheric Mercury at a Global Atmospheric Watch (GAW) Site on An-Myun Island, Korea. Water Air Soil Pollut. 2007, 185, 149–164. [Google Scholar] [CrossRef]
- Ci, Z.; Zhang, X.; Wang, Z.; Niu, Z. Atmospheric Gaseous Elemental Mercury (GEM) over a Coastal/Rural Site Downwind of East China: Temporal Variation and Long-Range Transport. Atmos. Environ. 2011, 45, 2480–2487. [Google Scholar] [CrossRef]
- Faganeli, J.; Hines, M.E.; Covelli, S.; Emili, A.; Giani, M. Mercury in Lagoons: An Overview of the Importance of the Link between Geochemistry and Biology. Estuar. Coast. Shelf Sci. 2012, 113, 126–132. [Google Scholar] [CrossRef]
- Griggs, T.; Liu, L.; Talbot, R.W.; Torres, A.; Lan, X. Comparison of Atmospheric Mercury Speciation at a Coastal and an Urban Site in Southeastern Texas, USA. Atmosphere 2020, 11, 73. [Google Scholar] [CrossRef]
- Malcolm, E.G.; Keeler, G.J.; Landis, M.S. The Effects of the Coastal Environment on the Atmospheric Mercury Cycle. J. Geophys. Res. 2003, 108, 1–10. [Google Scholar] [CrossRef]
- Faganeli, J.; Horvat, M.; Covelli, S.; Fajon, V.; Logar, M.; Lipej, L.; Cermelj, B. Mercury and Methylmercury in the Gulf of Trieste (Northern Adriatic Sea). Sci. Total Environ. 2003, 304, 315–326. [Google Scholar] [CrossRef]
- Acquavita, A.; Brandolin, D.; Felluga, A.; Maddaleni, P.; Meloni, C.; Poli, L.; Skert, N.; Zanello, A. Mercury Distribution and Speciation in Soils Contaminated by Historically Mining Activity: The Isonzo River Plain. In Proceedings of the Congresso SIMP-SGI-SOGEI 2019, Parma, Italy, 16–19 September 2019. [Google Scholar]
- Ferrara, R.; Ceccarini, C.; Lanzillotta, E.; Gårdfeldt, K.; Sommar, J.; Horvat, M.; Logar, M.; Fajon, V.; Kotnik, J. Profiles of Dissolved Gaseous Mercury Concentration in the Mediterranean Seawater. Atmos. Environ. 2003, 37, 85–92. [Google Scholar] [CrossRef]
- Acquavita, A.; Emili, A.; Covelli, S.; Faganeli, J.; Predonzani, S.; Koron, N.; Carrasco, L. The Effects of Resuspension on the Fate of Hg in Contaminated Sediments (Marano and Grado Lagoon, Italy): Short-Term Simulation Experiments. Estuar. Coast. Shelf Sci. 2012, 113, 32–40. [Google Scholar] [CrossRef]
- Emili, A.; Koron, N.; Covelli, S.; Faganeli, J.; Acquavita, A.; Predonzani, S.; Vittor, C.D. Does Anoxia Affect Mercury Cycling at the Sediment-Water Interface in the Gulf of Trieste (Northern Adriatic Sea)? Incubation Experiments Using Benthic Flux Chambers. Appl. Geochem. 2011, 26, 194–204. [Google Scholar] [CrossRef]
- Covelli, S.; Faganeli, J.; De Vittor, C.; Predonzani, S.; Acquavita, A.; Horvat, M. Benthic Fluxes of Mercury Species in a Lagoon Environment (Grado Lagoon, Northern Adriatic Sea, Italy). Appl. Geochem. 2008, 23, 529–546. [Google Scholar] [CrossRef]
- Castelle, S.; Schäfer, J.; Blanc, G.; Dabrin, A.; Lanceleur, L.; Masson, M. Gaseous Mercury at the Air-Water Interface of a Highly Turbid Estuary (Gironde Estuary, France). Mar. Chem. 2009, 117, 42–51. [Google Scholar] [CrossRef]
- Petranich, E.; Terribili, L.; Acquavita, A.; Pavoni, E.; Langone, L.; Covelli, S. The Role of a Tidal Flat–Saltmarsh System as a Source–Sink of Mercury in a Contaminated Coastal Lagoon Environment (Northern Adriatic Sea). Aquat. Geochem. 2020, 26, 245–267. [Google Scholar] [CrossRef]
- Sizmur, T.; McArthur, G.; Risk, D.; Tordon, R.; O’Driscoll, N.J. Gaseous Mercury Flux from Salt Marshes Is Mediated by Solar Radiation and Temperature. Atmos. Environ. 2017, 153, 117–125. [Google Scholar] [CrossRef]
- Pellegrini, E.; Petranich, E.; Acquavita, A.; Canário, J.; Emili, A.; Covelli, S. Mercury Uptake by Halophytes in Response to a Long-Term Contamination in Coastal Wetland Salt Marshes (Northern Adriatic Sea). Environ. Geochem. Health 2017, 39, 1273–1289. [Google Scholar] [CrossRef]
- Tretiach, M.; Pittao, E. Biomonitoraggio di Metalli Mediante Licheni in Cinque Aree Campione Della Provincia di Pordenone: Stato Attuale e Confronto Con i Dati del 1999; Provincia di Pordenone: Pordenone, Italy, 2008. (In Italian) [Google Scholar]
- Fortuna, L.; Carniel, F.C.; Capozzi, F. Congruence Evaluation of Mercury Pollution Patterns Around a Waste Incinerator over a 16-Year-Long Period Using Different Biomonitors. Atmosphere 2019, 10, 183. [Google Scholar] [CrossRef]
- Bargagli, R.; Barghigiani, C. Lichen Biomonitoring of Mercury Emission and Deposition in Mining, Geothermal and Volcanic Areas of Italy. Environ. Monit. Assess. 1991, 16, 265–275. [Google Scholar] [CrossRef]
- Loppi, S.; Paoli, L.; Gaggi, C. Diversity of Epiphytic Lichens and Hg Contents of Xanthoria parietina Thalli as Monitors of Geothermal Air Pollution in the Mt. Amiata Area (Central Italy). J. Atmos. Chem. 2006, 53, 93–105. [Google Scholar] [CrossRef]
- Rimondi, V.; Benesperi, R.; Beutel, M.W.; Chiarantini, L.; Costagliola, P.; Lattanzi, P.; Medas, D.; Morelli, G. Monitoring of Airborne Mercury: Comparison of Different Techniques in the Monte Amiata District, Southern Tuscany, Italy. Int. J. Environ. Res. Public Health 2020, 17, 2353. [Google Scholar] [CrossRef]
- Bargagli, R.; Iosco, F.P.; Leonzio, C. Monitoraggio Di Elementi in Tracce Mediante Licheni Epifiti. Inquinamento 1985, 2, 33–37. (In Italian) [Google Scholar]
- Scerbo, R.; Ristori, T.; Possenti, L.; Lampugnani, L.; Barale, R. Lichen (Xanthoria Parietina) Biomonitoring of Trace Element Contamination and Air Quality Assessment in Pisa Province (Tuscany, Italy). Sci. Total Environ. 2002, 286, 27–40. [Google Scholar] [CrossRef]
- Barghigiani, C.; Bargagli, R.; Siegel, B.; Siegel, S. Source and Selectivity in the Accumulation of Mercury and Other Metals by the Plants of Mt. Etna. Water Air Soil Pollut. 1988, 39, 395–408. [Google Scholar]
- Grangeon, S.; Guédron, S.; Asta, J.; Sarret, G.; Charlet, L. Lichen and Soil as Indicators of an Atmospheric Mercury Contamination in the Vicinity of a Chlor-Alkali Plant (Grenoble, France). Ecol. Indic. 2012, 13, 178–183. [Google Scholar] [CrossRef]
- Cuny, D.; Davranche, L.; Thomas, P.; Kempa, M.; van Haluwyn, C. Spatial and Temporal Variations of Trace Element Contents in Xanthoria parietina Thalli Collected in a Highly Industrialized Area in Northern France as an Element for a Future Epidemiological Study. J. Atmos. Chem. 2004, 49, 391–401. [Google Scholar] [CrossRef]
- Horvat, M.; Jeran, Z.; Spiric, Z.; Jacimovic, R.; Miklavcic, V. Mercury and Other Elements in Lichens near the INA Naftaplin Gas Treatment Plant, Molve, Croatia. J. Environ. Monit. 2000, 2, 139–144. [Google Scholar] [CrossRef] [PubMed]
- Yenisoy-Karakaş, S.; Tuncel, S.G. Geographic Patterns of Elemental Deposition in the Aegean Region of Turkey Indicated by the Lichen, Xanthoria parietina (L.) Th. Fr. Sci. Total Environ. 2004, 329, 43–60. [Google Scholar] [CrossRef]
- Naharro, R.; Esbrí, J.M.; Amorós, J.A.; Higueras, P.L. Experimental Assessment of the Daily Exchange of Atmospheric Mercury in Epipremnum Aureum. Environ. Geochem. Health 2020, 42, 3185–3198. [Google Scholar] [CrossRef]
- Canário, J.; Poissant, L.; Pilote, M.; Caetano, M.; Hintelmann, H.; O’Driscoll, N.J. Salt-Marsh Plants as Potential Sources of Hg0 into the Atmosphere. Atmos. Environ. 2017, 152, 458–464. [Google Scholar] [CrossRef]


| Name Site | Site | GEM Mean (ng m−3) | GEM dev.st. (ng m−3) | GEM min ÷ max (ng m−3) | Total GEM Data | Hg in Lichens (mg kg−1) | Lat. (WGS84) | Lon. (WGS84) | Altitude (m m.s.l.) |
|---|---|---|---|---|---|---|---|---|---|
| LGM1 | Grado pineta | 2.69 | 0.39 | <2 ÷ 3.75 | 266 | 0.39 | 45.67816 | 13.41862 | 0 |
| LGM2 | Isola della Cona | 2.68 | 0.89 | <2 ÷ 6.28 | 294 | 0.15 | 45.75531 | 13.50027 | 0 |
| LGM3 | Lignano Sabbiadoro | 1.86 | 0.71 | <2 ÷ 3.67 | 265 | 0.06 | 45.69688 | 13.14251 | 0 |
| LGM4 | Valle Pontelli | 2.73 | 1.26 | <2 ÷ 7.37 | 154 | 0.11 | 45.72068 | 13.30823 | 0 |
| LGM5 | Porto Anfora | 2.98 | 0.52 | <2 ÷ 4.99 | 183 | 0.10 | 45.71682 | 13.25587 | 0 |
| LGM6 | Isola di S. Andrea | 2.67 | 0.77 | <2 ÷ 4.60 | 188 | 0.07 | 45.71399 | 13.18724 | 0 |
| LGM7 | Oasi Fiume Stella | n.d. | n.d. | n.d. | n.d. | 0.08 | 45.73672 | 13.10306 | 0 |
| LGM8 | Marano Lagunare | 1.80 | 0.74 | <2 ÷ 4.33 | 345 | 0.09 | 45.75618 | 13.16476 | 0 |
| LGM9 | Foce Aussa Corno | 2.11 | 0.84 | <2 ÷ 5.71 | 347 | 0.09 | 45.75758 | 13.24038 | 0 |
| LGM10 | Belvedere | 2.77 | 0.55 | <2 ÷ 3.89 | 293 | 0.12 | 45.72496 | 13.38515 | 0 |
| LGM11 | Torviscosa | 3.04 | 0.66 | <2 ÷ 5.84 | 347 | 0.40 | 45.81797 | 13.28559 | 3 |
| LGM12 | Pieris | n.d. | n.d. | n.d. | n.d. | 0.11 | 45.80897 | 13.44405 | 8 |
| LGM13 | Piancada | n.d. | n.d. | n.d. | n.d. | 0.05 | 45.78160 | 13.08643 | 1 |
| Site | Environment | Methods/ Instruments | GEM (mean ± SD) (ng m−3) | Reference |
|---|---|---|---|---|
| Marano and Grado Lagoon (ITA) | Rural | Lumex RA-915 | 2.53 ± 0.73 | This study |
| Grado Lagoon (ITA) | Rural | Lumex RA-915 | 2.03 ± 1.23 | [82] |
| Gulf of Trieste (ITA) | Rural | Lumex RA-915 | 2.70 ± 1.50 | [54] |
| Piran (SLO) | Rural | Gold traps | 2.4 ± n.a. | [68] |
| Augusta Bay (ITA) | Urban-industrial | Lumex RA-915 | 1.8 ± 0.69 | [71] |
| Rosignano Solvay (ITA) | Urban-industrial | Gardis-3 | 2.8–8.7 ± n.a. | [72] |
| Minamata Bay (JPN) | Urban-industrial | AM-5 Nippon | 1.90 ± 0.40 | [73] |
| Tokyo Bay (JPN) | Urban | AM-2 Nippon | 1.9 ± 0.6 | [83] |
| Xiamen (CHI) | Urban | Tekran 2537A | 3.5 ± 1.2 | [78] |
| Beilun (CHI) | Urban–industrial | Tekran 2537A | 2.44 ± 0.95 | [80] |
| Pearl River delta (CHI) | Urban–industrial | Tekran 2537B | 2.94 ± 2.02 | [79] |
| S Diego-S Francisco (USA) | Sub-urban | Tekran 2537A | 1.41 ± 0.2 | [84] |
| Houston (USA) | Urban-industrial | Tekran 2537A | 1.62 ± 0.56 | [33] |
| Dartmouth (CAN) | Urban | Tekran 2537A | 1.67 ± 1.01 | [85] |
| Toronto (CAN) | Urban | Tekran 2537A | 4.5 ± 3.1 | [81] |
| New York (USA) | Urban | Tekran 2537A | 1.77 ± 0.05 | [86] |
| Grand Bay (USA) | Urban | Tekran 2537A | 1.39 ± 0.22 | [87] |
| Nieuw Nickerie (SUR) | Urban | Tekran 2537A | 1.40 ± 0.25 | [88] |
| Porto Alegre–Rio Grande (BRA) | Sub-urban | Lumex RA-915 | 2.65 ± 1.87 | [35] |
| Mace Head (IRL) | Rural | Tekran 2537B | 1.3 ± 0.2 | [76] |
| San Lucido (ITA) | Rural | Gold traps | 1.75 ± n.a. | [68] |
| Zingst (GER) | Rural | Tekran 2537A | 1.66 ± n.a. | [89] |
| Thau Lagoon (FRA) | Rural | Gold traps | 1.60–3.30 ± n.a. | [68] |
| Rorvik (SWE) | Rural | Tekran 2537A | 1.54 ± 0.10 | [90] |
| Kejimkujik (CAN) | Rural | Tekran 2537A | 1.28 ± 0.2 | [85] |
| Cape Point (RSA) | Rural | Tekran 2537B | 0.997 ± 0.120 | [77] |
| Cape Grimm (AUS) | Rural | Tekran 2537B | 0.893 ± 0.129 | [77] |
| Galapagos (ECU) | Rural | Tekran 2537B | 1.054 ± 0.087 | [77] |
| Calhau (CPV) | Rural | Tekran 2537A | 1.21 ± 0.11 | [30] |
| An-Myun (KOR) | Rural | AM-2 Nippon | 4.61 ± 2.21 | [91] |
| Chengshantou (CHI) | Rural | Lumex RA-915 | 2.31 ± 0.74 | [92] |
| Site | Hg Main Source | Hg Concentration (Maximum Level) (μg g−1) | References |
|---|---|---|---|
| Isonzo River mouth, Marano and Grado Lagoon | Hg mining | 0.12 ± 0.09 (0.40) | This study |
| Torviscosa (ITA) | CAP activity | 0.20 ± 0.08 (0.38) | [36] |
| Basovizza (ITA) | Atmospheric transport | 0.10 | [36] |
| Spilimbergo (ITA) | Waste incineration | 0.17 ± 0.08 (0.38) | [106] |
| Spilimbergo (ITA) | Waste incineration | 0.096 ± 0.064 ÷ 0.141 ± 0.078 (0.384) | [107] |
| Larderello (ITA) | Geothermal power plat | 2.16 ± 0.19 (2.41) | [108] |
| Mt. Amiata (ITA) | Hg mining | 1.18 ± 0.70 (1.96) | [109] |
| Bagnore, Mt. Amiata (ITA) | Hg mining | 2.87 ± 0.66 (3.21) | [108] |
| Abbadia S. Salvadore (ITA) | Hg mining | 1.84 ± 0.95 (3.60) | [110] |
| Rosignano Solvay (ITA) | CAP activity | 0.74 ± 0.46 (1.84) | [111] |
| Pisa province (ITA) | Paints, electronics, pesticides production | 0.097 (0.057 ÷ 0.153) | [112] |
| Mt. Etna (ITA) | Volcanic activity | 0.70 ± 0.08 | [113] |
| Vulcano Island (ITA) | Volcanic activity | 0.23 ± 0.05 (0.27) | [108] |
| Flix (ESP) | CAP activity | 1.61 (0.39 ÷ 3.79) | [52] |
| Grenoble (FRA) | CAP activity | 0.07 ÷ 2.51 | [114] |
| Dunkirk (FRA) | Waste incineration | 0.35 ± 0.21 | [115] |
| Molve (CRO) | Natural gas treatment | 0.76 ± 1.02 (2.80) | [116] |
| Izmir (TUR) | Coal combustion, paints production | 0.03 ÷ 1.81 | [117] |
Publisher’s Note: MDPI stays neutral with regard to jurisdictional claims in published maps and institutional affiliations. |
© 2020 by the authors. Licensee MDPI, Basel, Switzerland. This article is an open access article distributed under the terms and conditions of the Creative Commons Attribution (CC BY) license (http://creativecommons.org/licenses/by/4.0/).
Share and Cite
Floreani, F.; Barago, N.; Acquavita, A.; Covelli, S.; Skert, N.; Higueras, P. Spatial Distribution and Biomonitoring of Atmospheric Mercury Concentrations over a Contaminated Coastal Lagoon (Northern Adriatic, Italy). Atmosphere 2020, 11, 1280. https://doi.org/10.3390/atmos11121280
Floreani F, Barago N, Acquavita A, Covelli S, Skert N, Higueras P. Spatial Distribution and Biomonitoring of Atmospheric Mercury Concentrations over a Contaminated Coastal Lagoon (Northern Adriatic, Italy). Atmosphere. 2020; 11(12):1280. https://doi.org/10.3390/atmos11121280
Chicago/Turabian StyleFloreani, Federico, Nicolò Barago, Alessandro Acquavita, Stefano Covelli, Nicola Skert, and Pablo Higueras. 2020. "Spatial Distribution and Biomonitoring of Atmospheric Mercury Concentrations over a Contaminated Coastal Lagoon (Northern Adriatic, Italy)" Atmosphere 11, no. 12: 1280. https://doi.org/10.3390/atmos11121280
APA StyleFloreani, F., Barago, N., Acquavita, A., Covelli, S., Skert, N., & Higueras, P. (2020). Spatial Distribution and Biomonitoring of Atmospheric Mercury Concentrations over a Contaminated Coastal Lagoon (Northern Adriatic, Italy). Atmosphere, 11(12), 1280. https://doi.org/10.3390/atmos11121280