Article

Heat and Ozone Pollution Waves in Central and South Europe—Characteristics, Weather Types, and Association with Mortality

1
Faculty of Medicine, University of Augsburg, 86159 Augsburg, Germany
2
Instituto Dom Luiz (IDL), Faculty of Sciences University of Lisbon, 1749-016 Lisbon, Portugal
3
Departamento de Meteorologia, Universidade Federal do Rio de Janeiro, Rio de Janeiro 21941-916, Brazil
*
Author to whom correspondence should be addressed.
Atmosphere 2020, 11(12), 1271; https://doi.org/10.3390/atmos11121271
Submission received: 3 October 2020 / Revised: 20 November 2020 / Accepted: 23 November 2020 / Published: 24 November 2020
(This article belongs to the Special Issue Extreme Climate Events and Air Quality)

Abstract

:
Air pollution and hot temperatures present two major health risks, especially for vulnerable groups such as children, the elderly, and people with pre-existing conditions. Episodes of high ozone concentrations and heat waves have been registered throughout Europe and are expected to continue to grow due to climate change. Here, several different heat and ozone wave definitions were applied to characterize the wave-type extremes for two climatically different regions, i.e., Portugal (South Europe) and Bavaria (Central Europe), and their impacts were evaluated considering each type of hazard independently but also when they occur simultaneously. Heat and ozone waves were analyzed with respect to the underlying atmospheric circulation patterns and in terms of their association with human mortality. Heat waves were identified as the most frequent wave type and, despite different climate settings, a comparable exposure to heat and ozone waves was found in Central and South Europe. Waves were associated with in-situ built-up as well as with advection of air masses. However, in Bavaria waves showed the strongest connection with autochthonous weather conditions, while for Portugal, the strongest relationship appeared for eastern and north-eastern inflow. The most severe events, as measured by excess mortality, were always associated to compound heat-ozone waves.

1. Introduction

Urban air pollution has emerged as a health but also a socio-economic problem, particularly as a result of cities expanding to unprecedented levels around the world [1], and it is projected to be the world’s top environmental cause of mortality in 2050, ahead of dirty water and lack of sanitation [2]. The set of pollutants present in the atmosphere can have an impact on the health of populations, especially on risk groups such as children, the elderly, and people with cardiac pathologies and respiratory insufficiencies [3,4,5]. Not all is doom and gloom as air quality in Europe has been slowly improving in recent decades [6]. However, during the last years, a significant fraction of the urban population in the European Union (EU) was exposed to concentrations of several air pollutants above the EU limit or target values [6]. Furthermore, target values represent political regulation thresholds, and studies have shown that health impacts can already occur below these thresholds (e.g., [5]). Hence, human exposure to pollutants is currently a key environment-related health concern, particularly in dense urban areas.
Besides local and regional demographics and economic activity, air pollution is determined by a combination of different factors, one of which being weather conditions that interfere with the dilution, transformation, transport, and removal of pollutants in the atmosphere [7,8,9,10]. These processes depend on the states of the atmosphere, which are conditioned by precipitation, wind speed and direction, atmospheric pressure, temperature, relative humidity, cloud cover, and a mixture of layers at altitude [7,8]. In addition to the influence of instantaneous meteorological conditions, the occurrence of extreme pollution events has been associated with the presence of certain preferential synoptic conditions [7,8,9,11] or the occurrence of extreme weather events [12,13,14].
Regional atmospheric circulation patterns can condition the changes in pollutants via transport and/or accumulation [5,8]. This fact generated a growing interest in the development of classification schemes of regional atmospheric circulation patterns, usually entitled circulation weather types (or simply, weather types, WTs). These WTs are generally region-specific as they result from local synoptic weather data (e.g., sea level pressure (SLP) or geopotential height at 500 hPa), usually on regular gridded fields [15,16,17]. The classification procedures have been widely applied to all sorts of environmental topics in recent years, namely to the analysis of extreme events [15,18,19], air quality [8,9,10], cloud to ground lightning [20], fire activity [21], or runoff and sediment yield [22]. The scope of the application of classification procedures varies considerably, but the focus tends to be threesome: (i) The analysis of climatic variability, including trends and extreme years (e.g., [23]), (ii) circulation-to-environment studies (e.g., [8]), and (iii) the analysis or relation of weather-driven natural hazards (e.g., [24]). In terms of the association between WTs and air quality, several works on the Iberian Peninsula and Central Europe should be highlighted. For the Iberian Peninsula, the works by [8,25] allowed to establish robust links between specific weather situations with ozone events (note that the correct writing of the molecular formula of ozone (O3) is simplified to O3 throughout the manuscript). High values of O3 are related to the predominance of WTs with a strong easterly wind component, which promotes the transport of hot and dry air masses from Spain and Central Europe [25]. During most of the O3 episodes, a thermal low establishes over central Iberia, producing SE winds as they slowly approach the Portuguese coast and driving the hot, dry North African air masses, which provoke one or more days of extremely high temperatures in this region [25]. Concerning Central Europe, [5] the relation between ozone, meteorological variables, and WTs, were analyzed showing that daily maximum 1-h ozone concentrations were increased with high air temperatures, low values of specific humidity, and high ozone concentrations of the previous day. Regarding WT classes, four weather types were found to be connected with above-average levels of ozone, being dominant the weather type “U”, which describes mainly low-flow conditions. The results from [5] are similar to the ones described by [11] for the Netherlands regarding the dominant weather conditions.
Apart from dominant weather types, extreme events can also induce changes in air quality, which consequently can cause large adverse impacts on human health, among other socio-economic and environmental impacts [14]. Specifically, heat waves and extreme pollution events are both associated with common underlying driving mechanisms and often occur simultaneously [12]. In fact, it has been shown that the co-occurrence of heat waves and extreme pollution events can produce more damaging effects in terms of morbidity and mortality than the sum of their individual effects [12,26,27]. Therefore, a compound event approach should be considered, particularly knowing that both pollution episodes [28] and heat waves [28,29,30] will worsen under future climate change. This is particularly true when the pollutant under scope is ozone.
Ozone is one of the pollutants, which is constantly associated with negative impacts on human health, with emerging evidence that both short- and long-term exposures to ozone, at concentrations below the current regulatory standards, are associated with increased mortality and morbidity [5,31,32]. Ozone is a secondary pollutant as a result of a set of complex photochemical reactions involving volatile organic compounds and nitrogen oxides, which in the presence of sunlight and high temperatures undergo chemical processes until generating ozone [33]. During spring, the enhanced stratosphere-troposphere exchange also plays a role. As a result of its formation processes, the concentrations are usually higher during the spring-summer period, especially when solar radiation is strong, temperatures high, and in situations of weak wind and strong stability of the atmosphere. In this way, O3 concentrations show an increase as we move to southern Europe, with the highest concentrations in some Mediterranean countries [34], due to a combination of geographic and meteorological factors (e.g., high insolation and temperature, low precipitation, vertical recirculation of air masses in the warm seasons [33].
Episodes of high ozone concentrations have been registered throughout Europe in urban, suburban, and rural areas (e.g., [5,8,11,33,35]) and are expected to continue to grow due to climate change in many parts of the world, as it propitiates the atmospheric conditions favoring ozone formation and temperature increase [28,35,36,37]. Nevertheless, the expected growth is not projected to be similar throughout Europe, [13] with a projected increase (decrease) in 8 h maximum ozone concentrations for north-western (central and southern) Europe. This is largely in agreement with the work by [38], which projected an increase (decrease) for Northern (Southern) Europe, and with the work by [39], which projected a decrease for Portugal. Reference [28] projected for Bavaria (southern Germany) an increase of intensity and frequency of ozone threshold exceedances.
Facing the expected increase of extreme events and the evidence that combined extremes produce higher impacts than independent ones, it is crucial to conduct an integrated assessment of the exposure to air pollution with and without extreme heat and evaluate the associated health risks. This allows for the more sustained development of effective strategies for air quality and health improvement. Some previous studies have considered this synergistic effect between temperature, O pollution, and health, e.g., the ones by [40,41], which showed that health effects and mortality associated with O3 are worse on hot days.
Although extensive literature has been published (i) on isolated extreme weather and ozone events, (ii) its individual projected changes under climate change scenarios, and (iii) individual impacts on morbidity and mortality, a compound approach considering both hazards simultaneously is still lacking. This work aims to analyze combined heat and ozone pollution waves in two distinct climatic regions, Central and South-western Europe, and their characteristics. Special attention is given to the analysis of the predominant weather types associated with the occurrence of heat and ozone pollution waves. Finally, heat and ozone pollution waves are associated with mortality. To achieve the proposed objectives, heat and ozone pollution waves are calculated following the procedure described in [27] and then associated with mortality outcomes for the referred regions.

2. Data and Methods

2.1. Data

2.1.1. Ozone Data

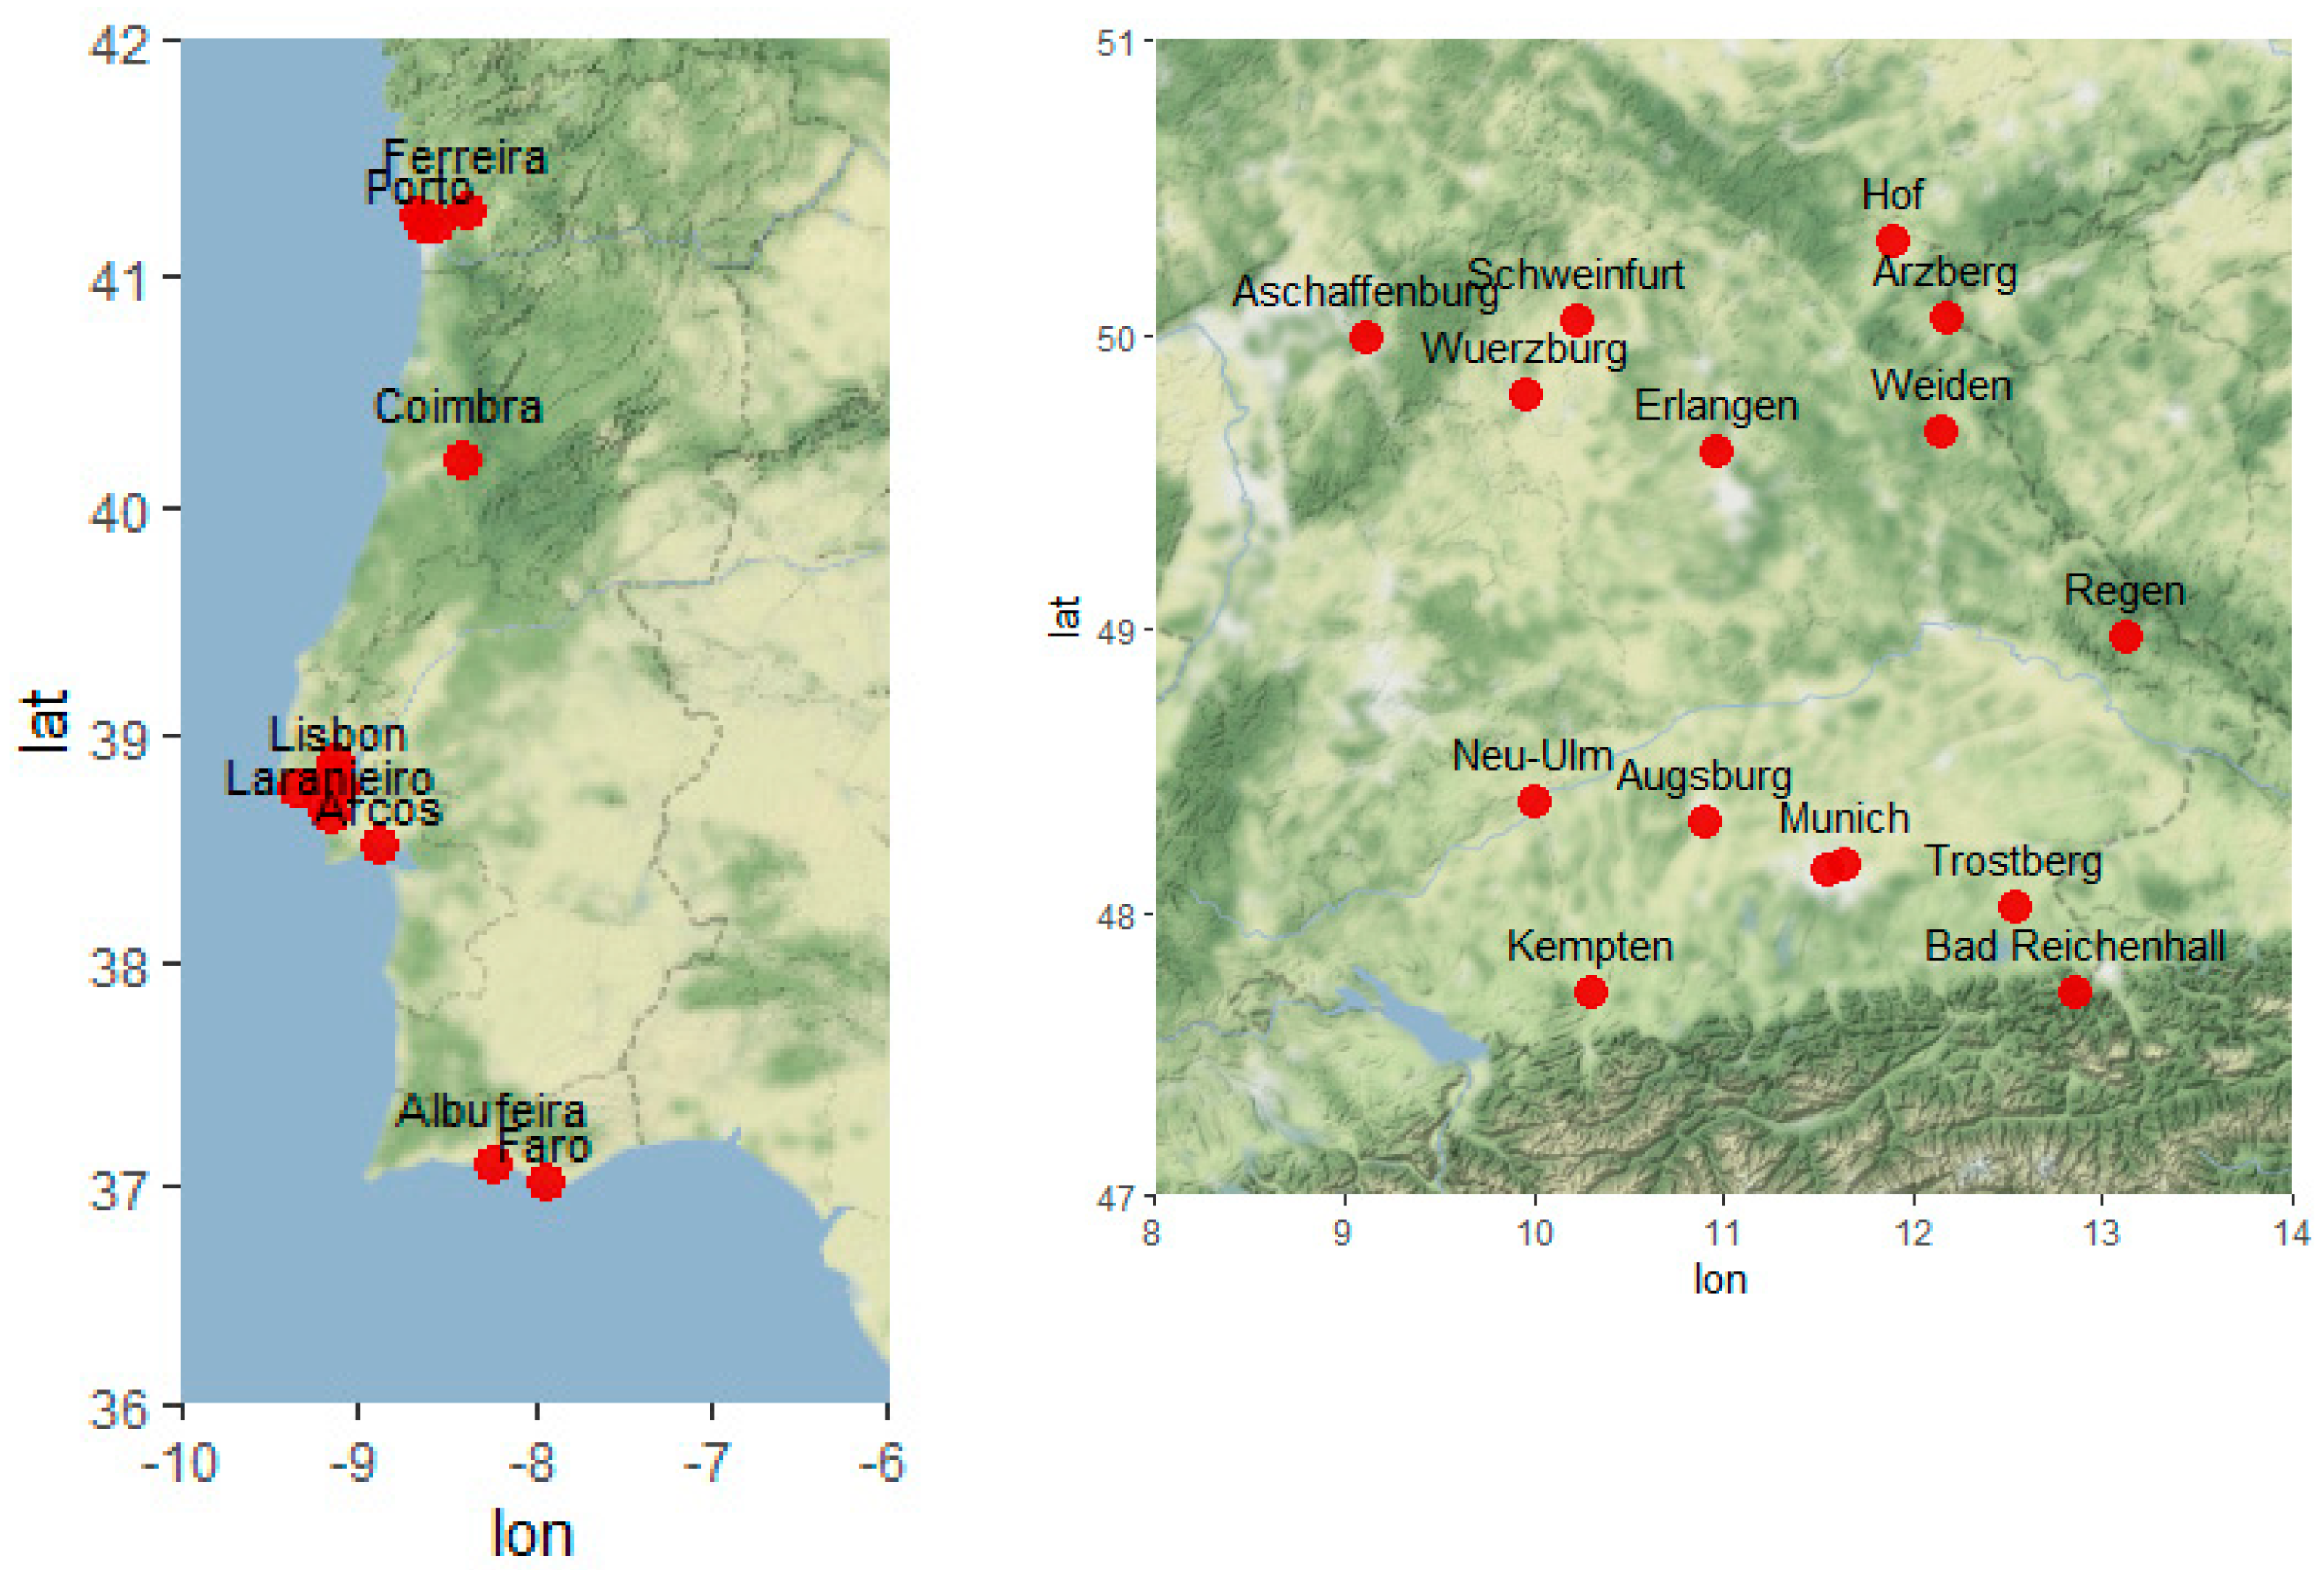
Station-based, ground-level ozone data were used from measurement stations of the Bavarian Environment Agency [42] as well as from the Portuguese Environment Agency [43]. In order to analyze representative ozone concentrations in urban areas, ground-level ozone data were retrieved from 29 air quality stations (15 for Bavaria and 14 for Portugal, locations in Figure 1), including urban and suburban background stations. A common time period from 2003 to 2017 was chosen. Name, station type, geographic coordinates, height, and percentage of missing values in the time period 2003–2017 for each station are given in Table S1, Supplement. From the hourly data, the daily minimum (O3min) and the daily maximum (O3max) 1-h ozone concentration was derived. Since health-relevant higher ozone concentrations occurred primarily in spring and summer, the analysis focused on the months spanning from April to September.

2.1.2. Temperature Data

Daily 2 m maximum (Tmax) and minimum (Tmin) air temperature for April–September 2003–2017 from 15 meteorological stations of the German Weather Service [44] as well as 14 stations from the Portuguese Institute for Sea and Atmosphere [45] were also obtained. Temperature stations were selected to match the spatial location of the ozone stations as close as possible. Note that the meteorological stations were, in general, not located within the same station environment as the air quality stations. Meteorological measurements of the national weather services target regional representativeness, where local influences should be minimized. Thus, temperature stations are located in urban proximity but outside of high-density areas. The location differences between temperature and ozone should be kept in mind since regional representativeness of the stations and correlation between the two variables varied with the location of the sites and season (e.g., [35]).

2.1.3. Reanalysis Data

For the calculation of weather types, larger-scale data, i.e., daily mean sea level pressure data, were taken in a 1° × 1° resolution for the domain 25° N–70° N, 25° W–40° E from the European Centre for Medium-Range Weather Forecasts (ECMWF) ERA5 reanalysis [46]. The ERA5 reanalysis includes hourly gridded data from 1979 onwards with a 31 km resolution, constituting an upgrade to the ERA-Interim reanalysis with a coarser 80 km spatial resolution [46]. Apart from the increased spatial and temporal resolution, ERA5 provides information on the variation of data quality over space and time, and also much improved parametrizations of the troposphere, tropical cyclones, of the global balance of precipitation and evaporation, among other interaction processes (land-atmosphere or sea-atmosphere) [46].

2.1.4. Mortality Data

Daily all-cause, all-age mortality data were obtained from the Bavarian Statistics Agency [47] for Bavaria and from [48] for Portugal for all cities matching the locations of the air quality and meteorological stations. For Bavaria, city-specific data could be received for 12 stations, whereas for 3 station locations (Arzberg, Bad Reichenhall, Trostberg), data were provided on a county level due to data confidentiality. Portuguese mortality data were retrieved at the municipality level. Daily mortality was extracted for both regions for the common period 2003–2017.

2.1.5. Population Data

Population data were provided by the Bavarian Statistics Agency [47] and the Portuguese Statistics Agency [49]. Population data for Bavaria and Portugal were obtained for all cities, counties, and municipalities, matching the mortality data. Population data were linearly interpolated using the census years 2000 and 2018 for Bavaria, and the census years 2011 and 2019 for Portugal, respectively. Since the focus of the study is on the summer half-year (April to September), mid-year population estimates were retrieved for the period 2003–2017.

2.2. Methods

2.2.1. Heat and Ozone Pollution Waves

Distinct methodologies on the definition of what constitutes a heat wave have been published in the last 2 decades [50,51,52]. Here, heat and ozone pollution waves were calculated following the procedure described in [27]. The procedure was based on 3 heat wave definitions, Tmin90, Tmax90, and the Excess Heat Factor (EHF, accounting for acclimatization effects), which were originally proposed by the Commission for Climatology Expert Team on Sector-Specific Climate Indices [53]. Reference [27] adapted the heat wave definitions for ozone pollution waves, i.e., O3min90, O3max90, and the Excess Ozone Factor (EO3F). Waves were defined as any length of three or more days where the 90th percentiles were exceeded (Tmin90, Tmax90, O3min90, O3max90) or EHF >0 and EO3F >0 [50], respectively. The EHF and EO3F definitions were refined to account for variable acclimatization periods, but note that for the determination of the number and days of EHF and EO3F waves, the length of the acclimatization period did not play a role since an EHF or EO3F day was generally defined by a positive EHF(sig) or EO3I(sig). EHF(sig) and EO3I(sig) were defined as the mean amount of temperature or ozone exceedance from the days above the 90% percentile of Tmean90 and O3mean90, respectively. Since the present study focused on the occurrences of waves, their synoptic conditions, and wave-associated cumulative mortality, the acclimatization periods prior to EHF and EO3F waves did not play a direct role but were set to 21 days within the calculation of EHF and EO3F. Reference [27] showed that the consideration of 3 weeks prior to a wave sufficed to capture acclimatization effects. For a detailed description of the heat and ozone pollution waves definitions and their characteristics, see [27].
In order to assess the single and combined effects of ozone waves and heat waves, all ozone and heat waves were first calculated separately using the O3min90, O3max90, EO3F, Tmin90, Tmax90, and EHF definitions. The result for one wave type (e.g., O3max90) comprises events where only the specific wave type occurred (e.g., the 90th percentile of O3max was exceeded for at least 3 days), but it also comprises events with a simultaneous occurrence of another wave type (e.g., simultaneous exceedance of the 90th percentile of Tmax for at least 3 days). To analyse pure single variable effects, also only the ozone (heat) wave events were extracted, which do not coincide with a heat (ozone) wave. Note that there can be still some individual days within a single variable wave event where the other variable shows an exceedance, however, no wave conditions apply for the second variable. Furthermore, ozone (heat) waves, which occur simultaneously (i.e., a compound ozone-heat wave event) were extracted. In this case it might happen that a single ozone (heat) wave is split into a compound part and a single part. The single and compound wave events were calculated from the EO3F and EHF definitions as well as from the O3max90 and Tmax90 definitions.

2.2.2. Weather Types Classification

Weather types classification procedures have been widely used in circulation-to-environment approaches, with applications ranging from extreme weather events (e.g., [15,54]) to air quality [8]. The WT calculation approaches evolved from being completely manual and subjective to automated and objective (or even hybrid) classifications [16,17]. The use of objective methods to classify the circulation, such as those based on indices derived from atmospheric pressure fields, represent an advantage over more subjective studies. Therefore, the choice of the classification method should be done with parsimony.
Daily weather types were calculated from the daily mean sea level pressure fields in a 1° × 1° resolution based on an objective weather type approach developed by [55]. It has been advanced for reanalysis data, for instance, by [56]. A set of airflow indices associated with the direction, speed and vorticity of the airflow characterizes the daily circulation. This resulted in 27 types—8 types giving the direction of flow, 2 types describing the rotation, 16 combined weather types as well as an “unclassified” type, which described mainly weak or undefined flow conditions. The weather types were calculated for the 2 study regions (Bavaria, Portugal) separately, using in each case the coordinates of the geographical center of the region rounded to full degrees as central point for the definition of the grid-point pattern.

2.2.3. Excess Mortality

The population estimates were used as denominators for the computation of crude mortality rates (per 100,000 inhabitants) to account for population changes. No adjustment for seasonal cycles in mortality rates was applied since the summer half-year mortality showed only a weak intra-seasonality. Excess mortality was calculated by subtracting from the crude mortality counts a mortality baseline for each day. Following [57], the daily mortality baseline was calculated as a 31-day moving average using the whole period 2003–2017. Cumulative excess mortality from ozone waves and heat waves were calculated for each city, county, and municipality, respectively. In the case of the simultaneous recording of a wave at several monitoring stations within a specific city (multi-monitoring sites were available for Lisbon, Porto, and Munich), cumulative excess mortality was only counted once for that event. Cumulative excess mortality was calculated, allowing for mortality displacement between 0 (no displacement) up to 14 days.

3. Results

3.1. Characteristics of Heat and Ozone Waves in Bavaria and Portugal

With respect to the 90th percentiles of minimum, mean, and maximum daily 1-h ozone concentrations across the 15 stations of Bavaria and 14 stations of Portugal, the O3min90 median across the stations of Bavaria amounted to 35 µg/m3, but it was 57 µg/m3 for the Portuguese stations (see Figure S1, Supplementary Material). Furthermore, we noticed a high spatial variation of O3min90 across the Portuguese stations, with values ranging from 27 µg/m3 up to 73 µg/m3. In contrast, daily mean and maximum ozone concentrations did not differ to such an extent between Bavaria and Portugal, the median value of O3mean90 was 82 µg/m3 for Bavaria, and 92 µg/m3 for Portugal, the median for O3max90 amounted to 127 µg/m3 for Bavaria and 128 µg/m3 for Portugal (Figure S1). Likewise, spatial variability in Portugal of daily 1 hr mean and maximum ozone concentrations were less than what was obtained for minimum values (Figure S1).
Following a similar approach, we showed the seasonal mean (April–September) of the 90th percentiles for minimum, mean, and maximum daily temperature (Figure S2). Large differences can be observed as a consequence of the location of the two study areas in different climate zones, i.e., Bavaria being characterized by the sub-oceanic climate of Central Europe with moderate summer temperature conditions, whereas Portugal is characterized by the warm, dry-summer climate of South Europe. There was an overall difference of roughly 4 °C between the median temperature values between the two regions. Thus, the median Tmin90 was only 13.2 °C for the Bavarian stations, but 17.6 °C for the Portuguese stations, the median Tmean90 was 20.1 °C for Bavaria and 24.6 °C for Portugal, and the median value for Tmax90 amounted to 26.8 °C for Bavaria and 30.6 °C for Portugal. Additionally, and similarly to the ozone assessment, a higher level of spatial variability across the Portuguese stations became evident due to Atlantic, continental and Mediterranean influences on climate.
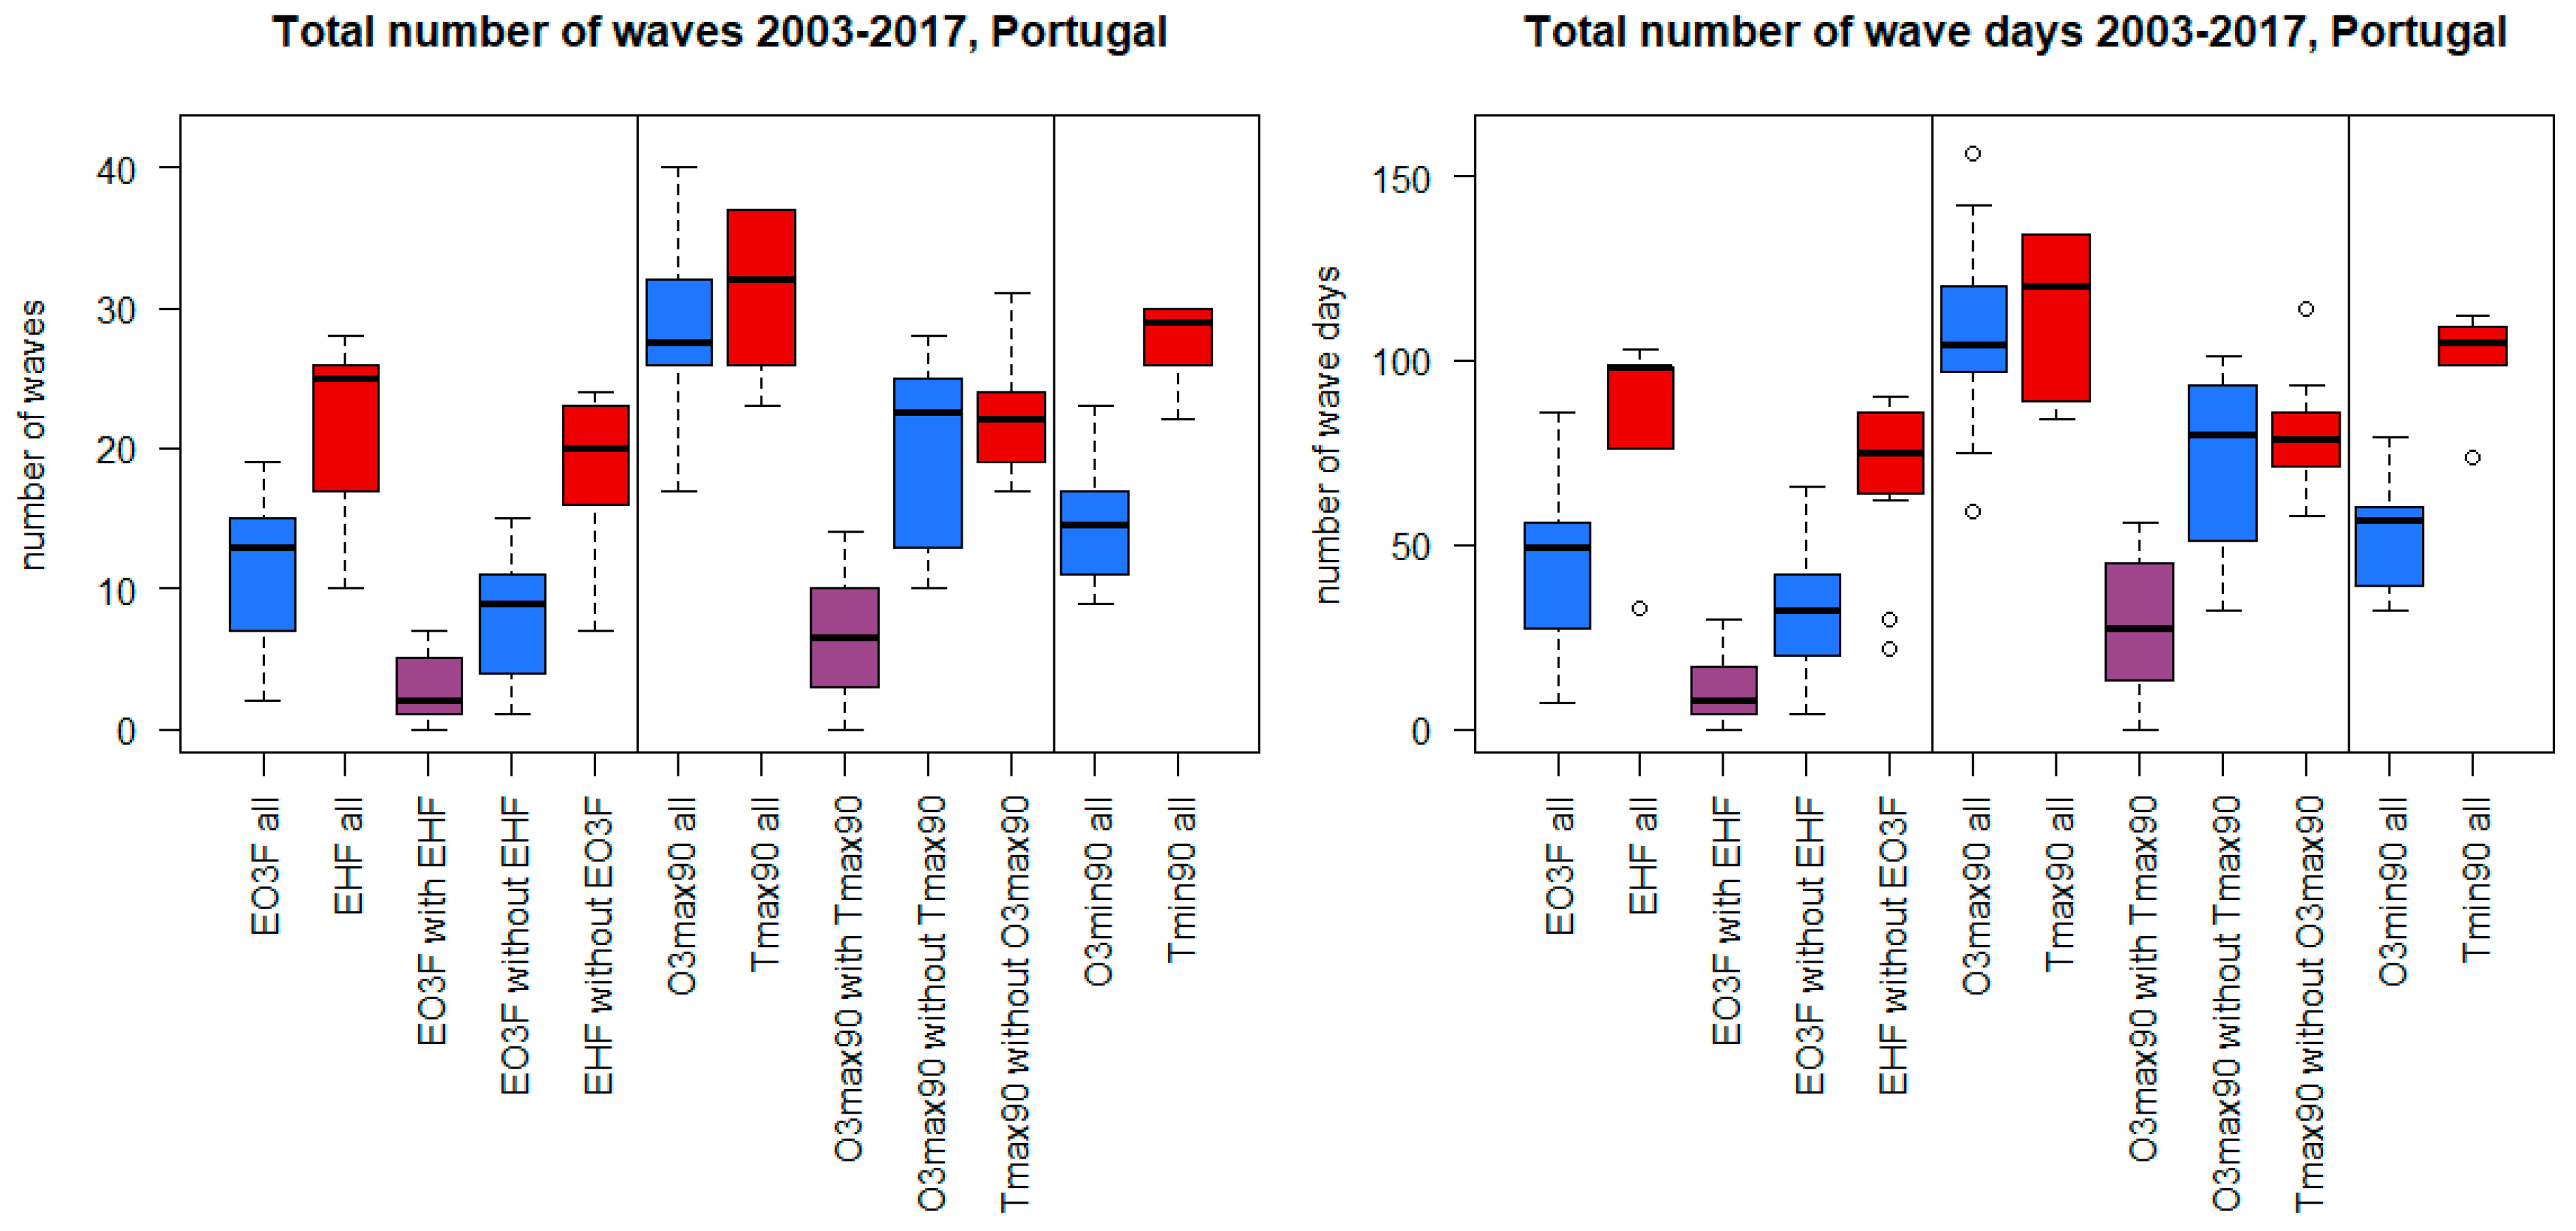
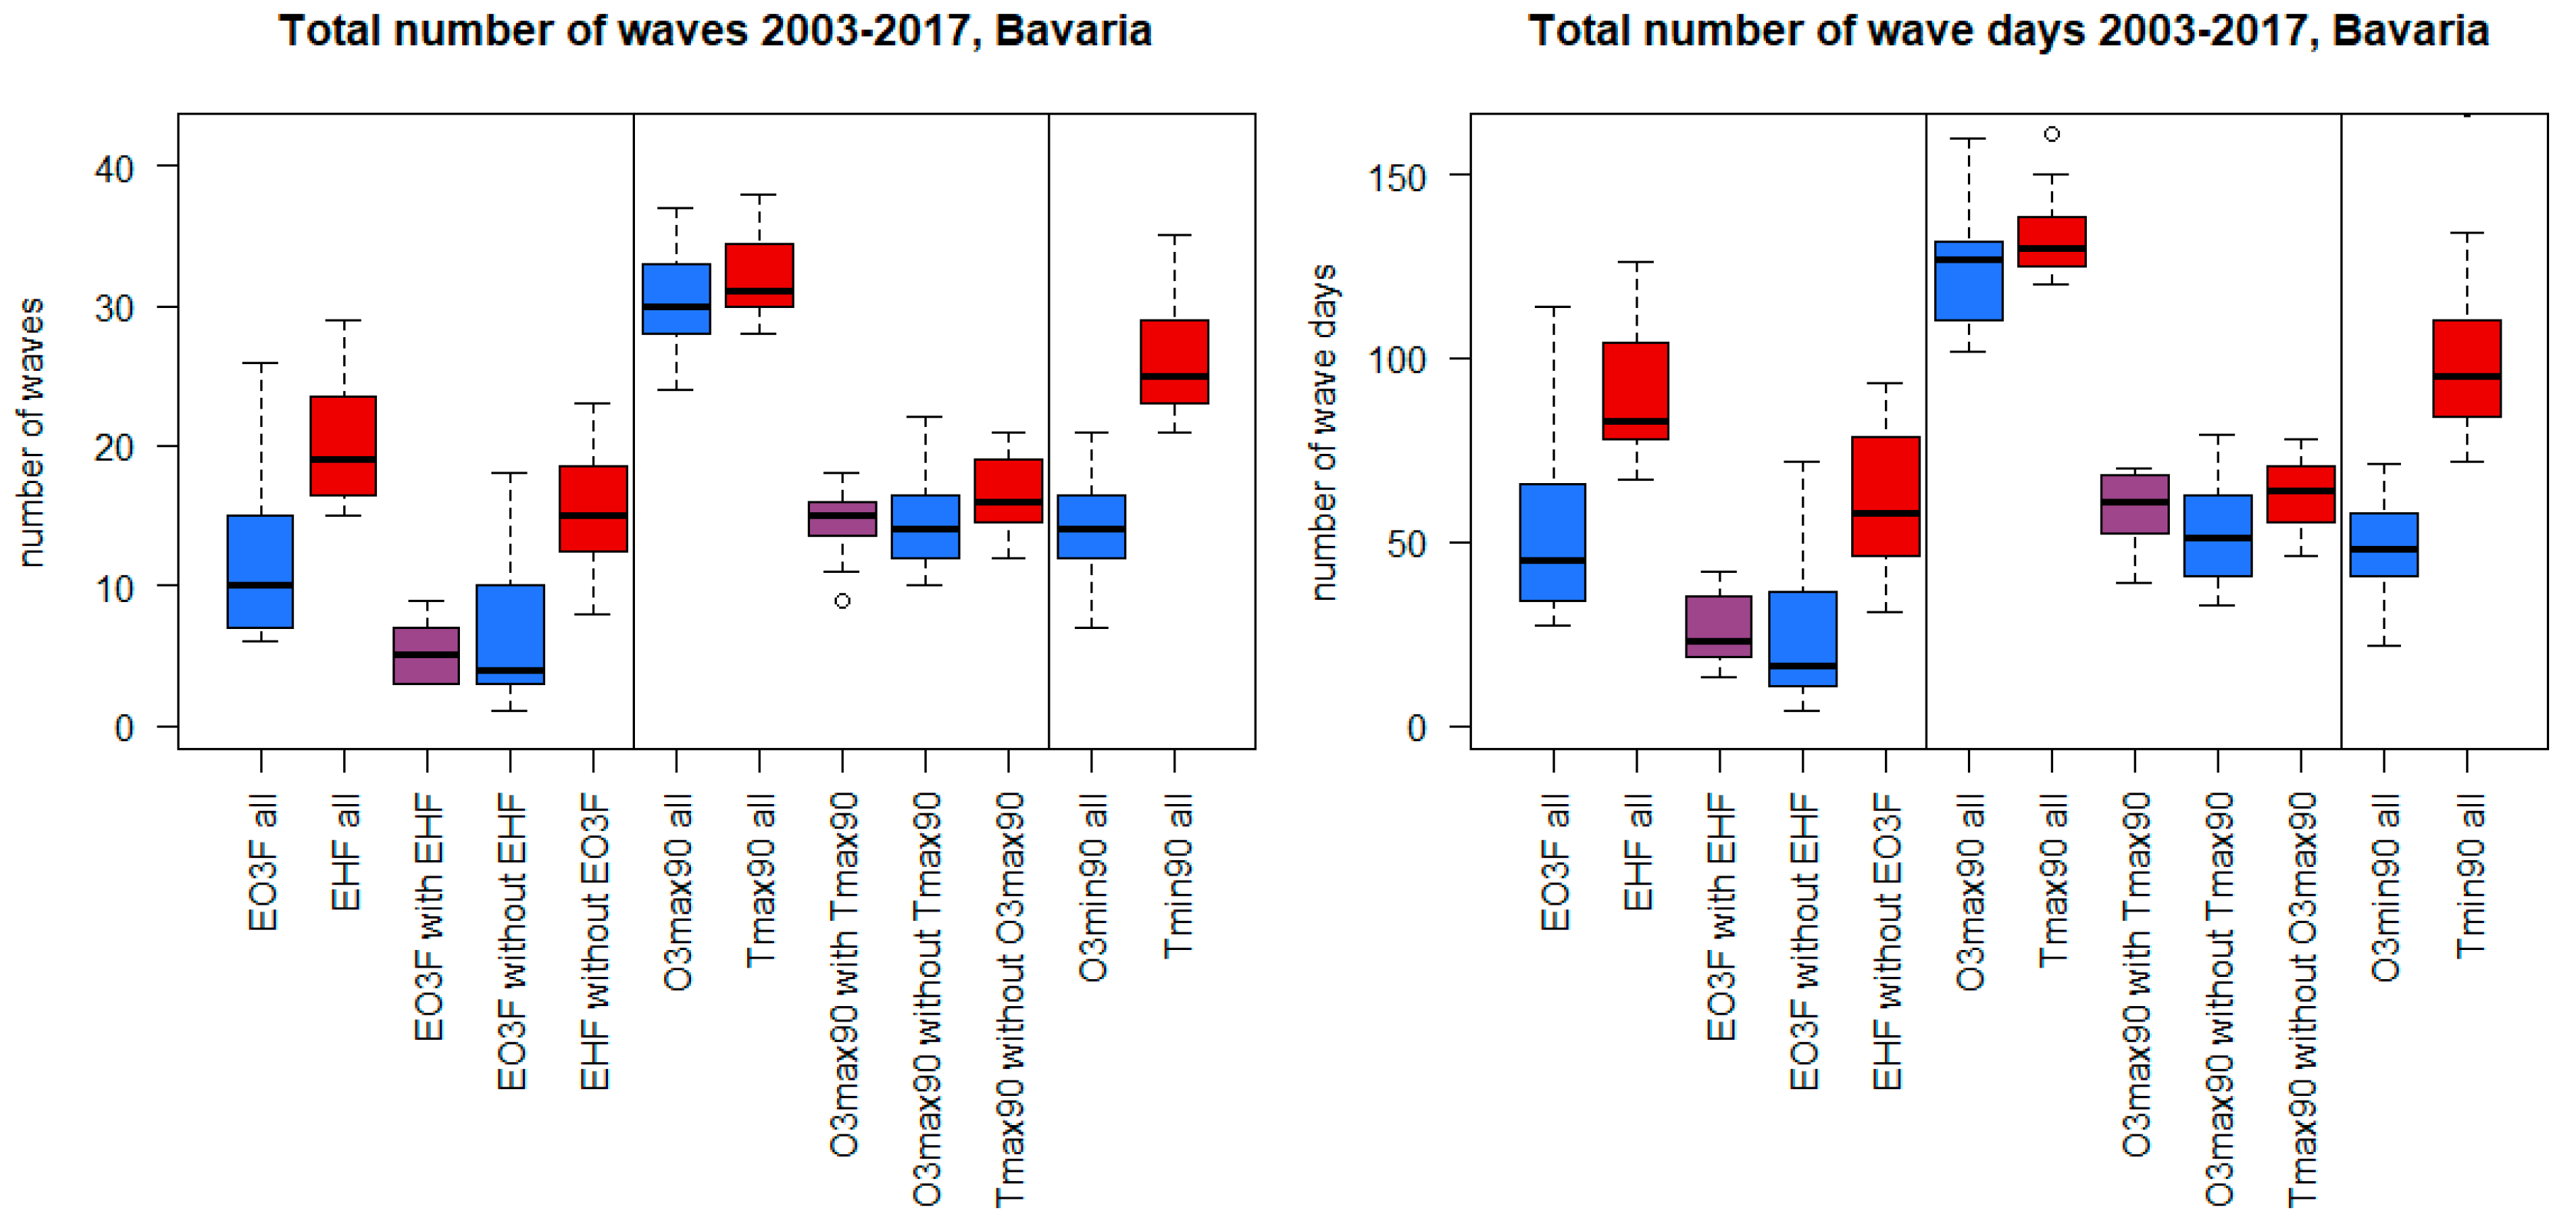
Independent ozone and heat waves were defined as 3 or more days where the 90th percentiles were exceeded. In the case of EO3F and EHF the 90th percentile of the daily mean was used, i.e., O3mean90 and Tmean90, calculated as the mean from daily minimum and maximum values. The other types of wave definitions are based on the 90th percentiles of daily maximum (O3max90, Tmax90) and minimum (O3min90, Tmin90), reflecting afternoon ozone pollution/ thermal load as well as nocturnal to early morning ozone/ heat exposure conditions. Furthermore, besides a single variable, compound ozone-heat wave events were also identified. In general, less wave events and wave days occurred according to the wave definitions based on the EO3F and EHF, compared to wave events defined by O3max90 and Tmax90 (Figure 2 and Figure 3). In Bavaria, the median value across the 15 stations of EO3F ozone waves amounted to a total of 10 waves in the period 2003–2017 with a total of 45 wave days, whereas in Portugal, the median across the 14 stations was higher, reaching 13 waves with 49 wave days. A considerably higher number of EHF heat waves occurred in both regions, with a median value for Bavaria lying at 19 waves with 83 wave days, while for Portugal it reached 25 waves with 98 wave days. In contrast, using the O3max90 and Tmax90 definitions, in Bavaria 30 ozone waves with 127 ozone wave days and 31 heat waves with 130 heat wave days were detected, whereas in Portugal, 28 ozone waves with 105 ozone wave days and 32 heat waves with 120 heat wave days were found. With respect to nocturnal ozone and heat waves, 14 O3min90 waves with 48 wave days and 25 Tmin90 waves with 95 wave days were observed for Bavaria. In Portugal 15 O3min90 waves with 57 wave days and 29 Tmin90 waves with 105 wave days occurred. From Figure 2 and Figure 3 it can also be seen that the pure single variable and the compound ozone-heat waves naturally exhibited lower numbers compared to the waves defined by all events for a single variable, since they were subsets of the latter. Interestingly, about the same number of single ozone waves and compound ozone-heat waves occurred in Bavaria, whereas in Portugal, there was a lower number of compound events compared to pure ozone waves. Summing up, in both regions heat waves were the most frequent wave type, independent of the wave definition. Furthermore, the frequencies of waves were relatively similar between the two regions, indicating that, despite the different climate setting, there exists a comparable exposure to heat and ozone waves in Central and South Europe. Note, however, the different values of the 90th percentiles between the two regions, particularly with respect to temperature (see Figure S2, Supplement).

3.2. Weather Types Related to Heat and Ozone Waves

For all wave days of the different wave types, the corresponding weather types were extracted. Tables S2 and S3 give the results for Bavaria and Portugal, respectively, showing the absolute and relative number of days of a wave-type as a sum over all Bavarian (Table S2) and Portuguese (Table S3) stations. Note that wave days of a specific wave type, which occurred simultaneously at multiple stations, were only counted once.
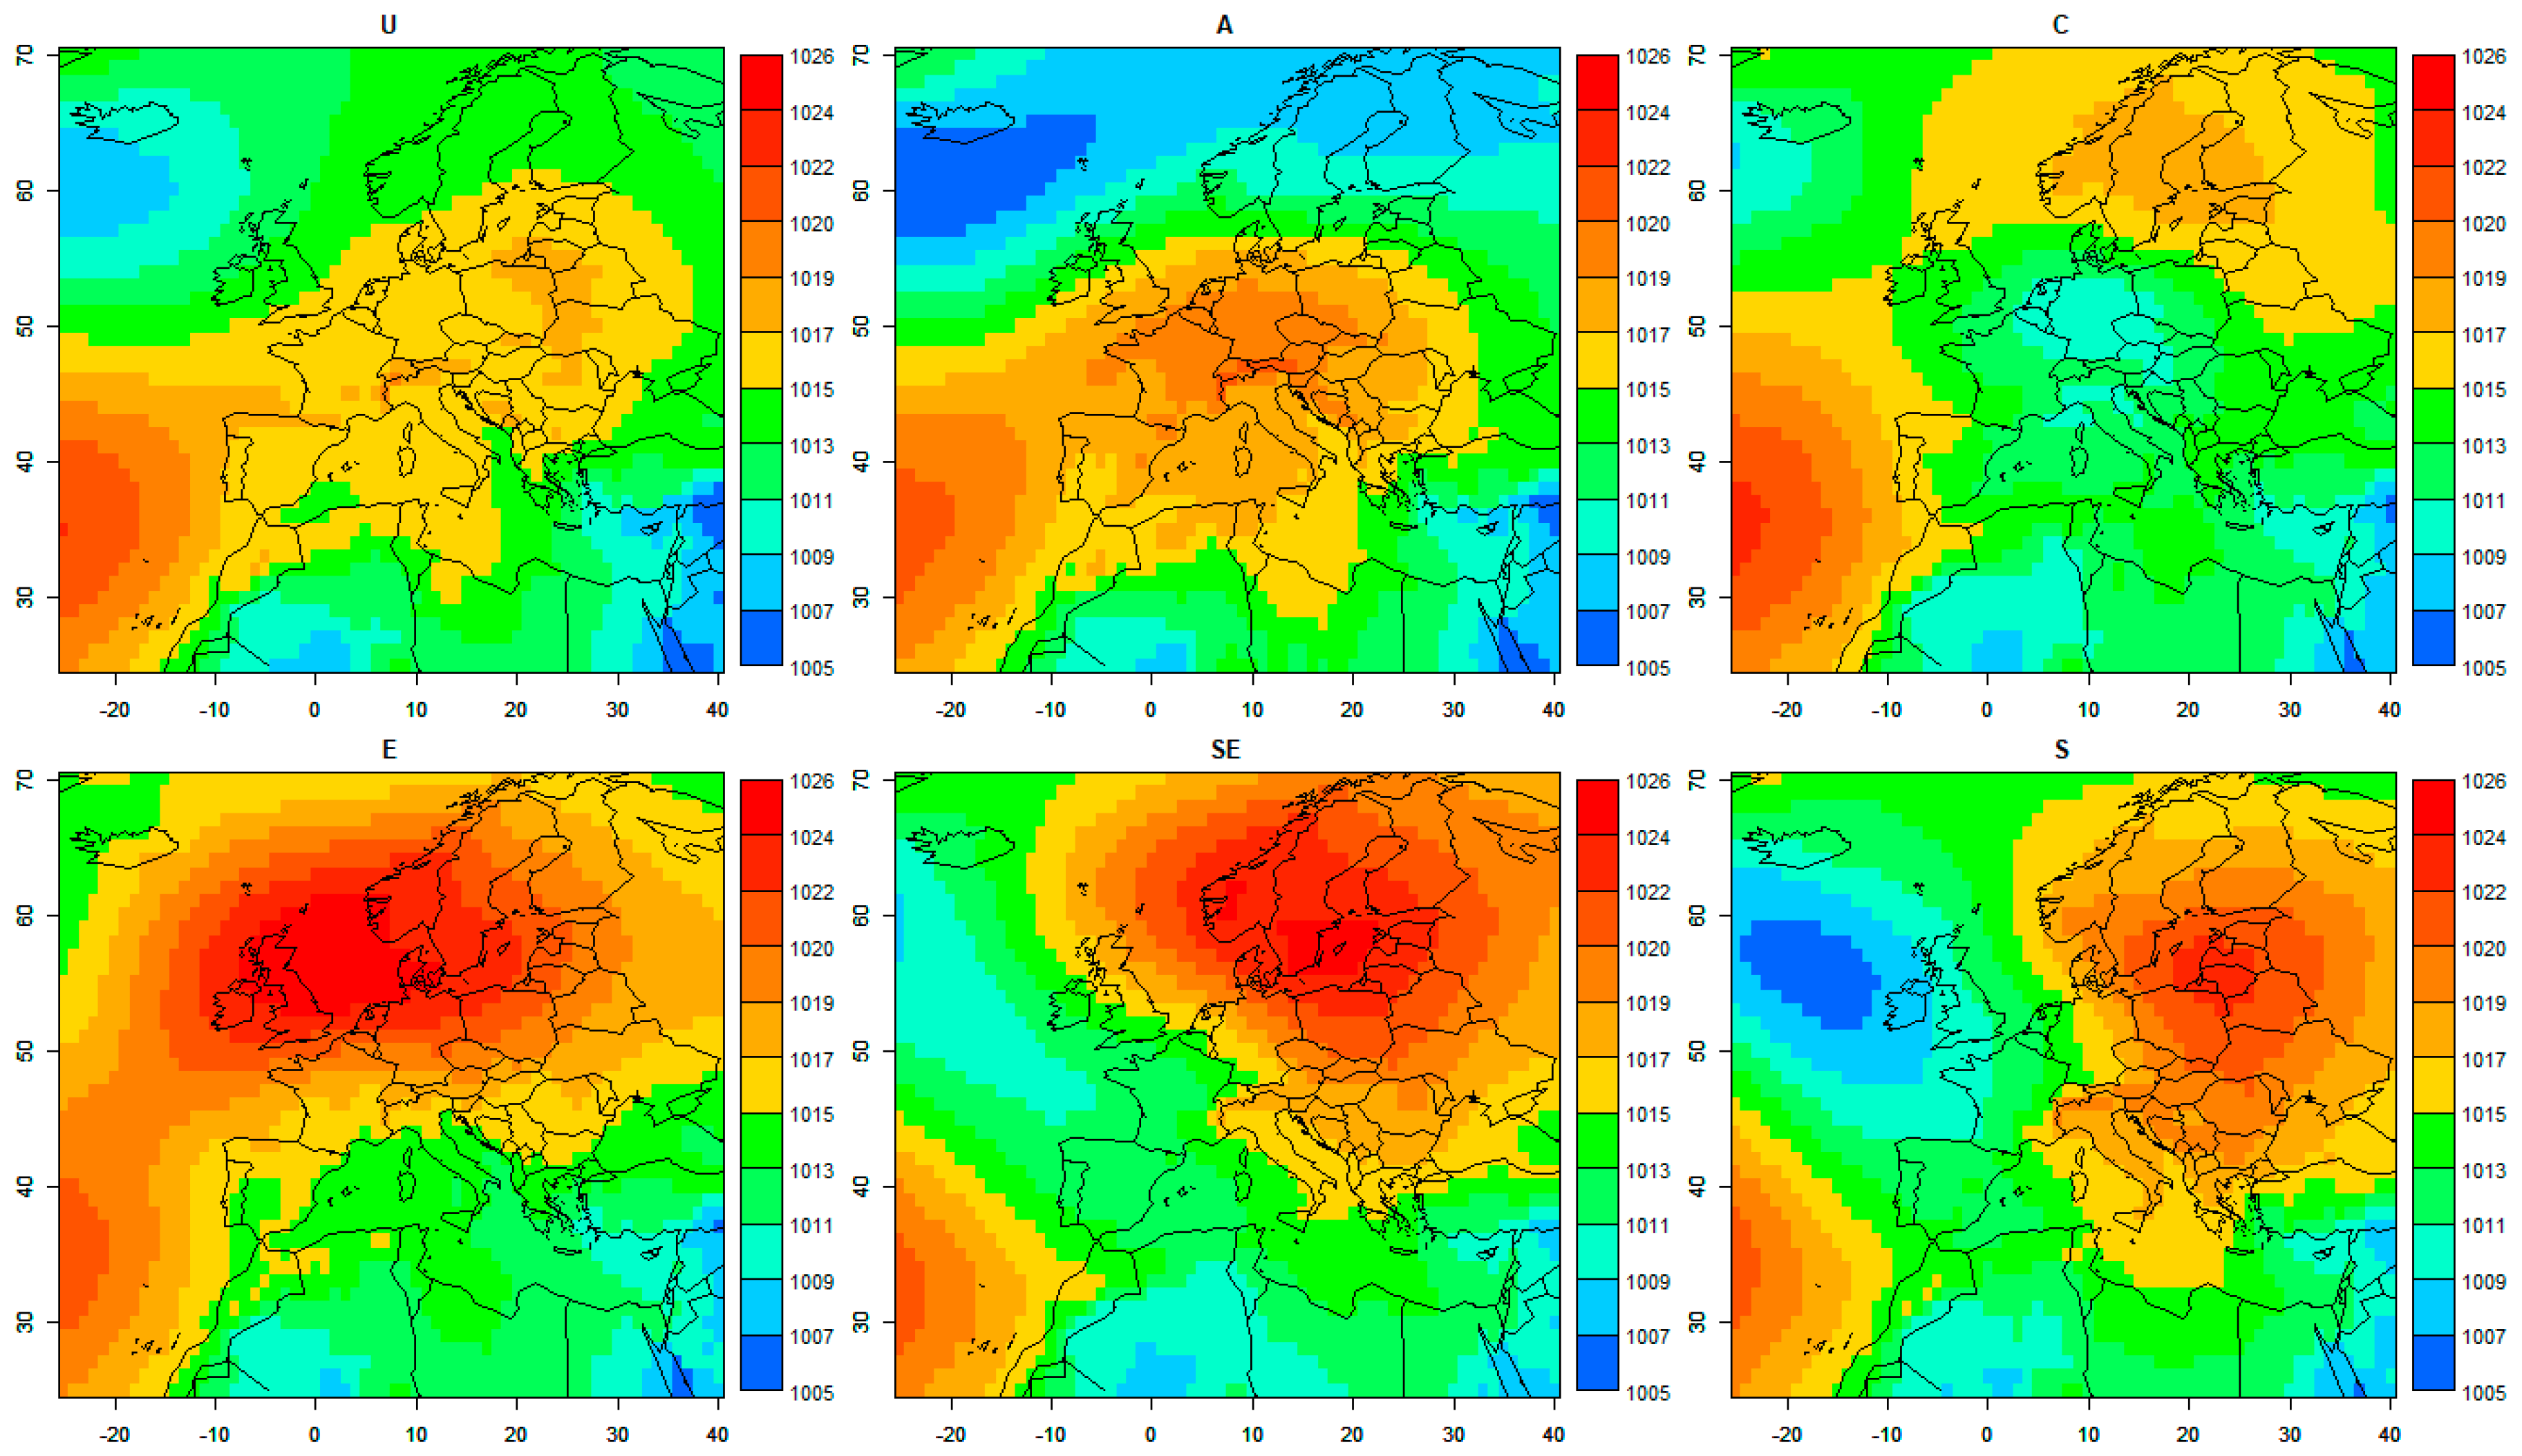
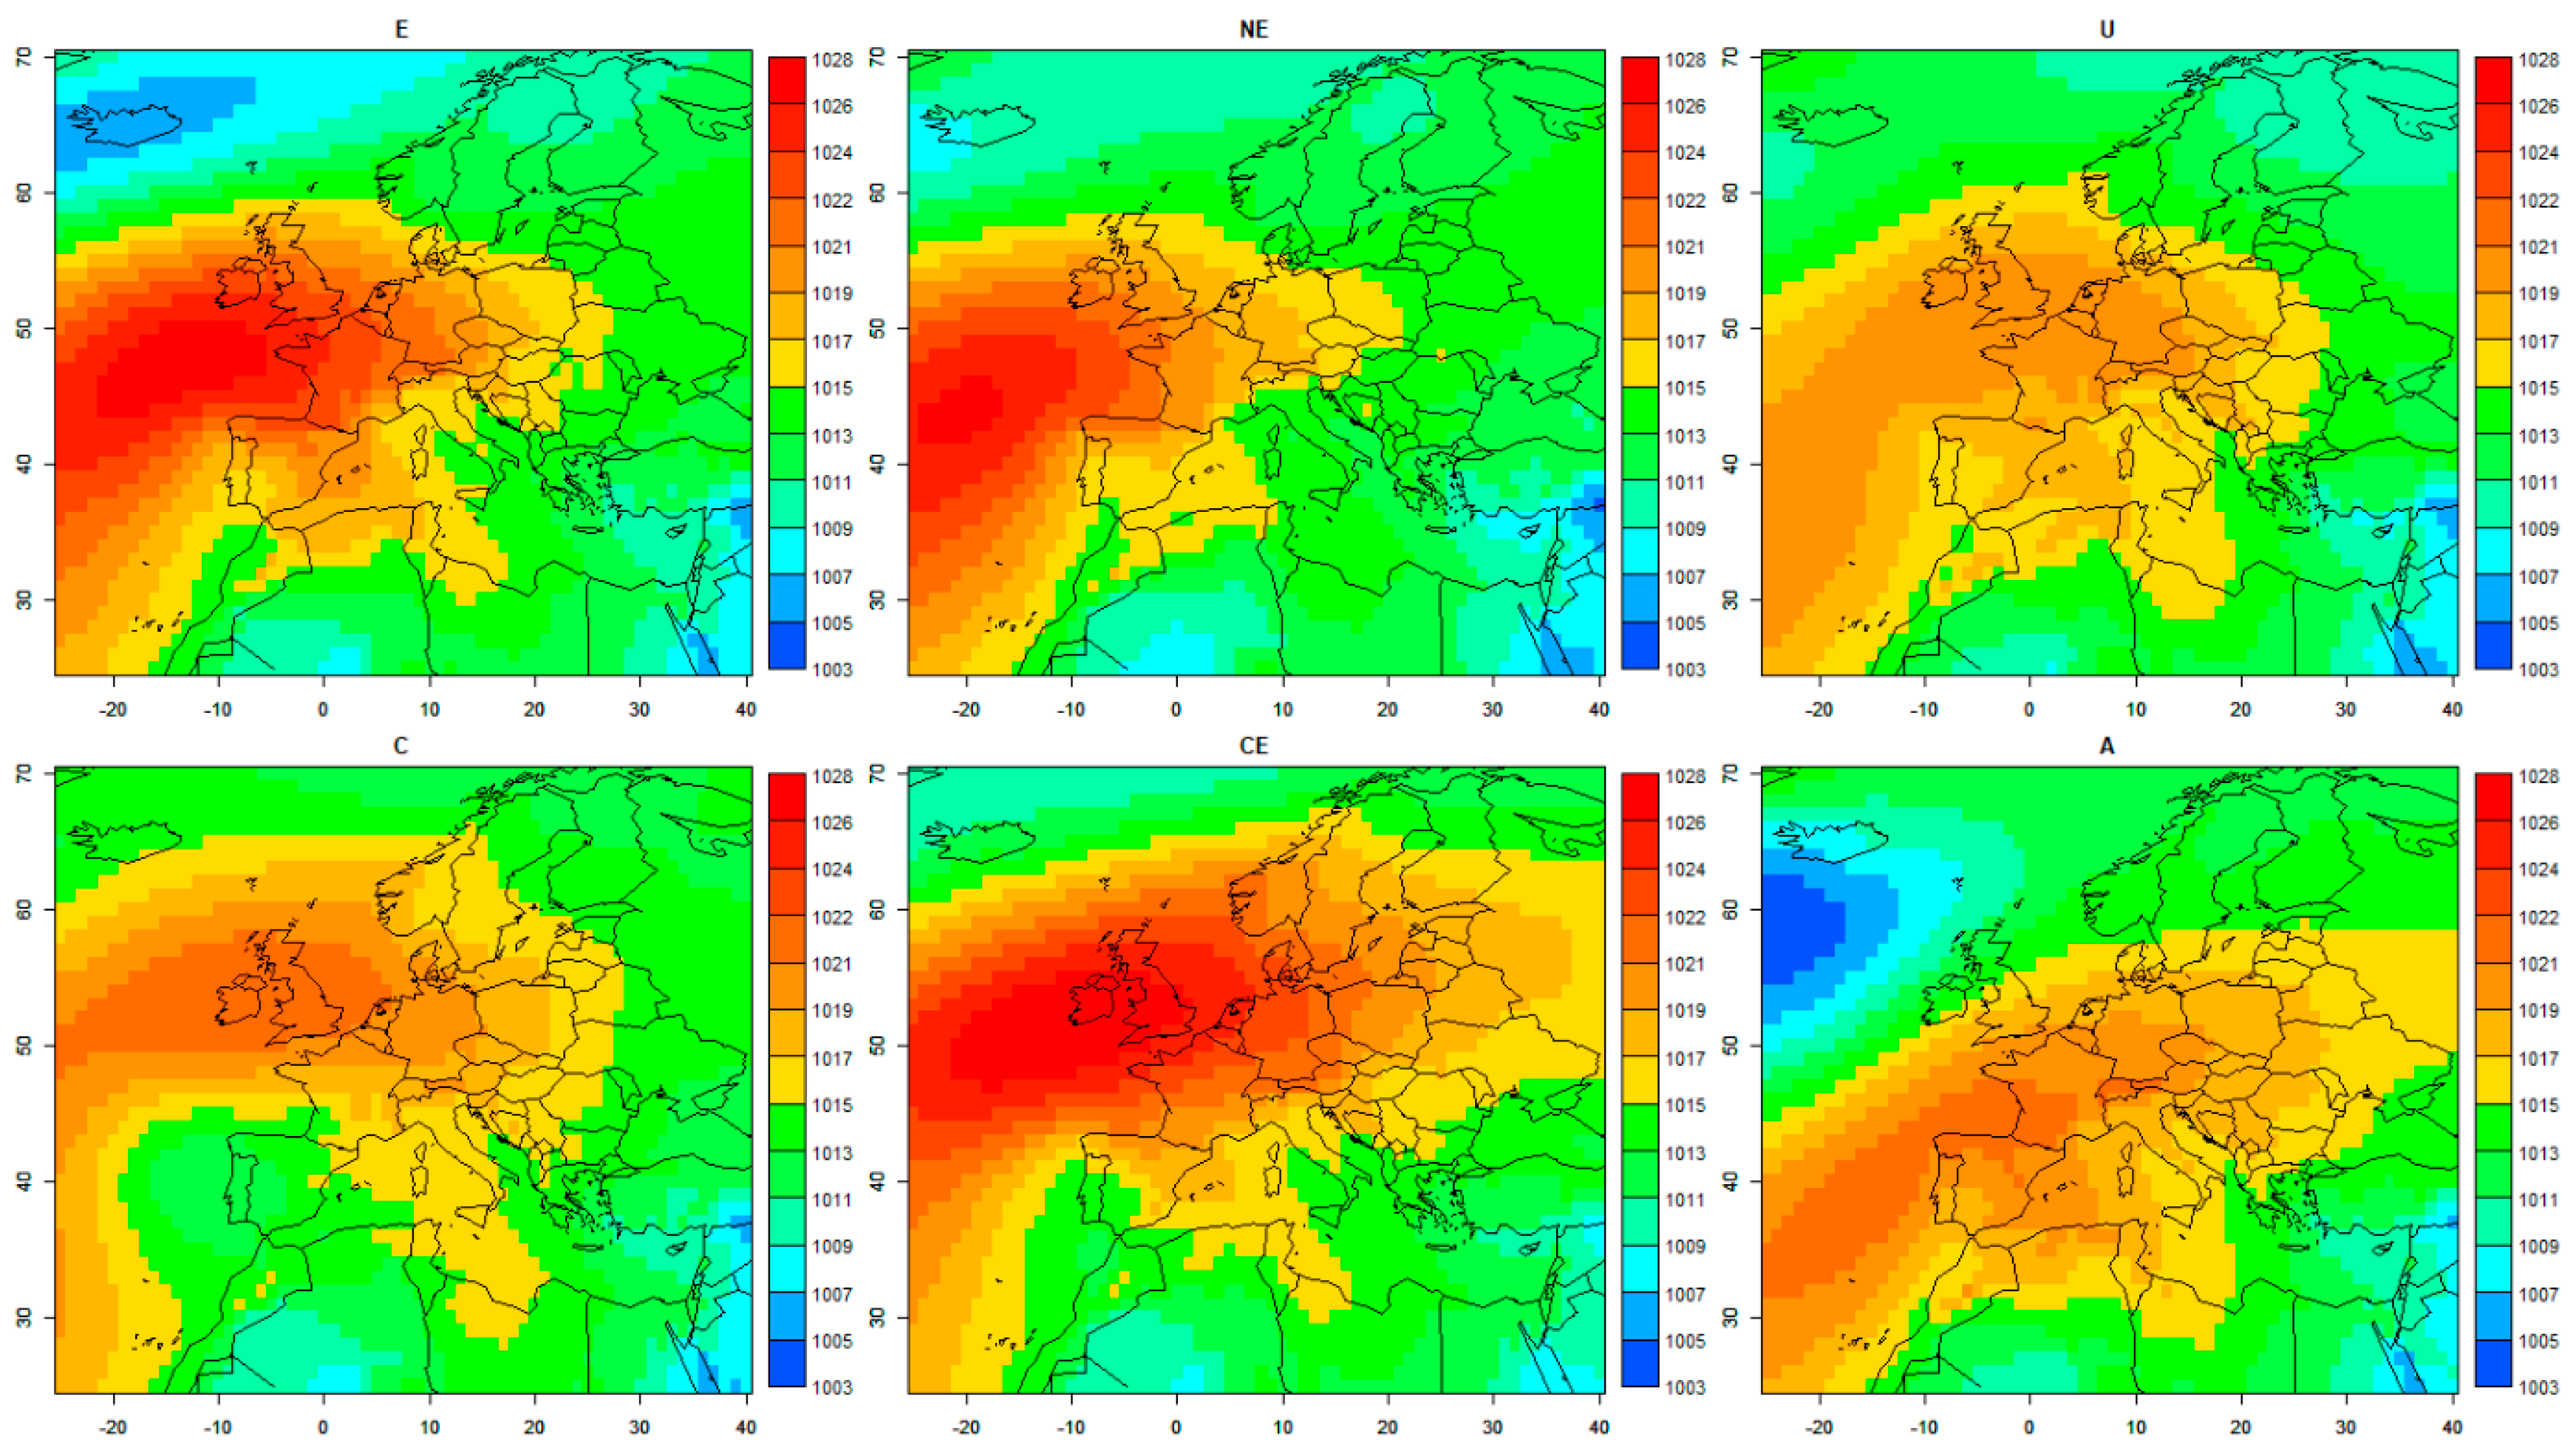
It becomes evident that only a relatively small fraction of weather types accounted for the majority of wave days and that there were striking similarities, but also notable differences between the different wave types as well as between the two study regions. The most important weather types connected with heat and ozone waves are depicted in Figure 4 for Bavaria and Figure 5 for Portugal. The subplots show for each weather type the mean sea level pressure pattern, calculated as the average from the pressure fields of all wave days a particular weather type occurred.
In Bavaria, the “unclassified” weather type “U” as well as the anticyclonic weather type “A” played a prominent role in heat and ozone waves (Table S2). The mean sea level pressure fields calculated from all wave days with the occurrence of these weather types are shown in Figure 4. Both weather types often occurred in the months from April to September, and their general frequencies sum up to approximately 45% of all spring and summer days. With respect to ozone and heat waves, about 27% of all wave days were associated with the weather type “U” and about 17% with the weather type “A”. “U” is a weather type, which is mainly associated with low flow conditions (weak pressure gradients, and thus neither flow direction nor vorticity can be identified). The appearance of this weather type was connected with air mass stagnation, i.e., there were long residence times of the air masses, which favor autochthonous weather conditions and strong ozone formation and accumulation [5]. In spring and summer, it was characterized by a weak pressure gradient over the target region, accompanied with low wind, very high ozone and air temperature, and reduced relative humidity values [5]. The weather type “A” was characterized by a strong high-pressure system over the target region (Figure 4), which in spring and summer was consistent with slightly above average maximum ozone, above-average maximum temperature, and reduced relative humidity [5]. Interestingly, the cyclonic weather type “C” was also frequently associated with ozone and heat waves in Bavaria, although with much lower values compared to both “A” and “U” weather types. The weather type “C” reflected low-pressure conditions over the target region itself. The physical link with heat and/or ozone waves was not straightforward since the occurrence of this weather type usually goes along with near-normal temperature and ozone conditions [5]. However, under heat and/or ozone wave conditions, the weather type was related to the inflow of anomalous warm air from the southeast to the southwest into Bavaria.
The relevance of the weather types “SE”, “E”, and “S” constitute another interesting result. Their combined general frequency in spring and summer was relatively low, with about 9% of all days. Likewise, their overall significance with respect to all wave types was not particularly high, however, these weather types played a notable role in the occurrence of ozone waves in Bavaria. The weather type “E” showed a high-pressure system over northern Europe with an easterly flow at its southern side into Bavaria. For the weather type “SE”, the high-pressure system was located further eastward, yielding a south-eastern flow into the target area (Figure 4). Both weather types were associated with the inflow of warm and dry continental air masses. The weather type “S” was associated with a high-pressure system with a center over eastern Europe and a low-pressure center west of the British Isles (Figure 4). Consequently, a southerly flow resulted in the target region, and relatively warm and dry conditions prevailed. However, more importantly, these weather types were related with the advection of ozone and its precursors from areas located east and south of Bavaria, and thus, their occurrence was associated with ozone wave conditions in Bavaria.
Figure 5 shows the most important weather types, which are associated with heat and ozone waves in Portugal, and Table S3 gives detailed information about the weather type-wave connections attained for the country. The weather type “E” occurred in general only at about 5%–9% (depending on the station) of all spring and summer days, but played a major role for heat as well as for ozone waves where it corresponds to roughly a quarter of all wave days. This weather type was connected with the inflow of hot and dry air masses, and also with advection of ozone and its precursors from the continental interior of the Iberian Peninsula [19]. A similar situation applied for the weather type “NE”, albeit with a north-eastern flow component. The weather type “NE” prevailed in general at about 15% of all days in spring and summer and was evident at about 15% of all wave days. As for Bavaria, the weather types “U”, “C”, and “A” were also connected with heat and/or ozone waves in Portugal. Their general occurrence added up to about 40% of all spring and summer days and to approximately 30% of all wave days (Table S3). Besides, the weather type “CE” was related to wave occurrences in Portugal. In contrast to the results for Bavaria, where weather types with a southern to eastern inflow were particularly connected with ozone waves, no specific weather types could be defined for Portugal, connected only with one variable. Instead, the described weather types were associated with both ozone and heat waves. However, there was a strong intra-weather type variability with respect to the generation of specific wave types. Thus, for instance, the weather type “E” was more strongly connected with all types of heat waves compared to ozone waves. A north-eastern inflow into the target region associated with the weather type “NE” favored, however, more ozone wave conditions.
In summary, both in-situ built-up as well as advection of air masses played a role in the occurrence of ozone and heat waves in both regions. However, in Bavaria, the ozone and heat waves showed the strongest connection with autochthonous weather conditions as reflected by the dominance of the weather types “U” and also “A”, favoring the in-situ built-up of heat and ozone pollution. In Portugal, the strongest relationship appeared for eastern and north-eastern inflow associated with the weather types “E” and “NE”, pointing to the importance of advection of heat and ozone pollution from the continental parts of the Iberian Peninsula. Furthermore, for Bavaria already almost half of the ozone and heat wave days occurred under the two weather types “U” and “A”, whereas for Portugal, a more diverse picture emerged, with six weather types having a share of >5% of all wave days.

3.3. Association With Mortality

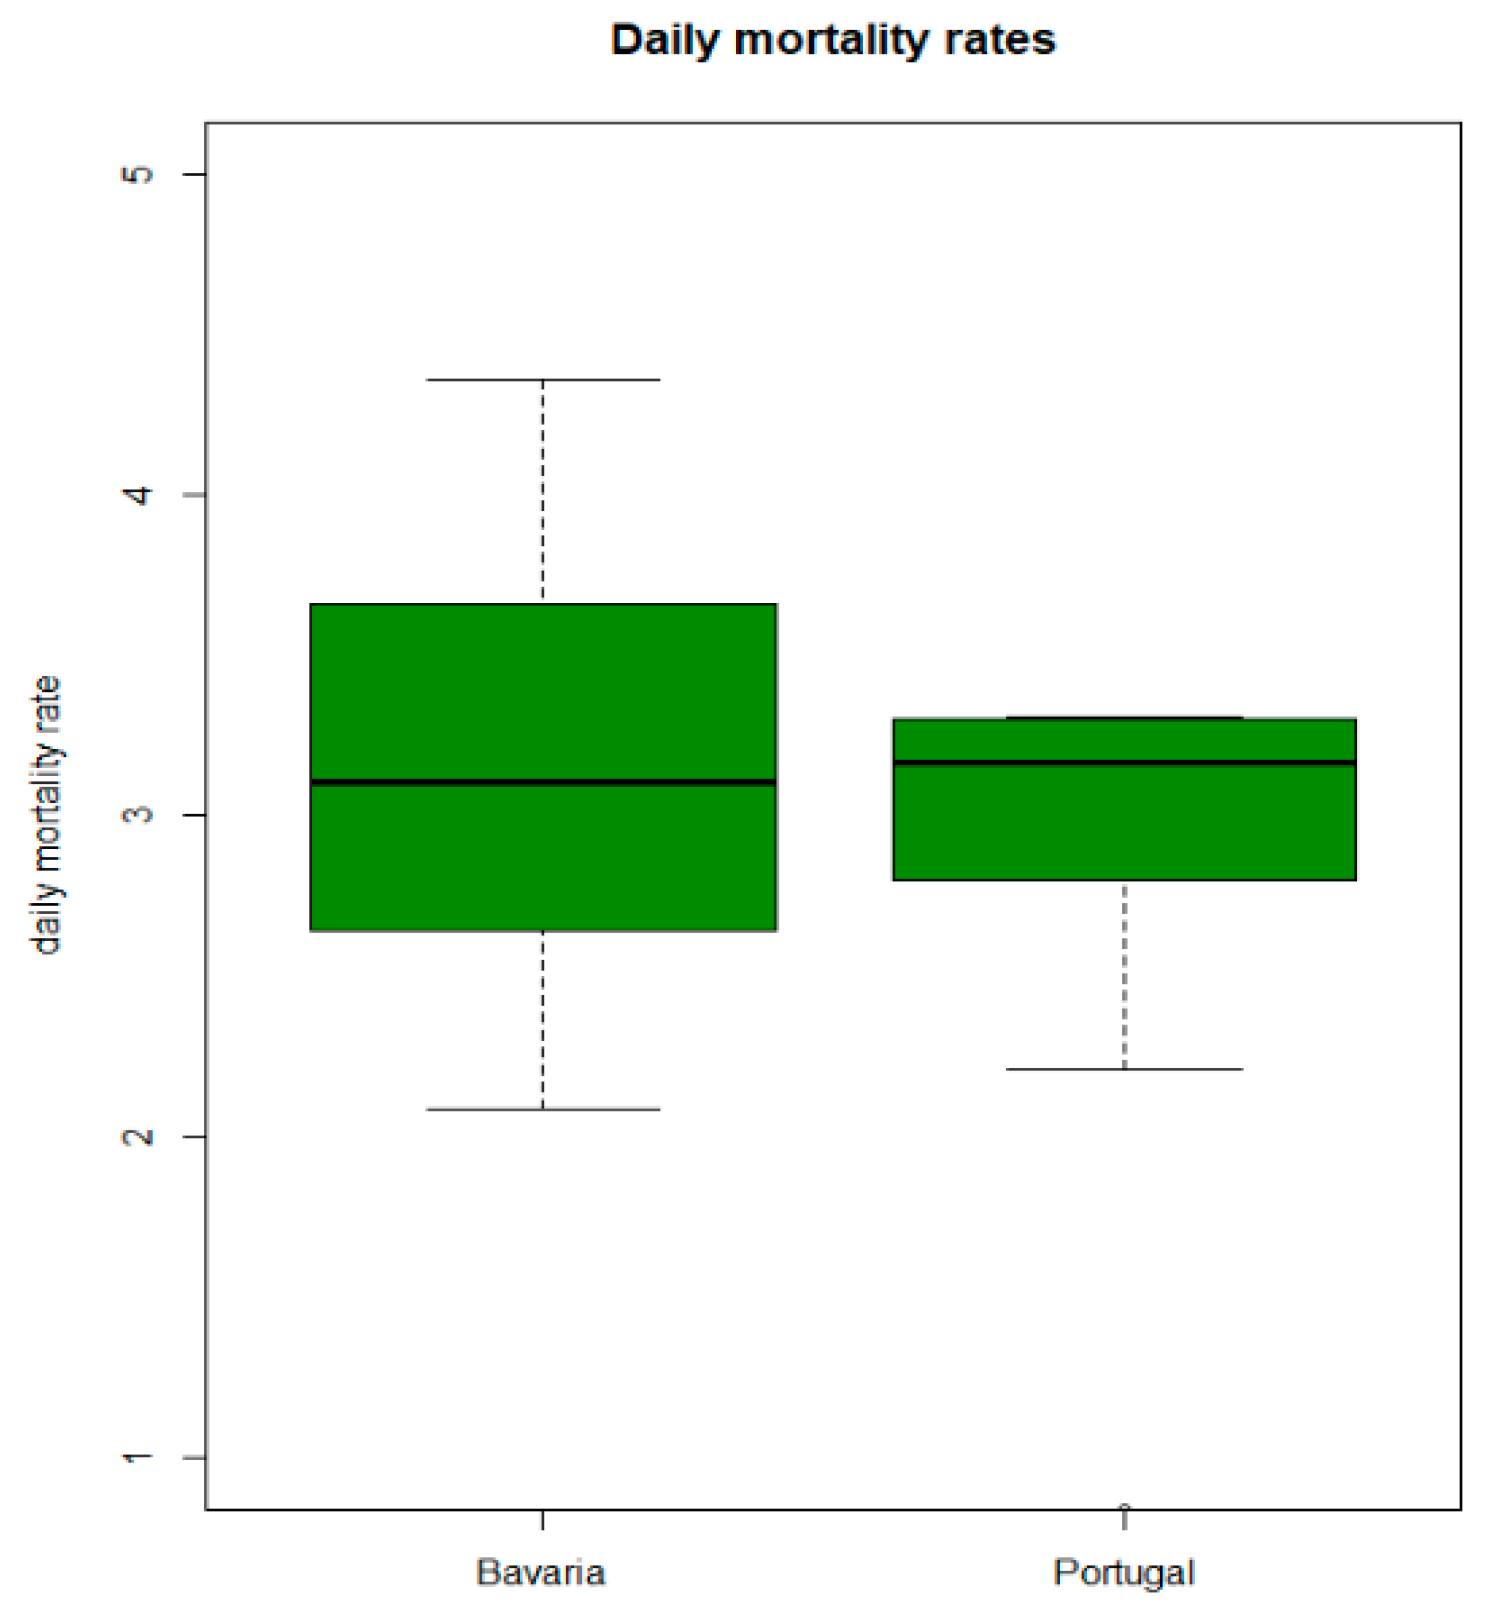
Crude mortality rates (per 100,000 inhabitants) were calculated for all cities, counties, and municipalities in Bavaria and Portugal. Figure 6 shows the daily crude mortality rates averaged over the months of April to September for 2003–2017. The median daily mortality was nearly equal between the two regions, however, there was a larger spread between the Bavarian places compared to the Portuguese ones. In general, the median daily mortality amounted to 3.1 deaths/day per 100,000 inhabitants in Bavaria and 3.2 deaths/day in Portugal.
Cumulative excess mortality for each ozone and/or heat wave type was calculated for each city, county, and municipality, respectively, allowing for mortality time displacement between 0 (no displacement) up to 14 days. Table 1 indicates the total number of wave days per wave type and the number of cumulative excess deaths associated with the waves as sums over all cities/counties of Bavaria and municipalities of Portugal, respectively. In addition, given for each wave type are the excess death rate per day, indicating the severity of a wave type, as well as the average mortality displacement considering all places of a region.
In Bavaria, the overall most frequent wave types were those defined by the threshold exceedances of the 90th percentiles, i.e., Tmin90 all, then O3max90 all, Tmax90 all, and O3min90 all waves, characterizing nocturnal-early morning heat/ozone stress, and daytime-afternoon heat/ozone stress. These wave types were calculated considering all events of a variable, regardless of whether wave conditions of the other variable also persisted or not. Despite the more frequent occurrence of Tmin90 all wave days, the highest absolute number of deaths was associated with O3max90 all waves, indicating that, besides their frequent occurrence, there was a high impact with respect to excess mortality. This can be better appreciated by the number of excess deaths/day, amounting to 1.21 deaths/day related to persistent afternoon ozone stress conditions (O3max90 all) compared to 0.73 deaths/day associated with nocturnal thermal load (Tmin90 all). However, with respect to the severity of waves, the highest death rates/day occurred under compound heat-ozone waves (EO3F with EHF as well as O3max90 with Tmax90). The compound events occurred less frequently than the individual heat or ozone events but had the largest health impacts. With respect to the most frequent mortality displacement, it can be observed for an average lag of about five days.
In Portugal, the most frequent wave types were ozone-related, with the top rank obtained by O3max90 all, followed by O3max90 without Tmax90 events, and O3min90 all events. Thus, ozone waves appeared, in general, more frequently compared to heat waves. However, the highest total cumulative excess mortality was related to heat waves, most severe for Tmax90 all waves with a total of 378 cumulative excess deaths per 100,000 inhabitants in the time period 2003–2017, followed by Tmin90 all waves and EHF all waves. This indicates that daytime heat stress had the highest health consequences, but also nocturnal thermal load, as well as the combination of both. Though, similarly to Bavaria, when looking at the severity of waves, the compound heat-ozone waves (O3max90 with Tmax90 as well as EO3F with EHF) were associated with the highest excess death rate per day, again. Concerning mortality displacement, despite the more spread values than in Bavaria, a mean lag of about 5 days was also visible, with generally shorter lags at heat waves and longer ones at ozone waves.
Overall, there was mostly a higher sensitivity of the population in Bavaria to heat and/or ozone waves compared to Portugal. Since there were 15 places under investigation for Bavaria, but only 14 for Portugal, a direct comparison of the total cumulative excess deaths was not entirely straightforward. However, considering the excess deaths/day, a clearly higher impact becomes visible for Bavaria (Table 1). The mean excess death rate per day across all wave types was 1.11 deaths/day for Bavaria, but only 0.77 deaths/day for Portugal. For both regions, the most severe waves were compound heat-ozone waves. Apart from the strong impact of the compound events, in Bavaria, there was a higher vulnerability to ozone waves, whereas in Portugal, heat waves played a more dominant role. This regional sensitivity implies that a differentiated regional view is required in any analysis of the impacts of atmospheric extreme events on human health.

4. Discussion

In this work, we have analysed the occurrence and impacts of heat and ozone wave days and events in two large areas located within two different European climatic settings (Portugal and Bavaria in southern Germany). As expected, results obtained for both regions show differences, in particular for the case of daily temperature values. In addition, the daily minimum ozone values were higher for Portugal, with higher spatial variability compared to Bavaria, whereas daily mean and maximum ozone values were of comparable magnitude in both regions.
This study relied on the application of a recently developed methodology for ozone waves, which was applied for the first time for a Mediterranean country, making it especially relevant for the Iberian and western Europe research community. Moreover, different methods were used and compared regarding the identification of wave days, allowing to analyse the different sensitivity levels of the different approaches when identifying ozone and extreme temperature events and days. The obtained results show differences when using the two approaches. EHF and EO3F were able to identify less events and days than the definition based only on the exceedances of the 90th percentiles. Thus, referring to a wave-type approach for heat and ozone constitutes the first novelty of the present work. Based on this approach, it was identified that the same number of single ozone waves and compound ozone-heat waves occurred in Bavaria, whereas in Portugal, there was a lower number of compound events compared to pure ozone waves. Heat waves were identified as the most frequent wave type, independent of the wave definition. Both regions showed approximately similar frequency of waves, indicating that, despite the different climate setting, there was a comparable exposure to heat and ozone waves in Central and Southern Europe. Note, however, that the temperature thresholds defining the heat waves were higher in Portugal.
Previous studies mostly analyzed independently ozone and heat events affecting different, sometimes aggregated, regions or countries, normally focusing on the identification of the events for the recent past or under future climate change conditions [29,33,35,36,58], focusing on the impacts [32,37], or on the associated synoptic conditions [7,8,11]. Therefore, a compound approach, considering both temperature and ozone wave days, also constitutes a novelty, particularly for Portugal.
The temperature-ozone interactions were analyzed based on a circulation-to-environment approach, through the identification of prevailing weather types associated with the occurrence of ozone and heat wave days. Prevailing weather types affecting each of the study regions were determined using a widely employed automatic classification, which is simple, easy to implement for different areas, and computationally inexpensive. This approach can easily be applied to the output of different climate models and datasets or different spatial domains, particularly at mid and high latitudes of both hemispheres.
The occurrence of ozone and heat wave events in both regions are associated with in-situ built-up, as well as advection of air masses. However, in Bavaria, ozone and heat waves showed the strongest connection with autochthonous weather conditions, while for Portugal, the strongest relationship appeared for eastern and north-eastern inflow associated with the weather types “E” and “NE”, pointing to the importance of advection of heat and ozone pollution from the continental parts of the Iberian Peninsula. These results are in accordance with previous analyses conducted in the two regions [5,8,35]. This circulation-to-environment approach has the advantage of being easily transferred to other geographical areas, which constitutes a promising tool in discriminating atmospheric conditions leading to the occurrence of wave-type events.
In terms of the impacts on mortality in both regions, the present analysis underlines the role of compound (also referred to as correlated or complex extremes) events, a research focus that was virtually absent just a decade ago. From a regional perspective, we observe a higher sensitivity of the population in Bavaria to heat and/or ozone waves compared to Portugal. The higher impact of these individual extreme events in southern Germany could be related to several issues, including a lower personal and cultural adaptation of Central European populations to heat events. Thus, southern European populations already live in a climate zone with frequent heat events and may be physiologically as well as behaviourally be better adapted, namely by installing air conditioning and/or avoiding any outdoor activities at midday. In addition, institutional adaptation strategies might be more advanced in Portugal, particularly after the 2003 heat wave that was responsible for more than 2000 excessive deaths [59]. That outstanding event triggered a wide range of improvements in hospitals and care homes, besides the development of an operational heat risk index [60] that has become widely used afterward by the health authorities. Overall, the excess death associated with heat wave events in Portugal has decreased after 2003, precisely the period under analyses here. This decline was, for the most part, due to the moderate impact in the most vulnerable groups such as the elderly and people with comorbidities. However, Germany also (including Bavaria) implemented a heat-health warning system in 2005, operating on a county scale for the whole of Germany [61]. Heat health warnings are disseminated to governmental authorities and ministries of the federal states, nursing homes, and the general public. Besides, the population age structure is quite similar between Bavaria and Portugal, not showing a higher share of vulnerable groups (i.e., persons >65 years) in Bavaria. In summary, the different sensitivity of the Bavarian and Portuguese populations to heat and ozone extremes does not offer a straightforward explanation, but needs further investigation.
However, we believe that the most relevant result obtained here, and valid for both regions, is to confirm that the most severe extreme events, as measured by excess mortality rates, were always associated with compound heat-ozone waves. In fact, the very notion of a compound event was initially introduced by the IPCC in its important Special Report on Climate Extremes published in 2012 [62]. Afterward, the amount of publications and projects dedicated to compound events has grown significantly, and the entire subject evolved into an interdisciplinary endeavor [26]. Therefore, we believe that an interdisciplinary compound analysis of the events and their impacts allows for an overall holistic perspective of this complex problem. This study might be a starting point to assess the applicability of developing warning systems to assess the possibility of, in certain future circumstances, heat and ozone waves having a high probability of contributing even more to the occurrence of high levels of mortality in both study areas. Nevertheless, some other aspects, like the different local threshold and health actions, should be taken into account when studying past and future changes in heat and ozone extreme events.

5. Conclusions and Final Remarks

The main goal of this work was to assess the characteristics of individual and combined heat and ozone pollution waves in two distinct climatic regions, Central and South-western Europe, as well as their impacts on mortality. In terms of the characterization of the events, special attention was given to the analysis of the predominant weather types associated with the occurrence of heat and ozone pollution waves.
As expected, we found differences between the two study regions regarding the atmospheric drivers of such extremes, depicted by the most relevant weather types in each region. Moreover, the results stress that the higher impacts on mortality are, in both regions, always associated with the compound occurrence of heat and ozone waves. Therefore, an interdisciplinary compound approach is considered an advantage. Nevertheless, some aspects were not considered and needed to be investigated, namely: (1) How ozone and heat waves frequencies and within-weather-type characteristics (temperature, humidity, wind) will change in the future; (2) how social and health measures influence the impact of wave-type events on morbidity and mortality; (3) how ozone concentrations will be affected by changes in precursor emissions.
We have shown that heat and ozone waves compose a significant health risk throughout different regions of Europe. Therefore, we would like to highlight that, due to the high impact of these events (particularly compound heat-ozone waves) on human mortality and their projected increases under ongoing climate change, more attention should be given to these types of extremes. In addition, more research of the actual exposure, particularly on the sub-urban local scale, should be done, and different health outcomes should be accounted for. A differentiated knowledge of the particular exposure and the possible physiological reactions is a prerequisite for adequate support of the public health sector.
Supplementary Materials

Supplementary materials can be found at https://www.mdpi.com/2073-4433/11/12/1271/s1. Table S1: Station name, station type (ub = urban background, sb = suburban background), geographic coordinates, and height of air quality stations, as well as a percentage of missing daily values in the months April to September in the time period 2003–2017 of ozone and temperature time series used in this study. Table S2: Association of weather types with ozone and heat waves in Bavaria in the period 2003-2017. Shown are the absolute (n) and relative (%) number of days of a wave-type as a sum over all 15 Bavarian stations. Note that wave days of a wave type, which occurred simultaneously at multiple stations, are only counted once. EO3F all (EHF all): All ozone (heat) waves according to the EO3F (EHF) definition, EO3F with EHF: Compound ozone-heat waves, EO3F (EHF) without EHF (EO3F): single ozone (heat) waves without heat (ozone) wave conditions, O3max90 all (Tmax90 all): all ozone (heat) waves according to the O3max90 (Tmax90) definition, O3max90 with Tmax90: compound ozone-heat waves, O3max90 (Tmax90) without Tmax90 (O3max90): Single ozone (heat) waves without heat (ozone) wave conditions, O3min90 all (Tmin90 all): All ozone (heat) waves according to the O3min90 (Tmin90) definition. The relative contribution of a weather type to a wave >5% are marked in bold. Table S3: Association of weather types with ozone and heat waves in Portugal in the period 2003-2017. Shown are the absolute (n) and relative (%) number of days of a wave as a sum over all 14 Portuguese stations. Note that wave days of a wave type, which occurred simultaneously at multiple stations, are only counted once. Abbreviations as in Table S2. Figure S1: 90th percentiles of minimum (O3min90), mean (O3mean90), and maximum (O3max90) daily 1 h ozone concentrations across the 15 stations of Bavaria and the 14 stations of Portugal, respectively. Shown are the means of the months April–September 2003–2017. Figure S2: 90th percentiles of minimum (Tmin90), mean (Tmean90), and maximum (Tmax90) daily temperature across the 15 stations of Bavaria and the 14 stations of Portugal, respectively. Shown are the means of the months April-September 2003–2017.

Author Contributions

Conceptualization, E.H. and A.R.; methodology, E.H.; validation, E.H., A.R. and R.M.T.; formal analysis, E.H.; investigation, E.H. and A.R.; resources, E.H. and A.R.; data curation, E.H. and A.R.; writing—original draft preparation, E.H., A.R. and R.M.T.; writing—review and editing, E.H., A.R. and R.M.T.; visualization, E.H.; funding acquisition, E.H. All authors have read and agreed to the published version of the manuscript.

Funding

EH was supported by the Deutsche Forschungsgemeinschaft (DFG, German Research Foundation) under project number 408057478. AR and RT were supported by Fundação para a Ciência e Tecnologia (FCT) under projects IMPECAF (PTDC CTA–CLI28902 2017) and UIDB/50019/2020–Instituto Dom Luiz.

Acknowledgments

The authors acknowledge IPMA (www.ipma.pt) and INSA (www.insa.pt) for the Portuguese meteorological and mortality data, respectively. We also thank Sónia Namorado and Susana Pereira da Silva, from INSA, and Manuel Mendes, from IPMA, for the aggregation of the datasets.

Conflicts of Interest

The authors declare no conflict of interest.

References

  1. EEA—European Environmental Agency. Exceedance of Air Quality Standards in Urban Areas. 2019. Available online: https://www.eea.europa.eu/data-and-maps/indicators/exceedance-of-air-qualitylimit-3/assessment-5 (accessed on 7 September 2020).
  2. OECD (Organization for Economic Co-Operation and Development). Environmental Outlook to 2050: The Consequences of Inaction; OECD: Paris, France, 2012; p. 350. [Google Scholar] [CrossRef]
  3. Dias, D.; Tchepel, O.; Carvalho, A.; Miranda, A.I.; Borrego, C. Particulate Matter and Health Risk under a Changing Climate: Assessment for Portugal. Sci. World J. 2012, 2012, 1–10. [Google Scholar] [CrossRef] [PubMed] [Green Version]
  4. Díaz, J.; Linares, C.; Carmona, R.; Russo, A.; Ortiz, C.; Salvador, P.; Trigo, R.M. Saharan dust intrusions in Spain: Health impacts and associated synoptic conditions. Environ. Res. 2017, 156, 455–467. [Google Scholar] [CrossRef] [PubMed]
  5. Hertig, E.; Schneider, A.; Peters, A.; Von Scheidt, W.; Kuch, B.; Meisinger, C. Association of ground-level ozone, meteorological factors and weather types with daily myocardial infarction frequencies in Augsburg, Southern Germany. Atmos. Environ. 2019, 217, 116975. [Google Scholar] [CrossRef]
  6. EEA—European Environmental Agency. Exceedance of Air Quality Standards in Urban Areas; Indicator Assessment Prod-ID: IND-34-en, CSI 004; European Environmental Agency: Copenhagen, Denmark, 2018. [Google Scholar] [CrossRef]
  7. Dayan, U. Relationship between synoptic-scale atmospheric circulation and ozone concentrations over Israel. J. Geophys. Res. Space Phys. 2002, 107, ACL 31-1. [Google Scholar] [CrossRef]
  8. Russo, A.; Trigo, R.M.; Martins, H.; Mendes, M.T. NO2, PM10 and O3 urban concentrations and its association with circulation weather types in Portugal. Atmos. Environ. 2014, 89, 768–785. [Google Scholar] [CrossRef]
  9. Russo, A.; Gouveia, C.; Levy, I.; Dayan, U.; Jerez, S.; Mendes, M.; Trigo, R.M. Coastal recirculation potential affecting air pollutants in Portugal: The role of circulation weather types. Atmos. Environ. 2016, 135, 9–19. [Google Scholar] [CrossRef]
  10. Russo, A.; Sousa, P.; Durão, R.; Ramos, A.; Salvador, P.; Linares, C.; Díaz, R.; Trigo, R. Saharan dust intrusions in the Iberian Peninsula: Predominant synoptic conditions. Sci. Total Environ. 2020, 717, 137041. [Google Scholar] [CrossRef]
  11. Demuzere, M.; Trigo, R.M.; De Arellano, J.V.-G.; Van Lipzig, N.P.M. The impact of weather and atmospheric circulation on O3 and PM10 levels at a rural mid-latitude site. Atmos. Chem. Phys. Discuss. 2009, 9, 2695–2714. [Google Scholar] [CrossRef] [Green Version]
  12. Schnell, J.L.; Prather, M.J. Co-occurrence of extremes in surface ozone, particulate matter, and temperature over eastern North America. Proc. Natl. Acad. Sci. USA 2017, 114, 2854–2859. [Google Scholar] [CrossRef] [Green Version]
  13. Varotsos, K.V.; Giannakopoulos, C.; Tombrou, M. Ozone-temperature relationship during the 2003 and 2014 heatwaves in Europe. Reg. Environ. Chang. 2019, 19, 1653–1665. [Google Scholar] [CrossRef]
  14. Zhang, Y.; Yang, P.; Gao, Y.; Leung, R.L.; Bell, M.L. Health and economic impacts of air pollution induced by weather extremes over the continental U.S. Environ. Int. 2020, 143, 105921. [Google Scholar] [CrossRef] [PubMed]
  15. Trigo, R.M.; DaCamara, C.C. Circulation weather types and their impact on the precipitation regime in Portugal. Int. J. Clim. 2020, 20, 1559–1581. [Google Scholar] [CrossRef]
  16. Ramos, A.M.; Barriopedro, D.; Dutra, E. Circulation weather types as a tool in atmospheric, climate, and environmental research. Front. Environ. Sci. 2015, 3. [Google Scholar] [CrossRef] [Green Version]
  17. Philipp, A.; Bartholy, J.; Beck, C.; Erpicum, M.; Esteban, P.; Huth, R.; James, P.; Jourdain, S.; Krennert, T.; Lykoudis, S.; et al. COST733CAT—A database of weather and circulation type classifications. Phys. Chem. Earth Parts A/B/C 2010, 35, 360–373. [Google Scholar] [CrossRef]
  18. García-Herrera, R.; Hernández, E.; Barriopedro, D.; Paredes, D.; Trigo, R.M.; Trigo, I.F.; Mendes, M.A. The Outstanding 2004/05 Drought in the Iberian Peninsula: Associated Atmospheric Circulation. J. Hydrometeorol. 2007, 8, 483–498. [Google Scholar] [CrossRef] [Green Version]
  19. Peña-Angulo, D.; Trigo, R.; Cortesi, N.; González-Hidalgo, J. The influence of weather types on the monthly average maximum and minimum temperatures in the Iberian Peninsula. Atmos. Res. 2016, 217–230. [Google Scholar] [CrossRef]
  20. Ramos, A.M.; Ramos, R.; Sousa, P.M.; Trigo, R.M.; Janeira, M.; Prior, V. Cloud to ground lightning activity over Portugal and its association with circulation weather types. Atmos. Res. 2011, 101, 84–101. [Google Scholar] [CrossRef]
  21. Pereira, M.G.; Trigo, R.M.; Da Camara, C.C.; Pereira, J.M.C.; Leite, S.M. Synoptic patterns associated with large summer forest fires in Portugal. Agric. For. Meteorol. 2005, 129, 11–25. [Google Scholar] [CrossRef]
  22. Peña-Angulo, D.; Nadal-Romero, E.; Gonzalez-Hidalgo, J.C.; Albaladejo, J.; Andreu, V.; Bagarello, V.; Barhi, H.; Batalla, R.J.; Bernal, S.; Bienes, R.; et al. Spatial variability of the relationships of runoff and sediment yield with weather types throughout the Mediterranean basin. J. Hydrol. 2019, 571, 390–405. [Google Scholar] [CrossRef] [Green Version]
  23. Vicente-Serrano, S.; Trigo, R.; López-Moreno, J.; Liberato, M.; Lorenzo-Lacruz, J.; Beguería, S.; Morán-Tejeda, E.; El Kenawy, A. Extreme winter precipitation in the Iberian Peninsula in 2010: Anomalies, driving mechanisms and future projections. Clim. Res. 2011, 46, 51–65. [Google Scholar] [CrossRef] [Green Version]
  24. Paredes, D.; Trigo, R.M.; García-Herrera, R.; Trigo, I.F. Understanding Precipitation Changes in Iberia in Early Spring: Weather Typing and Storm-Tracking Approaches. J. Hydrometeorol. 2006, 7, 101–113. [Google Scholar] [CrossRef] [Green Version]
  25. Saavedra, S.; Rodriguez, A.; Taboada, J.J.; Souto, J.; Casares, J. Synoptic patterns and air mass transport during ozone episodes in northwestern Iberia. Sci. Total Environ. 2012, 441, 97–110. [Google Scholar] [CrossRef] [PubMed]
  26. Zscheischler, J.; Martius, O.; Westra, S.; Bevacqua, E.; Raymond, C.; Horton, R.M.; Hurk, B.V.D.; AghaKouchak, A.; Jézéquel, A.; Runge, J.; et al. A typology of compound weather and climate events. Nat. Rev. Earth Environ. 2020, 1, 333–347. [Google Scholar] [CrossRef]
  27. Hertig, E. Towards Definitions of Ground-Level Ozone Waves and Heat Waves Relevant for Human Mortality. 2020. Available online: https://[email protected] (accessed on 7 September 2020).
  28. Hertig, E. Health-relevant ground-level ozone and temperature events under future climate change using the example of Bavaria, Southern Germany. Air Qual. Atmos. Health 2020, 13, 435–446. [Google Scholar] [CrossRef] [Green Version]
  29. Guerreiro, S.B.; Dawson, R.J.; Kilsby, C.G.; Lewis, E.; Ford, A. Future heat-waves, droughts and floods in 571 European cities. Environ. Res. Lett. 2018, 13, 034009. [Google Scholar] [CrossRef]
  30. King, A.D.; Karoly, D.J. Climate extremes in Europe at 1.5 and 2 degrees of global warming. Environ. Res. Lett. 2017, 12, 114031. [Google Scholar] [CrossRef]
  31. Strickland, M.J.; Darrow, L.A.; Klein, M.; Flanders, W.D.; Sarnat, J.A.; Waller, L.A.; Sarnat, S.E.; Mulholland, J.A.; Tolbert, P.E. Short-term Associations between Ambient Air Pollutants and Pediatric Asthma Emergency Department Visits. Am. J. Respir. Crit. Care Med. 2010, 182, 307–316. [Google Scholar] [CrossRef] [Green Version]
  32. Nuvolone, D.; Petri, D.; Voller, F. The effects of ozone on human health. Environ. Sci. Pollut. Res. 2018, 25, 8074–8088. [Google Scholar] [CrossRef]
  33. Querol, X.; Alastuey, A.; Reche, C.; Orio, A.; Pallares, M.; Reina, F.; Dieguez, J.; Mantilla, E.; Escudero, M.; Alonso, L.; et al. On the origin of the highest ozone episodes in Spain. Sci. Total Environ. 2016, 572, 379–389. [Google Scholar] [CrossRef]
  34. EEA—European Environment Agency. Air quality in Europe—2019 Report. EEA Report No 10/2019. 2019. Available online: https://www.eea.europa.eu/publications/air-quality-in-europe-2019 (accessed on 30 October 2020).
  35. Jahn, S.; Hertig, E. Modeling and projecting health-relevant combined ozone and temperature events in present and future Central European climate. Air Qual. Atmos. Health 2020. [Google Scholar] [CrossRef]
  36. Karlsson, P.-E.; Klingberg, J.; Engardt, M.; Andersson, C.; Langner, J.; Karlsson, G.P.; Pleijel, H. Past, present and future concentrations of ground-level ozone and potential impacts on ecosystems and human health in northern Europe. Sci. Total Environ. 2017, 576, 22–35. [Google Scholar] [CrossRef]
  37. Hendriks, C.; Forsell, N.; Kiesewetter, G.; Schaap, M.; Schoepp, W. Ozone concentrations and damage for realistic future European climate and air quality scenarios. Atmos. Environ. 2016, 144, 208–219. [Google Scholar] [CrossRef]
  38. Watson, L.; Lacressonniere, G.; Gauss, M.; Engardt, M.; Andersson, C.; Josse, B.; Marécal, V.; Nyiri, A.; Sobolowski, S.; Siour, G.; et al. Impact of emissions and +2 °C climate change upon future ozone and nitrogen dioxide over Europe. Atmos. Environ. 2016, 142, 271–285. [Google Scholar] [CrossRef]
  39. Monteiro, A.; Sá, E.; Fernandes, A.P.; Gama, C.; Sorte, S.; Borrego, C.; Lopes, M.; Russo, M. How healthy will be the air quality in 2050? Air Qual. Atmos. Health 2017, 11, 353–362. [Google Scholar] [CrossRef] [Green Version]
  40. Pattenden, S.; Armstrong, B.; Milojevic, A.; Heal, M.R.; Chalabi, Z.; Doherty, R.; Barratt, B.; Kovats, R.S.; Wilkinson, P. Ozone, heat and mortality: Acute effects in 15 British conurbations. Occup. Environ. Med. 2010, 67, 699–707. [Google Scholar] [CrossRef]
  41. Katsouyanni, K.; Analytis, A. Investigating the Synergistic Effects Between Meteorological Variables and Air Pollutants: Results from the European PHEWE, EUROHEAT and CIRCE Projects. Epidemiology 2009, 20, S264. [Google Scholar] [CrossRef]
  42. Bayerisches Landesamt für Umwelt. Messwertarchiv. 2019. Available online: https://www.lfu.bayern.de/luft/immissionsmessungen/messwertarchiv/index.htm (accessed on 31 October 2019).
  43. Agência Portuguesa do Ambiente. 2020. Available online: https://apambiente.pt/ (accessed on 10 March 2020).
  44. Deutscher Wetterdienst. Climate Data Center. 2019. Available online: https://www.dwd.de/DE/klimaumwelt/cdc/cdc_node.html (accessed on 31 October 2019).
  45. Instituto Português do Mar e da Atmosfera. 2020. Available online: http://www.ipma.pt (accessed on 10 March 2020).
  46. Hersbach, H.; Dee, D. ERA5 Reanalysis is in Production. ECMWF Newsl. 2016, 147, 7. Available online: https://www.ecmwf.int/en/newsletter/147/news/era5-reanalysis-production (accessed on 10 March 2020).
  47. Bayerisches Landesamt für Statistik. 2020. Available online: https://www.statistikdaten.bayern.de/genesis/online/data?Menu=Willkommen (accessed on 10 January 2020).
  48. Instituto Nacional de Saúde Doutor Ricardo Jorge (INSA). 2020. Available online: http://www.insa.pt/ (accessed on 7 September 2020).
  49. Instituto Português de Estatistica (INE). 2020. Available online: www.ine.pt (accessed on 15 July 2020).
  50. Perkins, S.E.; Alexander, L.V. On the Measurement of Heat Waves. J. Clim. 2013, 26, 4500–4517. [Google Scholar] [CrossRef]
  51. World Meteorological Organization Commission for Climatology. Guidelines on the Definition and Monitoring of Extreme Weather and Climate Events. 2018. Available online: http://www.wmo.int/pages/prog/wcp/ccl/documents/GUIDELINESONTHEDEFINTIONANDMONITORINGOFEXTREMEWEATHERANDCLIMATEEVENTS_09032018.pdf (accessed on 10 January 2019).
  52. McCarthy, M.; Armstrong, L.; Armstrong, N. A new heatwave definition for the UK. Weather 2019, 74, 382–387. [Google Scholar] [CrossRef]
  53. Alexander, L.; Herold, N. ClimPACT2. Indices and Software. 2016. Available online: https://epic.awi.de/id/eprint/49274/1/ClimPACTv2_manual.pdf (accessed on 30 January 2020).
  54. Ramos, A.M.; Cortesi, N.; Trigo, R.M. Circulation weather types and spatial variability of daily precipitation in the Iberian Peninsula. Front. Earth Sci. 2014, 2. [Google Scholar] [CrossRef] [Green Version]
  55. Jenkinson, A.F.; Collison, F.P. An Initial Climatology of Gales over the North Sea; Synoptic Climatology Branch Memorandum No. 62; Meteorological Office: Bracknell, UK, 1977.
  56. Jones, P.; Harpham, C.; Briffa, K.R. Lamb weather types derived from reanalysis products. Int. J. Clim. 2012, 33, 1129–1139. [Google Scholar] [CrossRef]
  57. Gosling, S.N.; McGregor, G.; Páldy, A. Climate change and heat-related mortality in six cities Part 1: Model construction and validation. Int. J. Biometeorol. 2007, 51, 525–540. [Google Scholar] [CrossRef]
  58. Russo, S.; Dosio, A.; Graversen, R.G.; Sillmann, J.; Carrão, H.; Dunbar, M.B.; Singleton, A.; Montagna, P.; Barbosa, P.; Vogt, J.V. Magnitude of extreme heat waves in present climate and their projection in a warming world. J. Geophys. Res. Atmos. 2014, 119, 12500–12512. [Google Scholar] [CrossRef] [Green Version]
  59. Trigo, R.M.; Ramos, A.M.; Nogueira, P.J.; Santos, F.D.; Garcia-Herrera, R.; Gouveia, C.; Santo, F.E. Evaluating the impact of extreme temperature based indices in the 2003 heatwave excessive mortality in Portugal. Environ. Sci. Policy 2009, 12, 844–854. [Google Scholar] [CrossRef]
  60. Leite, A.; Santos, A.J.; Silva, S.; Nunes, B.; Mexia, R.; Rodrigues, A.P. Assessing the use and understanding of the Portuguese heat–health warning system (ÍCARO). J. Public Health 2020, 42, 395–402. [Google Scholar] [CrossRef] [PubMed]
  61. Matzarakis, A.; Laschewski, G.; Muthers, S. The Heat Health Warning System in Germany—Application and Warnings for 2005 to 2019. Atmosphere 2020, 11, 170. [Google Scholar] [CrossRef] [Green Version]
  62. IPCC. Managing the Risks of Extreme Events and Disasters to Advance Climate Change Adaptation; A Special Report of Working Groups I and II of the Intergovernmental Panel on Climate Change; Field, C.B., Barros, V., Stocker, T.F., Qin, D., Dokken, D.J., Ebi, K.L., Mastrandrea, M.D., Mach, K.J., Plattner, G.-K., Allen, S.K., et al., Eds.; Cambridge University Press: Cambridge, UK; New York, NY, USA, 2012; 582p. [Google Scholar]
Figure 1. Location of the ozone stations used in this study. Left: Portugal, right: Bavaria, Germany.
Atmosphere 11 01271 g001
Figure 2. The total number of waves (left) and the total number of wave days (right) across the 15 stations of Bavaria in the period 2003–2017. EO3F all (EHF all): All ozone (heat) waves according to the EO3F (EHF) definition, EO3F with EHF: Compound ozone-heat waves, EO3F (EHF) without EHF (EO3F): Single ozone (heat) waves without heat (ozone) wave conditions, O3max90 all (Tmax90 all): All ozone (heat) waves according to the O3max90 (Tmax90) definition, O3max90 with Tmax90: Compound ozone-heat waves, O3max90 (Tmax90) without Tmax90 (O3max90): single ozone (heat) waves without heat (ozone) wave conditions, O3min90 all (Tmin90 all): All ozone (heat) waves according to the O3min90 (Tmin90) definition. For ease of view, colors reflect the variables, i.e., blue: Ozone; red: Temperature; purple: Ozone and temperature.
Atmosphere 11 01271 g002
Figure 3. Total number of waves (left) and total number of wave days (right) across the 14 stations of Portugal in the period 2003–2017. Wave type abbreviations and colour coding as in Figure 2.
Atmosphere 11 01271 g003
Figure 4. Weather types (mean sea level pressure in hPa) relevant for ozone and heat waves in Bavaria. U: “Unclassified” weather type (mean relative frequency across all wave types: 27.6%) A: Anticyclonic (17.5%), C: Cyclonic (7.3%), E: East (4.4%), SE: Southeast (4.3%), S: South (3.9%).
Atmosphere 11 01271 g004
Figure 5. Weather types (mean sea level pressure in hPa) relevant for ozone and heat waves in Portugal. E: East (mean relative frequency across all wave types: 24.4%), NE: Northeast (15.2%), U: “unclassified” weather type (15%), C: Cyclonic (7.8%), CE: Cyclonic East (6.7%), A: Anticyclonic (5.7%).
Atmosphere 11 01271 g005
Figure 6. Daily crude mortality rates (per 100,000 inhabitants) as mean over the months April to September 2003–2017 for each of the 15 cities/ counties of Bavaria (left box) and 14 municipalities of Portugal, respectively (right box).
Atmosphere 11 01271 g006
Table 1. Total number of wave days (n_wave days), number of excess deaths per 100,000 inhabitants (n_excess deaths), excess deaths per wave day (excess deaths/day) in the time period April–September 2003–2017, and mortality displacement in days for Bavaria and Portugal for each wave type. EO3F all (EHF all): All ozone (heat) waves according to the EO3F (EHF) definition, EO3F with EHF: Compound ozone-heat waves, EO3F (EHF) without EHF (EO3F): Single ozone (heat) waves without heat (ozone) wave conditions, O3max90 all (Tmax90 all): All ozone (heat) waves according to the O3max90 (Tmax90) definition, O3max90 with Tmax90: Compound ozone-heat waves, O3max90 (Tmax90) without Tmax90 (O3max90): Single ozone (heat) waves without heat (ozone) wave conditions, O3min90 all (Tmin90 all): All ozone (heat) waves according to the O3min90 (Tmin90) definition.
EO3F AllEHF AllEO3F with EHFEO3F without EHFEHF without EO3FO3max90 AllTmax90 AllO3max90 with Tmax90O3max90 without Tmax90Tmax90 without O3max90O3min90 AllTmin90 All
Bavaria
n_wave days339360135235296554475249350315446641
n_excess deaths397461239227252668613420320264279468
excess deaths/day1.171.281.770.960.851.211.291.690.910.840.630.73
mortality displacement455555447575
Portugal
n_wave days32427559259258554387142449344419377
n_excess deaths13829679108229264378197182206120353
excess deaths/day0.431.081.330.420.890.480.981.390.400.600.290.94
mortality displacement643846347495
Publisher’s Note: MDPI stays neutral with regard to jurisdictional claims in published maps and institutional affiliations.