Article

Association between Prevailing Circulation Patterns and Coarse Particles in Portugal

1
Instituto Dom Luiz (IDL), Faculdade de Ciências, Universidade de Lisboa, 1749-016 Lisboa, Portugal
2
Instituto do Mar e da Atmosfera (IPMA), Rua C ao Aeroporto Humberto Delgado, 1749-077 Lisboa, Portugal
3
Centro de Recursos Naturais e Ambiente, Departamento de Engenharia Civil, Arquitectura e Georrecursos, Instituto Superior Técnico, Universidade de Lisboa, 1749-016 Lisboa, Portugal
*
Author to whom correspondence should be addressed.
Atmosphere 2021, 12(1), 85; https://doi.org/10.3390/atmos12010085
Submission received: 23 November 2020 / Revised: 31 December 2020 / Accepted: 3 January 2021 / Published: 8 January 2021
(This article belongs to the Special Issue Extreme Climate Events and Air Quality)

Abstract

:
Air pollution is one of the major environmental concerns today, with high socio-economic and public health impacts, which are expected to worsen in the future due to anthropogenic warming. Among the toxic agents present in the atmosphere, coarse particles (PM10 and PM2.5) are some of the most harmful for human health and the environment. Therefore, the study of these particles and their association with meteorological constraining factors is of utmost importance. The aim of this study is to analyze the circulation weather types (CWT) affecting PM10 and PM2.5 concentrations measured at background monitoring stations in Portugal between 2006 and 2018. PM10 and PM2.5 were analyzed in terms of their intra-annual and inter-annual variability, their relations with CWT and the characteristics of two major extreme events over Portugal. The analysis of the extreme events relied on both background stations and through the near-real time data from Copernicus Atmosphere Monitoring Service (CAMS) outputs. The inter-annual assessment showed a decrease in concentrations over the studied years, mainly for PM10. Intra-annual assessment pointed to higher concentrations during winter months. Higher PM concentrations were mostly associated with CWTs with easterly or southerly components, characterized by low frequency of rainfall and advection of dry air masses. The two analyzed extreme events, associated with mega wildfires (15–17 October 2017) and dust intrusion (1–10 August 2018) were analyzed in more detail. Prominent southerly and easterly circulations were observed during the onset and peak of the events, which then later decayed due to the change to maritime flows (westerly and northerly circulation types) which dispersed the particles.

1. Introduction

The exponential growth of the population, technology and urban expansion that took place since the industrial revolution has resulted in an amplification of the concentration of certain toxic agents in the atmosphere [1]. The presence of toxic agents contributes to the degradation of air quality (AQ), setting off the necessary conditions for urban atmospheres to become problematic at socio-economic and public health levels [2,3], and become particularly harmful to individuals of sensitive groups [4,5,6]. According to the World Health Organization (WHO), about 6.5 million deaths per year result from exposure to air pollution, which is expected to get worse as anthropogenic influence on air quality can lead to pollution becoming the prime cause of death in the 21st century, limiting the quality of life [7]. At the European level, the European Environment Agency [8] estimated that more than 400,000 early deaths occurred in the European Union (EU) per year due to air pollution. This has also been mentioned in several studies which analyzed the relationship between pollutants and hospital admissions and mortality (e.g., [9,10,11,12,13,14]), focusing on different pollutants and areas of influence. This obviously imposes a high cost on society in terms of health and socio-economic losses. Moreover, in about 30 years, outdoor air pollution is expected to become one of the leading environmental causes of mortality, ahead of dirty water and lack of sanitation [2]. Therefore, exposure to air pollutants is currently a key environment-related health concern [3].
Among the toxic agents present in the atmosphere, particulate matter (PM) is one of the most harmful [15], particularly those with less than 10, 2.5 or 1 micrometers (e.g., PM10 and PM2.5, PM1). PM has high spatial and temporal variability [16], being influenced by several factors, such as local topography and emissions [17]. However, it is also extremely sensitive to meteorological conditions [18,19,20], namely to wind direction and speed, relative humidity, precipitation, sea level pressure, temperature, cloud cover, dew point temperature and the boundary layer height [18,19,20,21]. Apart from the instantaneous influence of meteorological conditions (as measured by a panoply of meteorological variables), some studies have shown that there is an association between the variability of pollutants in the atmosphere and the inter-annual variation of atmospheric circulation patterns (circulation weather types, CWT) [18,22,23,24]. In particular, for the Iberian Peninsula, several studies were carried out, analyzing the relationships between various pollutants and atmospheric circulation patterns (e.g., [23,25,26]), or analyzing dust intrusions and their contributions to mortality and health impacts (e.g., [13,14,24]. According to these latest publications, there is a clear link between the increase of PM10 and PM2.5 concentrations and the increase in mortality and hospital admissions. With the increase of desertification over arid and semi-arid areas in the vicinity of the Iberian Peninsula, an increase in extreme episodes of dust intrusion originating in North Africa is expected [27]. Moreover, and adding to this the long-range transport of dust [14,24], southwestern European countries endure a supplementary burden from the pollutants emissions resulting from fires [28,29]. Biomass burning favors the exceedance of normative AQ thresholds [30], contributing to a general degradation of AQ, which is expected to worsen due to a projected increase in wildfire frequency in certain areas [31,32,33], with wildfire smoke representing a significant health risk [30], as expected due to climate change [34].
Despite all the mitigation strategies, wildfire frequency in general, and of very large fires (known as mega-fires, i.e., fires that burn more than 10,000 ha (100 km2) in particular) is increasing over southern Europe, generating high human, economic and environmental impacts, due to a dangerous combination of climate change, fuel accumulation and increasing human pressure on ignitions [35]. These very large fires are generally characterized by extreme behavior, being a significant atmospheric source of particulate matter and other pollutants (e.g., carbon monoxide and dioxide, nitrogen oxides, sulfur dioxides and volatile organic compounds) contained in the large smoke plumes released, which have an important impact at local and regional levels [36]. Generally, PM dispersion is confined to the proximity of the perimeters of fires due to their relatively short atmospheric lifetimes, from days to weeks. However, when hot and very dry meteorological conditions are present, PM particles can be transported over thousands of kilometers before being removed from the atmosphere by deposition processes, due to large injection heights emissions, impacting distant populations [36,37,38]. Nevertheless, emissions information from wildfires in Europe, and particularly in Portugal, is extremely scarce [39], with only a few reports on trace gases and PM emissions from wildfires [36,39,40,41,42,43,44]. Therefore, wildfire emissions’ assessments are mandatory to source apportionment to minimize their environmental impacts and, consequently, human health impacts.
This work aims to study the association between atmospheric circulation patterns and the occurrence of PM pollution episodes, namely coarse particulate matter concentrations (PM10 and PM2.5) registered by local monitoring stations from the Portuguese air quality monitoring network [45] and through the near-real time data from Copernicus Atmosphere Monitoring Service (CAMS, [46]). Air quality will be analyzed in terms of (i) PM intra-annual and inter-annual variability; (ii) PM relations with prevailing atmospheric circulation patterns; (iii) characteristics of two major extreme PM events, namely the mega fires of 15th of October 2017 and the extreme Saharan intrusion of August 2018 over Portugal. The analysis of the extreme events will rely on both background stations and through the near-real time data from Copernicus Atmosphere Monitoring Service CAMS-NRT outputs [46]. Most of the studies analyzing PM concentrations (with different purposes) rely solely on background monitoring stations’ data (e.g., [18,23,41]), which can be a caveat, as they can have missing values and are spatially scarce. This caveat is sometimes resolved by using air statistical models (e.g., [17,19]) or satellite data (e.g., [16]). The use of two different types of air quality datasets, combining the temporal advantage of background monitoring stations and the broader spatial information introduced by CAMS-NRT, constitutes a novelty, particularly for Portugal. Based on the proposed approach, we expect to highlight the importance of certain CWTs on the setting and dispersion of pollution events. Another aspect which constitutes a novelty is that it is the first time that PM2.5 is assessed using a circulation-to-environment approach in Portugal, to the best of our knowledge.

2. Data and Methods

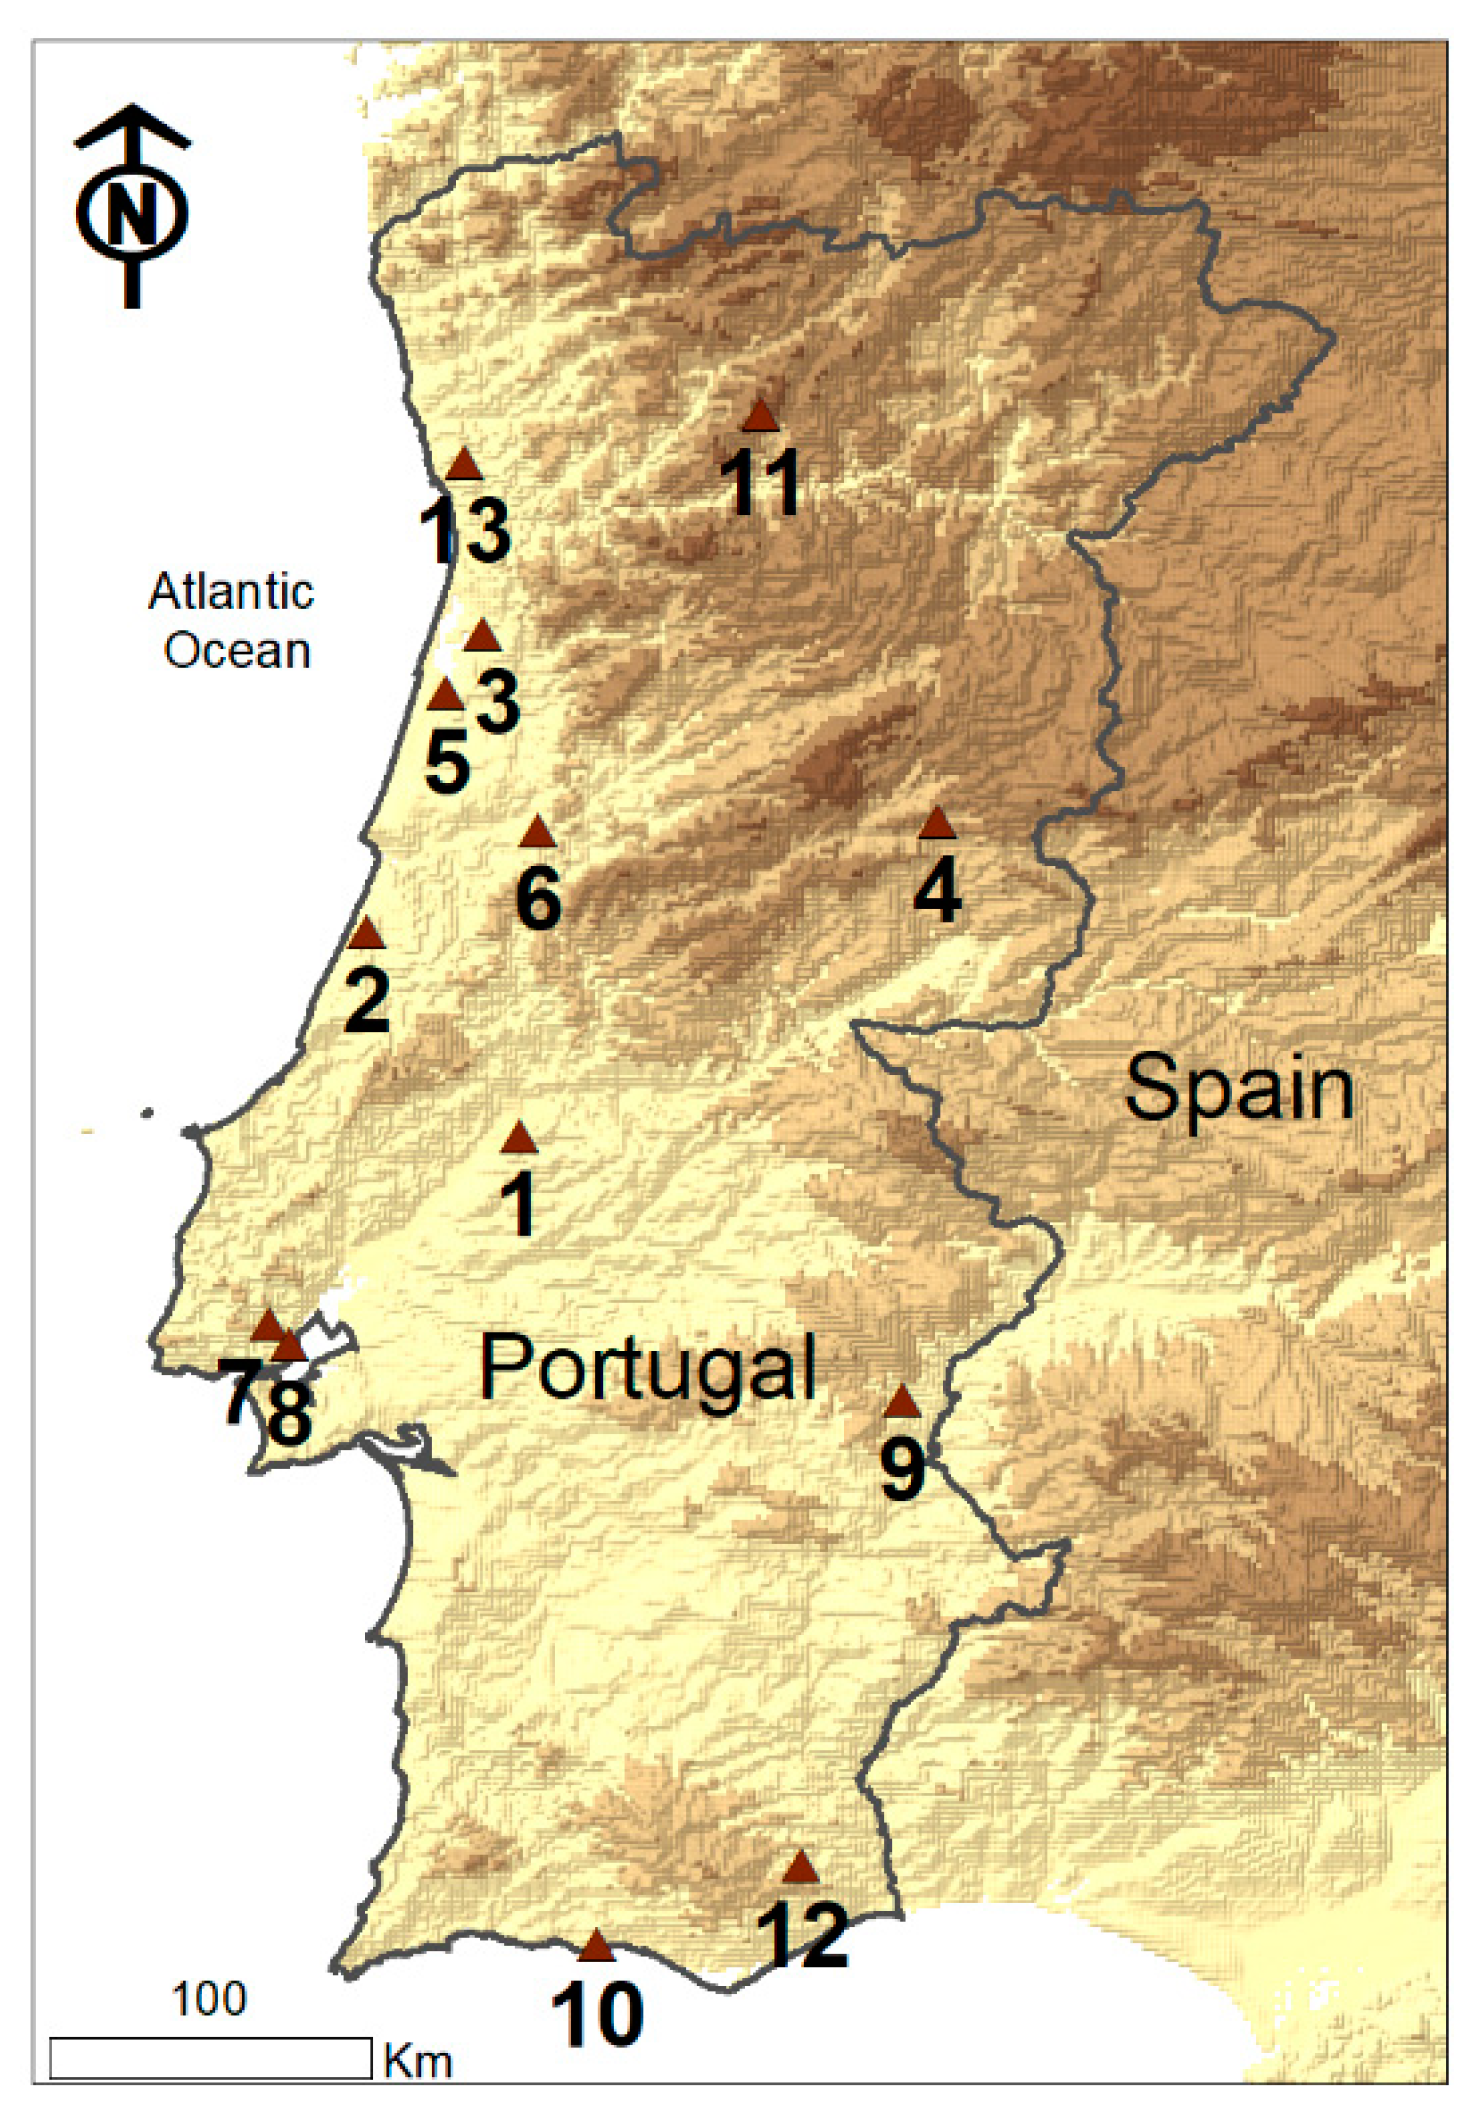
2.1. Air Quality Data

Hourly measurements of PM10 and PM2.5 were retrieved from the air quality monitoring stations of the Portuguese Environment Agency (Agência Portuguesa do Ambiente, APA [45] (Figure 1, Table 1). The hourly PM10 and PM2.5 datasets, covering 13 years of data, from 2006 to 2018, were then aggregated into daily mean concentrations. Only background stations were chosen, so correlations would be more clearly revealed and so that the confounding effect of local urban vehicular emissions would be limited [18]. Missing data were not included in the present analysis. All retrieved data were previously verified and validated by APA.

2.2. Circulation-to-Environment Approach

Daily PM concentrations were associated with synoptic CWT, which were identified based on daily mean sea level pressure (MSLP), obtained from the European Centre for Medium-Range Weather Forecasts (ECMWF) Era5 reanalysis [47], across the period 2004–2018, on a 0.25° latitude–longitude grid. The adopted approach followed the procedure by Trigo and DaCamara [48], initially proposed for the analysis of precipitation in the Iberia Peninsula, describing the regional atmospheric circulation based on a small set of circulation parameters [49]. This method allowed us to agglomerate multivariate information in a univariate form with attributed classes of performance [50]. This approach has already been successfully applied to several studies relating air quality and pollutants, both in Portugal [23] and Spain [14,24]. The CWTs were determined using the geostrophic wind approximation and adopting physical or geometrical parameters which follow Trigo and DaCamara [48]. All the indices were computed using MSLP values obtained for the 16 grid points centered over Portugal. A total of 26 CWTs were defined: 10 pure types (NE, E, SE, S, SW, W, NW, N, C and A; Figure 2), and 16 hybrid types (8 for each C or A hybrid). A hybrid CWT simultaneously has characteristics of two distinct patterns, one that reflects the direction (NE, E, SE, S, SW, W, NW, N) and the other the vorticity (Cyclonic, C; Anticyclonic, A). For simplification, it was considered that each of these hybrid types contributes 50% for their respective directional and vorticity pattern.
Additionally, composites of average MSLP and 500 hPa geopotential height (Z500) were computed for days characterized by PM observations above legal thresholds, and for the specific CWTs which are more prone to low AQ.

2.3. Extreme Events

Having obtained all CWTs patterns and time series for the selected study period, possible links with PM observations were evaluated through a circulation-to-environment approach. Special attention was given to two distinct events, one related to the occurrence of very large fires and the other to the intrusion of air masses from northern Africa. The choice of these two types of events is linked to the fact that both constitute two important sources of PM affecting Portugal [23,24,51].
The first event being analyzed occurred during the 2017 fire season in Portugal, which was one of the most severe of the last 20 years, with around half a million hectares of burnt area, representing more than 50% of the burnt area that year in southern European countries [52,53]. The most severe impacts occurred over the Portuguese central region, with the Pedrogão Grande fire in June and the widespread October mega-fires, with the latter exceeding all previous events in dimension, and both resulting in dramatic impact in terms of loss of lives [28,41,52,53].
The second event is particularly interesting as it constitutes a succession of extreme events that occurred in the summer of 2018. Early August 2018 presented a short-lived but record-breaking extreme heat episode in Portugal [51]. This was the result of the advection of an anomalously warm air mass, which originated over the Sahara region, and was transported under the influence of a strong subtropical ridge pattern. During this episode, almost 50% of surface stations broke their all-time temperature records in Portugal. The air mass responsible for this occurrence presented a very high concentration of Saharan dust, and was trapped for several days over the region. Furthermore, a large fire started in southern Portugal, which also contributed to the rise in pollution levels.
These events of extremely high PM concentrations might also have been related to increased health risk and mortality, besides the direct relevance of extreme heat exposure [41].
PM concentrations (PM10 and PM2.5) for both events were assessed, based on observations from local stations from the Portuguese monitoring network (Figure 1 and Table 1), and through the near-real time data from Copernicus Atmosphere Monitoring Service, a component of the European Earth Observation program Copernicus [46].
CAMS global near-real time (NRT) service provides daily analyses and forecasts of reactive trace gases, greenhouse gases and aerosol concentrations, for the European domain at significantly higher spatial resolution (0.1 degrees, approx. 10 km), based on the Integrated Forecast System (IFS) modelling system at ECMWF, using the available meteorological and atmospheric composition observations which are ingested in the ECMWF 4D-Var assimilation system [54].

3. Results

3.1. Air Quality Characterization

PM10 and PM2.5 data collected by the background monitoring stations (Figure 1) were analyzed in terms of their inter- and intra-annual variability. Figure 3 represents weekly, monthly and annual variations of PM10 and PM2.5 for the whole of mainland Portugal through a boxplot type representation. The boxplots allow us to observe the variation and variability of the values of each pollutant.
The annual average values of both PM10 and PM2.5 show their highest upper and median limits in the first years of the study period, with an apparent downward trend during the last decade, as expected. The monthly mean values of PM10 present medians higher than those of PM2.5, as well as a greater variability. The annual cycle is more evident in the case of PM10 than in PM2.5. In terms of weekly variations, it is shown that, for both PM10 and PM2.5, the medians tend to present lower values during Sundays, remaining relatively constant during the remaining days of the week. This may be due to a lower level of car traffic during the weekend.

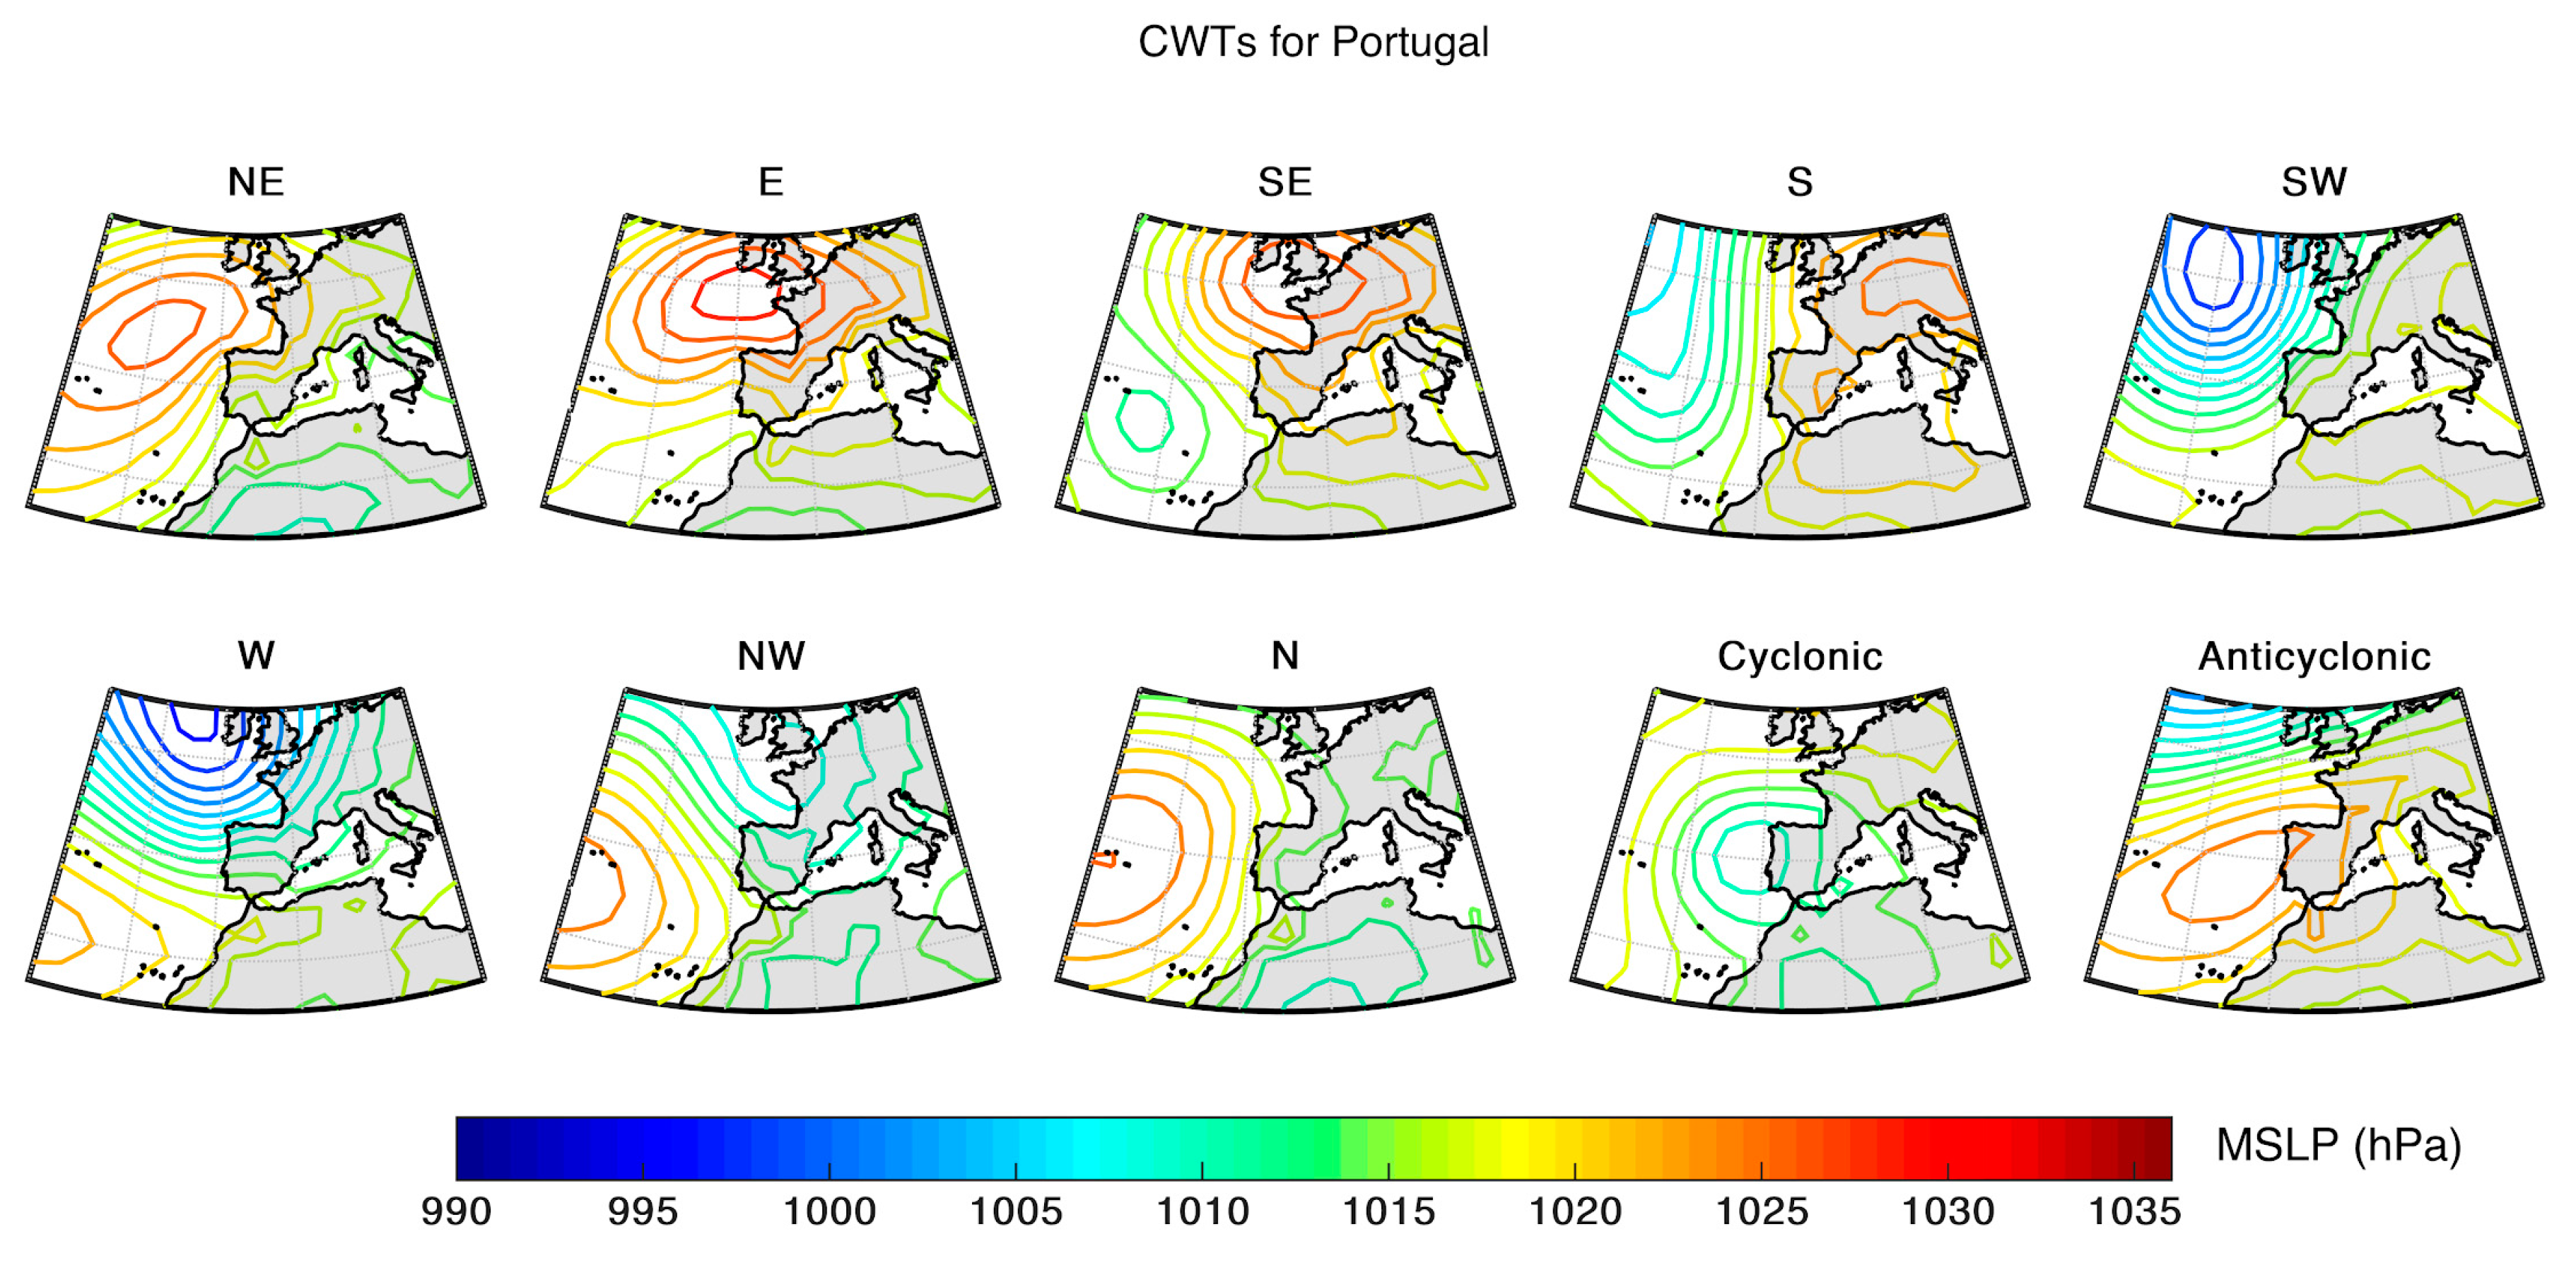
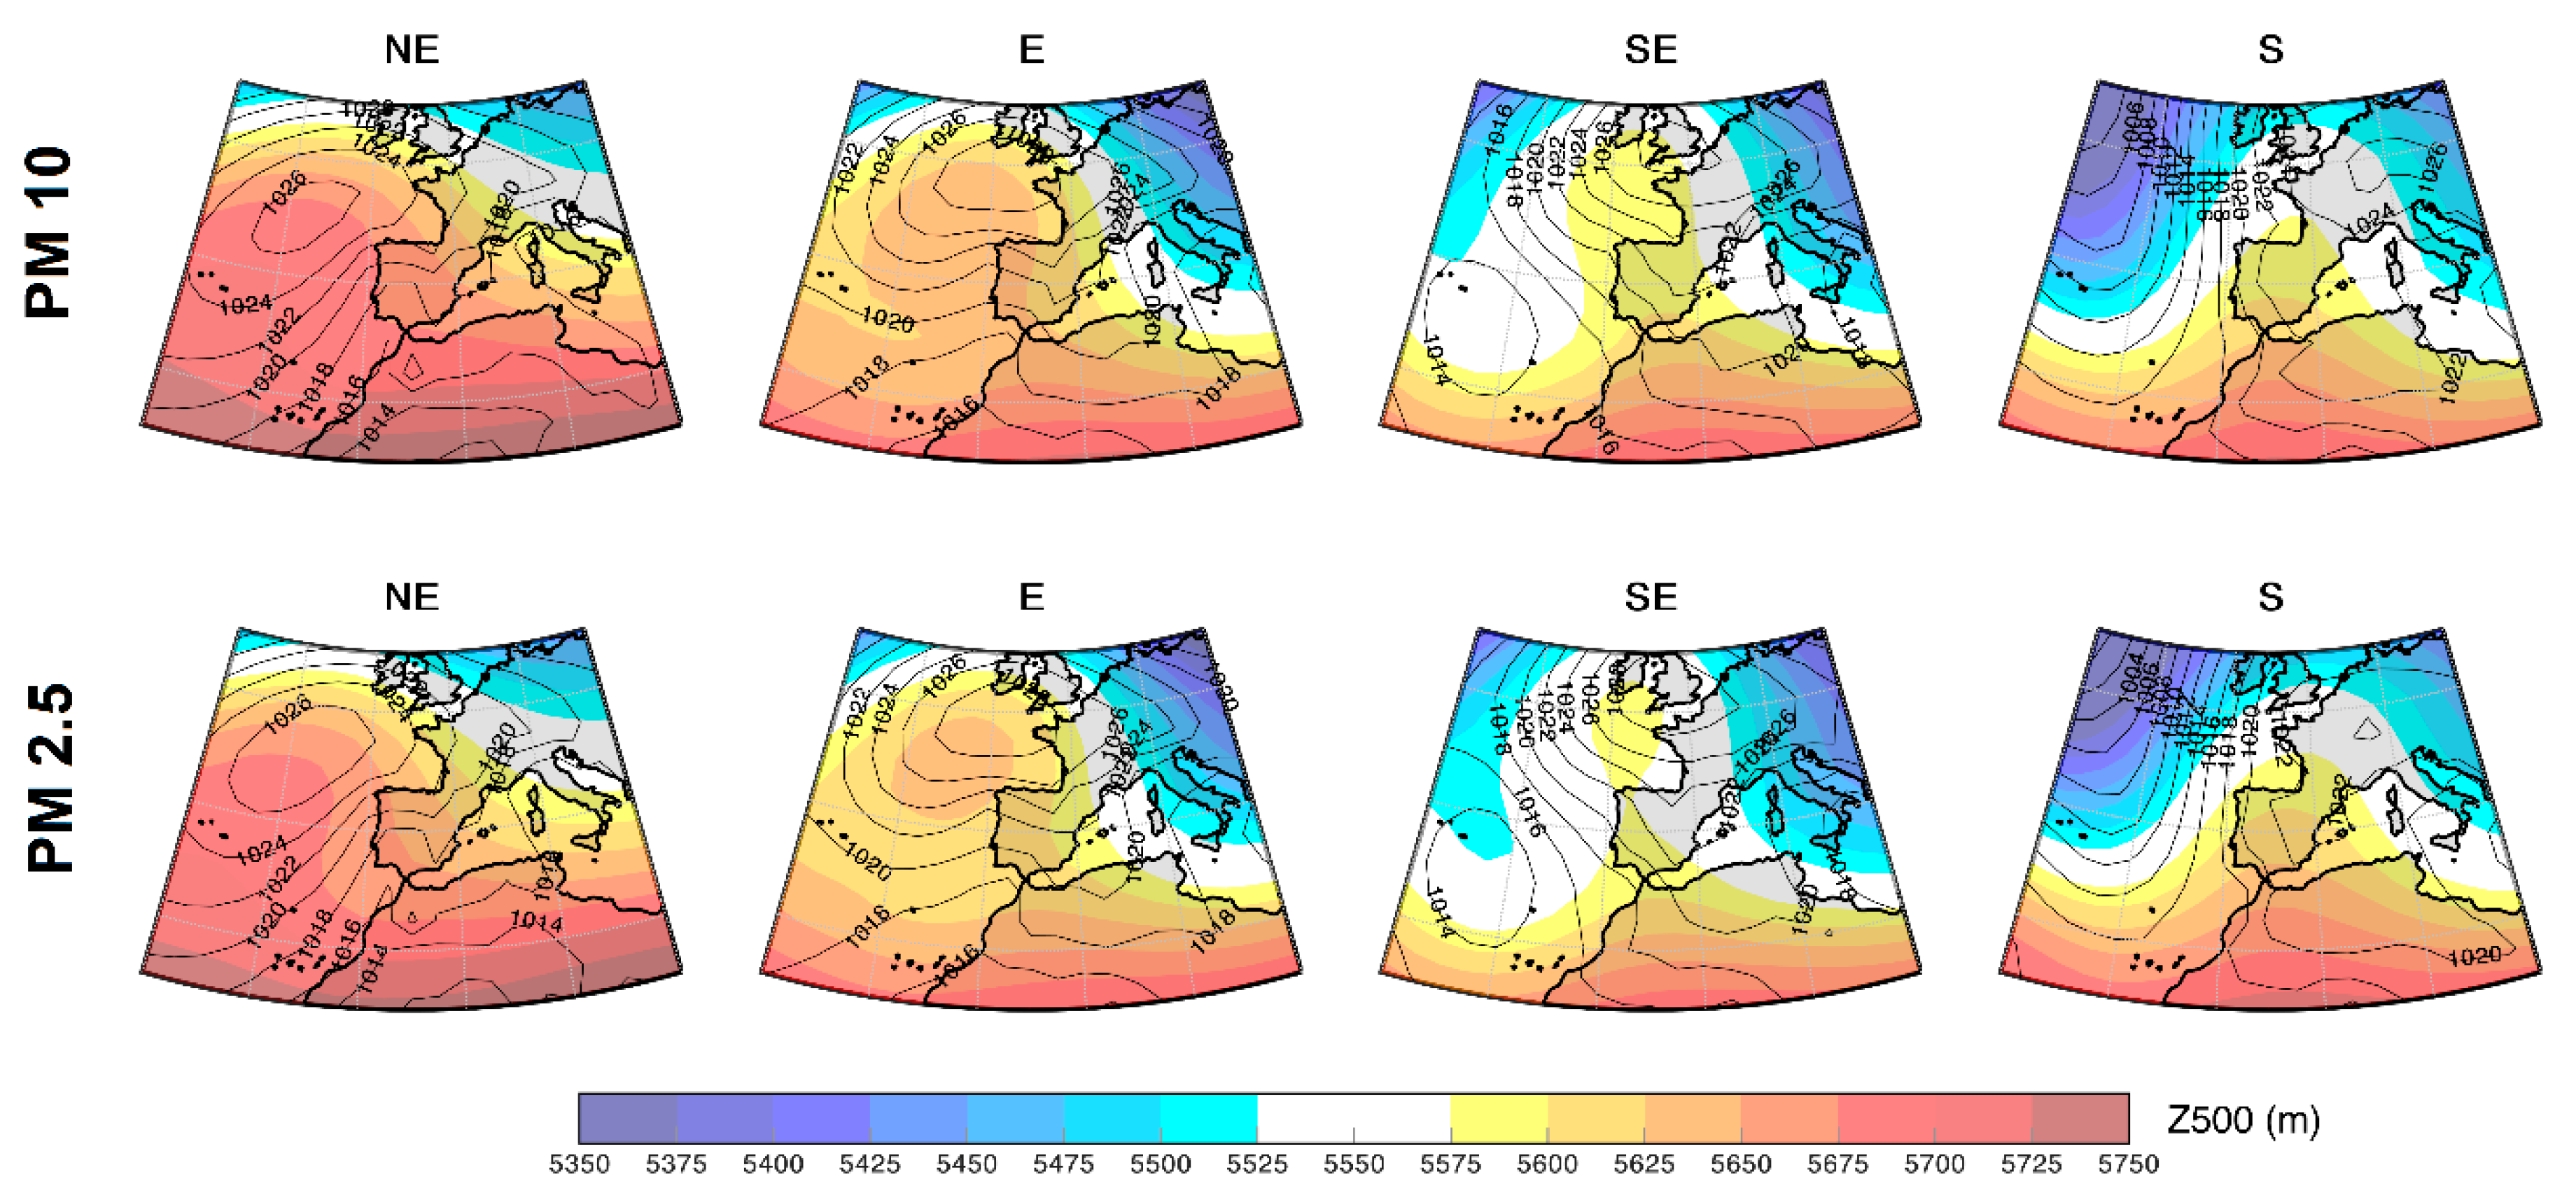
3.2. CWT Characterization

Prevailing circulation patterns were determined and associated with daily PM10 and PM2.5 values. The relative frequency of each CWT over the period 2006–2018 is shown in Table 2. The anticyclonic (A) type is the most frequent circulation pattern throughout the year, except for summer, which is also highly influenced by the northeast (NE) and north (N) circulation types. The anticyclonic (A) type’s predominance is mainly due to the migration of the Azores anticyclone towards the peninsula [55].
The meridional circulation types north (N) and south (S) present opposite behavior: while S is almost insignificant, especially during spring and summer, N is a dominant CWT, particularly during the referred seasons. The directional CWTs with a significant southern to southeasterly component (S, SE) are the least frequent of all the weather types throughout the year. This is also true in the case of SW in the summer, although the SW regimes increase during winter and early spring. Throughout the year, the relative frequency of cyclonic (C) situations does not change significantly, reaching two relative peaks, one in the spring and the other in autumn.
Trigo and DaCamara [48] have shown that the precipitation regime in Portugal is controlled by the monthly frequency of a few CWTs, namely C, W and SW, these CWTs being responsible for the highest fraction of spring and autumn precipitation over Iberia [56]. Although the anticyclonic type (A) is the most frequent CWT affecting Portugal, it presents a low contribution to winter precipitation [48]. Conversely, several works have shown that a higher concentration of pollutants in the Iberian Peninsula is associated predominantly with synoptic circulation characterized by an easterly component and the advection of dry air masses [23,24]. Therefore, here we aim to assess how the most/less predominant CWTs are associated with the occurrence of air pollution events, particularly in the case of the previously less-analyzed PM2.5.

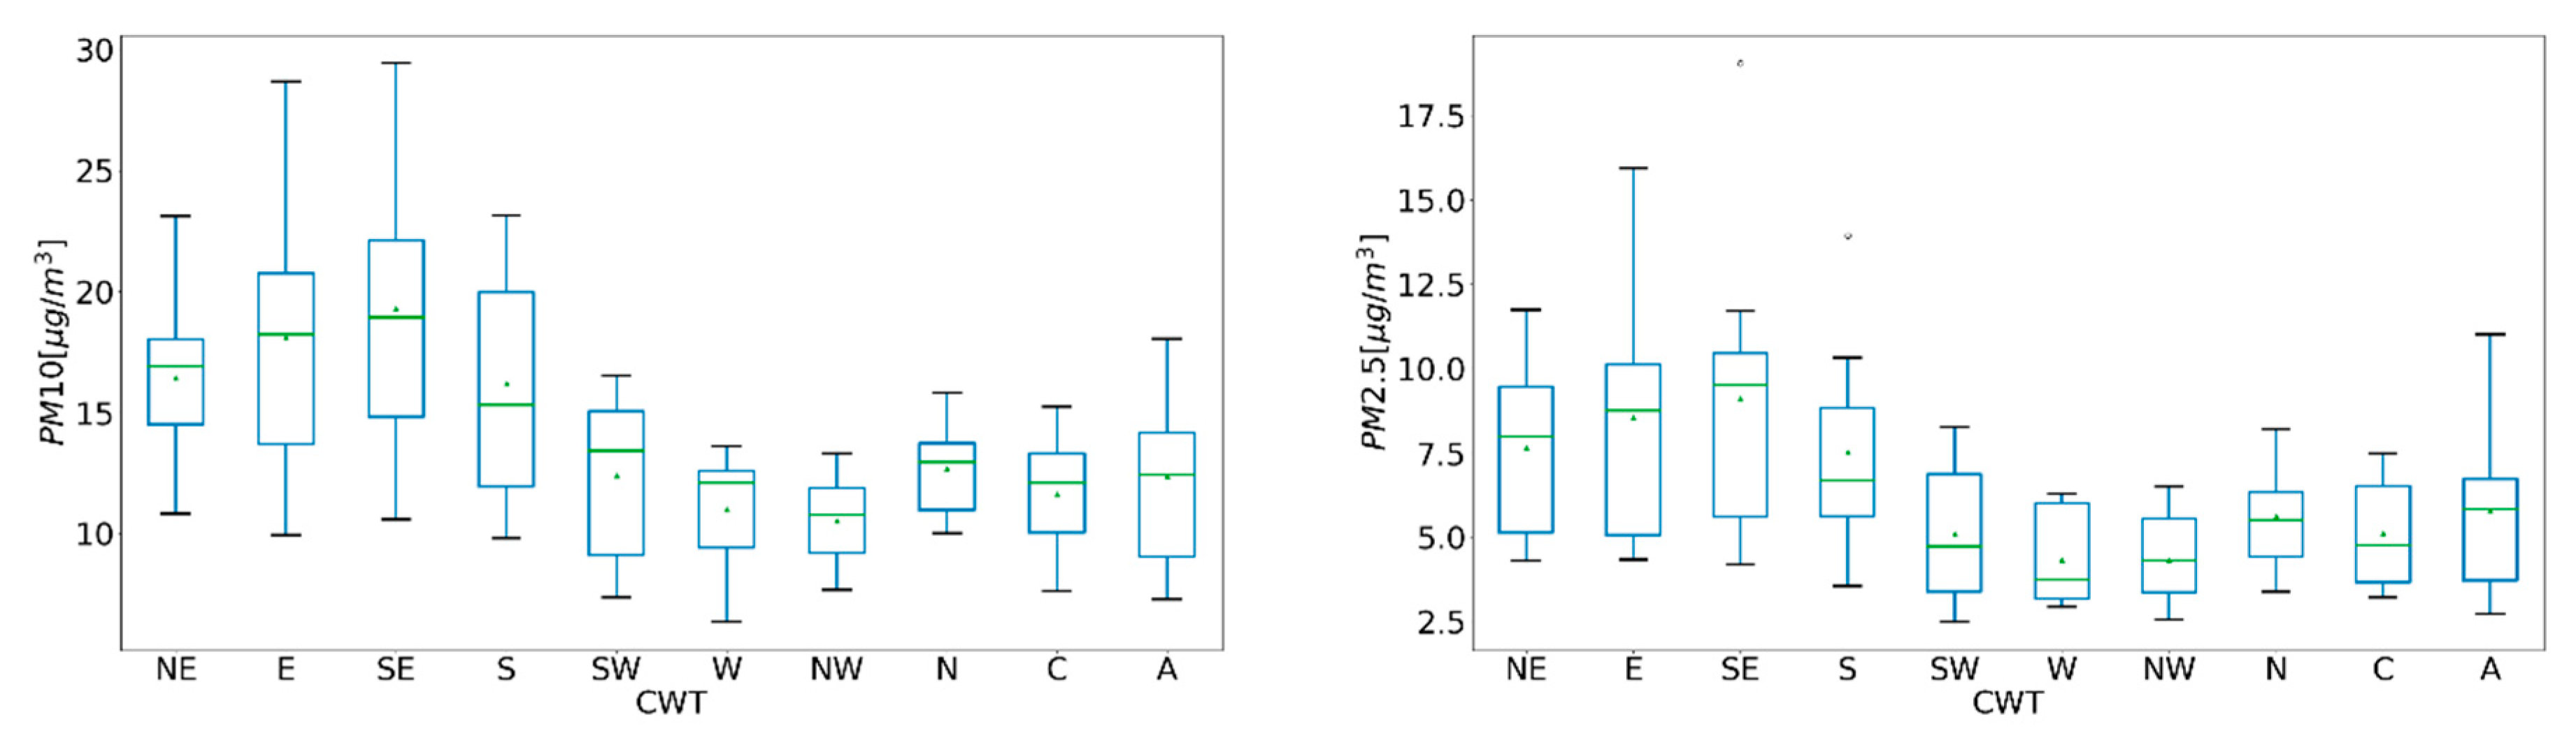
3.3. Association between CWT and Air Quality

After the identification of the prevailing CWT, their association with PM values at the daily scale was performed to identify links between circulation patterns and AQ variables. Figure 4 shows the boxplots representing the values and variability of the concentration of PM10 and PM2.5 for all stations and for each CWT. It is possible to see that, amongst the different patterns of directional atmospheric circulation, those that have an easterly and/or southerly component (NE, E, SE, S) tend to present higher associated values, compared to the remaining CWTs.
Composite maps for MSLP and Z500 were calculated for the CWTs that are most relevant to the occurrence of high values of each pollutant (Figure 5), in order to obtain a more in-depth understanding of the large-scale circulation and mechanisms behind the relationship between AQ and CWT. Days when PM10 and PM2.5 surpassed the legal threshold were considered [57].
As expected, the large-scale synoptic configuration for MSLP observed in the composites from Figure 5 does not differ significantly from the all-day composites presented in Figure 1, depicting surface pressure patterns that favor easterly and/or southerly advection towards continental Portugal. Moreover, there are no significant differences between the patterns observed for PM10 and PM2.5 episodes (neither are there differences between different seasons—not shown), stressing that transport mechanisms are essentially the same for the two pollutants (in fact, many PM10 and PM2.5 episodes are concurrent). These are surface flows which allow the transport of either: (i) remote dust particles, originating from northern Africa; (ii) a shorter transport of pollutants related to wildfires, originating within the Iberian Peninsula domain, and even inside Portugal. These processes will be further detailed in Section 3.4.
The typical large-scale patterns observed aloft are also depicted in Figure 5, revealing a common feature in all four composites: a ridge pattern extending from subtropical latitudes towards mid/high latitudes. This is more pronounced for the NE type, and much more modest for the S type. This is not surprising, as the previous pattern is more typical of warmer seasons (see Table 2), with a prominent anticyclone affecting Iberia, thus contributing to higher Z500. This is opposite to southerly flows, which are more frequent during winter. Nevertheless, these common ridge patterns which are observed throughout the year for the chosen CWTs are a typical fingerprint of Saharan intrusions, and of above-average temperatures in Portugal, which are the main drivers for the abovementioned particle transport mechanisms.

3.4. Extreme PM Events

Episodes of air pollution pose a serious problem to human health and to the environment [2,3,4,5,6], as air pollutants in the atmosphere may sometimes considerably exceed established limit values [57]. These episodes can be related to the presence of certain specific weather conditions, such as the presence of boundary layer inversions [58], regional and long-range transport [18,19,20,22,23,24,38] and also emissions from natural and anthropogenic sources [30,37,59]. Accordingly, it is vital to understand the underlying processes that lead to significant episodes of air pollution at local, regional and continental scales.
Here, two particularly extreme events which resulted in very high concentration values of PM10 and PM2.5 were evaluated, namely, the events which took place between 15th–17th of October, 2017, and 3rd–10th of August, 2018.

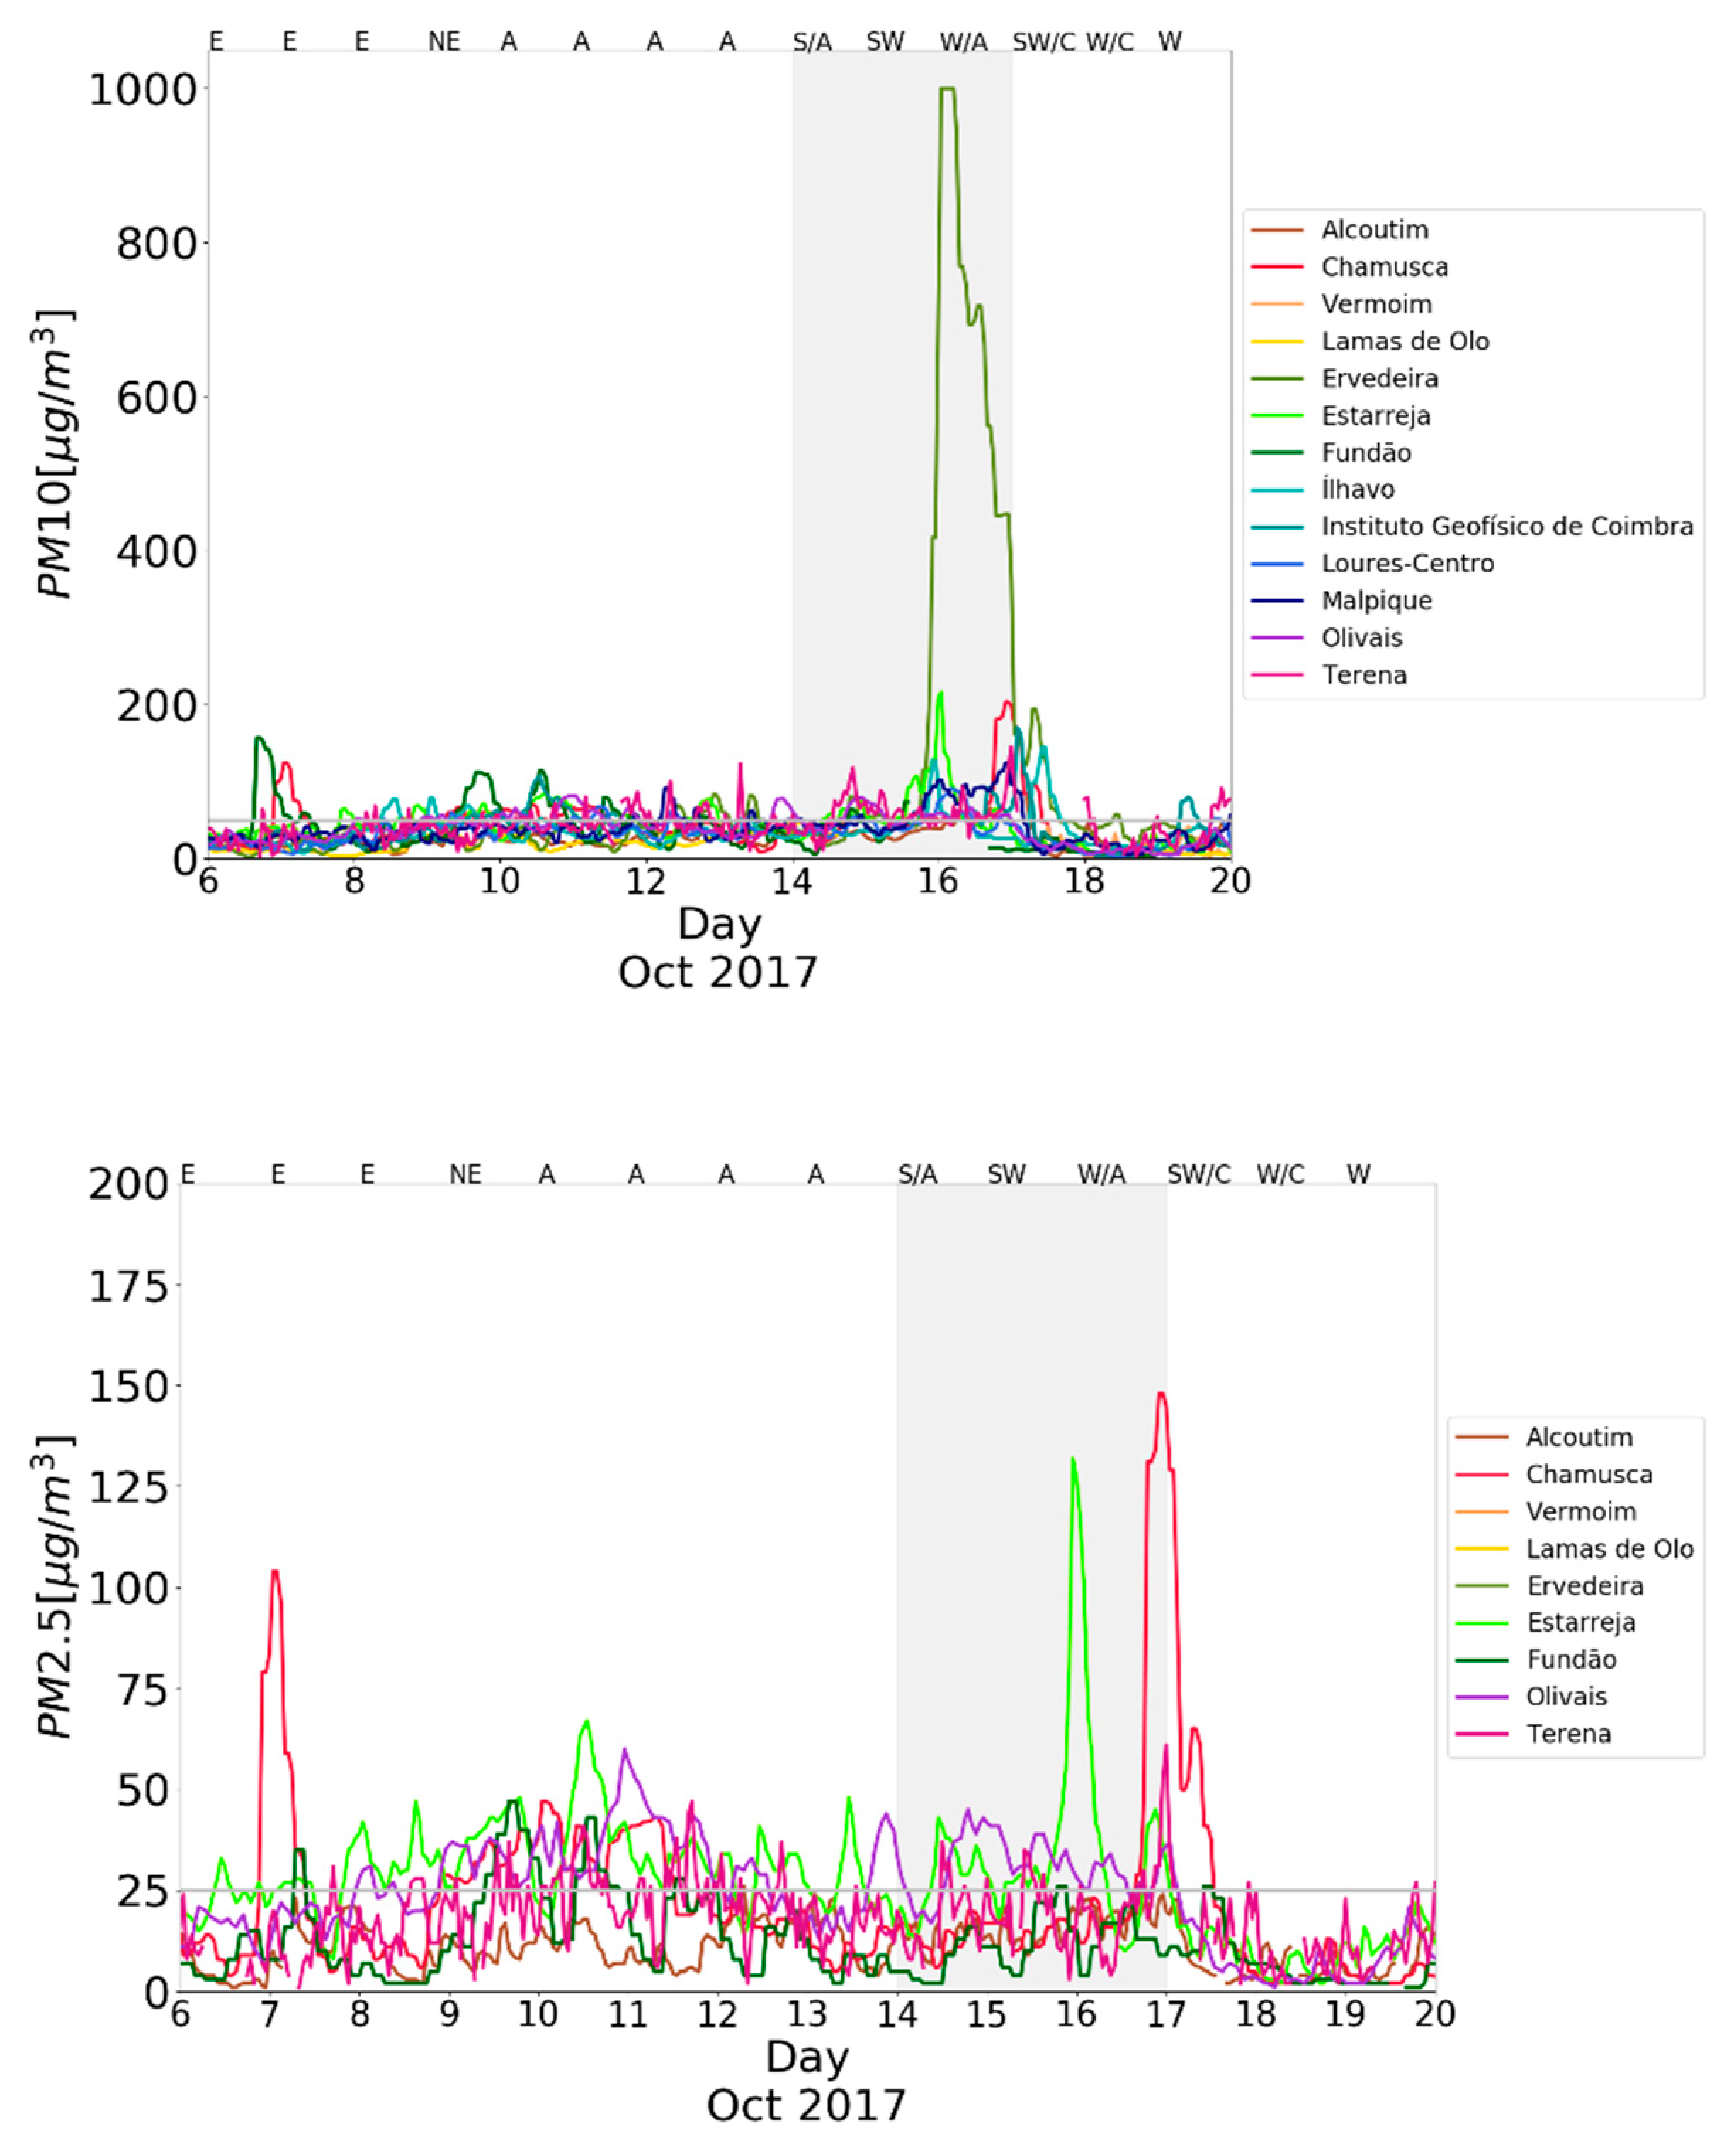
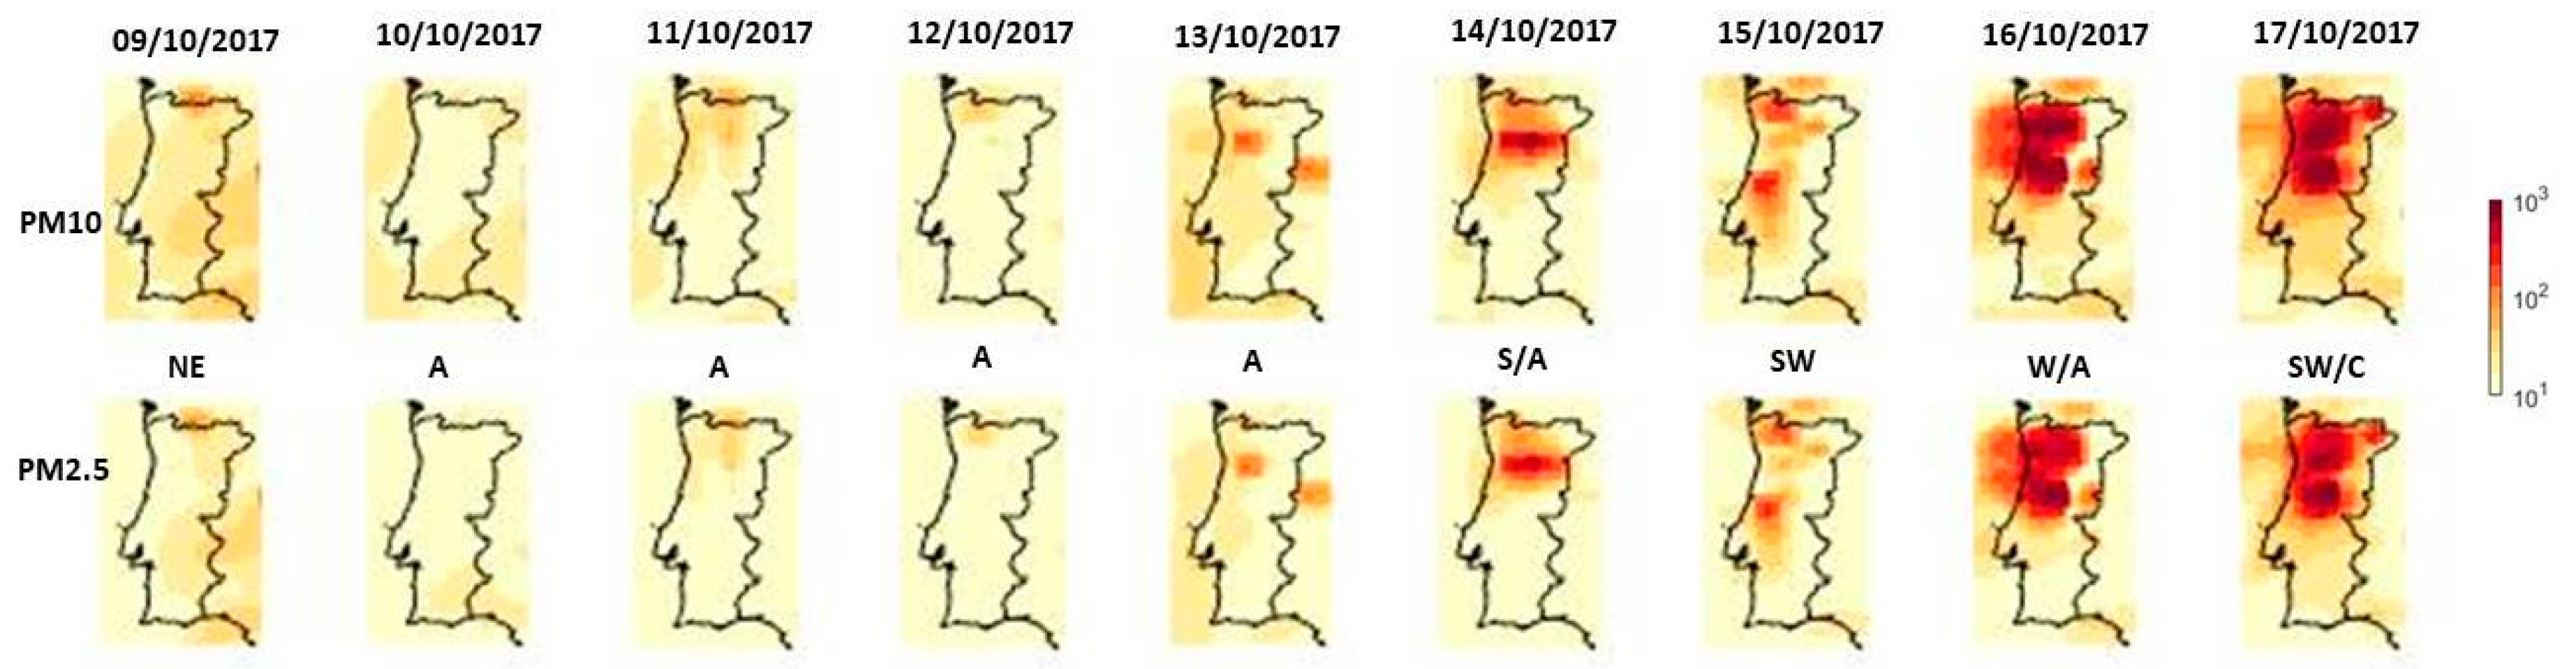
3.4.1. October 2017 Megafires

On 15 October 2017, thirty-eight large fires started in continental Portugal, with 6 mega fires and 10 large fires occurring in central Portugal; these represented 94% of the total burnt area [52,53,60], and resulted in extreme impacts in terms of human fatalities and infrastructures.
The passage of Hurricane Ophelia over Portuguese waters was a critical driving force of these fires’ occurrence, enabling the high wind speed from a southerly component related to the advection of a very warm and dry air mass that allowed the rapid fires’ spread. Additionally, the set of pyro-convective phenomena subsequently developed contributed to the uncontrollable nature of these fires during the afternoon of 15th October through to the night of 16th October. The energy released by these fires originated different episodes of pyro-convection. The occurrence of these pyro-convective events triggered the stronger wind gusts linked to the ongoing fires during that afternoon and night, contributing to strong downdrafts, with a northeastward propagation, and thus contributing to very significant smoke dispersion from the fire [36]. The occurrence of these phenomena was classified as the largest pyro-convective event so far registered in Europe and the world’s largest in 2017, with an average of 10 thousand ha (100 km2) burned per hour during approximately 13 consecutive hours [60], which induced the emission of a high concentration of pollutants [36].
PM concentrations emitted during this extreme event were assessed through the analysis of monitoring stations’ records (Figure 6) and CAMS-NRT data (Figure 7 and Figure 8) for the period comprising 6th–17th of October 2017. PM concentrations registered by the local monitoring stations reached maximum daily values which exceeded the 50 µg/m3 daily threshold for PM10 and 25 µg/m3 for PM2.5 [57], respectively. PM10 maximum daily values were registered in Ervedeira monitoring station, where the maximum value observed was up to 1000 µg/m3 on October 16th. On the other hand, PM2.5 maximum daily values were registered over Chamusca monitoring station, 150 µg/m3–125 µg/m3 on October 16th–17th; and over Estarreja monitoring station, 125 µg/m3 on October 16th, respectively.
The results from the monitoring stations are in accordance with the CAMS-NRT data, with the advantage of the latter providing a broader spatial information on the range of areas affected by the pollution event. It should also be highlighted that CAMS-NRT data show values much higher than those registered in the monitoring stations. The results from CAMS-NRT increased as expected during the duration of the event, with daily concentrations substantially exceeding the AQ established limit values, reaching values up to 5550 µg/m3 for PM10 and 4450 µg/m3 for PM2.5. The maximum PM observed values occurred on the 17th October, with daily PM10 concentrations ranging between 1110 µg/m3 and up to 5550 µg/m3; and daily PM2.5 concentrations ranging between 650 µg/m3 up to 4450 µg/m3 as can be seen in Figure 7. As expected, PM10 and PM2.5 present a very similar spatial distribution of the concentration values. What is particularly interesting during this event is the fact that, although reaching spectacularly high values, the concentrations diminished quickly (~1–2 days) to levels below the legal thresholds. This was in fact potentiated by a quick turning to a more westerly flow, as depicted by the CWTs, which thus contributed to dispersion and dissipation processes after the 17th October.

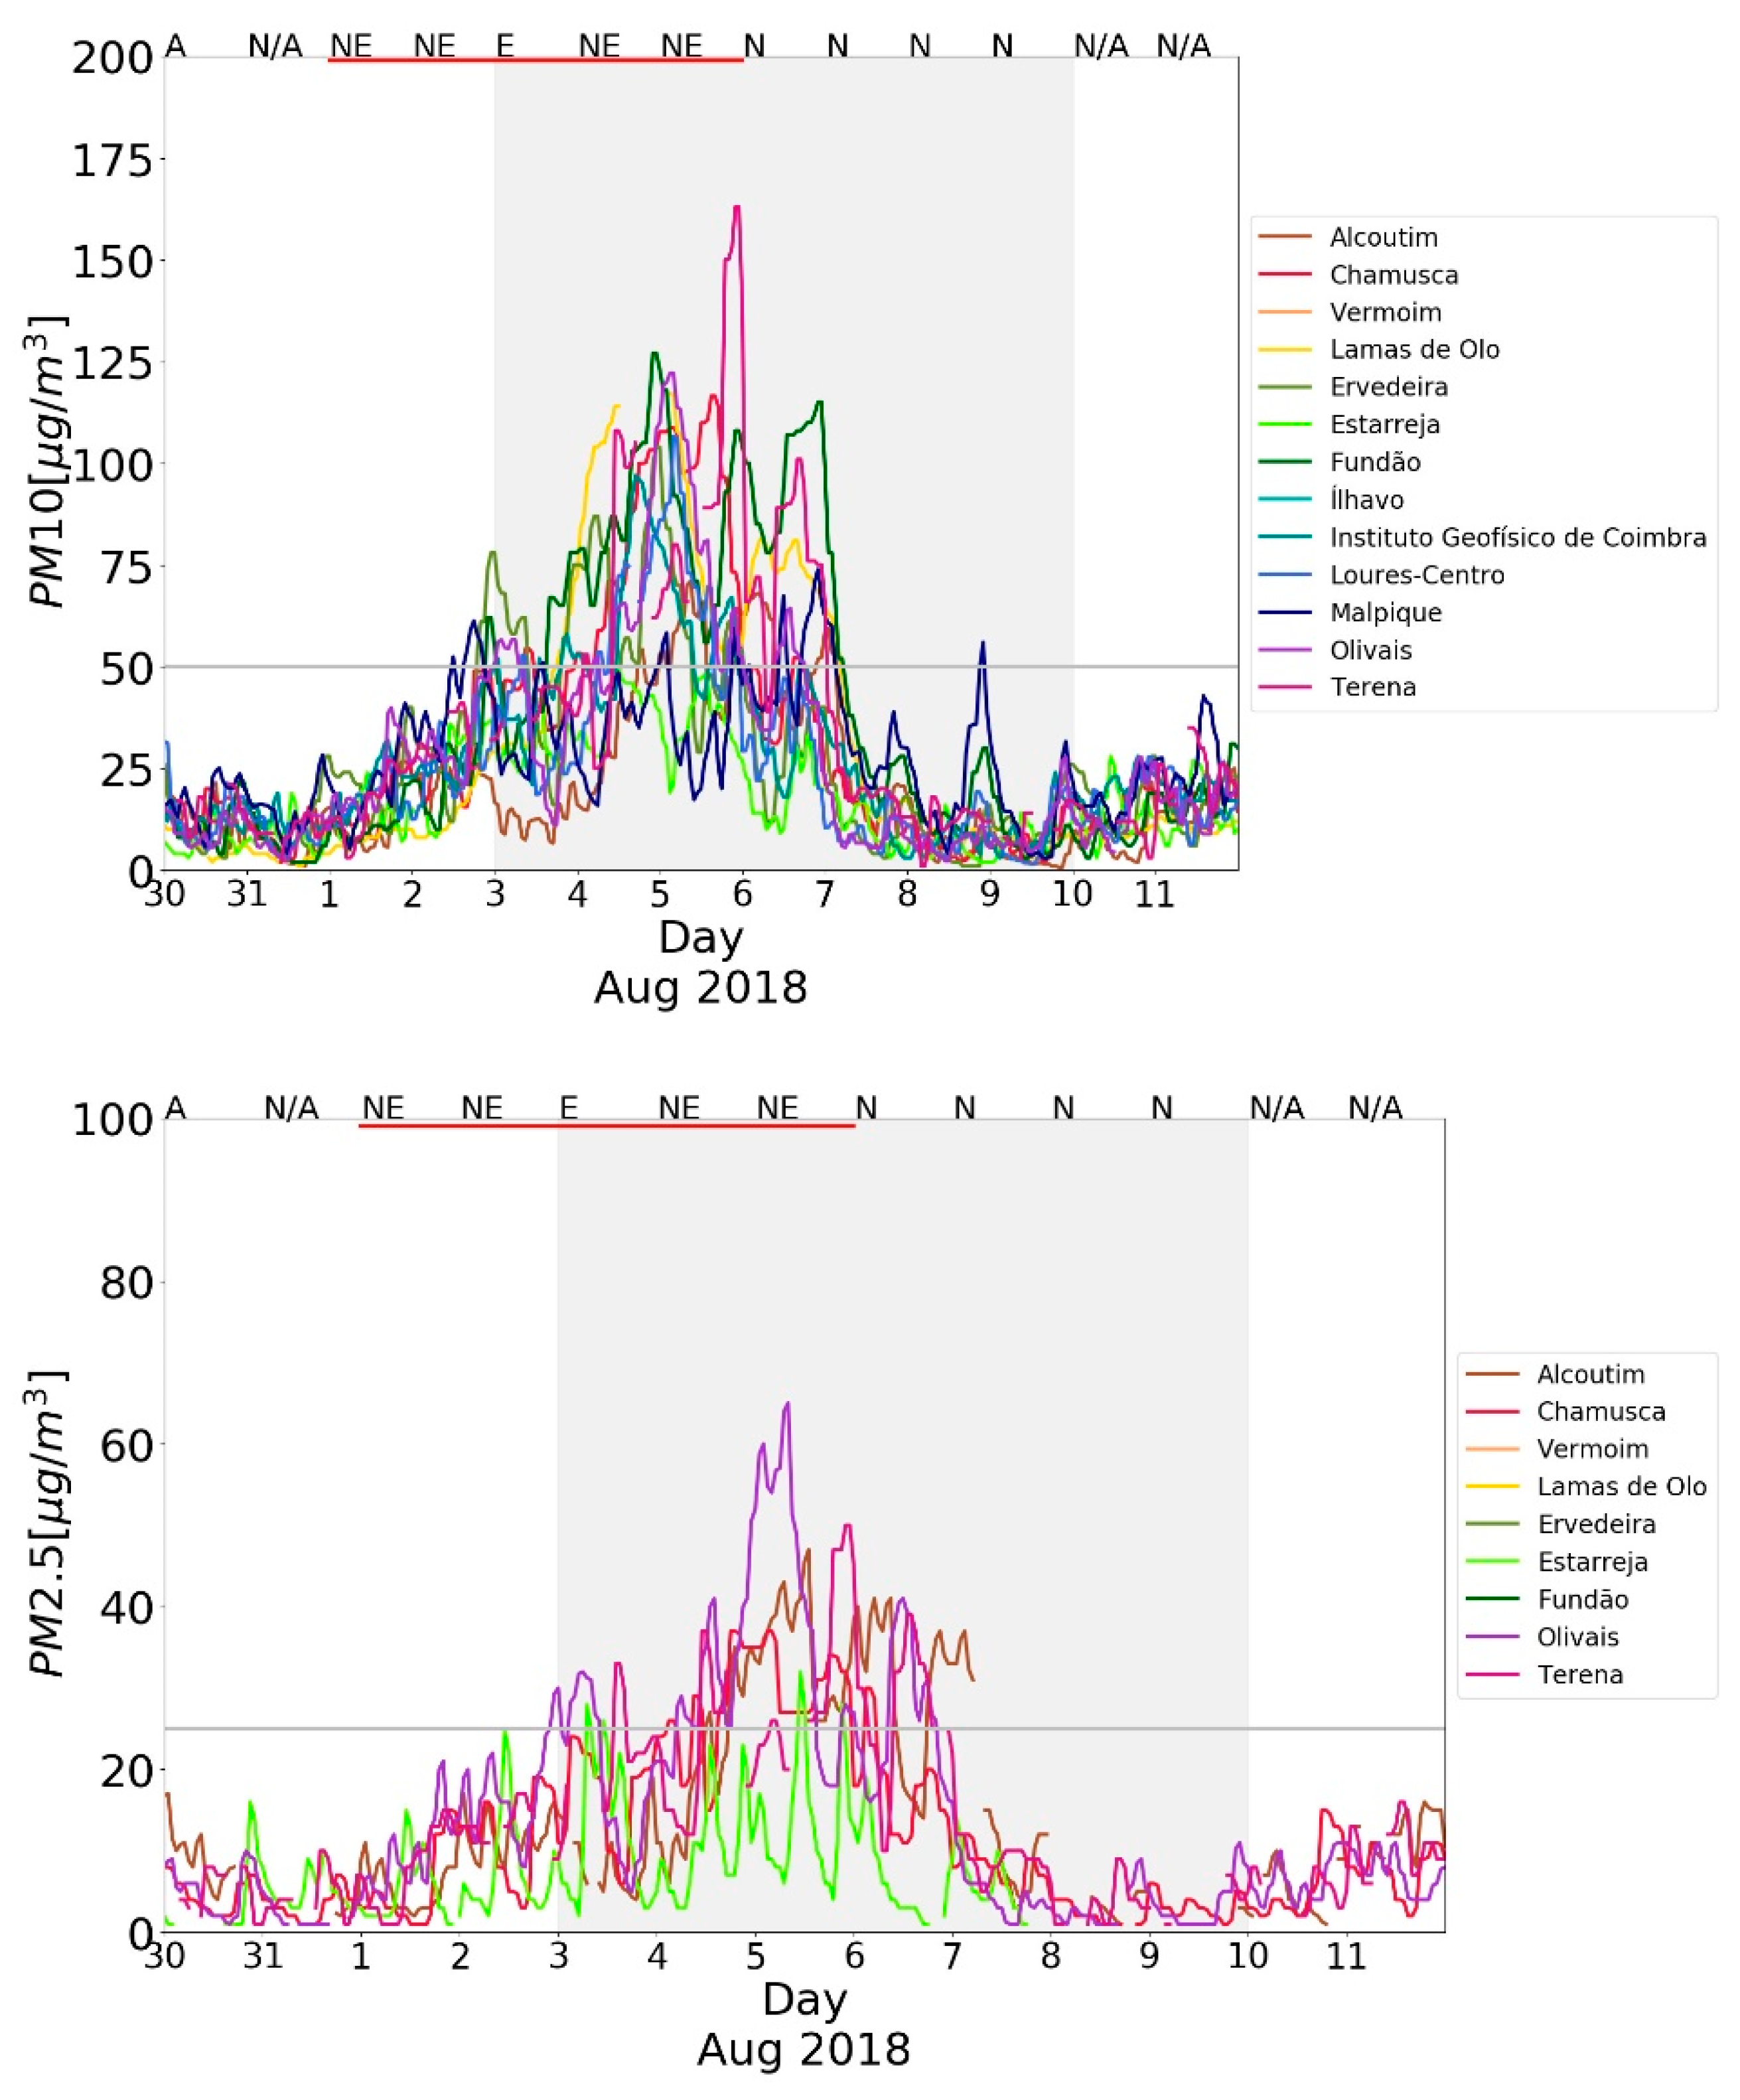
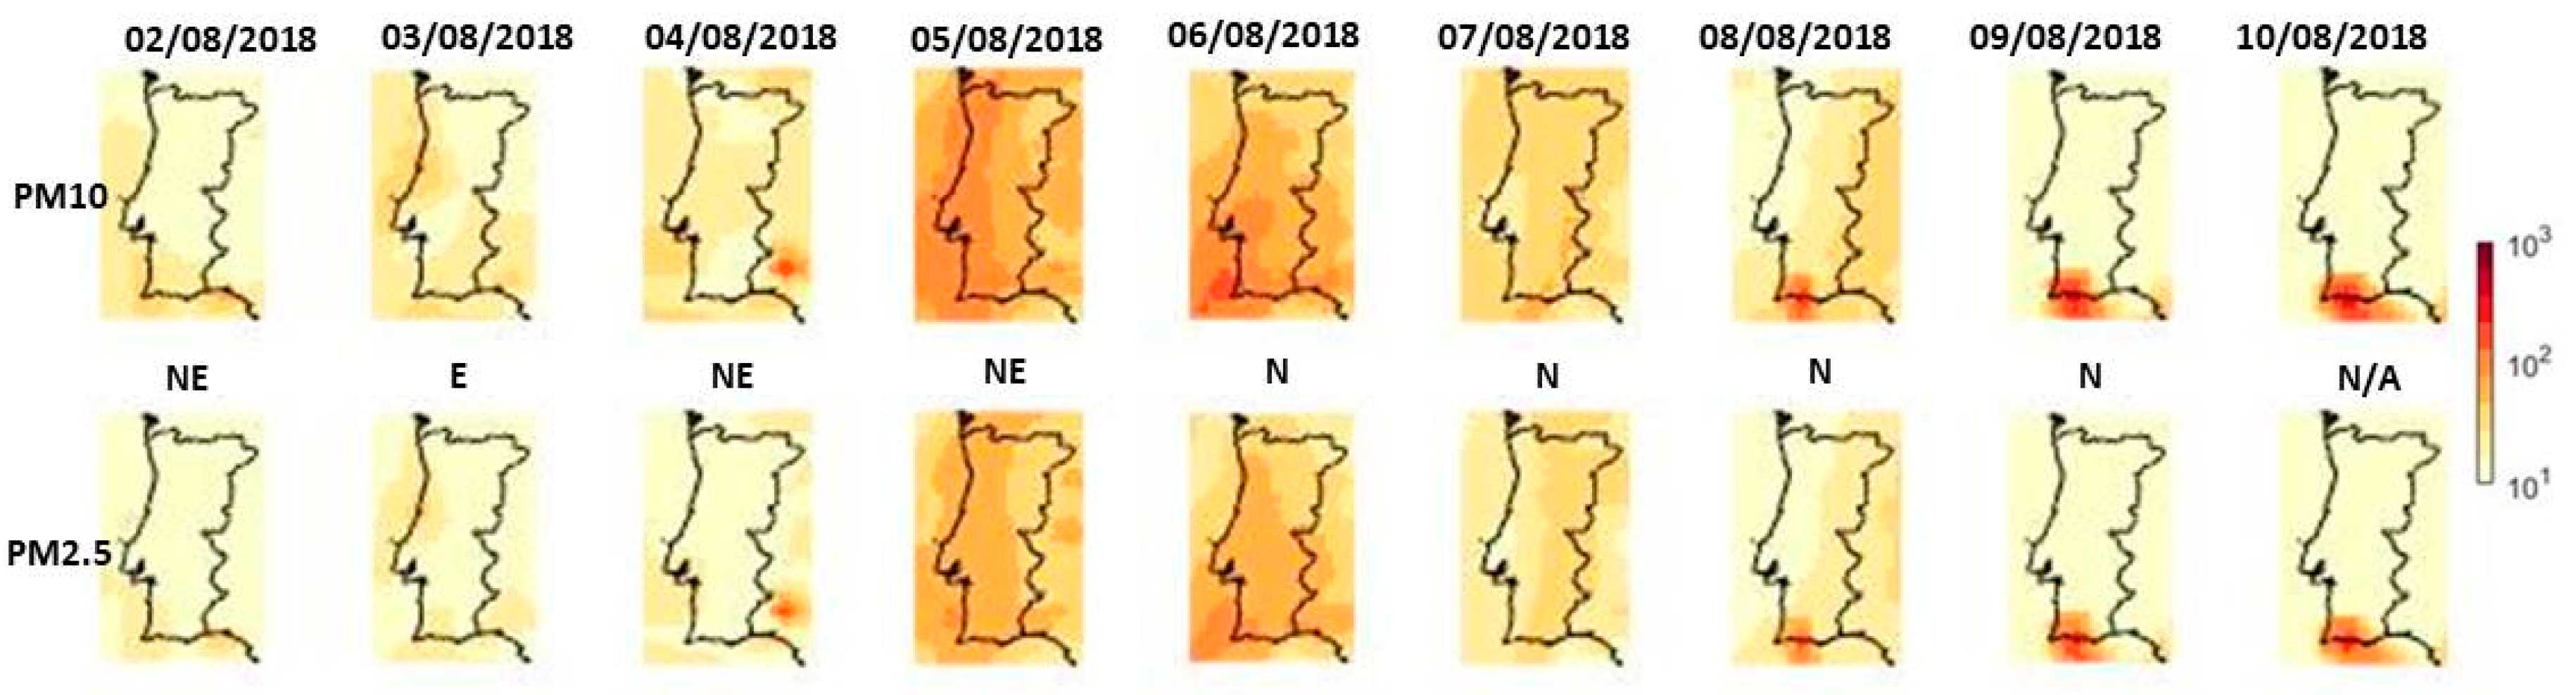
3.4.2. August 2018 Heatwave and Fires

A similar analysis was performed for August 2018, which is particularly interesting due to the fact that it encompasses a succession of extreme events which contributed to the worsening of AQ, namely the advection of an anomalously warm air mass, originating over the Sahara region, and a subsequent large fire in the southern region of Portugal. During this episode, record-breaking temperature values were observed in continental Portugal, and extremely high fire risk conditions prompted a significant fire in Monchique which started on August 3rd. The air mass responsible for this occurrence presented a very high concentration of Saharan dust, and was trapped for several days over the region.
PM concentrations registered by local monitoring stations revealed an increase of PM10 concentrations from the 3rd to 7th August (Figure 8), with maximum values registered over Chamusca monitoring station (over 150 µg/m3) on 6th August. Due to its location, only Malpique monitoring station revealed a clear sign of the increase of PM10 concentrations due to the Monchique fire. PM10 and PM2.5 daily concentrations exceeded both the daily limit values over southern inland areas and the west coast of Portugal, with concentrations increasing clearly from the 3rd to the 6th of August.
The influences of both the intrusion from Saharan warm air carrying particles and the Monchique fire were identified by CAMS-NRT data (Figure 9), with the prior showing a broader influence area in the first days of the event (5 and 6 of August), as a fingerprint of the dust intrusion, and the latter a more localized influence (8–10 of August), as a result of the wildfire. CAMS-NRT registered a maximum value of ~213 µg/m3 for PM10 and ~150 µg/m3 in the case of PM2.5, on the 5th August due to the extreme intrusion event over southwestern Portugal. Nevertheless, maximum PM10 concentrations during this episode are linked to the very large fire which took place in Monchique, with maximum concentrations of up to 720 µg/m3 for PM10 on 9th August.
This intense PM episode (Figure 8) was driven by the least frequent CWTs, NE and E, during the period from 2nd of August until the 5th, with a strong positive temperature anomaly [51], followed by the N CWT which contributed to the diminishing PM values after 6th of August, as the heatwave declined. These results are consistent with previous results, i.e., transported-caused PM extreme events in Portugal are linked predominantly with situations characterized by an eastern component and advection of dry warmer air masses [23,51].

4. Discussion

PM pollution episodes constitute a serious problem to human health [2,3,4,5,6]. Although legal limits are in place for different pollutants [57], limit values are often exceeded. These pollution episodes can occur related to certain instantaneous or predominant synoptic weather conditions [19,23,24] (e.g., recirculation/stagnation [20], vertical inversions [58], regional and long-range transport [18,19,20,22,23,24,38] or emissions [30,37,59]). Portugal has been recurrently affected by PM extreme events [23,24,41,42], with high impacts on health [36]. These health impacts have been widely and repeatedly reported throughout the world [4,5,6,7,9,10,11,12,13,14,31,38], but studies are still lacking in Portugal.
Therefore, inter- and intra-annual variability of PM10 and PM2.5 concentrations, as measured by background monitoring stations, were analyzed for mainland Portugal over the period 2006–2018, showing a tendency of reduction in the average annual values of PM concentrations over the last decade. This tendency was also identified by Russo et al. [23] and Guerreiro [60], with particular emphasis on the case of PM10.
PM values show a clear intra-annual cycle, with higher values in winter months for most regions, particularly visible for the case of PM10, which is in accordance with previous studies [23]. A clear weekly cycle is observed, with a minimum observed on Sundays, both for PM10 and PM2.5 values, as a result of lower car traffic over the weekend [18,59].
Daily prevailing circulation patterns affecting Portugal were determined using an automatic classification scheme [46], to analyze the impact of each CWT on air quality. Although the anticyclonic CWT is the most frequent pattern throughout most of the year, that is not the pattern associated with the highest PM concentrations. These are linked to directional CWTs with a significant southerly and/or easterly component, which although being some of the least frequent weather types throughout the year, appear to be associated with the highest median and maximum concentrations. Similar results were also reported for winter in the Netherlands [18] and for Portugal [23], with the less frequent CWTs being related to higher values of several pollutants, namely for PM10 (in Portugal and the Netherlands), NO2 and O3 (Portugal). The results presented here for PM2.5 constitute a novelty to the best of our knowledge. Summing up, a major preliminary conclusion is that the predominant CWTs in Portugal (i.e., anticyclonic and northerly regimes) are not related to significant PM episodes, as the highest concentrations of PM tend to be restricted to a smaller set of circulation configurations (NE, E, SE, S), which are usually associated with less water content in the atmosphere [23].
In order to complement the wider picture obtained so far, two particularly extreme PM events were evaluated, namely the episodes which took place between 15th–17th of October, 2017, and 3rd–10th of August, 2018, with the aim to clarify the meteorological factors that led PM concentrations to surpass the legal limits. These episodes represent two outstanding cases in terms of measured hourly concentrations, both by monitoring stations and CAMS-NRT, during 2006–2018. The 2017 episode was associated with strong fires enhanced by the close passage of Hurricane Ophelia, which fostered the high wind speed, the high temperatures and the low relative humidity necessary for the development of massive fires [53]. These fires, due to their proportion and duration, emitted large quantities of PM, among other pollutants, reaching values 100 times above the legal limit [57]. The results from CAMS-NRT are accordingly in agreement with measurements from background monitoring stations of both pollutants. What is also particularly interesting during this 2017 event is the fact that, although reaching spectacularly high values, the concentrations diminished quickly (~1–2 days) to levels below the legal thresholds. This was in fact potentiated by the CWTs observed during the fires which contributed to the dissipation process (CWT W component).
The 2018 episode depicts a succession of extreme events which was initiated by the advection of an anomalously warm air mass from the Sahara Desert, and culminated in a large fire in the southern region of Portugal. Again, PM concentrations registered by local monitoring stations and CAMS-NRT were above the legal limits for both pollutants (10 times over for PM10). This severe episode was initially driven by remote PM transport under an easterly component (NE and E) during the period from 2nd of August until the 5th, aggravated by local generation of PM due to the Monchique fire, followed by a turn to a northerly component which contributed to the normalization of PM values after 6th of August. These results are also consistent with previous results, i.e., transported-caused PM extreme events in Portugal are associated predominantly with situations characterized by an eastern component and advection of dry warmer air masses [23,51]. This circulation-to-environment approach has the advantage of being easily transferred to other geographical areas, which constitutes a promising tool in discriminating atmospheric conditions leading to the occurrence of PM events.
Previous studies mostly analyzed data from monitoring stations, normally focusing on the identification of the events [23,24,36,41]. Therefore, an approach which combines the temporal advantage of background monitoring stations and the broader spatial information on the range of areas affected by the pollution event, introduced by CAMS-NRT constitutes a novelty, particularly for Portugal.
This work highlights the importance of certain CWTs on the setting and dispersion of pollution events, which have an impact on both PM10 and PM2.5. This is also the first time that PM2.5 was assessed using a circulation-to-environment approach for Portugal, to the best of our knowledge. Another aspect which is noteworthy is the fact that CAMS-NRT is able to identify PM levels far higher than monitoring stations, as expected. This should be taken into account in terms of future environmental assessments, particularly when trying to disentangle health impacts and developing institutional mitigation strategies.
One caveat identified here, is the fact that CAMS-NRT does not measure hourly values. Nevertheless, we think that the daily information with high spatial resolution partially overcomes that deficiency. Another caveat of this study is that it does not take into account other PM sources, namely of an anthropogenic nature. At a European scale, PM exceedances regarding the current European air quality limits are mostly associated with the presence of secondary inorganic aerosol and traffic, which therefore constitute the most important source categories to target for abatement throughout the year [61]. Nevertheless, these results are not equal for the whole of Europe and are closely influenced by the sampling location and local influences. In some areas in Portugal, crustal and mineral dust contributions, as well as industrial and wood burning contributions, are also important [61,62] and should be addressed to minimize their impact on the local air quality in the future.
This study might be a starting point to assess the applicability of developing warning systems to assess the possibility of, in certain future circumstances, CWT having high probability of contributing even more to the occurrence of high levels of PM.

5. Conclusions

The main objective of the work was to relate atmospheric circulation patterns affecting Portugal with the observed PM, as measured by background monitoring stations and by CAMS-NRT. As such, the CWT classification for mainland Portugal proposed by Trigo and DaCamara [48] was used, considering a total of 10 distinct atmospheric circulation patterns. Our results revealed the existence of a close relationship between weather types and PM concentrations in Portugal. The main findings of this study are summarized below:
-
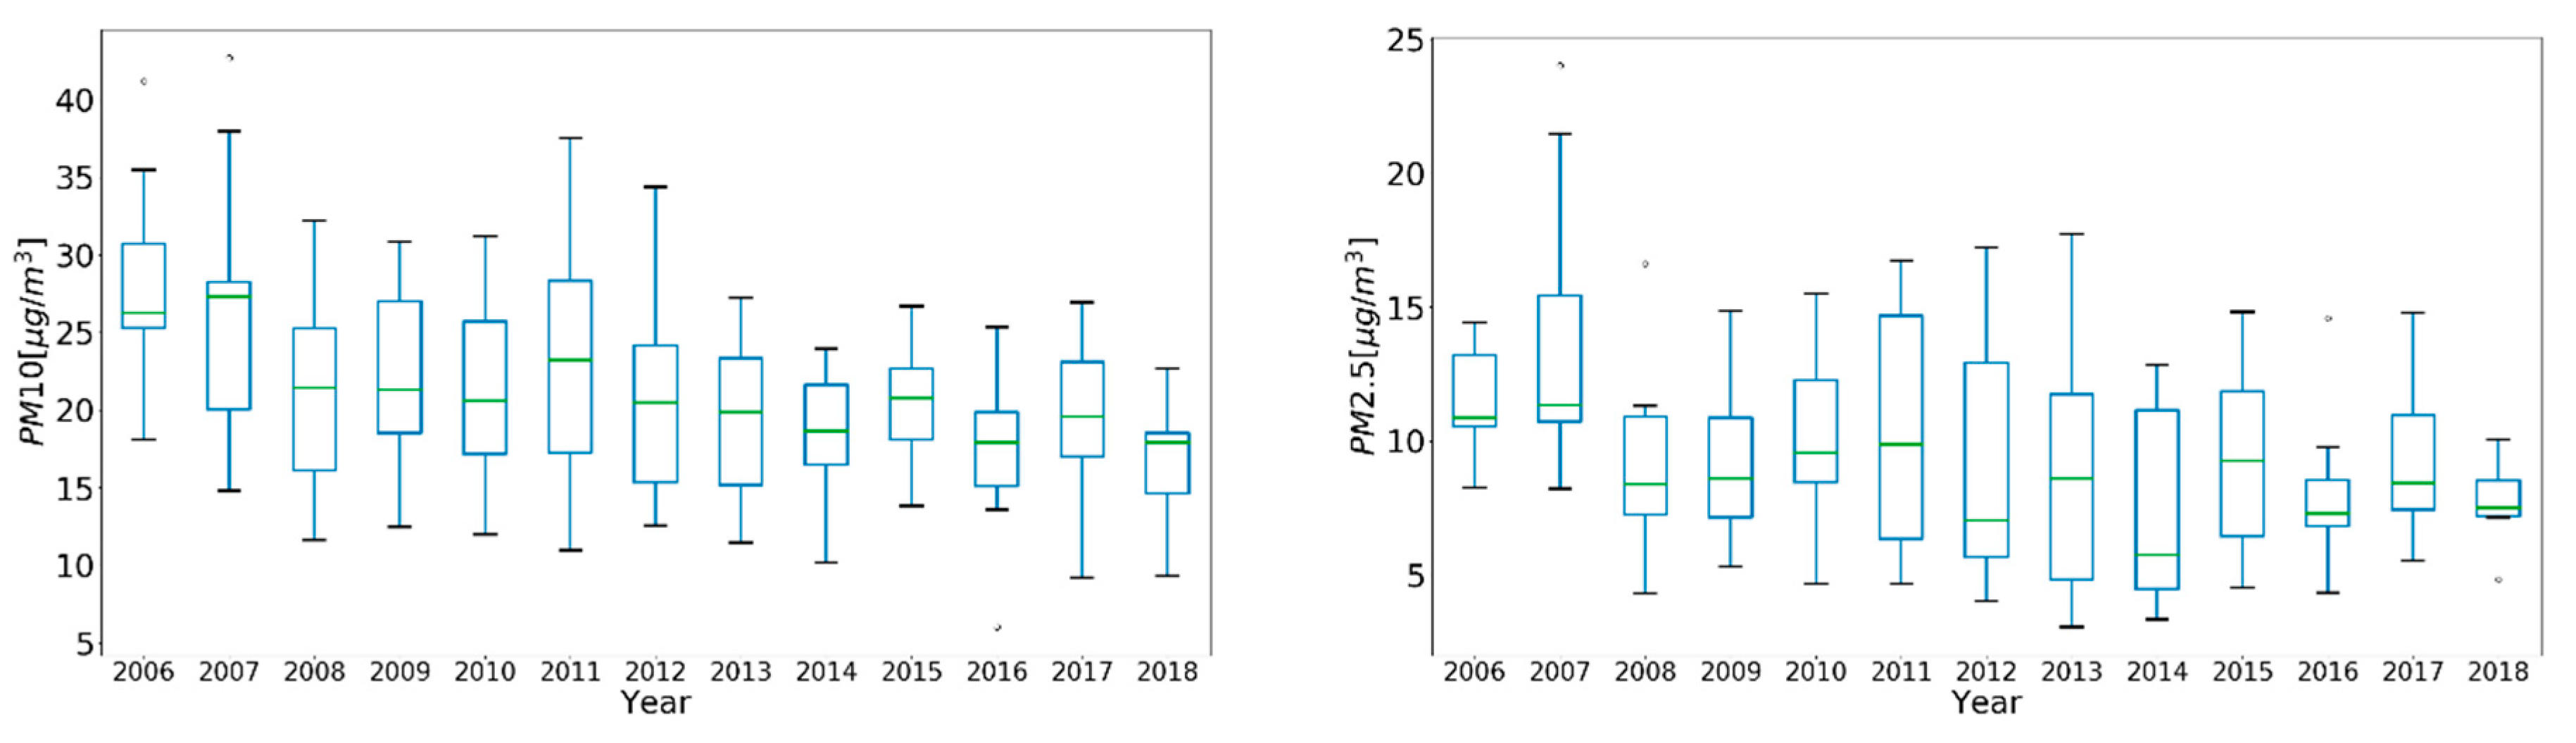
Average annual PM concentrations show a reduction tendency over the last decade.
-
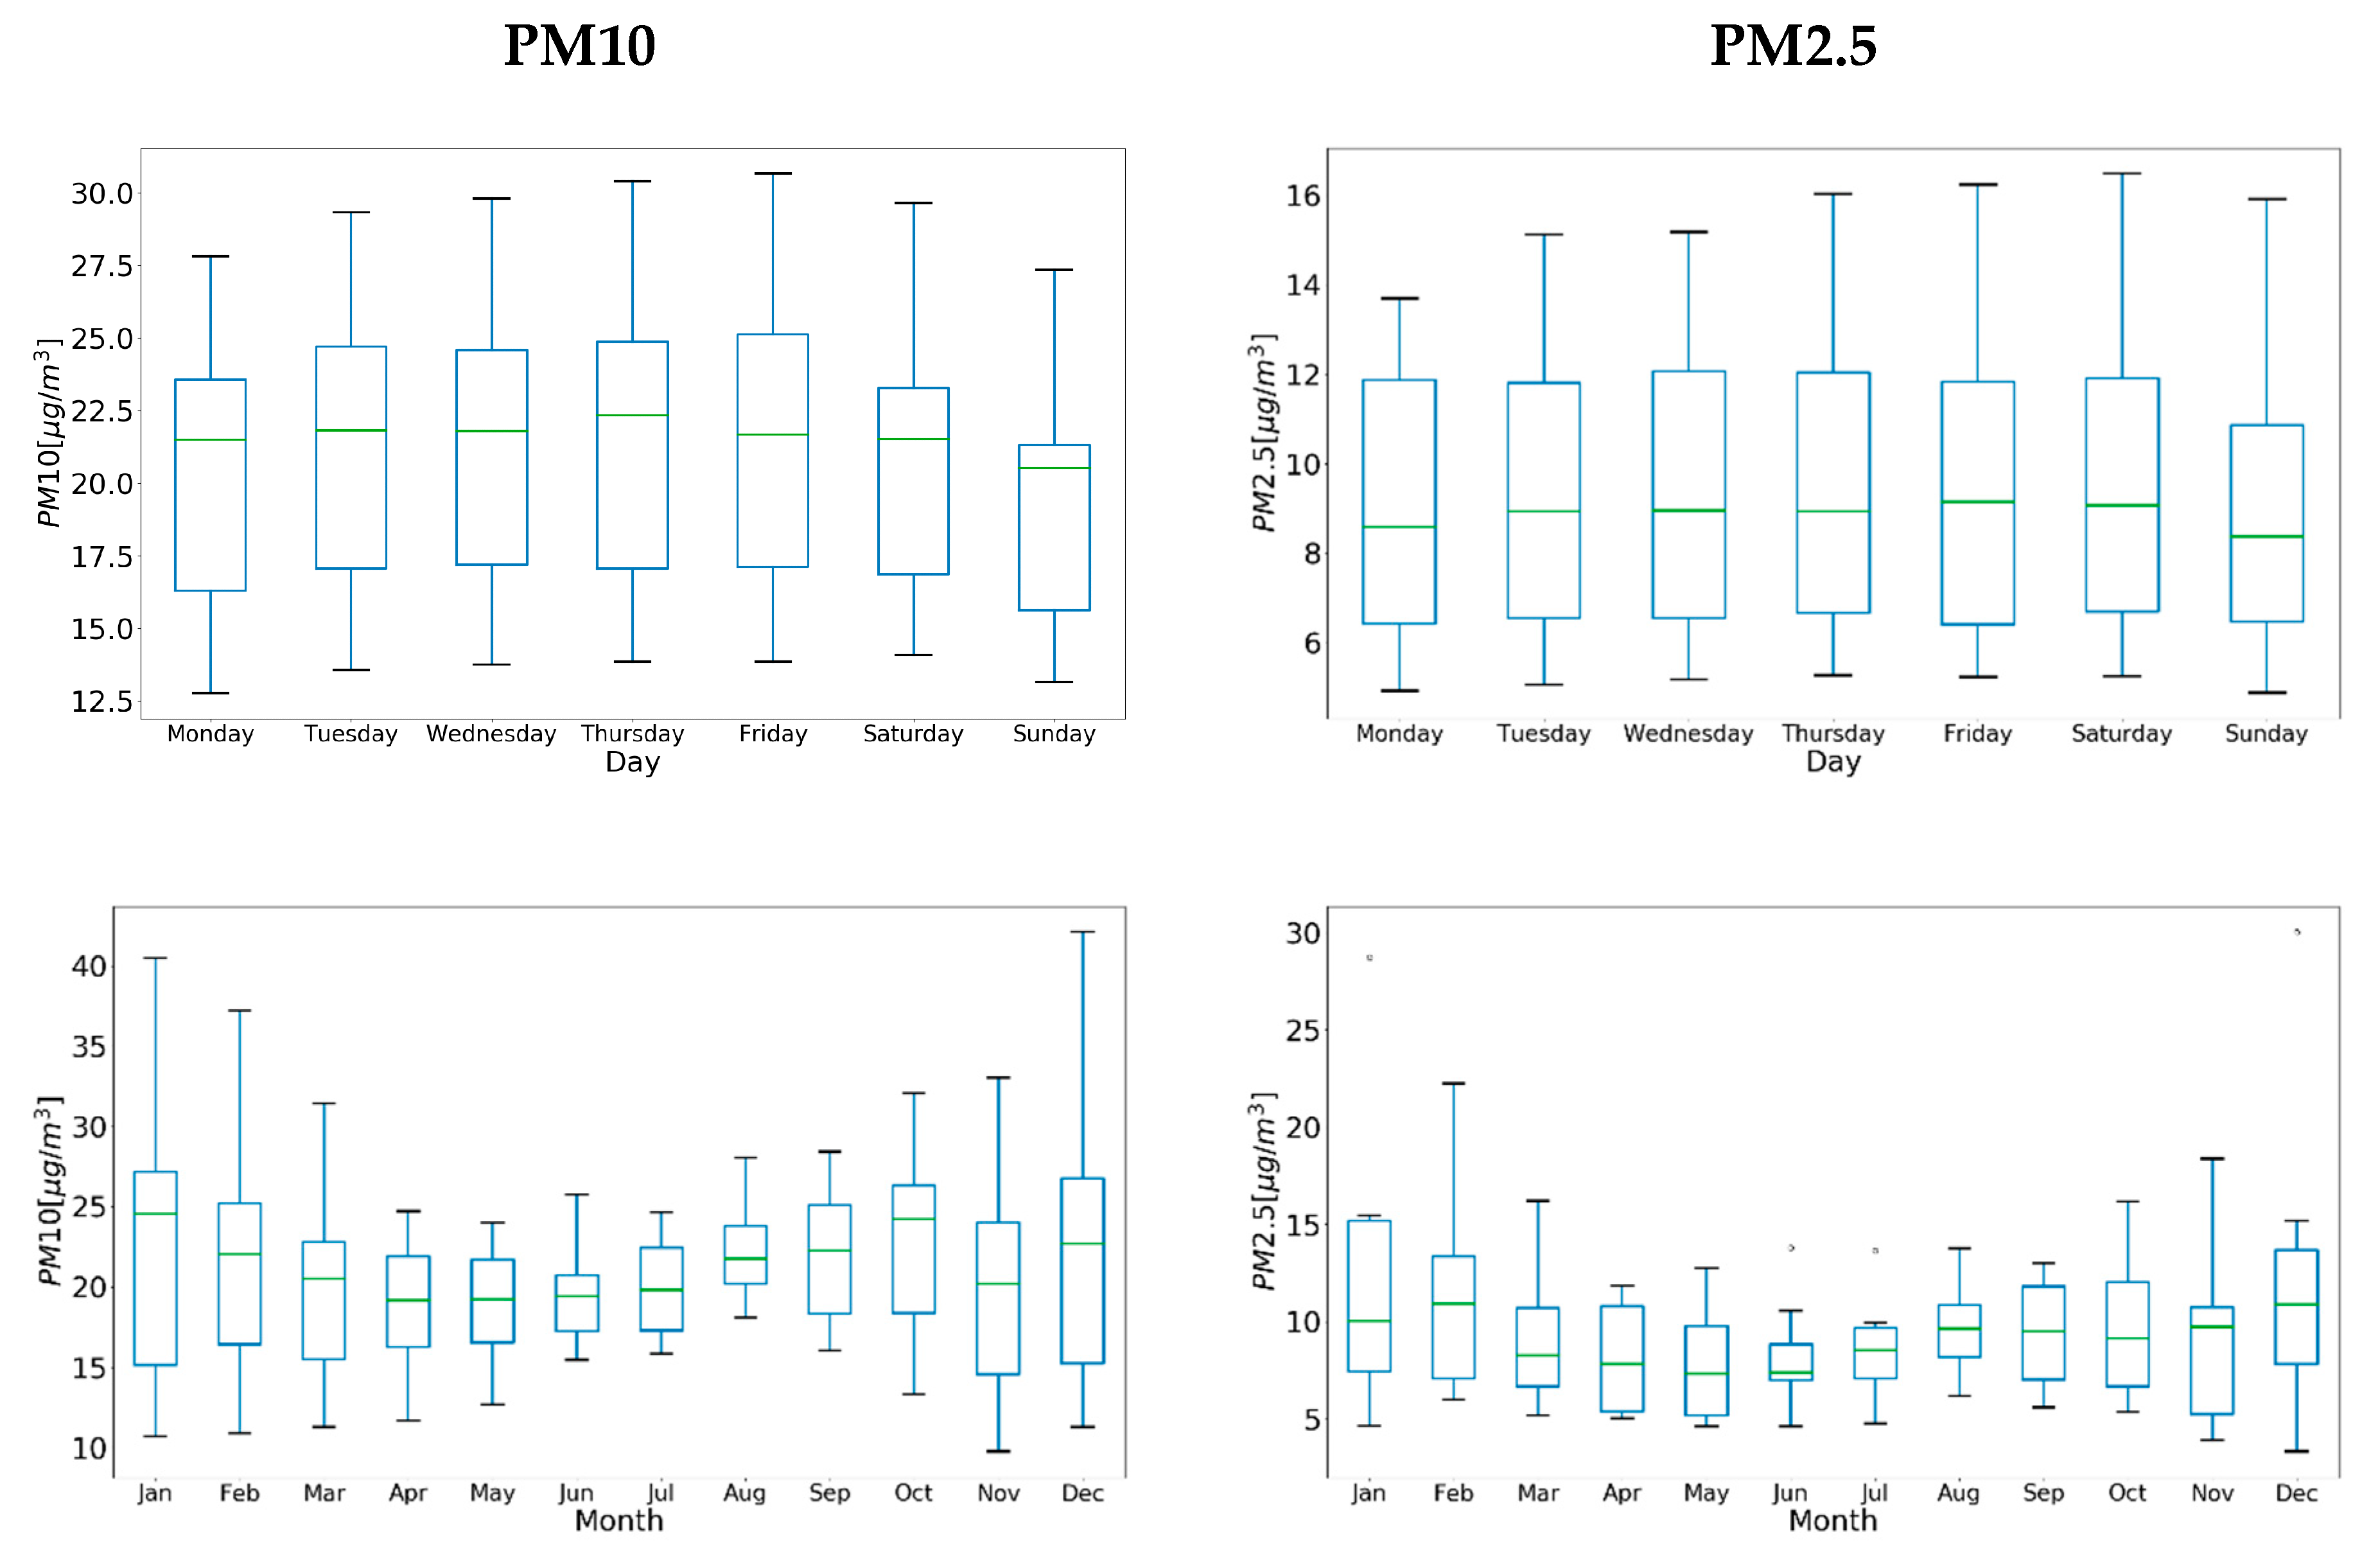
PM values show a clear intra-annual cycle, with higher values during wintertime for most regions.
-
The predominant CWTs in Portugal (i.e., anticyclonic and northerly regimes) are not related to significant PM episodes, as the highest concentrations of PM tend to be restricted to a smaller set of circulation configurations (NE, E, SE, S).
-
This work highlights the importance of certain CWTs on the setting and dispersion of pollution events, which have an impact on both PM10 and PM2.5. Namely, for the two analyzed extreme events, associated with mega wildfires (15–17 October, 2017) and dust intrusion (1–10 August, 2018), they both show prevailing southerly and easterly circulations during the onset and peak of the events.
Although previous studies have related specific meteorological situations with air quality levels in Portugal, this study provides, to the best of our knowledge, the first long-term assessment (2006–2018) of PM2.5 data for Portugal employing CWT classification for this sector of Europe.
The results highlight the two-fold importance of this circulation-to-environment approach, namely: (1) in the case of long-range transport, allowing the determination of the prevailing CWTs related to lower air quality; (2) in the case of locally generated pollution events, like fires, allowing for the identification of favorable dispersion conditions and the propensity to a certain dispersion path. These results are important as an aid to air quality forecasting since high concentrations of atmospheric pollution are associated with less frequent CWTs and therefore the occurrence of these CWTs can be used as an operational tool to forecast low air quality episodes.
This study might be a starting point to assess the applicability of CWT on the development of pollution warning systems.
Nevertheless, it should be noted that anthropogenic sources of PM were not accounted for in this study and should be addressed to minimize their impact on local air quality in the future.
Finally, future assessments of the amplified impacts of compound events, namely fire intrusions, in comparison with the impacts of individual events is one of the targets for further work. Moreover, the expected diminishing of precipitation and intensification of hot conditions may also exacerbate the fire risk and air pollution, and understanding the changes in these interactions constitutes another promising line for future research in the present climate change context. Therefore, studies on the future relationship between CWT and pollution would be of high interest for the wider community.

Author Contributions

Conceptualization, methodology and writing, A.R., P.M.S. and R.D. Investigation and formal analysis, R.C., A.R., P.M.S. and R.D.; review and editing, A.R., P.M.S., R.D. and R.C.; visualization, R.C., P.M.S. and R.D.; All authors have read and agreed to the published version of the manuscript.

Funding

This work was supported by the Fundação para a Ciência e Tecnologia (FCT) under project UID 50019 2020—Instituto Dom Luiz. P.M.S. thanks project HOLMODRIVE—North Atlantic Atmospheric Patterns Influence on Western Iberia Climate: From the Lateglacial to the Present (PTDC/CTAGEO/ 29029/2017).

Institutional Review Board Statement

Not applicable.

Informed Consent Statement

Not applicable.

Data Availability Statement

The used data are available at APA (https://qualar.apambiente.pt/) and the Copernicus Atmosphere Monitoring Service (http://atmosphere.copernicus.eu) sites.

Acknowledgments

The authors acknowledge APA (https://qualar.apambiente.pt/) and the Copernicus Atmosphere Monitoring Service (http://atmosphere.copernicus.eu) for the Portuguese air quality monitoring stations’ data and outputs, respectively.

Conflicts of Interest

The authors declare that they have no known competing financial interests or personal relationships that could have appeared to influence the work reported in this paper.

References

  1. IPCC. 2007: Climate Change. In The Physical Science Basis. Contribution of Working Group I to the Fourth Assessment, Report of the Intergovernmental Panel on Climate Change; Solomon, S., Qin, D., Manning, M., Chen, Z., Marquis, M., Averyt, K.B., Tignor, M., Miller, H.L., Eds.; Cambridge University Press: Cambridge, UK; New York, NY, USA, 2007; 996p. [Google Scholar]
  2. Organisation for Economic Co-operation and Development (OECD). OCDE Environmental Outlook to 2050: The Consequences of Inaction (2012); OECD Publishing: Paris, French, 2012; p. 350. [Google Scholar] [CrossRef]
  3. EEA—European Environment Agency. Every Breath We Take: Improving Air Quality in Europe, EEA Signals 2013 Report; Publications Office of the European Union: Luxembourg, 2013; ISBN 978-92-9213-363-4. [Google Scholar] [CrossRef]
  4. Colais, P.; Faustini, A.; Stafoggia, M.; Berti, G.; Bisanti, L.; Cadum, E.; Cernigliaro, A.; Mallone, S.; Pacelli, B.; Serinelli, M.; et al. Particulate Air Pollution and Hospital Admissions for Cardiac Diseases in Potentially Sensitive Subgroups. Epidemiology 2012, 23, 473–481. [Google Scholar] [CrossRef] [PubMed]
  5. Lanzinger, S.; Schneider, A.; Breitner, S.; Stafoggia, M.; Erzen, I.; Dostal, M.; Peters, A. Associations between ultrafine and fine particles and mortality in five central European cities—Results from the UFIREG study. Environ. Int. 2016, 88, 44–52. [Google Scholar] [CrossRef] [PubMed]
  6. Cournane, S.; Conway, R.; Byrne, D.; O’Riordan, D.; Coveney, S.; Silke, B. High Risk Subgroups Sensitive to Air Pollution Levels Following an Emergency Medical Admission. Toxics 2017, 5, 27. [Google Scholar] [CrossRef] [PubMed] [Green Version]
  7. World Health Organization (WHO). Health, Environment and Climate Change: Report by the Director-General. World Health Assembly, 71; World Health Organization: Geneva, Switzerland, 2018; Available online: https://apps.who.int/iris/handle/10665/276332 (accessed on 25 October 2020).
  8. European Environment Agency. 2017, “Air Quality in Europe—2017 Report”; EEA Technical Report No13/2017; Publications Office of the European Union: Luxembourg, 2017; ISBN 978-92-9213-921-6. ISSN 1977-8449. [Google Scholar] [CrossRef]
  9. Pérez, L.; Tobías, A.; Querol, X.; Pey, J.; Alastuey, A.; Díaz, J.; Sunyer, J. Saharan dust, particulate matter and cause specific mortality: A case-crossover study in Barcelona (Spain). Environ. Int. 2012, 48, 150–155. [Google Scholar] [CrossRef]
  10. Reyes, M.; Díaz, J.; Tobías, A.; Montero, J.C.; Linares, C. Impact of Saharan dust particles on hospital admissions in Madrid. Int. J. Environ. Health Res. 2014, 24, 63–72. [Google Scholar] [CrossRef]
  11. Stafoggia, M.; Samoli, E.; Alessandrini, E.; Cadum, E.; Ostro, B.; Berti, G.; Faustini, A.; Jacquemin, B.; Linares, C.; Pascal, M.; et al. Short-term associations between fine and coarse particulate matter and hospitalizations in southern Europe: Results from the MED-PARTICLES project. Environ. Health Perspect. 2013, 121, 1026–1033. [Google Scholar] [CrossRef]
  12. Stafoggia, M.; Cesaroni, G.; Peters, A.; Andersen, Z.J.; Badaloni, C.; Beelen, R.; Caracciolo, B.; Cyrys, J.; de Faire, U.; de Hoogh, K.; et al. Long-term exposure to ambient air pollution and incidence of cerebrovascular events: Results from 11 European cohorts within the escape project. Environ. Health Perspect. 2014, 122, 919–925. [Google Scholar] [CrossRef] [Green Version]
  13. Stafoggia, M.; Zauli-Sajani, S.; Pey, J.; Samoli, E.; Alessandrini, E.; Basagaña, X.; Cernigliaro, A.; Chiusolo, M.; Demaria, M.; Díaz, J.; et al. MED-PARTICLES Study Group. Desert dust outbreaks in Southern Europe: Contribution to daily PM10 concentrations and short-term associations with mortality and hospital admissions. Environ. Health Perspect. 2016, 124, 413–419. [Google Scholar] [CrossRef] [Green Version]
  14. Díaz, J.; Linares, C.; Carmona, R.; Russo, A.; Ortiz, C.; Salvador, P.; Trigo, R.M. Saharan dust intrusions in Spain: Health impacts and associated synoptic conditions. Environ. Res. 2017, 156, 455–467. [Google Scholar] [CrossRef]
  15. European Environment Agency. 2019, “Air Quality in Europe—2019 Report”; EEA Technical Report No10/2019; Publications Office of the European Union: Luxembourg, 2019; ISBN 978-92-9480-088-6. ISSN 1977-8449. [Google Scholar] [CrossRef]
  16. Gupta, P.; Christopher, S.A.; Wang, J.; Gehrig, R.; Lee, Y.C.; Kumar, N. Satellite remote sensing of particulate matter and air quality over global cities. Atmos. Environ. 2006, 40, 5880–5892. [Google Scholar] [CrossRef]
  17. Yang, Q.; Yuan, Q.; Yue, L.; Li, T. Investigation of the spatially varying relationships of PM2.5 with meteorology, topography, and emissions over China in 2015 by using modified geographically weighted regression. Environ. Pollut. 2020, 262, 114257. [Google Scholar] [CrossRef] [PubMed]
  18. Demuzere, M.; Trigo, R.M.; Vila-Guerau de Arellano, J.; van Lipzig, N.P.M. The impact of weather and atmospheric circulation on O3 and PM10 levels at a rural mid-latitude site. Atmos. Chem. Phys. 2009, 9, 2695–2714. [Google Scholar] [CrossRef] [Green Version]
  19. Pearce, J.L.; Beringer, J.; Nicholls, N.; Hyndman, R.J.; Uotila, P.; Tapper, N.J. Investigating the influence of synoptic-scale meteorology on air quality using self-organizing maps and generalized additive modelling. Atmos. Environ. 2011, 45, 128–136. [Google Scholar] [CrossRef]
  20. Russo, A.; Gouveia, C.M.; Levy, I.; Dayan, U.; Jerez, S.; Mendes, M.A.; Trigo, R.M. Coastal recirculation potential affecting air pollutants in Portugal: The role of circulation weather types. Atmos. Environ. 2016, 135, 9–19. [Google Scholar] [CrossRef]
  21. Hooyberghs, J.; Mensink, C.; Dumont, G.; Fierens, F.; Brasseur, O. A neural network forecast for daily average PM10 concentrations in Belgium. Atmos. Environ. 2005, 39, 3279–3289. [Google Scholar] [CrossRef]
  22. Dayan, U.; Levy, I. Relationship between synoptic-scale atmospheric circulation and ozone concentrations over Israel. J. Geophys. Res. 2002, 107, 4813. [Google Scholar] [CrossRef]
  23. Russo, A.; Trigo, R.M.; Martins, H.; Mendes, M.T. NO2, PM10 and O3 urban concentrations and its association with circulation weather types in Portugal. Atmos. Environ. 2014, 89, 768–785. [Google Scholar] [CrossRef]
  24. Russo, A.; Sousa, P.M.; Durão RMRamos, A.M.; Salvador, P.; Linares, C.; Diaz, J.; Trigo, R.M. Saharan dust intrusions in the Iberian Peninsula: Predominant synoptic conditions. Sci. Total Environ. 2020, 717, 137041. [Google Scholar] [CrossRef]
  25. Carvalho, A.; Monteiro, A.; Ribeiro, I.; Tchepel, O.; Miranda, A.I.; Borrego, C.; Saavedra, S.; Souto, J.A.; Casares, J.J. High ozone levels in the northeast of Portugal: Analysis and characterization. Atmos. Environ. 2010, 44, 1020–1031. [Google Scholar] [CrossRef]
  26. Saavedra, S.; Rodríguez, A.; Taboada, J.J.; Souto, J.A.; Casares, J.J. Synoptic patterns and air mass transport during ozone episodes in northwestern Iberia. Sci. Total Environ. 2012, 441, 97–110. [Google Scholar] [CrossRef]
  27. Moulin, C.; Chiapello, I. Impact of human-induced desertification on the intensification of Sahel dust emission and export over the last decades, Geophys. Res. Lett. 2006, 33, L18808. [Google Scholar] [CrossRef]
  28. Turco, M.; Jerez, S.; Augusto, S.; Tarín-Carrasco, P.; Ratola, N.; Jimenez-Guerrero, P.; Trigo, R.M. Climate drivers of the 2017 devastating fires in Portugal. Sci. Rep. 2019, 9, 1–8. [Google Scholar] [CrossRef]
  29. Calheiros, T.; Nunes, J.P.; Pereira, M.G. Recent evolution of spatial and temporal patterns of burnt areas and fire weather risk in the Iberian Peninsula. Agric. For. Meteorol. 2020, 287, 107923. [Google Scholar] [CrossRef]
  30. Liu, J.C.; Wilson, A.; Mickley, L.J.; Dominici, F.; Ebisu, K.; Wang, Y.; Sulprizio, M.P.; Peng, R.D.; Yue, X.; Son, J.Y.; et al. Wildfire-specific Fine Particulate Matter and Risk of Hospital Admissions in Urban and Rural Counties. Epidemiology (Cambridge, Mass.) 2017, 28, 77–85. [Google Scholar] [CrossRef] [Green Version]
  31. Liu, J.C.; Mickley, L.J.; Sulprizio, M.P.; Yue, X.; Peng, R.D.; Dominici, F.; Bell, M.L. Future respiratory hospital admissions from wildfire smoke under climate change in the Western US. Environ. Res. Lett. 2016, 11, 124018. [Google Scholar] [CrossRef]
  32. Turco, M.; Rosa-Cánovas, J.J.; Bedia JJerez, S.; Montávez, J.P.; Llasat, M.C.; Provenzale, A. Exacerbated fires in Mediterranean Europe due to anthropogenic warming projected with non-stationary climate-fire models. Nat. Commun. 2018, 9, 3821. [Google Scholar] [CrossRef]
  33. Ruffault, J.; Curt, T.; Moron, V.; Trigo, R.M.; Mouillot, F.; Koutsias, N.; Pimont, F.; Martin-StPaul, N.; Barbero, R.; Dupuy, J.-L.; et al. Increased likelihood of heat-induced large wildfires in the Mediterranean Basin. Sci. Rep. 2020, 10, 13790. [Google Scholar] [CrossRef]
  34. AghaKouchak, A.; Chiang, F.; Huning, L.S.; Love, C.A.; Mallakpour, I.; Mazdiyasni, O.; Moftakhari, H.; Papalexiou, S.M.; Ragno, E.; Sadegh, M. Climate Extremes and Compound Hazards in a Warming World. Annu. Rev. Earth Planet. Sci. 2020, 48, 1. [Google Scholar] [CrossRef] [Green Version]
  35. Fernandes, P.M.; Barros, A.M.G.; Pinto, A.; Santos, J.A. Characteristics and controls of extremely large wildfires in the western Mediterranean Basin. J. Geophys. Res.-Biogeo. 2016, 121, 2141–2157. [Google Scholar] [CrossRef]
  36. Augusto, S.; Ratola, N.; Tarín-Carrasco, P.; Jiménez-Guerrero, P.; Turco, M.; Schuhmacher, M.; Costa, S.; Teixeira, J.P.; Costa, C. Population exposure to particulate-matter and related mortality due to the Portuguese wildfires in October 2017 driven by storm Ophelia. Environ. Int. 2020, 144, 106056. [Google Scholar] [CrossRef]
  37. Adame, J.; Lope, L.; Hidalgo, P.; Sorribas, M.; Gutiérrez-Álvarez, I.; Del Águila, A.; Saiz-Lopez, A.; Yela, M. Study of the exceptional meteorological conditions, trace gases and particulate matter measured during the 2017 forest fire in Doñana Natural Park, Spain. Sci. Total Environ. 2018, 645, 710–720. [Google Scholar] [CrossRef] [PubMed]
  38. Kollanus, V.; Tiittanen, P.; Niemi, J.V.; Lanki, T. Effects of long-range transported air pollution from vegetation fires on daily mortality and hospital admissions in the Helsinki metropolitan area, Finland. Environ. Res. 2016, 151, 351–358. [Google Scholar] [CrossRef] [PubMed]
  39. Evtyugina, M.; Calvo, A.I.; Nunes, T.; Alves, C.; Fernandes, A.P.; Tarelho, L.; Vicente, A.; Pio, C. VOC emissions of smouldering combustion from Mediterranean wildfires in central Portugal. Atmos. Environ. 2013, 64, 339–348. [Google Scholar] [CrossRef]
  40. Vicente, A.; Alves, C.; Monteiro, C.; Nunes, T.; Mirante, F.; Evtyugina, M.; Cerqueira, M.; Pio, C. Measurement of trace gases and organic compounds in the smoke plume from a wildfire in Penedono (central Portugal). Atmos. Environ. 2011, 45, 5172–5182. [Google Scholar] [CrossRef]
  41. Oliveira, M.; Delerue-Matos, C.; Pereira, M.C.; Morais, S. Environmental particulate matter levels during 2017 large forest fires and megafires in the center region of Portugal: A public health concern? Int. J. Environ. Res. Public Health 2020, 17, 1032. [Google Scholar] [CrossRef] [PubMed] [Green Version]
  42. Alves, C.A.; Gonçalves, C.; Evtyugina, M.; Pio, C.A.; Mirante, F.; Puxbaum, H. Particulate organic compounds emitted from experimental wildland fires in a Mediterranean ecosystem. Atmos. Environ. 2010, 44, 2750–2759. [Google Scholar] [CrossRef]
  43. Alves, C.A.; Vicente, A.; Monteiro, C.; Gonçalves, C.; Evtyugina, M.; Pio, C. Emission of trace gases and organic components in smoke particles from a wildfire in a mixed-evergreen forest in Portugal. Sci. Total Environ. 2011, 409, 1466–1475. [Google Scholar] [CrossRef] [PubMed]
  44. Alves, C.; Vicente, A.; Nunes, T.; Gonçalves, C.; Fernandes, A.P.; Mirante, F.; Tarelho, L.; Sanchez de la Campa, A.; Querol, X.; Caseiro, A.; et al. Summer 2009 wildfires in Portugal: Emission of trace gases and aerosol composition. Atmos. Environ. 2011, 45, 641–649. [Google Scholar]
  45. APA—Agência Portuguesa do Ambiente. Available online: https://qualar.apambiente.pt/ (accessed on 25 May 2020).
  46. CAMS—Copernicus Atmosphere Monitoring Service. Available online: http://atmosphere.copernicus.eu (accessed on 25 October 2020).
  47. Hersbach, H.; Bell, B.; Berrisford, P.; Hirahara, S.; Horányi, A.; Muñoz-Sabater, J.; Nicolas, J.; Peubey, C.; Radu, R.; Schepers, D.; et al. The ERA5 global reanalysis. Q. J. R. Meteorol. Soc. 2020, 146, 1999–2049. [Google Scholar] [CrossRef]
  48. Trigo, R.M.; DaCamara, C.C. Circulation weather types and their influence on the precipitation regime in Portugal. Int. J. Climatol. 2000, 20, 1559–1581. [Google Scholar] [CrossRef]
  49. Ramos, A.M.; Sprenger, M.; Wernli, H.; Durán-Quesada, A.; Lorenzo, M.; Gimeno, L. A new circulation type classification based upon Lagrangian air trajectories. Front. Earth Sci. 2014, 2, 29. [Google Scholar] [CrossRef] [Green Version]
  50. Philipp, A.; Bartholy, J.; Beck, C.; Erpicum, M.; Esteban, P.; Huth, R.; James, P.; Jourdain, S.; Krennert, T.; Lykoudis, S.; et al. COST733CAT—A database of weather and circulation type classifications. Phys. Chem. Earth 2010, 35, 360–373. [Google Scholar] [CrossRef]
  51. Sousa, P.M.; Barriopedro, D.; Ramos, A.M.; García-Herrera, R.; Espírito-Santo, F.; Trigo, R.M. Saharan air intrusions as a relevant mechanism for Iberian heatwaves: The record breaking events of August 2018 and June 2019. Weather Clim. Extrem. 2019, 26, 100224. [Google Scholar] [CrossRef]
  52. San-Miguel-Ayanz, J.; Durrant, T.; Boca, R.; Libertà, G.; Branco, A.; de Rigo, D.; Ferrari, D.; Maianti, P.; Vivancos, T.A.; Costa, H.; et al. Forest Fires in Europe, Middle East and North Africa 2017; EUR 29318 EN; Joint Research Centre: Ispra, Italy, 2018; ISBN 978-92-79-92831-4. [Google Scholar]
  53. ICNF—Instituto da Conservação da Natureza e das Florestas. Relatório Provisório de Incêndios Florestais—2017; Departamento de Gestão de áreas Classificadas, Públicas e de Proteção Florestal, Instituto da Conservação da Natureza e das Florestas: Lisboa, Portugal, 2017. Available online: http://www2.icnf.pt/portal/florestas/dfci/Resource/doc/rel/2017/9-rel-prov-1jan-16out-2017_v2.pdf (accessed on 15 October 2019).
  54. CAMS (Copernicus Atmosphere Monitoring Service)—Near Real Time (NRT). Available online: https://atmosphere.copernicus.eu/sites/default/files/2019-03/16_CAMS84_2018SC1_D1.1.1_SON2018_v1.pdf (accessed on 15 October 2020).
  55. Tomás, C.; de Pablo, F.; Rivas Soriano, L. Circulation weather types and cloud-to-ground flash density over the Iberian Peninsula. Int. J. Climatol. 2004, 24, 109–123. [Google Scholar] [CrossRef]
  56. García-Herrera, R.; Paredes, D.; Trigo, R.; Trigo, I.; Hernandez, E.; Barriopedro, D.; Mendes, M. The outstanding 2004/05 drought in the Iberian Peninsula: Associated atmospheric circulation. J. Hydrometeorol. 2007, 8, 483–498. [Google Scholar] [CrossRef] [Green Version]
  57. Directive 2008/50/EC of the European Parliament and of the Council of 21 May 2008 on Ambient air Quality and Cleaner Air for Europe. Available online: http://data.europa.eu/eli/dir/2008/50/2015-09-18 (accessed on 25 October 2020).
  58. Querol, X.; Alastuey, A.; Gangoiti, G.; Perez, N.; Lee, H.K.; Eun, H.R.; Park, Y.; Mantilla, E.; Escudero, M.; Titos, G.; et al. Phenomenology of summer ozone episodes over the Madrid Metropolitan Area, central Spain. Atmos. Chem. Phys. 2018, 18, 6511–6533. [Google Scholar] [CrossRef] [Green Version]
  59. Lonati, G.; Giugliano, M.; Cernuschi, S. The role of traffic emissions from weekends’ and weekdays’ fine PM data in Milan. Atmos. Environ. 2006, 40, 5998–6011. [Google Scholar] [CrossRef]
  60. Guerreiro, C.B.B.; Foltescu, V.; de Leeuw, F. Air quality status and trends in Europe. Atmos. Environ. 2014, 98, 376–384. [Google Scholar] [CrossRef] [Green Version]
  61. Belis, C.A.; Karagulian, F.; Larsen, B.R.; Hopke, P.K. Critical review and meta-analysis of ambient particulate matter source apportionment using receptor models in Europe. Atmos. Environ. 2013, 69, 94–108. [Google Scholar] [CrossRef]
  62. Silva, A.V.; Oliveira, C.M.; Canha, N.; Miranda, A.I.; Almeida, S.M. Long-Term Assessment of Air Quality and Identification of Aerosol Sources at Setúbal, Portugal. Int. J. Environ. Res. Public Health 2020, 17, 5447. [Google Scholar] [CrossRef]
Figure 1. Location of the air quality monitoring stations.
Atmosphere 12 00085 g001
Figure 2. Average mean sea level pressure for each circulation weather type (CWT), centered over mainland Portugal during 2006–2018.
Atmosphere 12 00085 g002
Figure 3. Weekly (upper panel), monthly (middle panel) and annual (lower panel) PM10 and PM2.5 values for mainland Portugal between 2006 and 2018. Small dots represent outliers.
Atmosphere 12 00085 g003aAtmosphere 12 00085 g003b
Figure 4. Box–Whiskers plots with the concentrations of PM10 and PM2.5 coherent with the results obtained through the CWT methodology for all the monitoring stations over the period 2006–2018. The box and whiskers present the median, the first and third quartiles, the minimum and maximum value and possible outliers. Small dots represent outliers.
Atmosphere 12 00085 g004
Figure 5. Composites for mean sea level pressure (MSLP) (hPa) and 500 hPa geopotential height (Z500) (m) fields for the four circulation types characterized by the highest median pollutant concentrations for the period 2006–2018. Colors show the averaged Z500 and lines display MSLP levels.
Atmosphere 12 00085 g005
Figure 6. PM10 (top) and PM2.5 (bottom) hourly values observed at local monitoring stations over the period 6th–20th October 2017 (colored lines). Large fires occurred over 15th–17th October 2017 (grey area). The horizontal line depicts the PM10 and PM2.5 legal threshold values. The upper x-axis represents the prevailing CWT in each day.
Atmosphere 12 00085 g006
Figure 7. PM10 (upper panel) and PM2.5 (lower panel) maximum concentrations extracted through the near-real time data from Copernicus Atmosphere Monitoring Service (CAMS-NRT) and CWT observed over the period 9th–17th October 2017.
Atmosphere 12 00085 g007
Figure 8. Similar to Figure 6, but for August 2018. The Monchique fire occurred over 3rd and 10th of August (grey area). The red bar highlights the days under the heatwave conditions. The upper x-axis represents the prevailing CWT in each day.
Atmosphere 12 00085 g008
Figure 9. PM10 (upper panel) and PM2.5 (lower panel) maximum concentrations extracted through the near-real time data from Copernicus Atmosphere Monitoring Service (CAMS-NRT) and CWT observed over the period 2nd–10thAugust 2018.
Atmosphere 12 00085 g009
Table 1. Air quality data information (Monitoring stations’ Id, altitude and location) and basic statistics of pollutants.
StationIdAltitude (m)LatitudeLongitudePM10PM2.5
Mean Value (µg/m3)Max Value (µg/m3)Mean Value (µg/m3)Max Value (µg/m3)
Chamusca114339°21′09″−8°27′58″16.77203.138.83148.0
Ervedeira26039°55′26″−8°53′30″20.621000.010.66120.0
Estarreja31540°45′31″−8º34′02″28.50311.015.61241.0
Fundão447340°13′59″−7°18′07″13.57367.06.58232.0
Ílhavo53240°35′23″−8°40′14″24.83237.0--
Instituto Geofísico de Coimbra614540°12′25″−8°24′39″20.84287.0--
Loures-Centro71038°49′47″−9°09′52″22.56185.37--
Olivais83238°46′08″−9°06′29″23.88167.6112.12112.0
Terena918738°36′54″−7°23′51″21.83640.011.982060.0
Malpique104537°05′30″−8°14′59″22.38273.9--
Lamas d’Olo11108641°22′17″−7°47′27″15.68288.05.34107.0
Alcoutim1230037°18′45″−7°40′43″15.08278.16.50138.0
Vermoim139041°14′08″−8°37′07″31.28337.08.53319.0
Table 2. Seasonal (and annual, light gray row) relative frequencies (in %) of each CWT during 2006–2018.
NEESESSWWNWNCATotal
Winter (DJF)5.86.93.33.97.711.26.46.36.142.4100.0
Spring (MAM)13.48.32.41.25.68.08.611.712.927.8100.0
Summer (JJA)26.02.00.10.21.33.79.726.66.723.7100.0
Autumn (SON)14.58.81.92.18.97.56.17.612.130.4100.0
Year14.96.52.01.95.97.67.713.19.431.1100.0
Publisher’s Note: MDPI stays neutral with regard to jurisdictional claims in published maps and institutional affiliations.

