Aridity in the Central and Southern Pannonian Basin

 ,
,  ,
,  , , ,
, , , 
Abstract
1. Introduction
2. Study Areaand Data
2.1. Study Area
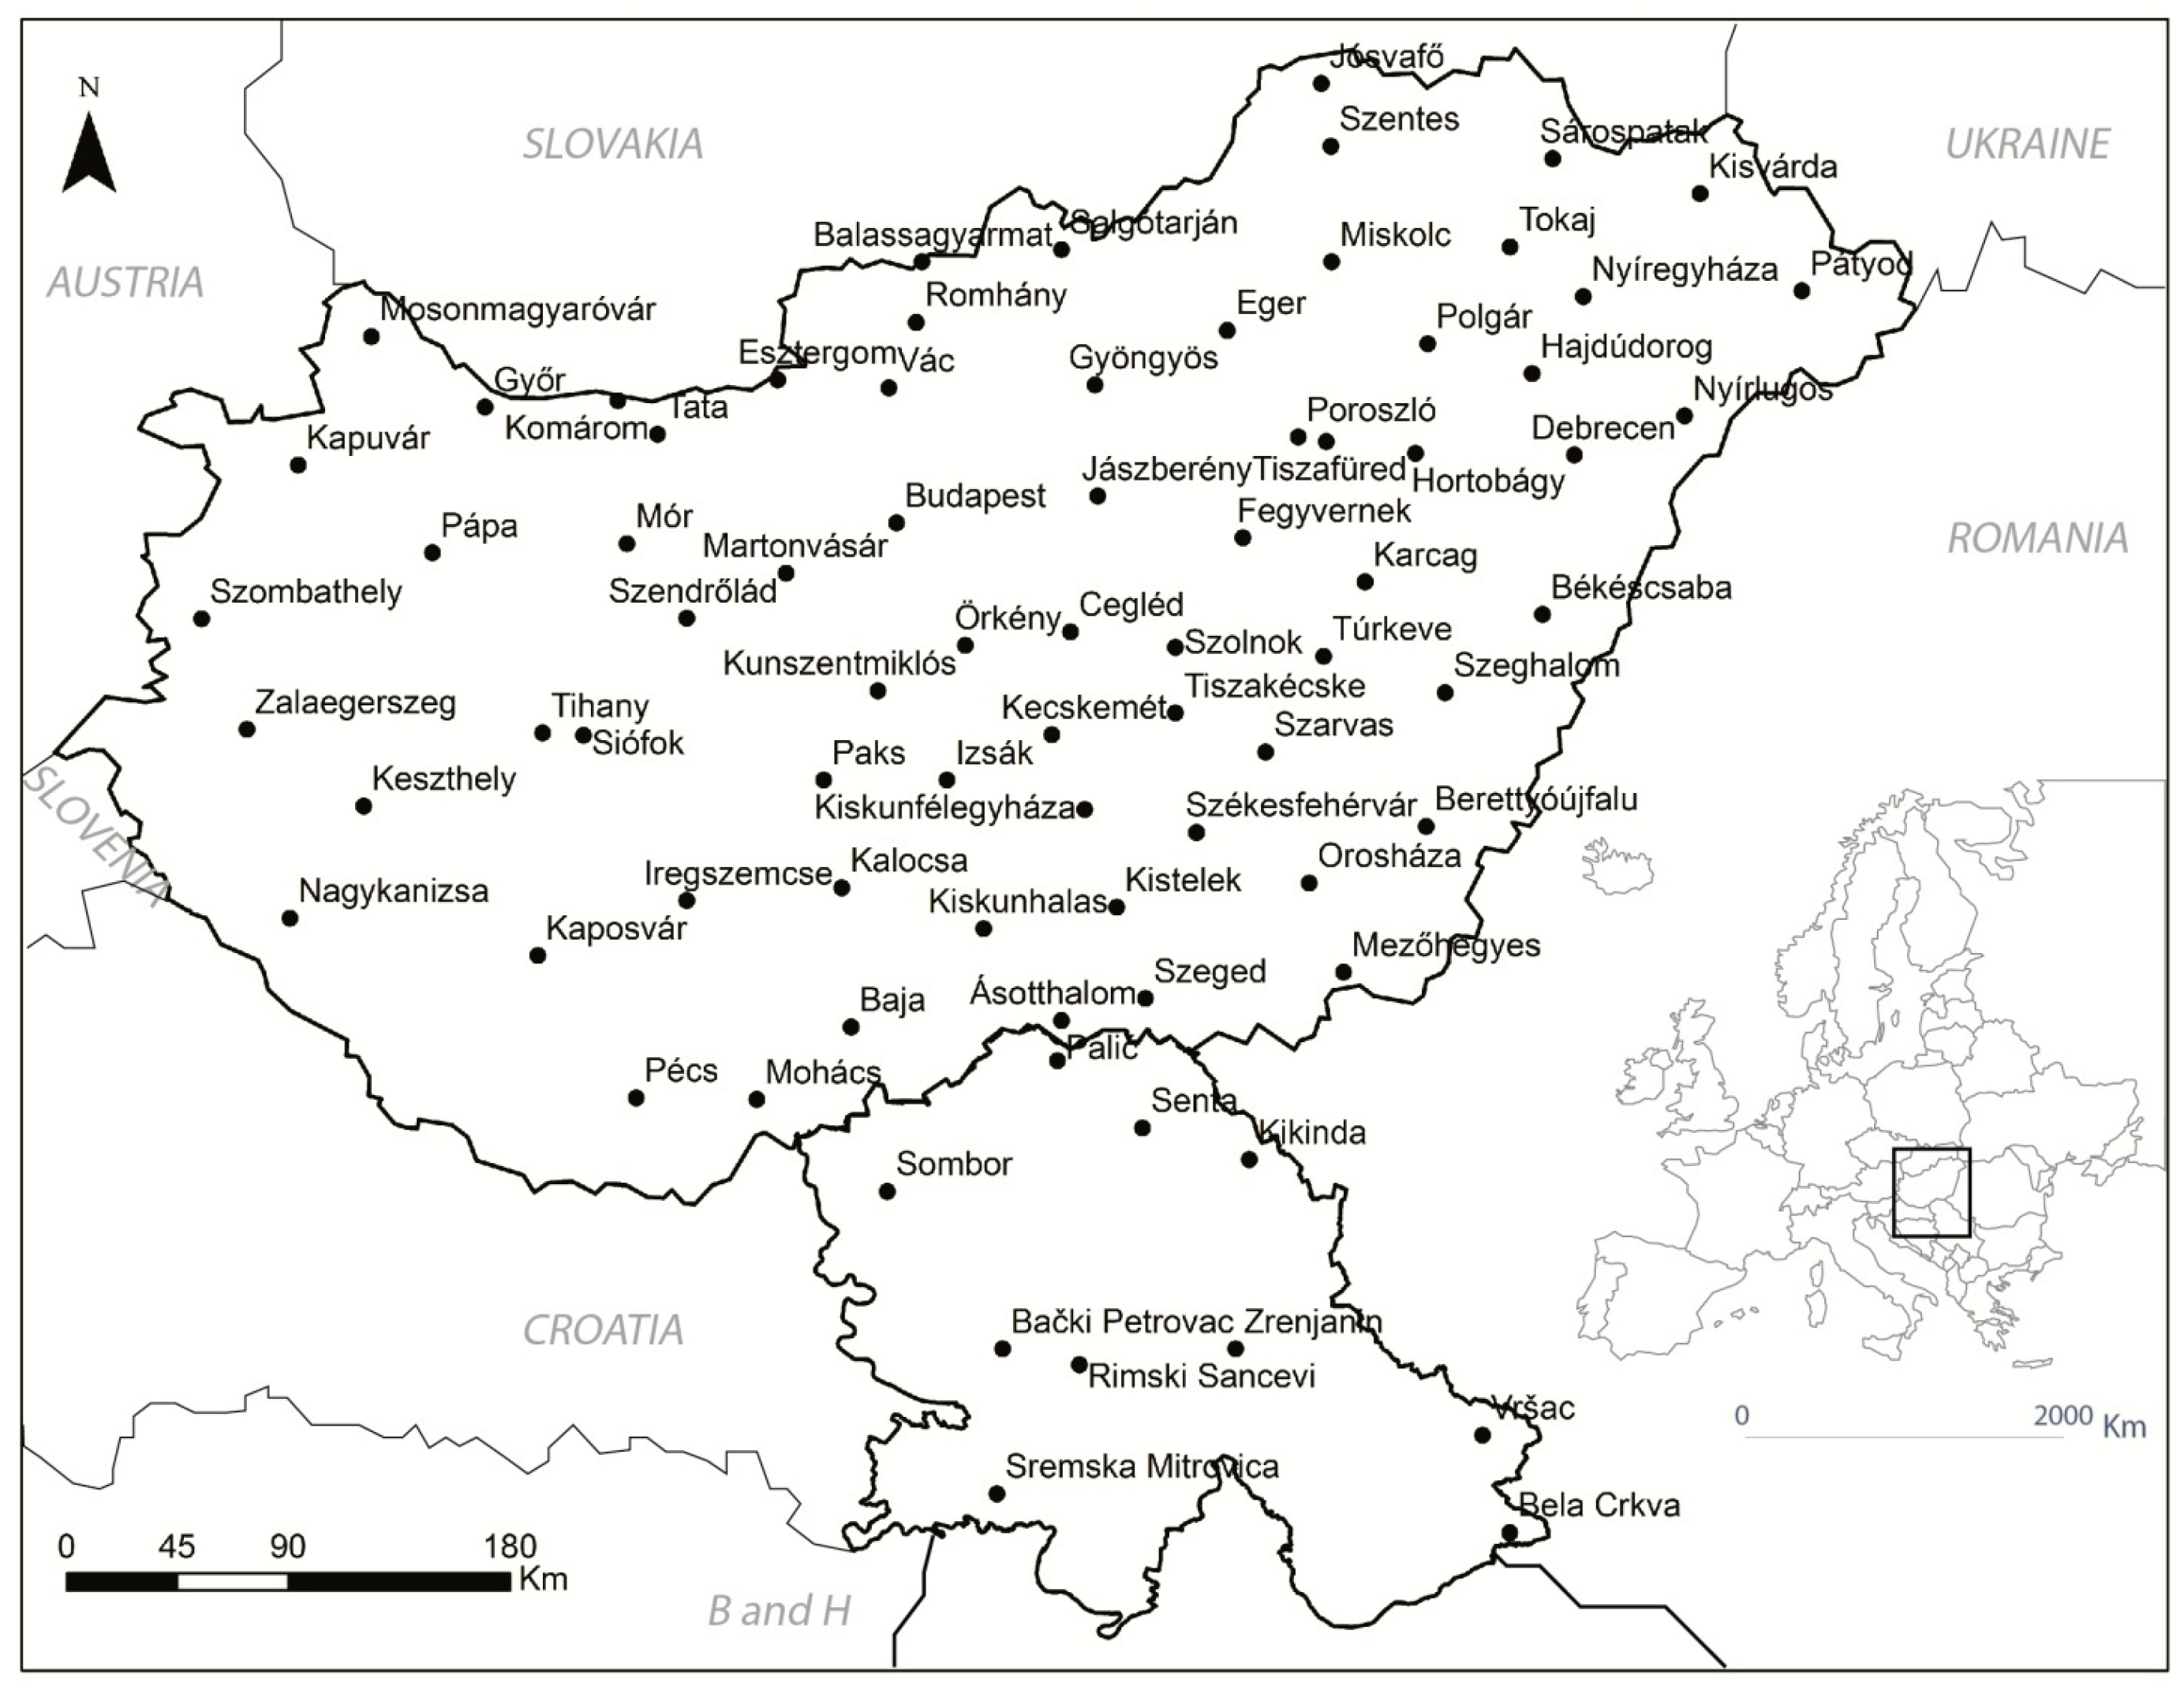
2.1.1. Hungary
2.1.2. Vojvodina
2.2. Data
3. Methods
3.1. The De Martonne Aridity Index
3.2. The Palmer Drought Severity Index
3.3. Trend
3.4. Software
4. Results
4.1. The Distribution of Aridity
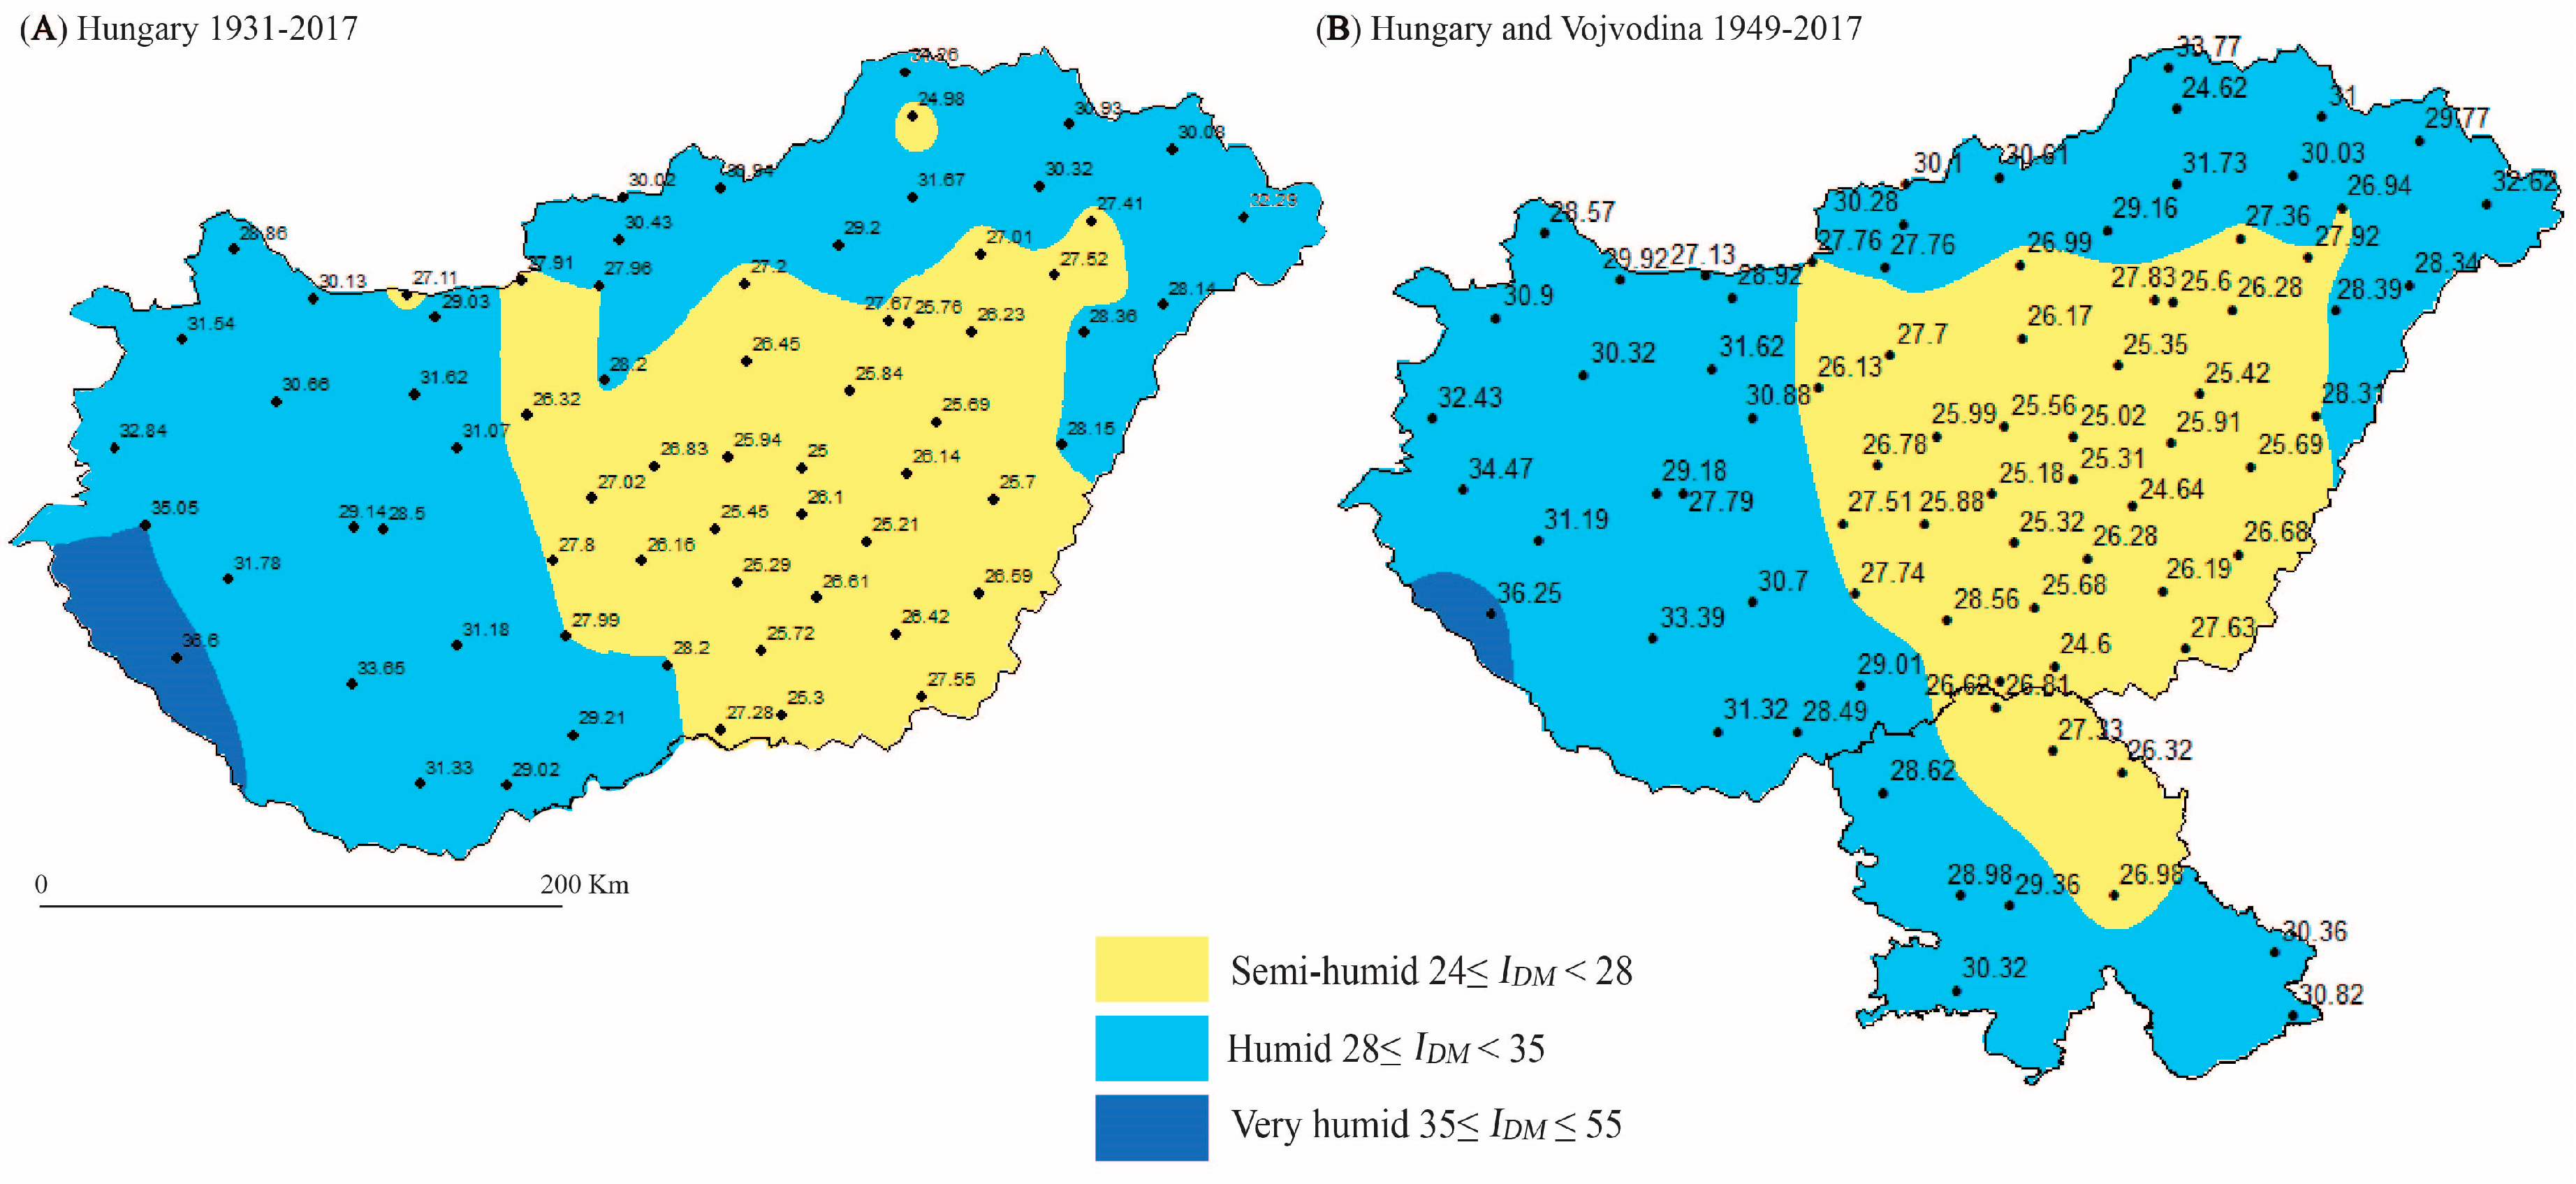
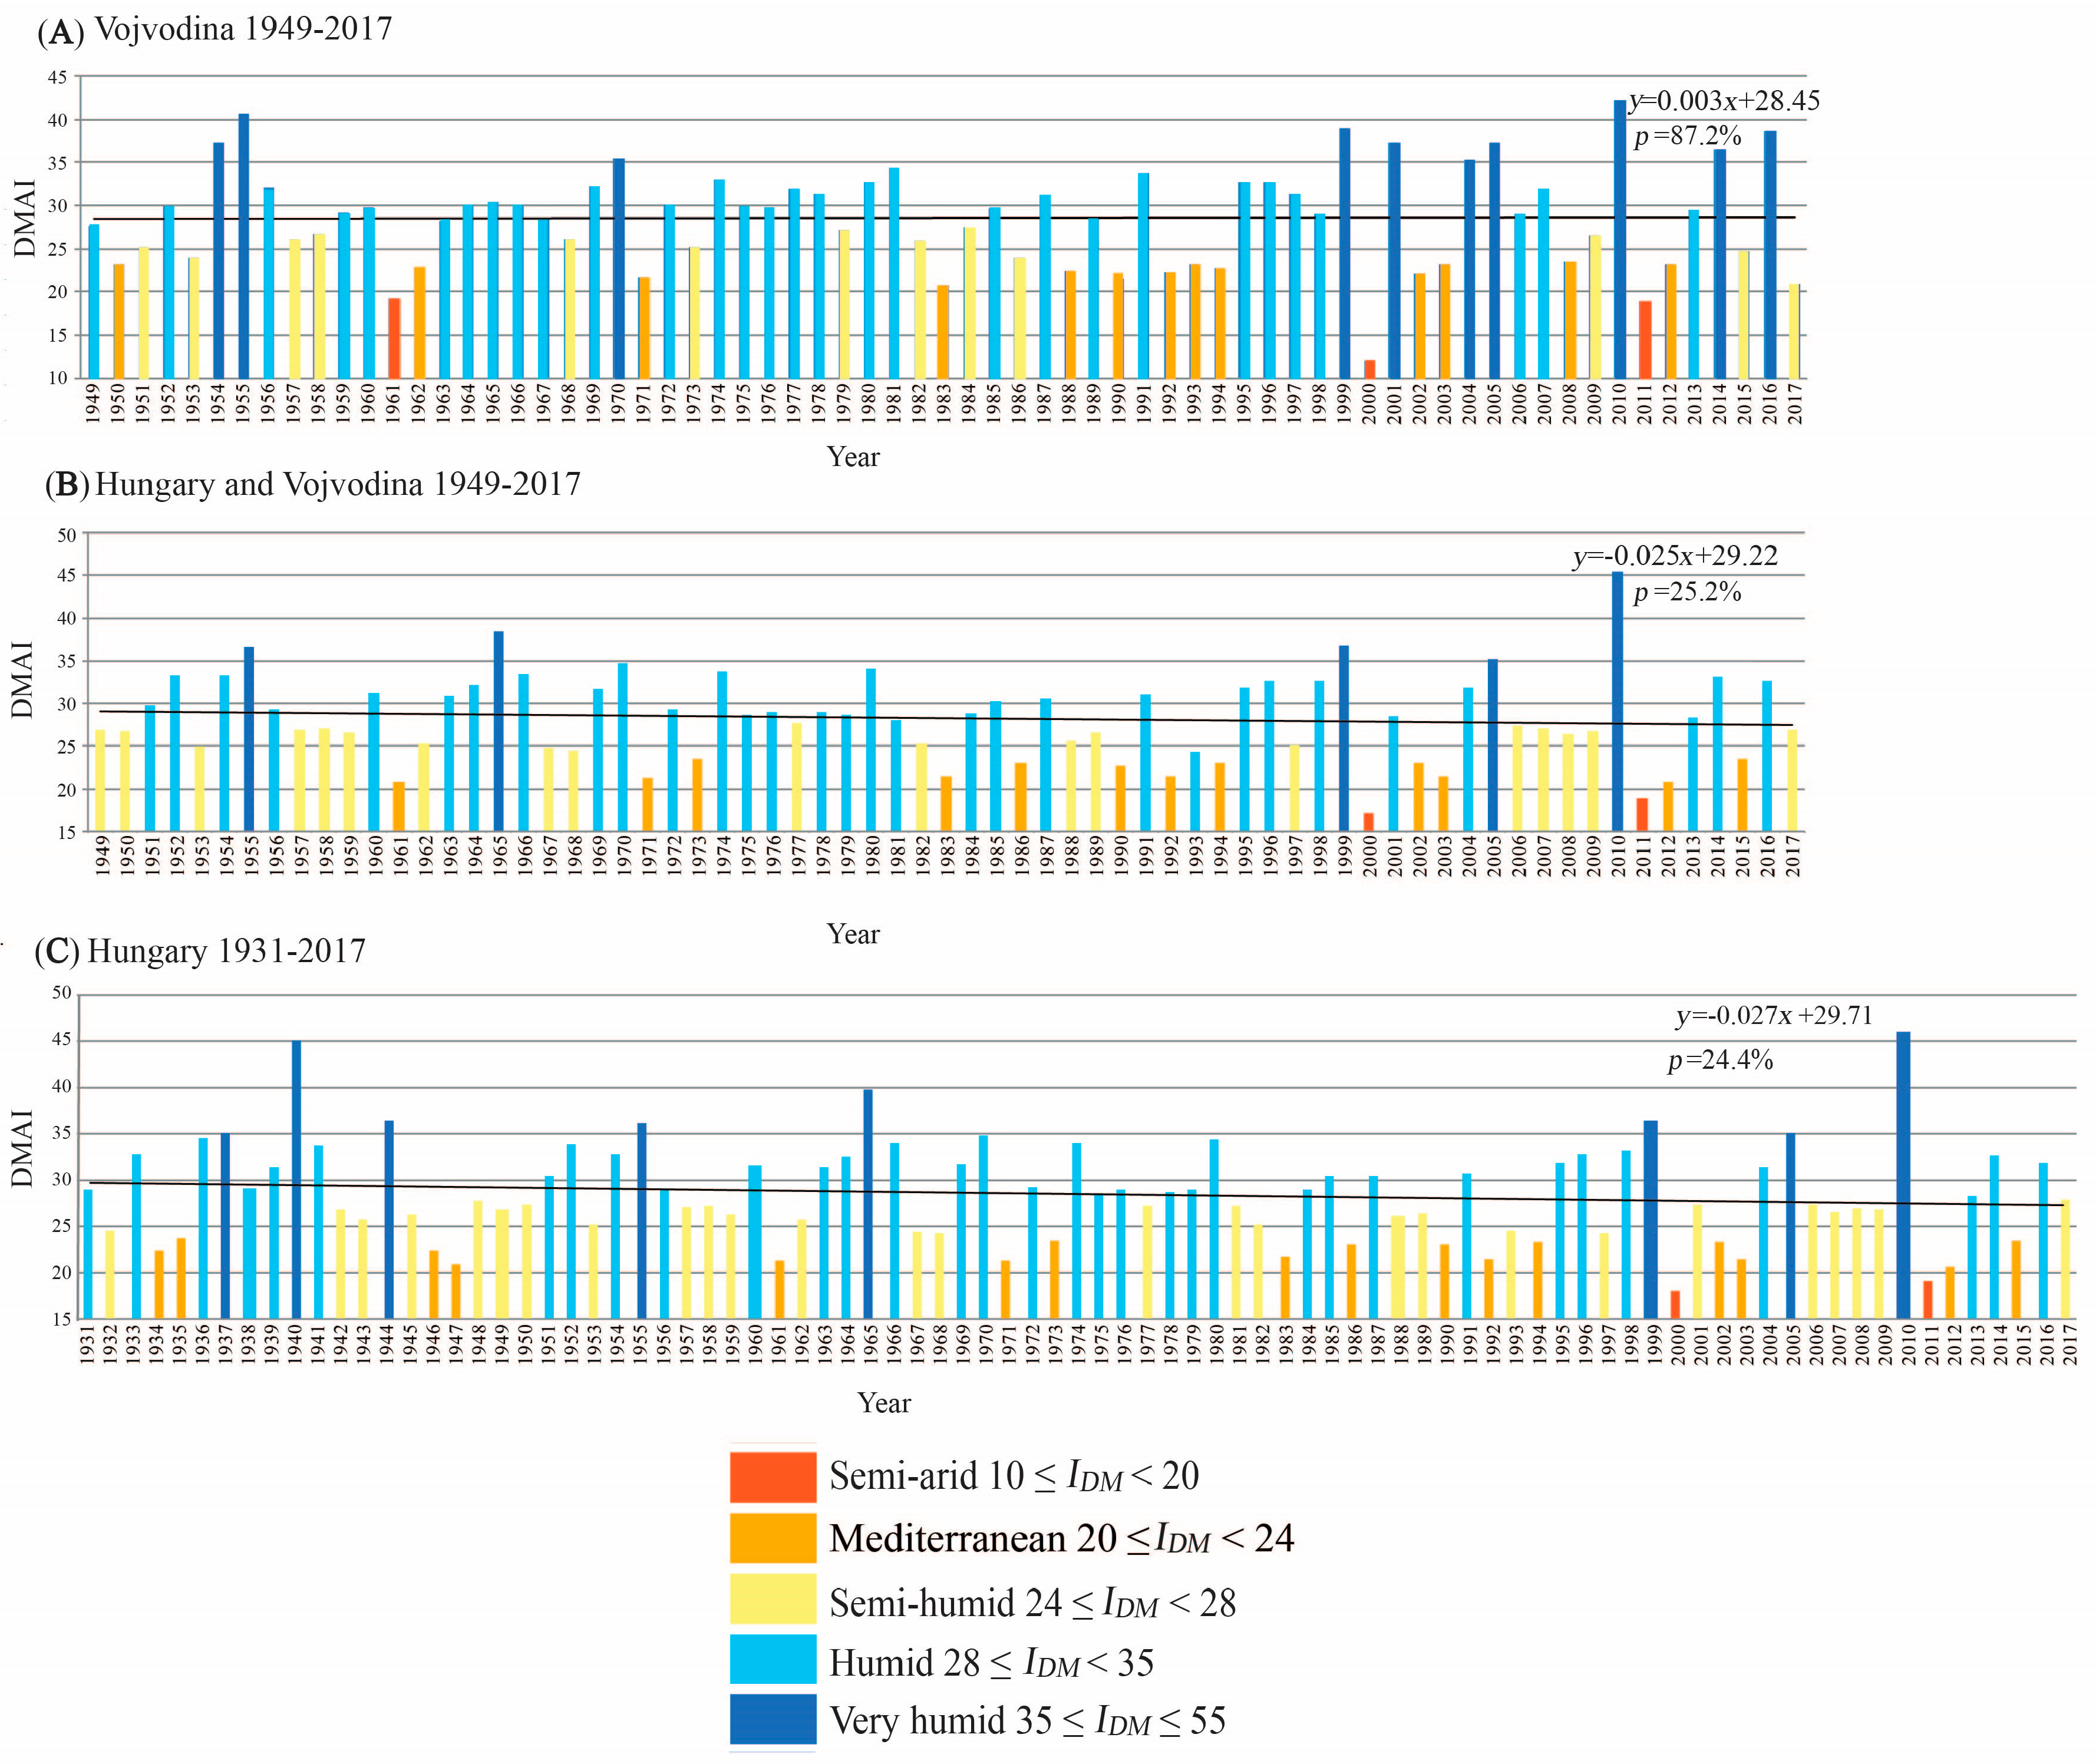
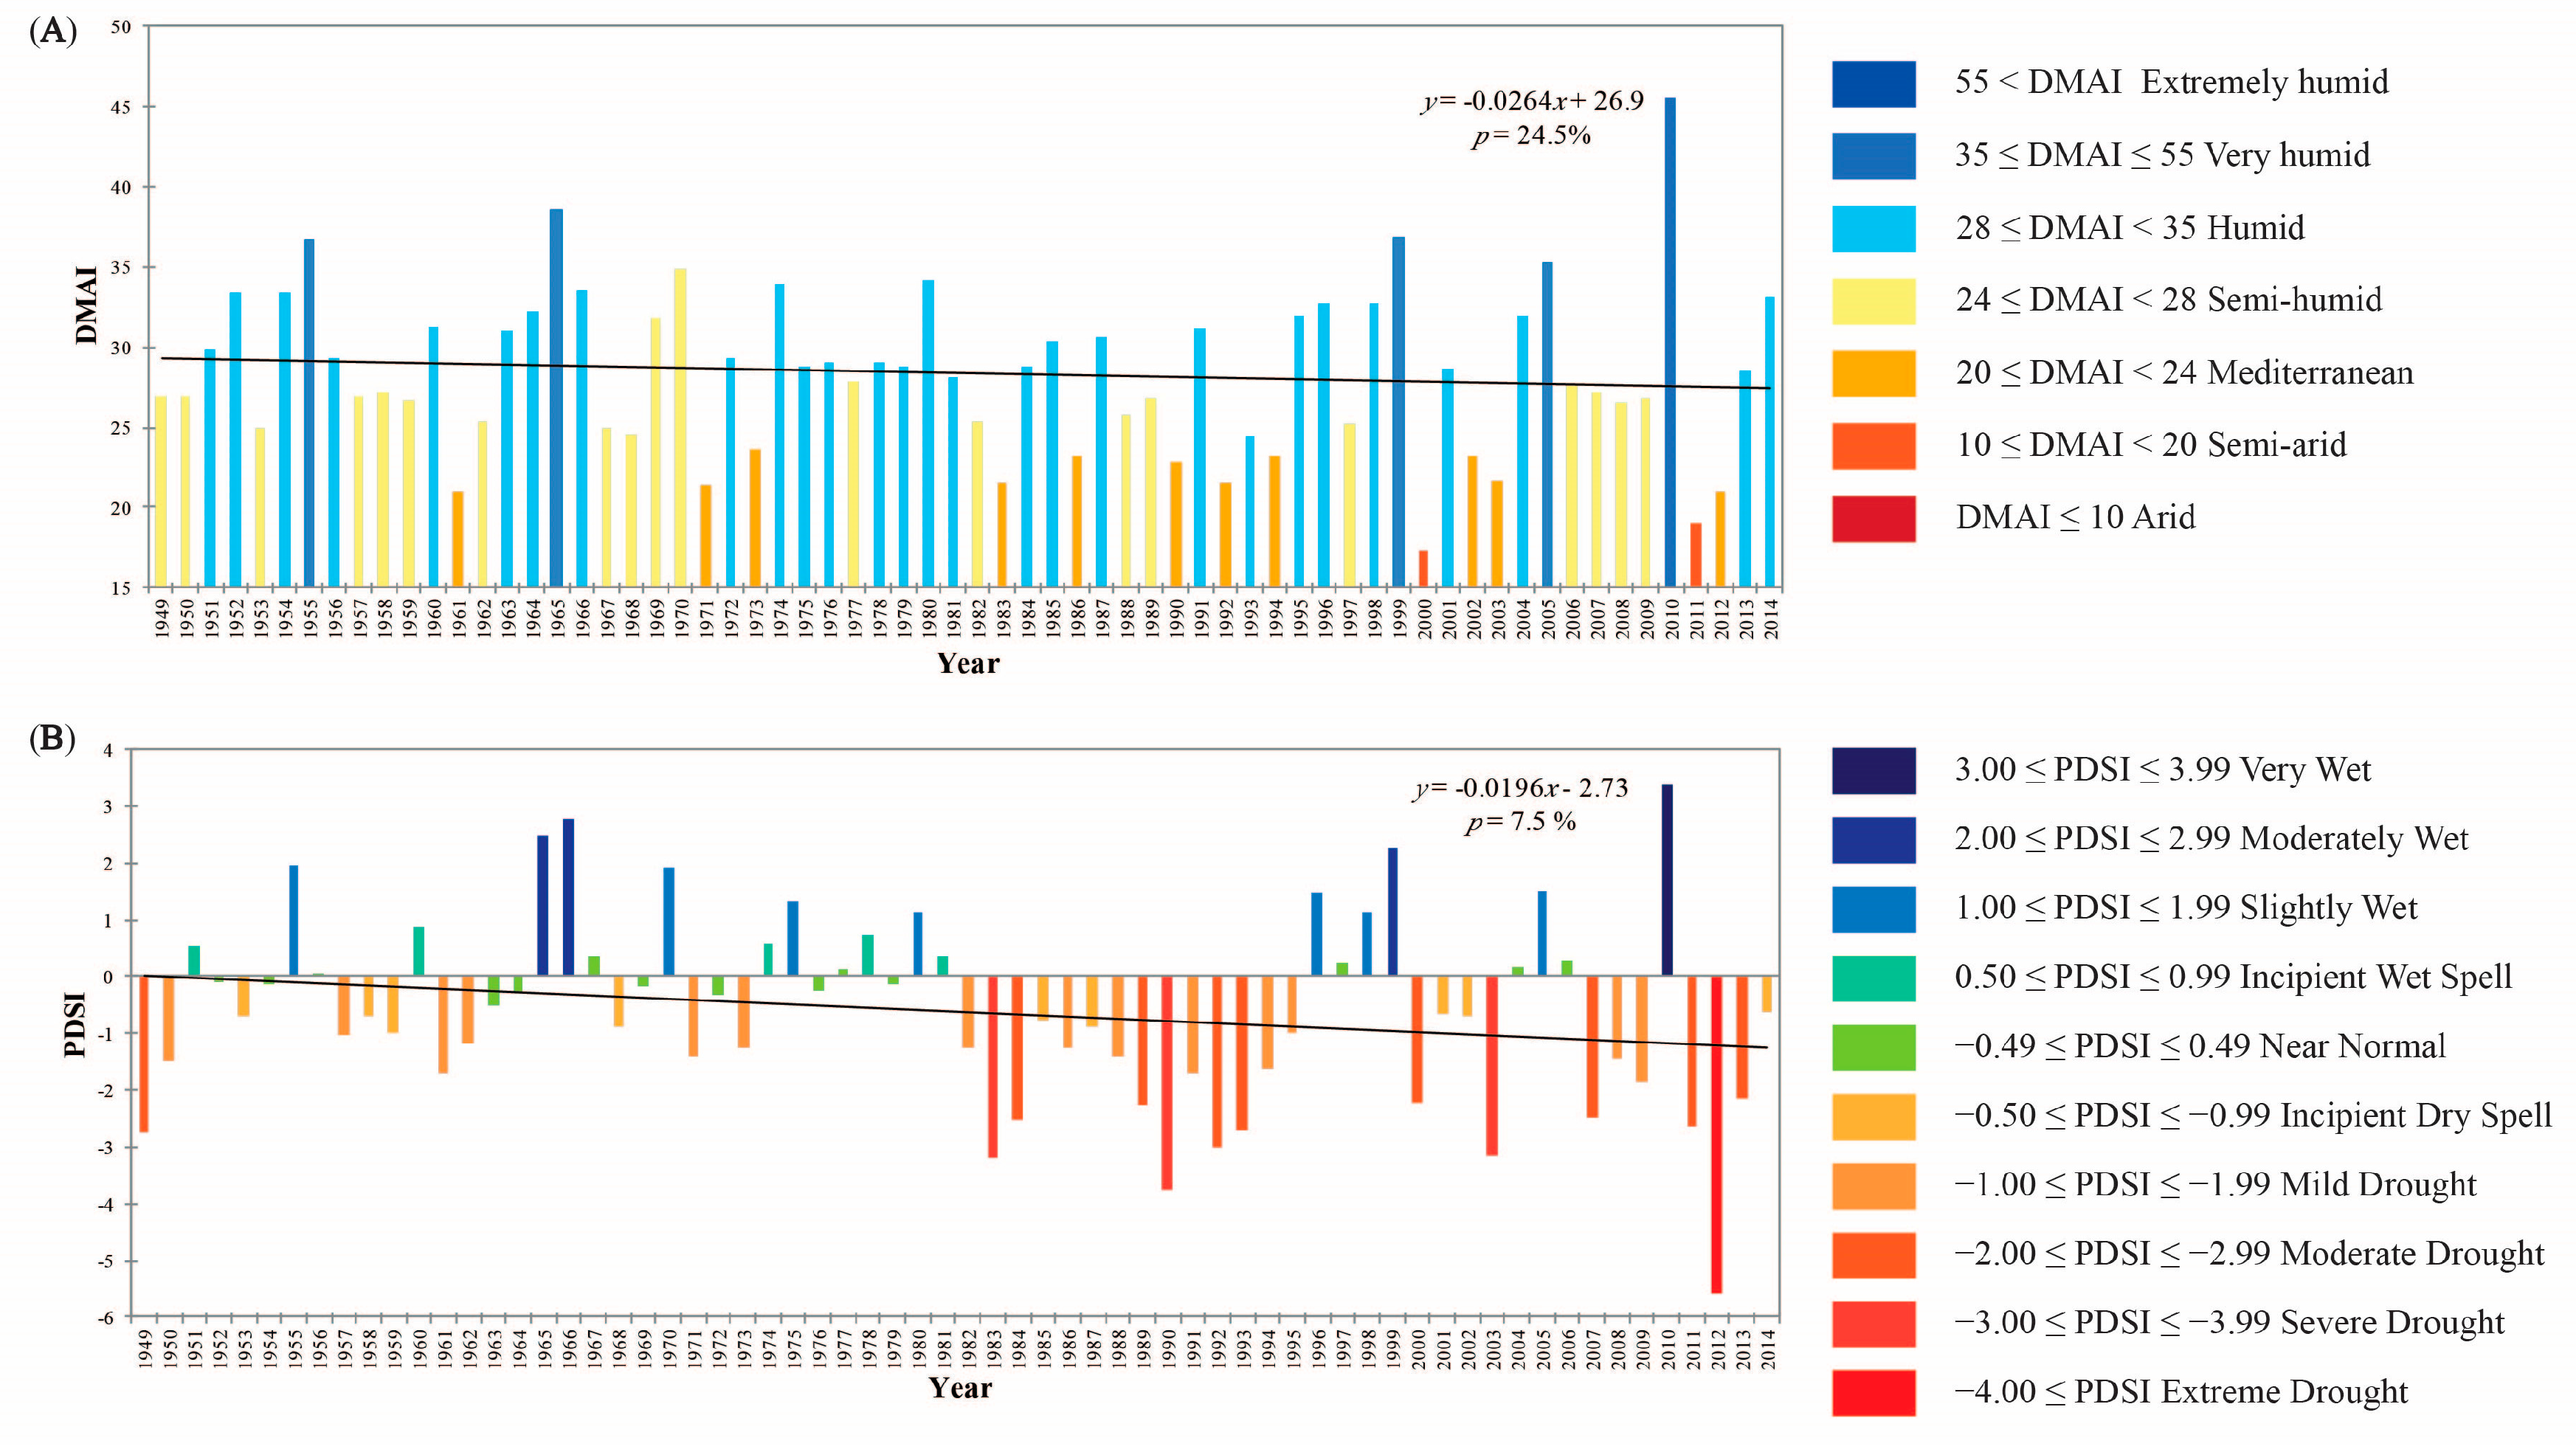
4.1.1. The Annual DMAI
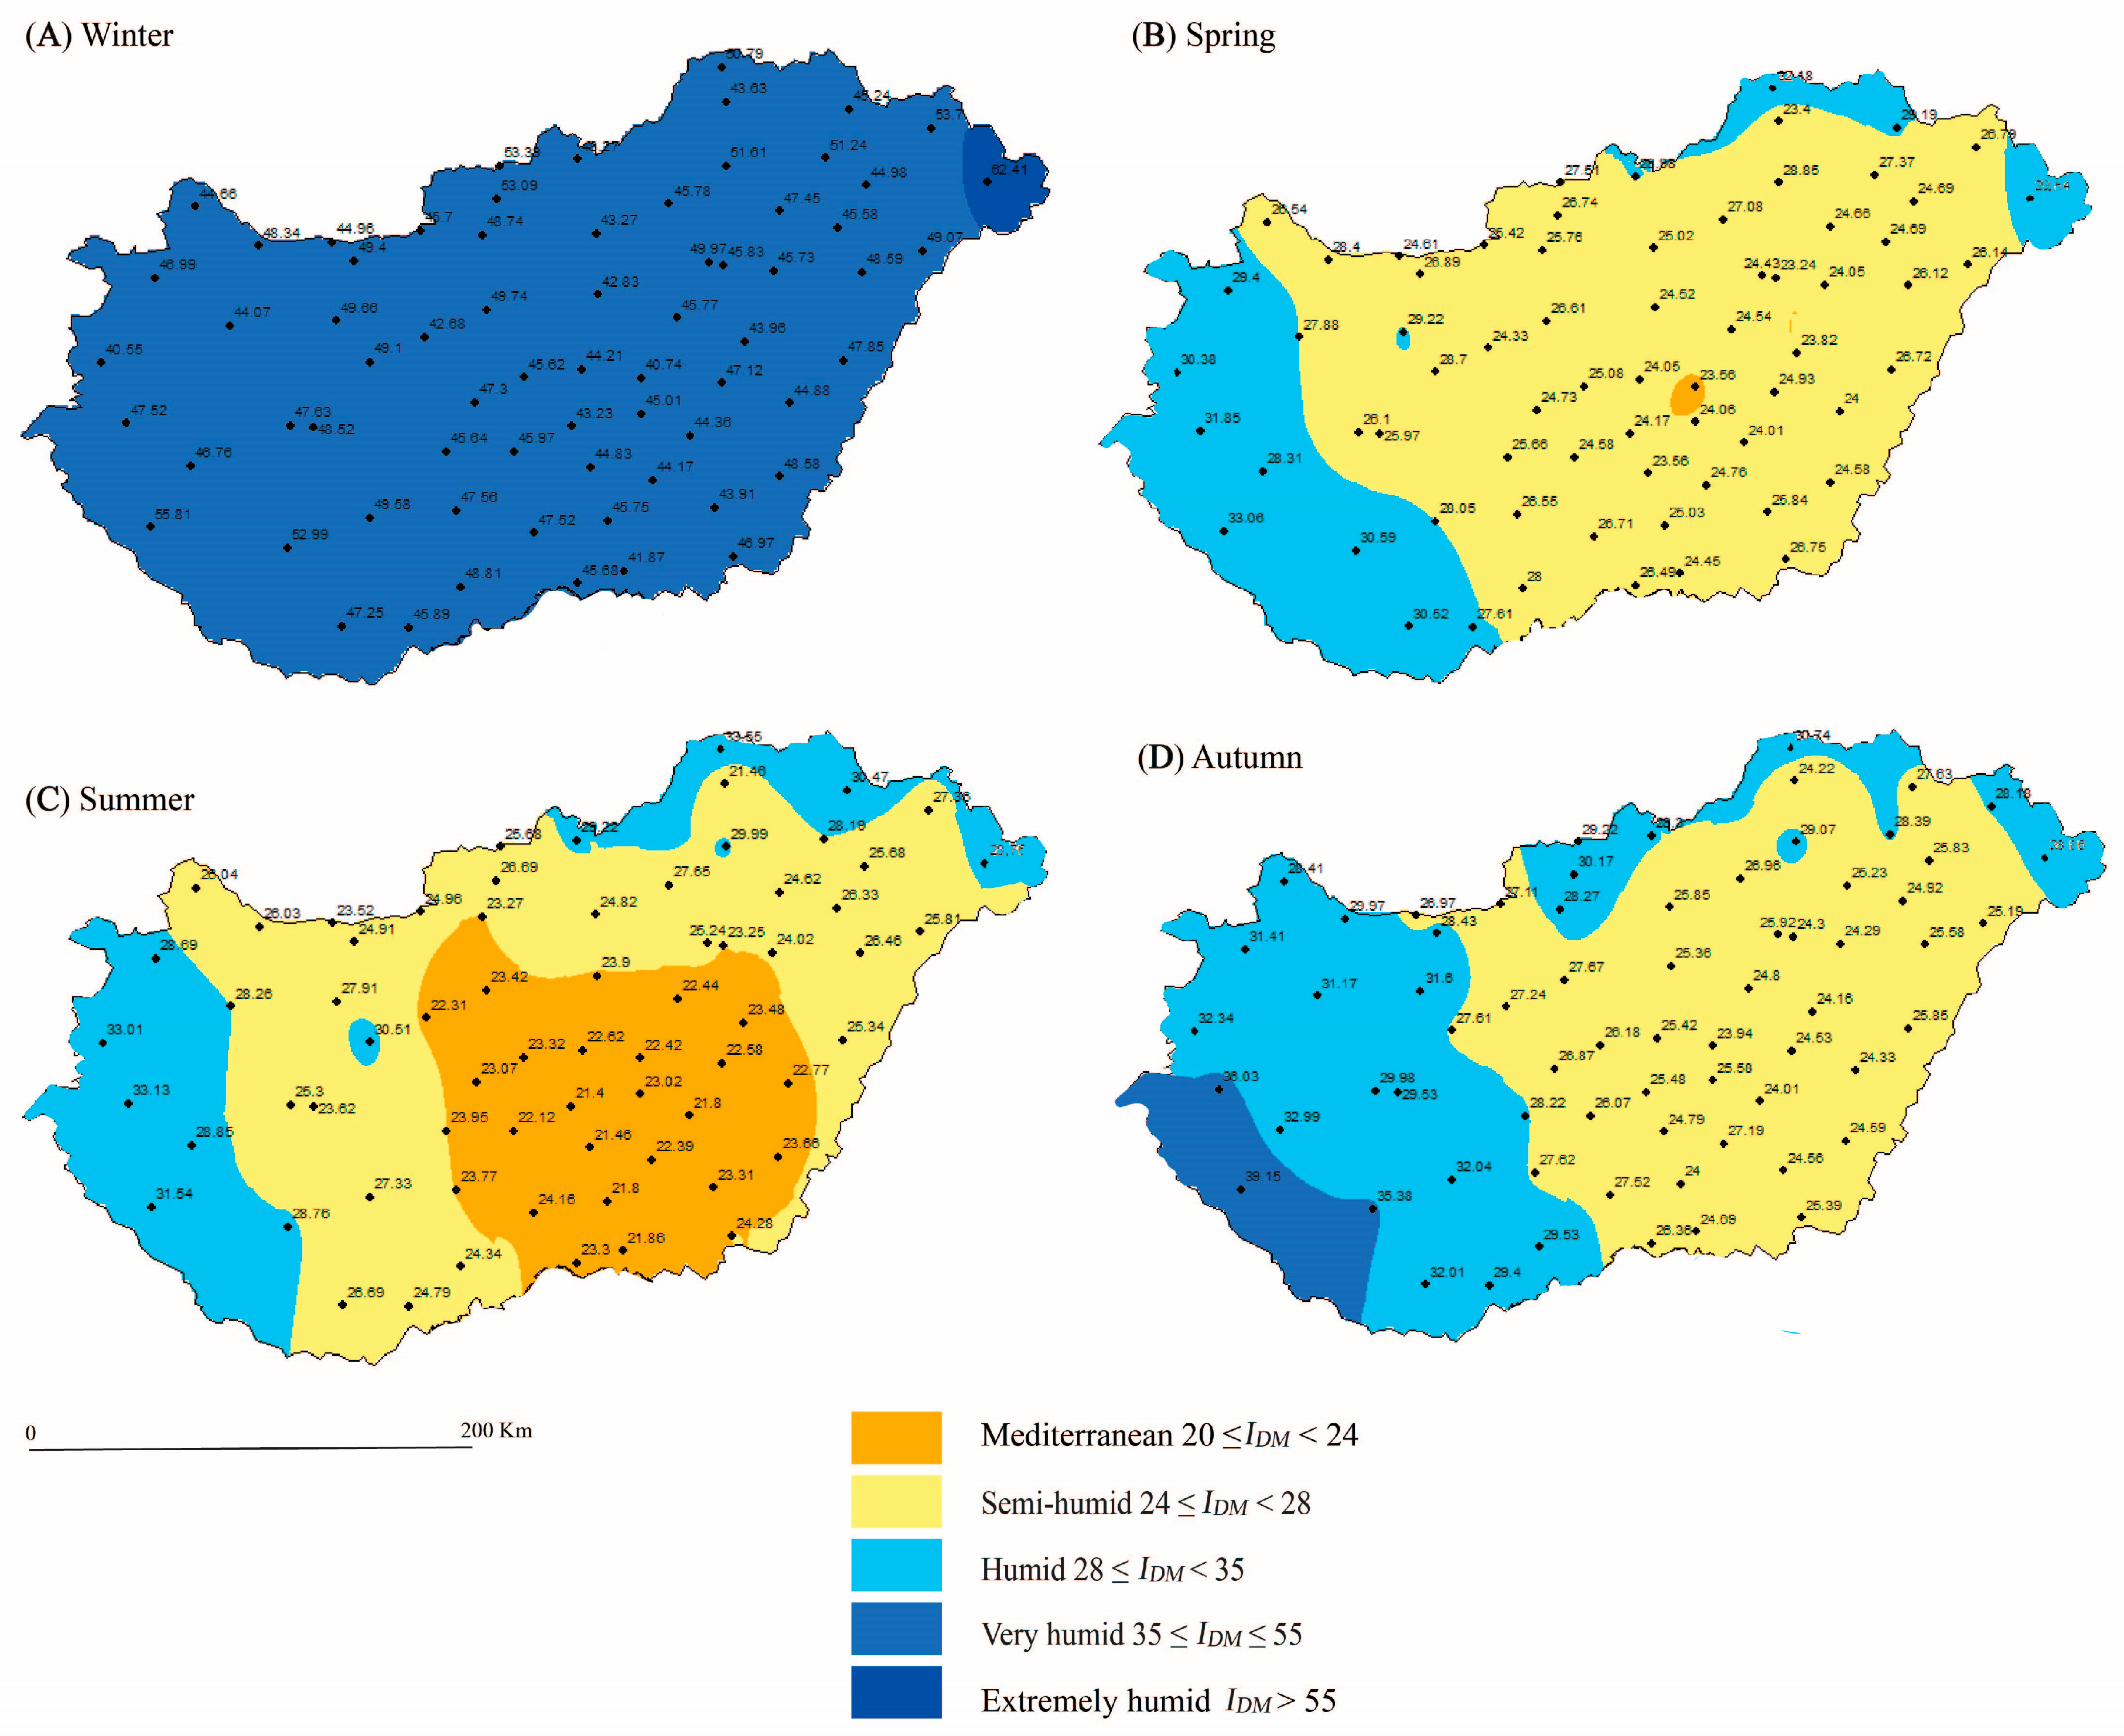
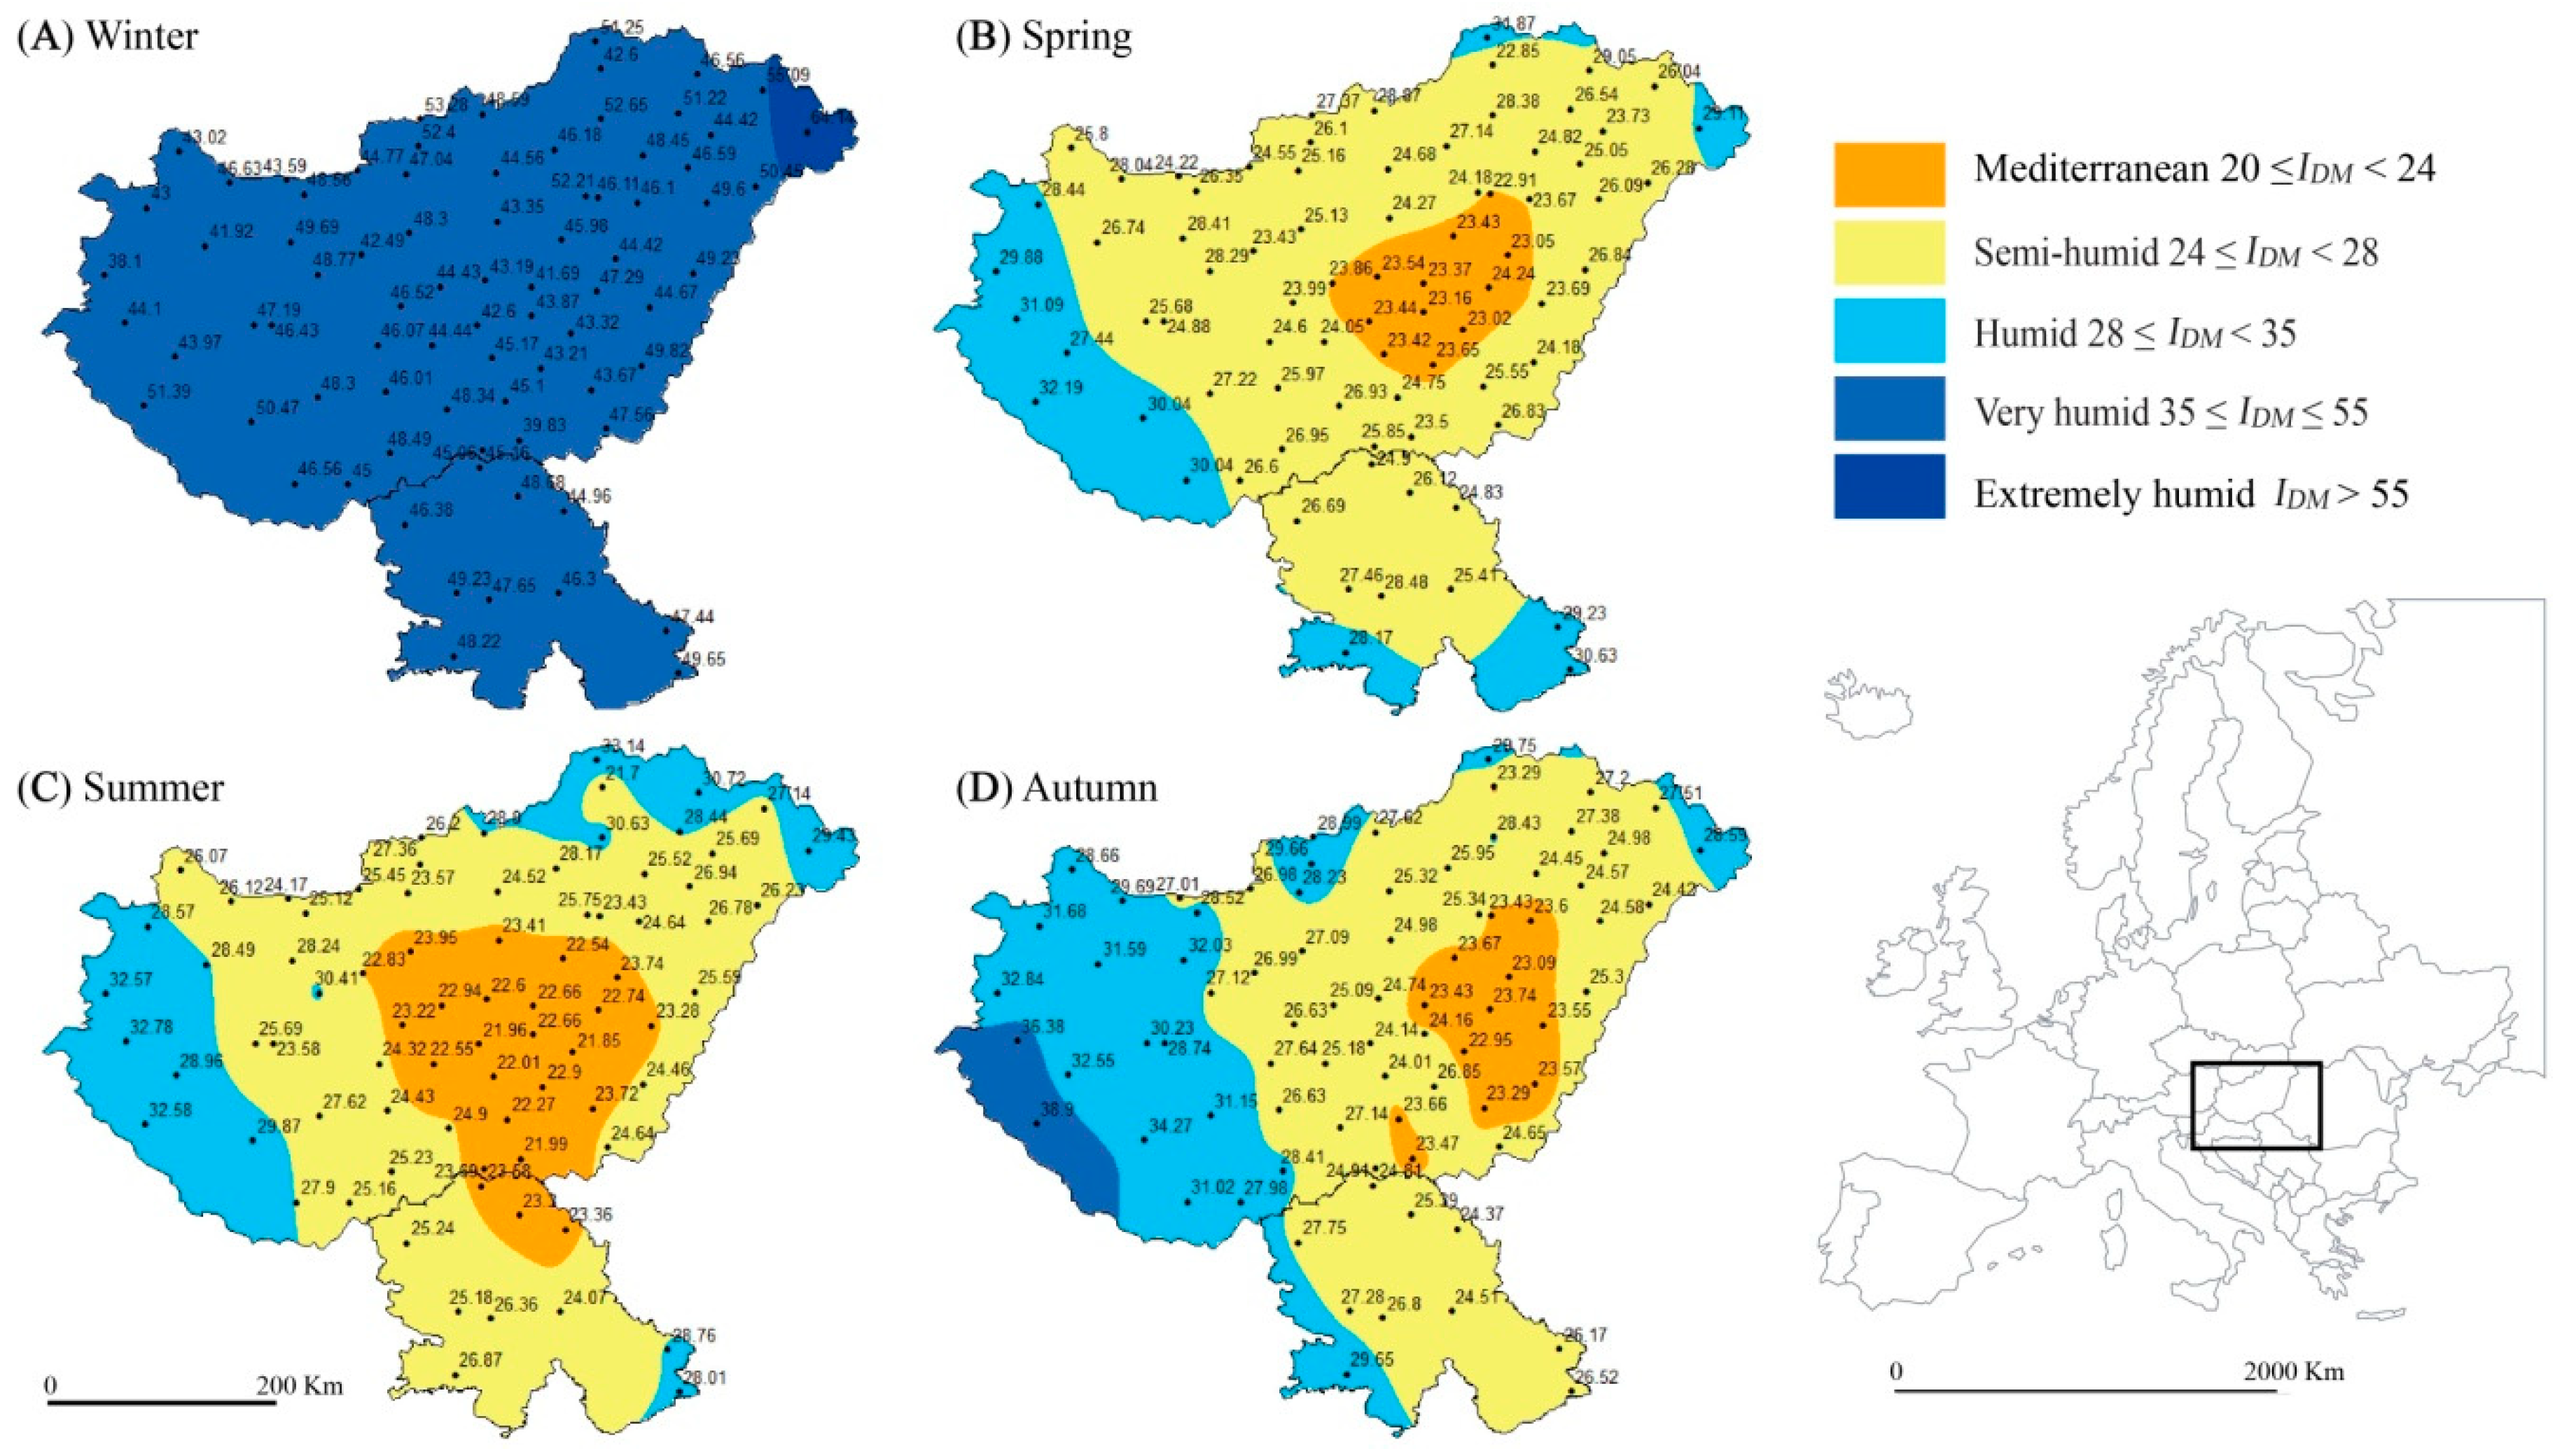
4.1.2. The Seasonal DMAI
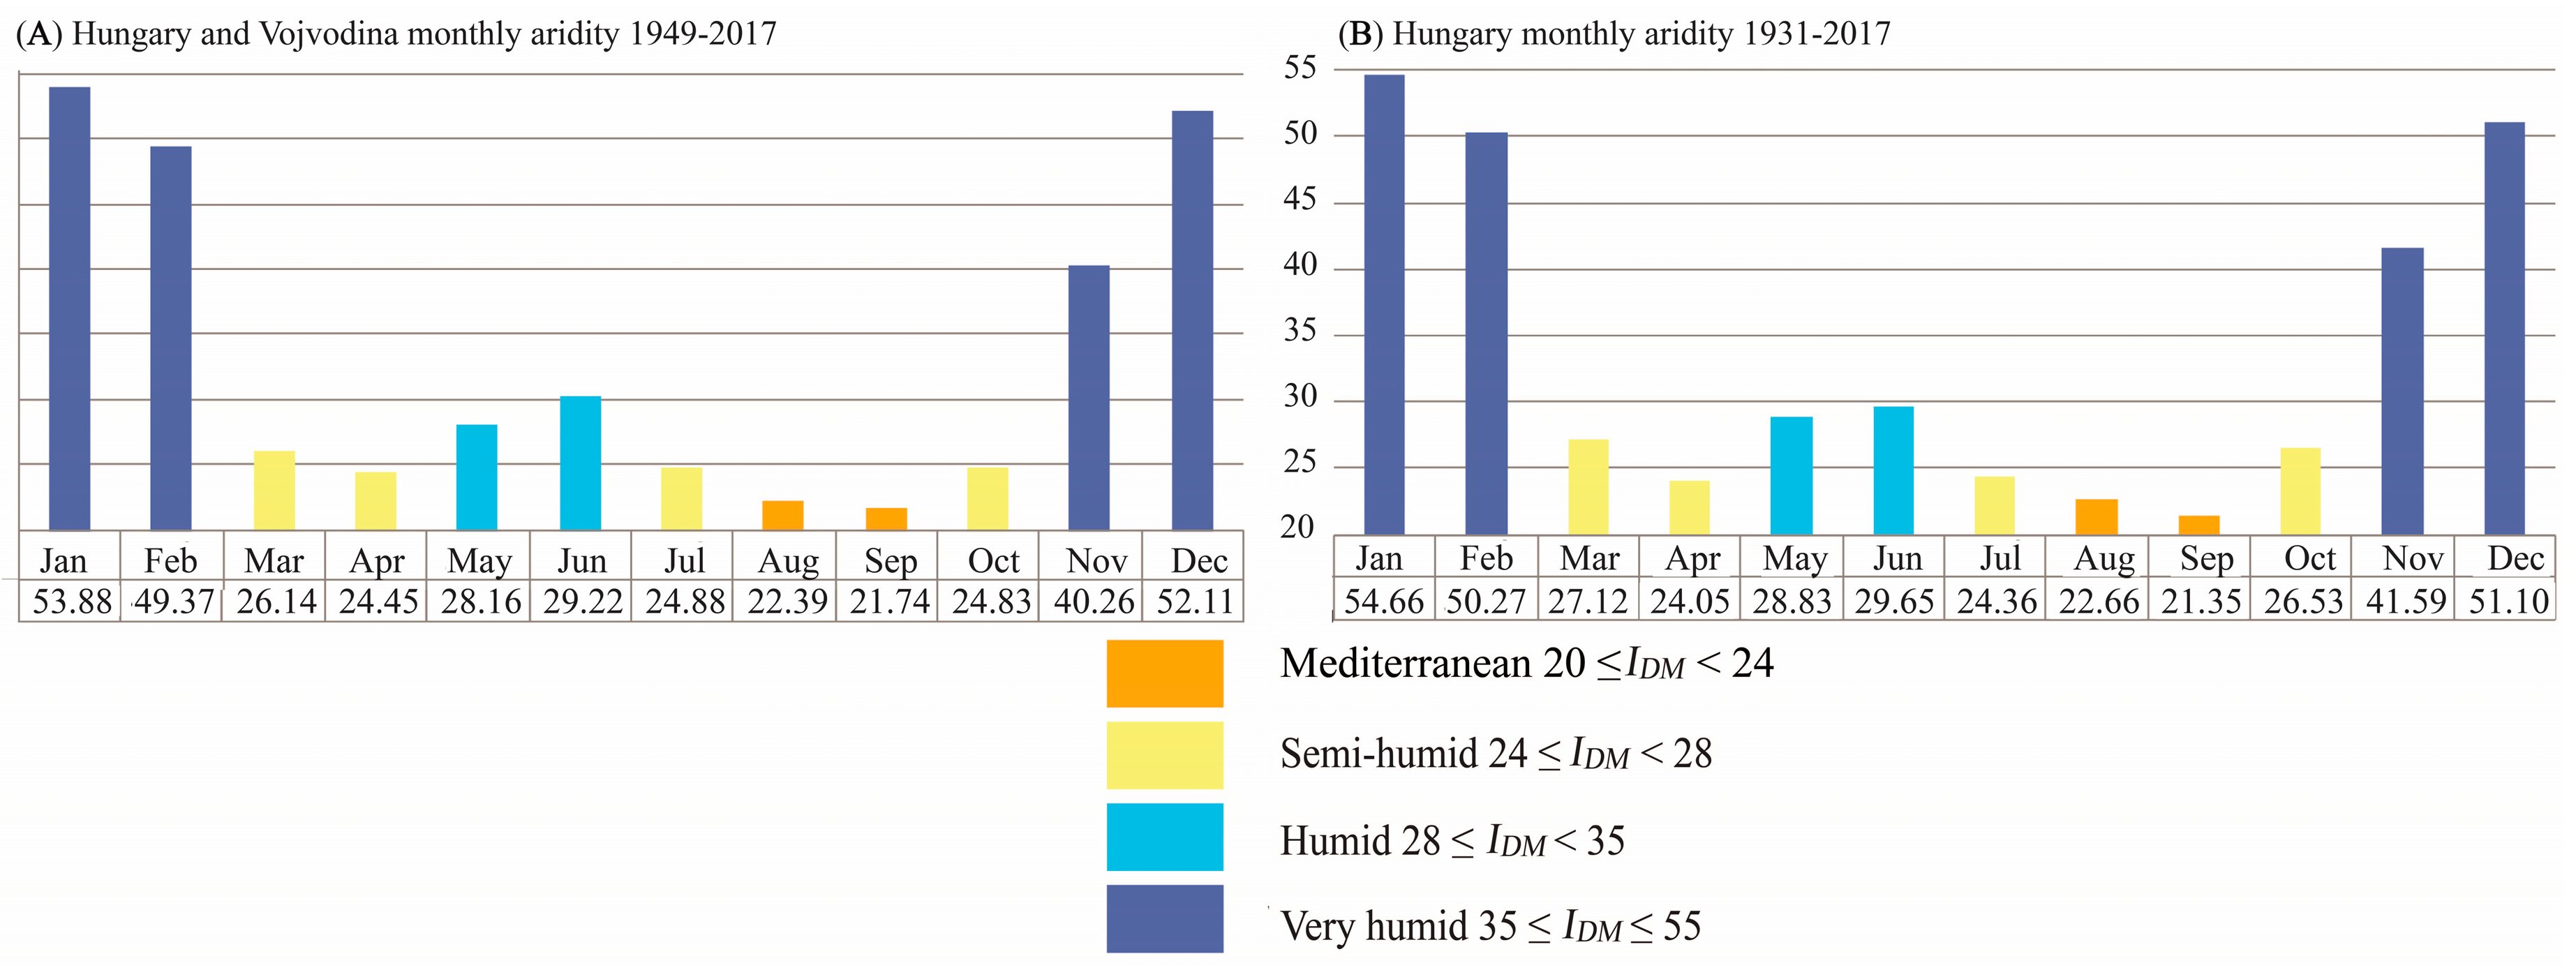
4.1.3. The Monthly DMAI
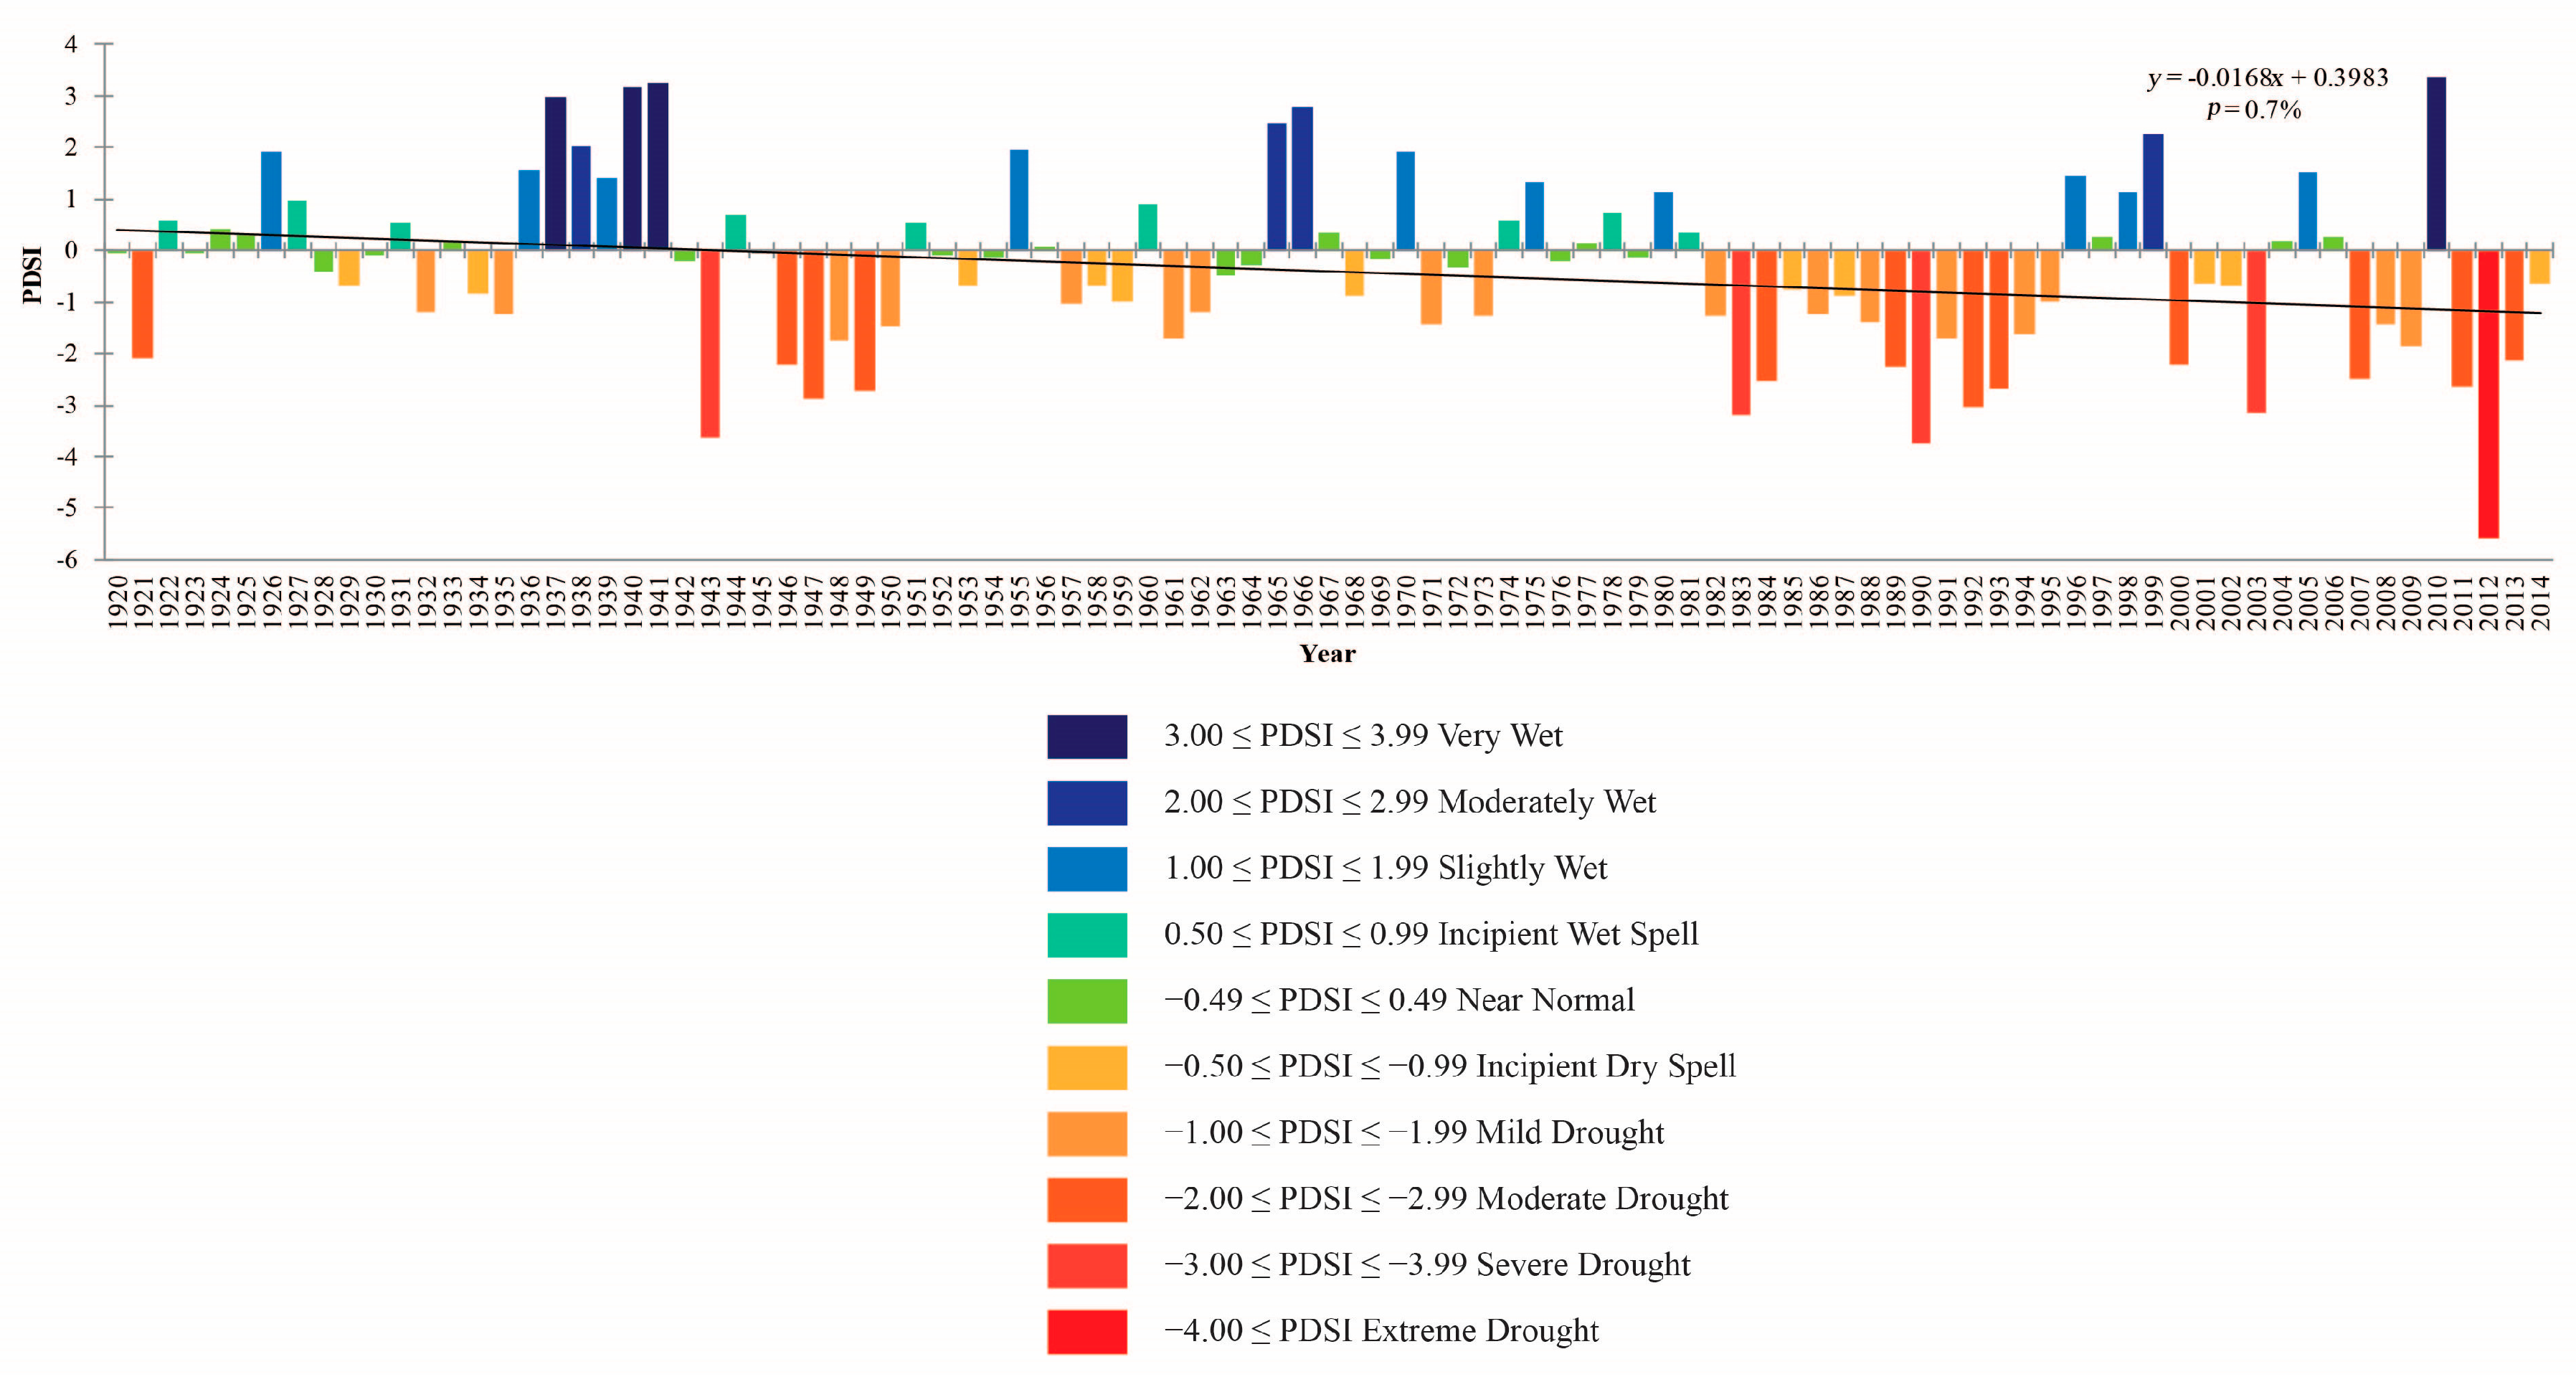
4.2. The Time-Spatial Distribution of PDSI
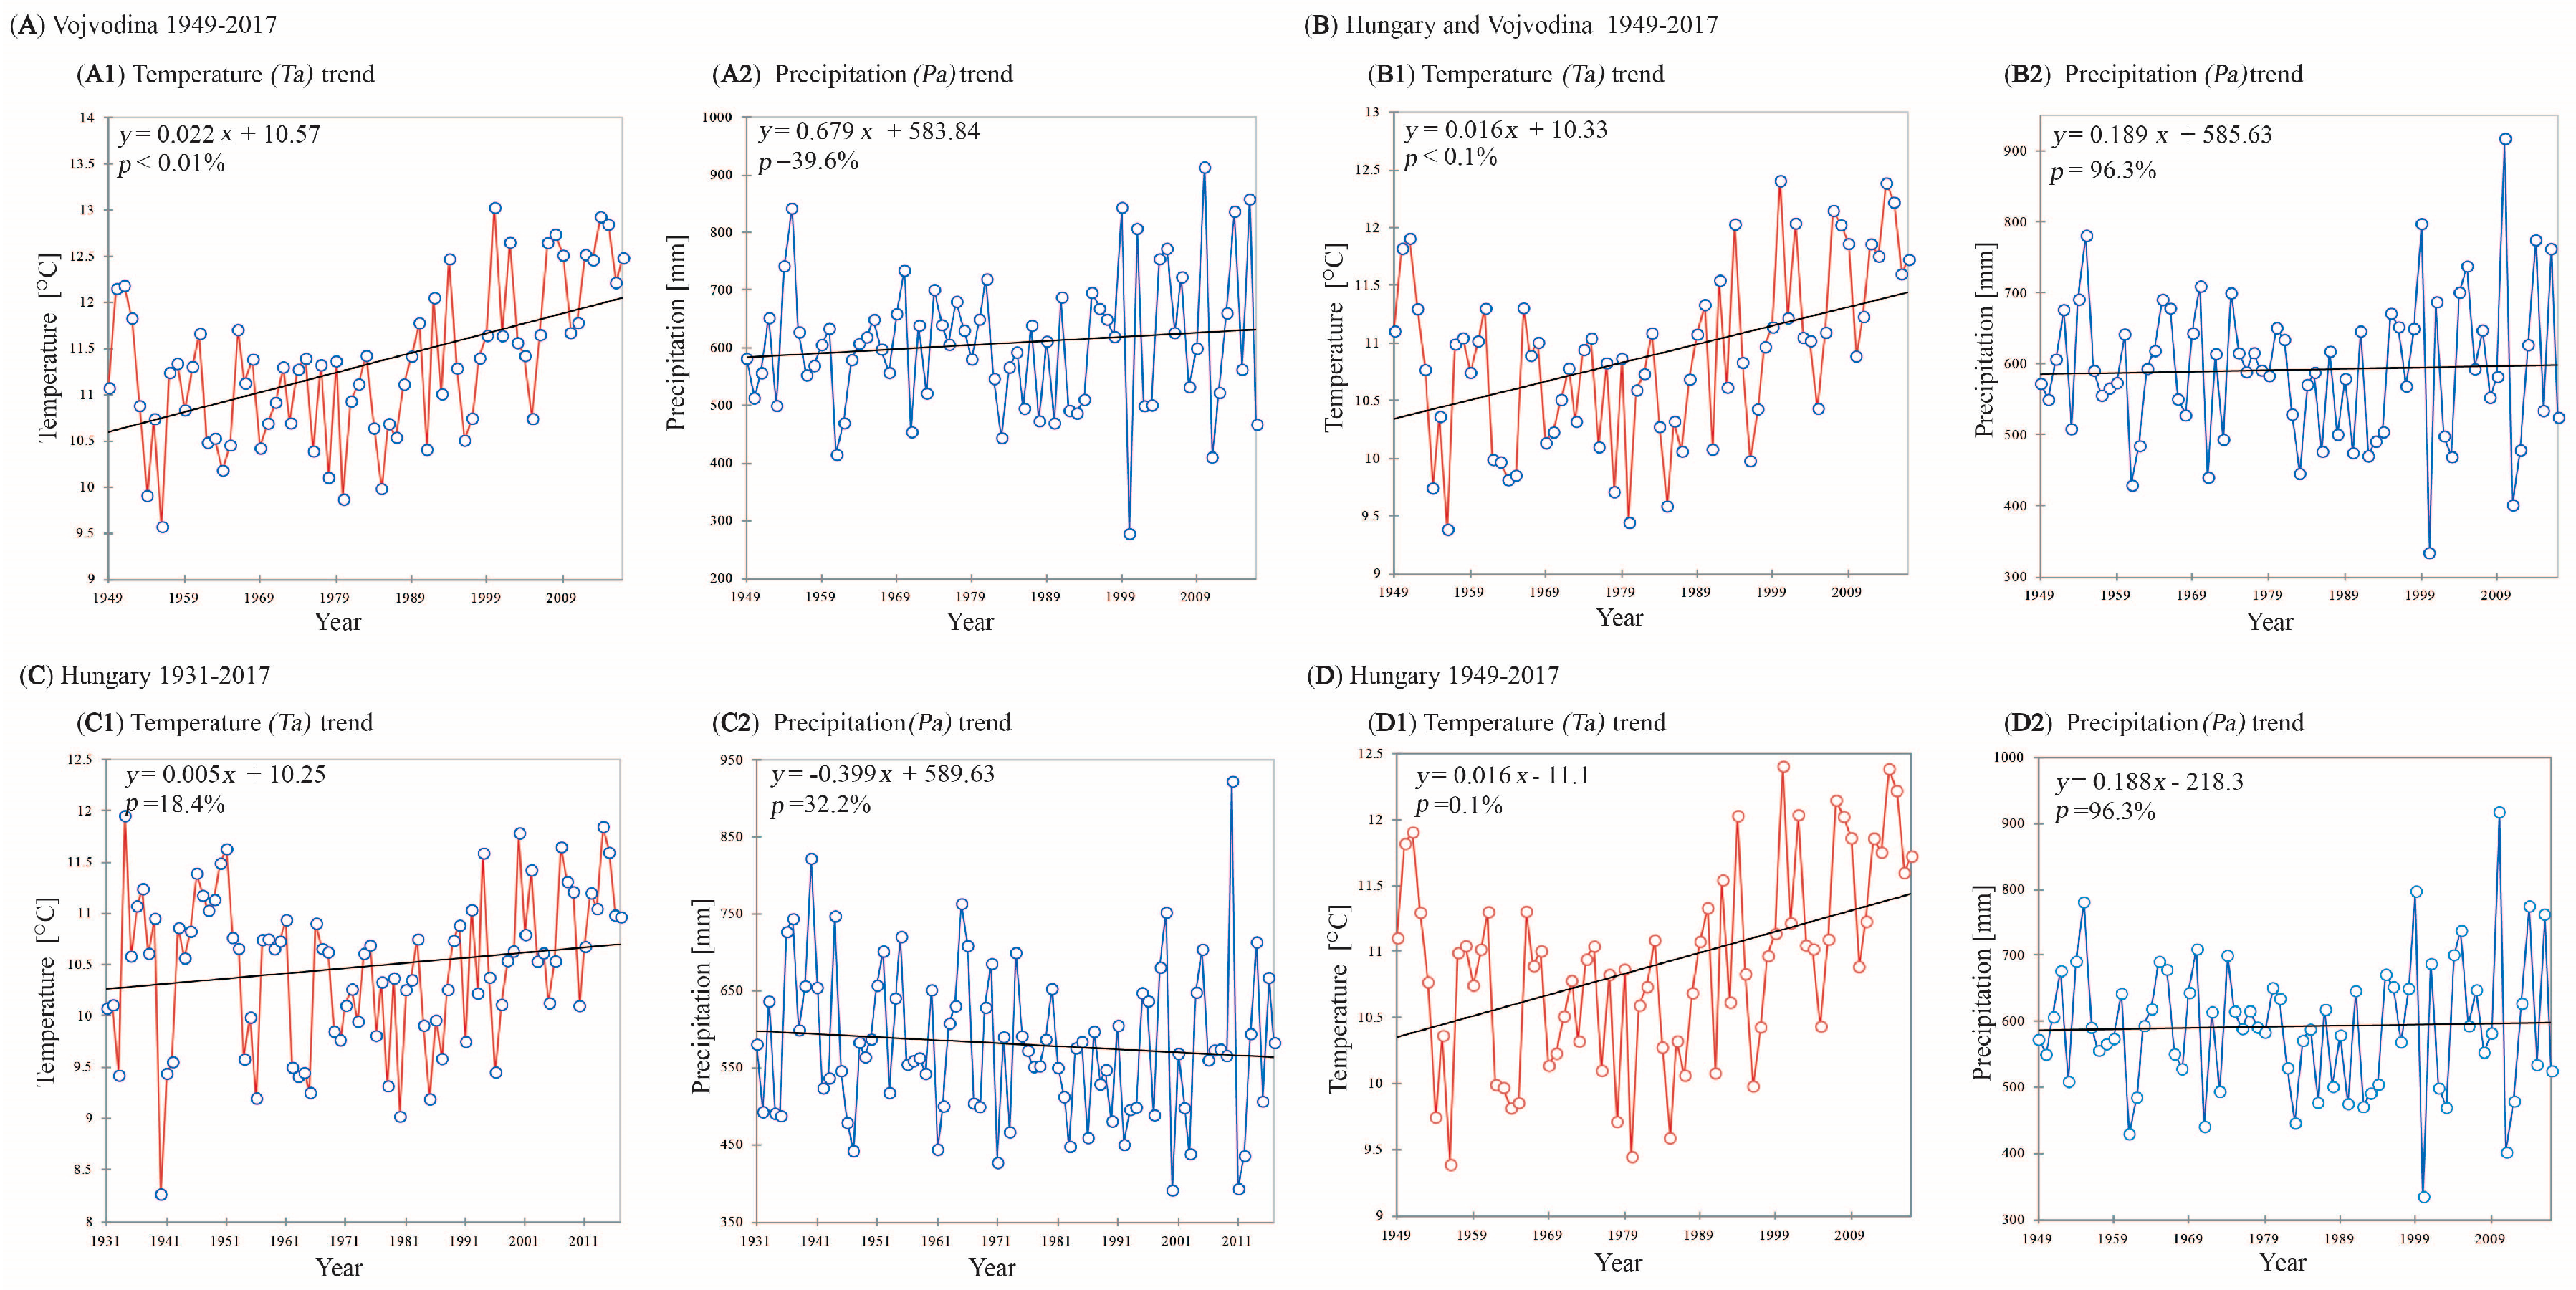
4.3. Annual Distribution, Trends, and Correlations
4.3.1. The De Martonne Aridity Index
4.3.2. Palmer Drought Severity Index
4.3.3. Temperature and Precipitation
5. Discussions
6. Conclusions
Author Contributions
Funding
Conflicts of Interest
References
- Hulme, M.; Barrow, E.M.; Arnell, N.W.; Harrisson, P.A.; Johns, T.C.; Downing, T.E. Relative impacts of human-induced climate change and natural climate variability. Nature 1999, 397, 688–691. [Google Scholar] [CrossRef]
- Kenny, G.J.; Ye, W.; Flux, T.; Warrick, R.A. Climate variations and New Zealand agriculture: The CLIMPACTS system and issues of spatial and temporal scale. Environ. Int. 2001, 27, 189–194. [Google Scholar] [CrossRef]
- Baltas, E.; Mimikou, M. Climate change impacts on the water supply of Thessaloniki. Int. J. Water Resour. Dev. 2005, 21, 341–353. [Google Scholar] [CrossRef]
- Intergovernmental Panel on Climate Change (IPCC). Global Warming of 1.5 °C; World Meteorological Organization: Geneva, Switzerland, 2018. [Google Scholar]
- Gavrilov, M.B.; Marković, S.B.; Mladjan, D.; Zarić, M.; Pešić, A.; Janc, N.; Todorović, N. Global Warning—Between the Myth and Reality. In Proceedings of the International Scientific Conference “Archibald Reiss Days”, Zemun, Serbia, 10–11 March 2016; Kolarić, D., Ed.; Academy of Criminalistic And Police Studies: Belgrade, Serbia, 2016. [Google Scholar]
- Climatic Research Unit. Global Average Temperature Change 1856–2003. Available online: https://crudata.uea.ac.uk/cru/data/temperature/ (accessed on 20 March 2020).
- Diaz, H.F.; Bradley, R.; Eischeid, J.K. Precipitation fluctuation over global land areas since the late 1800s. J. Geophys. Res. 1989, 94, 1195–1210. [Google Scholar] [CrossRef]
- American Meteorological Society, Glossary of Meteorology. Available online: http://glossary.ametsoc.org/wiki/Aridity (accessed on 20 March 2020).
- Gavrilov, M.B.; Lukić, T.; Janc, N.; Basarin, B.; Marković, S.B. Forestry Aridity Index in Vojvodina, North Serbia. Open Geosci. 2019, 11, 367–377. [Google Scholar] [CrossRef]
- Gavrilov, M.B.; An, W.; Xu, C.; Radaković, M.G.; Hao, Q.; Yang, F.; Guo, Z.; Perić, Z.; Gavrilov, G.; Marković, S.B. Independent Aridity and Drought Pieces of Evidence Based on Meteorological Data and Tree Ring Data in Southeast Banat, Vojvodina, Serbia. Atmosphere 2019, 10, 586. [Google Scholar] [CrossRef]
- De Martonne, E. Traité de géographie physique, Vol. I: Notions generales, climat, hydrographie. Geogr. Rev. 1925, 15, 336–337. [Google Scholar] [CrossRef]
- Palmer, W.C. Meteorological Drought; Research Paper No 45; Office of Climatology, Weather Bureau: Washington, DC, USA, 1965; p. 58. [Google Scholar]
- Baltas, E. Spatial distribution of climatic indices in northern Greece. Meteorol. Appl. 2007, 14, 69–78. [Google Scholar] [CrossRef]
- Deniz, A.; Toros, H.; Incecik, S. Spatial variations of climate indices in Turkey. Int. J. Climatol. 2011, 3, 394–403. [Google Scholar] [CrossRef]
- Moral, F.J.; Paniagua, L.L.; Rebollo, F.J.; García-Martín, A. Spatial analysis of the annual and seasonal aridity trends in Extremadura, southwestern Spain. Theor. Appl. Climatol. 2017, 130, 917–932. [Google Scholar] [CrossRef]
- Nistor, M.M. Spatial distribution of climate indices in the Emilia-Romagna region. Meteorol. Appl. 2016, 23, 304–313. [Google Scholar] [CrossRef]
- Bačević, N.; Vukoičić, D.; Nikolić, M.; Janc, N.; Milentijević, N.; Gavrilov, M.B. Aridity in Kosovo and Metohija, Serbia. Carpathian J. Earth Environ. Sci. 2017, 12, 563–570. [Google Scholar]
- Gebremedhin, M.A.; Kahsay, G.H.; Fanta, H.G. Assessment of spatial distribution of aridity indices in Raya valley, northern Ethiopia. Appl. Water Sci. 2018, 8, 217–224. [Google Scholar] [CrossRef]
- Derdous, O.; Tachi, S.E.; Bouguerra, H. Spatial distribution and evaluation of aridity indices in Northern Algeria. Arid Land Res. Manag. 2020, 1–14. [Google Scholar] [CrossRef]
- Croitoru, A.E.; Piticar, A.; Imbroane, A.M.; Burada, D.C. Spatiotemporal distribution of aridity indices based on temperature and precipitation in the extra-Carpathian regions of Romania. Theor. Appl. Climatol. 2013, 112, 597–607. [Google Scholar] [CrossRef]
- Hrnjak, I.; Lukić, T.; Gavrilov, M.B.; Marković, S.B.; Unkašević, M.; Tošić, I. Aridity in Vojvodina, Serbia. Theor. Appl. Climatol. 2014, 115, 323–332. [Google Scholar] [CrossRef]
- Radaković, M.G.; Tošić, I.; Bačević, N.; Mladjan, D.; Gavrilov, M.B.; Marković, S.B. The analysis of aridity in Central Serbia from 1949 to 2015. Theor. Appl. Climatol. 2018, 133, 887–898. [Google Scholar] [CrossRef]
- Ludwig, P.; Gavrilov, M.B.; Radaković, M.G.; Marković, S.B. Malaco Temperature Reconstructions and Numerical Simulation of Environmental Conditions in the southeastern Carpathian Basin during the Last Glacial Maximum. J. Quat. Sci. 2020. submitted for publication. [Google Scholar]
- Alley, W. The Palmer Drought Severity Index: Limitations and Assumptions. J. Clim. Appl. Meteorol. 1984, 23, 1100–1109. [Google Scholar] [CrossRef]
- Szelepcsényi, Z.; Breuer, H.; Acs, F.; Kozma, I. Biofizikai klímaklasszifikációk. 2. rész: Magyarországialkalmazások [Biophysical Climate Classifications. Part 2: Applications for Hungary]. Légkör 2009, 54, 18–23. [Google Scholar]
- Hungarian Meteorological Service (HMS). HMS Database. 2017. Available online: http://www.met.hu/en/idojaras (accessed on 20 March 2020).
- Marković, S.B.; Bokhorst, M.; Vandenberghe, J.; Oches, E.A.; Zöller, L.; McCoy, W.D.; Gaudenyi, T.; Jovanović, M.; Hambach, U.; Machalett, B. Late Pleistocene loess-paleosol sequences in the Vojvodina region, North Serbia. J. Quat. Sci. 2008, 23, 73–84. [Google Scholar] [CrossRef]
- Marković, S.B.; Hambach, U.; Catto, N.; Jovanović, M.; Buggle, B.; Machalett, B.; Zöller, L.; Glaser, B.; Frechen, M. The middle and late Pleistocene loess-paleosol sequences at Batajanica, Vojvodina, Serbia. Quat. Int. 2009, 198, 255–266. [Google Scholar] [CrossRef]
- Marković, S.B.; Hambach, U.; Stevens, T.; Kukla, G.J.; Heller, F.; William, D.; McCoy, W.D.; Oches, E.A.; Buggle, B.; Zöller, L. The last million years recorded at the Stari Slankamen loess-palaeosol sequence: Revised chronostratigraphy and long-term environmental trends. Quat. Sci. Rev. 2011, 30, 1142–1154. [Google Scholar] [CrossRef]
- Marković, S.B.; Stevens, T.; Kukla, G.J.; Hambach, U.; Fitzsimmons, K.E.; Gibbard, P.; Buggle, B.; Zech, M.; Guo, Z.T.; Hao, Q.Z.; et al. The Danube loess stratigraphy—New steps towards the development of a pan-European loess stratigraphic model. Earth Sci. Rev. 2015, 148, 228–258. [Google Scholar] [CrossRef]
- Gavrilov, M.B.; Marković, S.B.; Schaetzl, R.J.; Tošić, I.A.; Zeeden, C.; Obreht, I.; Sipos, G.; Ruman, A.; Putniković, S.; Emunds, K.; et al. Prevailing surface winds in Northern Serbia in the recent and past time periods; modern- and past dust deposition. Aeolian Res. 2018, 31, 117–129. [Google Scholar] [CrossRef]
- Tošić, I.; Gavrilov, M.B.; Marković, S.B.; Ruman, A.; Putniković, S. Seasonal prevailing surface winds in Northern Serbia. Theor. Appl. Climatol. 2018, 131, 1273–1284. [Google Scholar] [CrossRef]
- Gavrilov, M.B.; Marković, S.B.; Korać, V.; Jarad, A. The analysis of temperature trends in Vojvodina (Serbia) from 1949 to 2006. Therm. Sci. 2015, 19, 339–350. [Google Scholar] [CrossRef]
- Tošić, I.; Hrnjak, I.; Gavrilov, M.B.; Unkašević, M.; Marković, S.B.; Lukić, T. Annual and seasonal variability of precipitation in Vojvodina, Serbia. Theor. Appl. Climatol. 2014, 117, 331–341. [Google Scholar] [CrossRef]
- Republic Hydrometeorological Service of Serbia (RHSS). RHSS Database. 2017. Available online: http://www.hidmet.gov.rs/ciril/meteorologija/klimatologija_godisnjaci.php (accessed on 20 March 2020).
- Alexandersson, H. A homogeneity test applied to precipitation data. J. Climatol. 1986, 6, 661–675. [Google Scholar] [CrossRef]
- National Center for Atmospheric Research (NCAR)—Climate Data Guide. Available online: http://www.cgd.ucar.edu/cas/catalog/climind/pdsi.html (accessed on 22 March 2020).
- Dai, A.; Trenberth, K.E.; Qian, T. A global dataset of Palmer Drought Severity Index for 1870–2002: Relationship with soil moisture and effects of surface warming. J. Hydrometeorol. 2004, 5, 1117–1130. [Google Scholar] [CrossRef]
- Draper, N.R.; Smith, H. Applied Regression Analysis; John Wiley and Sons: New York, NY, USA, 1966. [Google Scholar]
- Kendall, M.G. New Measure of Rank Correlation. Biometrika 1938, 30, 81–93. [Google Scholar] [CrossRef]
- Karmeshu, N. Trend Detection in Annual Temperature & precipitation Using the Mann Kendall Test—A Case Study to Assess Climate Change on Select States in the Northeastern United States. Master’s Thesis, University of Pennsylvania, Philadelphia, PA, USA, 2012. [Google Scholar]
- Mann, H.B. Non-parametric Tests Against Trend. Econometrica 1945, 13, 245–259. [Google Scholar] [CrossRef]
- Gilbert, R.O. Statistical Methods for Environmental Pollution Monitoring; Van Nostrand Reinhold Company Inc.: New York, NY, USA, 1987. [Google Scholar]
- Onoz, B.; Bayazit, M. The Power of Statistical Tests for Trend Detection. Turk. J. Eng. Environ. Sci. 2003, 27, 247–251. [Google Scholar]
- Marin, L.; Birsan, M.V.; Bojariu, R.; Dumitrescu, A.; Micu, D.M.; Manea, A. An Overview of annual climatic changes in Romania: Trends in air temperature, precipiutation, sunshine hours, cloud cover, relative humidity and wind speed duration the 1961–2013 period. Carpathian J. Earth Environ. Sci. 2014, 9, 253–258. [Google Scholar]
- Çiçek, İ.; Duman, N. Seasonal and annual precipitation trends in Turkey. Carpathian J. Earth Environ. Sci. 2015, 10, 77–84. [Google Scholar]
- Serra, C.; Burgueño, A.; Lana, X. Analysis of maximum and minimum daily temperatures recorded at Fabra Observatory (Barcelona, NE Spain) in the period 1917–1998. Int. J. Climatol. 2001, 21, 617–636. [Google Scholar] [CrossRef]
- Gavrilov, M.B.; Tošić, I.; Marković, S.B.; Unkašević, M.; Petrović, P. The analysis of annual and seasonal temperature trends using the Mann-Kendall test in Vojvodina, Serbia. Időjárás 2016, 120, 183–198. [Google Scholar]
- Gavrilov, M.B.; Lazić, L.; Pešić, A.; Milutinović, M.; Marković, D.; Stanković, A.; Gavrilov, M.M. Influence of Hail Suppression on the Hail Trend in Serbia. Phys. Geogr. 2010, 31, 441–454. [Google Scholar] [CrossRef]
- Gavrilov, M.B.; Lazić, L.; Milutinović, M.; Gavrilov, M.M. Influence of Hail Suppression on the Hail Trend in Vojvodina, Serbia. Geogr. Pannonica. 2011, 15, 36–41. [Google Scholar] [CrossRef]
- Gavrilov, M.B.; Marković, S.B.; Zorn, M.; Komac, B.; Lukić, T.; Milošević, M.; Janićević, S. Is hail suppression useful in Serbia?—General review and new results. Acta Geogr. Slov. 2013, 53, 165–179. [Google Scholar] [CrossRef]
- Ahmed, K.; Shahid, S.; Wang, X.-J.; Nawaz, N.; Khan, N. Spatiotemporal Changes in Aridity of Pakistan during 1901–2016. Hydrol. Earth Syst. Sci. 2019, 23, 3081–3096. [Google Scholar] [CrossRef]
- Tabari, H.; Marofi, S.; Aeini, A.; Talaee, P.H.; Mohammadi, K. Trend analysis of reference evapotranspirationin the western half of Iran. Agric. For. Meteorol. 2011, 151, 128–136. [Google Scholar] [CrossRef]
- Tabari, H.; Talaee, P.H.; Nadoushani, S.M.; Willems, P.; Marchetto, A. A survey of temperature and precipitation based aridity indices in Iran. Quat. Int. 2014, 345, 158–166. [Google Scholar] [CrossRef]
- Drapela, K.; Drapelova, I. Application of Mann-Kendall test and the Sen’s slope estimates for trend detection in deposition data from BílýKříž (Beskydy Mts., the Czech Republic) 1997–2010. Beskydy 2011, 4, 133–146. [Google Scholar]
- Statistical Software & Data Analysis Add-on for Excel | XLSTAT. Available online: https://www.xlstat.com/en/ (accessed on 17 March 2019).
- NetCDF4 Module Version 1.5.4. Available online: https://unidata.github.io/netcdf4-python/netCDF4/index.html (accessed on 14 February 2019).
- Gavrilov, M.B.; Marković, S.B.; Mladjan, D.; Subošić, D.; Zarić, M.; Pešić, A.; Janc, N.; Nikolić, M.; Valjarević, A.; Bačević, N. Extreme floods in Serbia occurring simultaneosly with the high water levels and heavy rains- Case Study. In Proceedings of the International Scientific Conference “Archibald Reiss Days”, Zemun, Serbia, 3–4 March 2015; Academy of Criminalistic And Police Studies in Belgrade: Beograd, Serbia, 2015; Volume 1, pp. 25–36. [Google Scholar]


| Types of Climate | Values of IDM |
|---|---|
| Arid | IDM < 10 |
| Semi-arid | 10 ≤ IDM < 20 |
| Mediterranean | 20 ≤ IDM < 24 |
| Semi-humid | 24 ≤ IDM < 28 |
| Humid | 28 ≤ IDM < 35 |
| Very-humid | 35 ≤ IDM ≤ 55 |
| Extremely humid | IDM > 55 |
| Types of Climate | Values of PDSI |
|---|---|
| Extremely Wet | 4.00 or more |
| Very Wet | 3.00 to 3.99 |
| Moderately Wet | 2.00 to 2.99 |
| Slightly Wet | 1.00 to 1.99 |
| Incipient Wet Spell | 0.50 to 0.99 |
| Near Normal | 0.49 to −0.49 |
| Incipient Dry Spell | −0.50 to −0.99 |
| Mild Drought | −1.00 to −1.99 |
| Moderate Drought | −2.00 to −2.99 |
| Severe Drought | −3.00 to −3.99 |
| Extreme Drought | −4.00 or less |
| Territory & Period | Vojvodina 1949–2017 | Hungary 1931–2017 | Hungary and Vojvodina 1949–2017 | |
|---|---|---|---|---|
| Parameter | ||||
| Temperature trend | Yes | No | Yes | |
| Precipitation trend | No | No | No | |
Publisher’s Note: MDPI stays neutral with regard to jurisdictional claims in published maps and institutional affiliations. |
© 2020 by the authors. Licensee MDPI, Basel, Switzerland. This article is an open access article distributed under the terms and conditions of the Creative Commons Attribution (CC BY) license (http://creativecommons.org/licenses/by/4.0/).
Share and Cite
Gavrilov, M.B.; Radaković, M.G.; Sipos, G.; Mezősi, G.; Gavrilov, G.; Lukić, T.; Basarin, B.; Benyhe, B.; Fiala, K.; Kozák, P.; et al. Aridity in the Central and Southern Pannonian Basin. Atmosphere 2020, 11, 1269. https://doi.org/10.3390/atmos11121269
Gavrilov MB, Radaković MG, Sipos G, Mezősi G, Gavrilov G, Lukić T, Basarin B, Benyhe B, Fiala K, Kozák P, et al. Aridity in the Central and Southern Pannonian Basin. Atmosphere. 2020; 11(12):1269. https://doi.org/10.3390/atmos11121269
Chicago/Turabian StyleGavrilov, Milivoj B., Milica G. Radaković, György Sipos, Gábor Mezősi, Gavrilo Gavrilov, Tin Lukić, Biljana Basarin, Balázs Benyhe, Károly Fiala, Péter Kozák, and et al. 2020. "Aridity in the Central and Southern Pannonian Basin" Atmosphere 11, no. 12: 1269. https://doi.org/10.3390/atmos11121269
APA StyleGavrilov, M. B., Radaković, M. G., Sipos, G., Mezősi, G., Gavrilov, G., Lukić, T., Basarin, B., Benyhe, B., Fiala, K., Kozák, P., Perić, Z. M., Govedarica, D., Song, Y., & Marković, S. B. (2020). Aridity in the Central and Southern Pannonian Basin. Atmosphere, 11(12), 1269. https://doi.org/10.3390/atmos11121269