Impact of VOCs and NOx on Ozone Formation in Moscow
Abstract
:1. Introduction
2. Experiments
3. Results
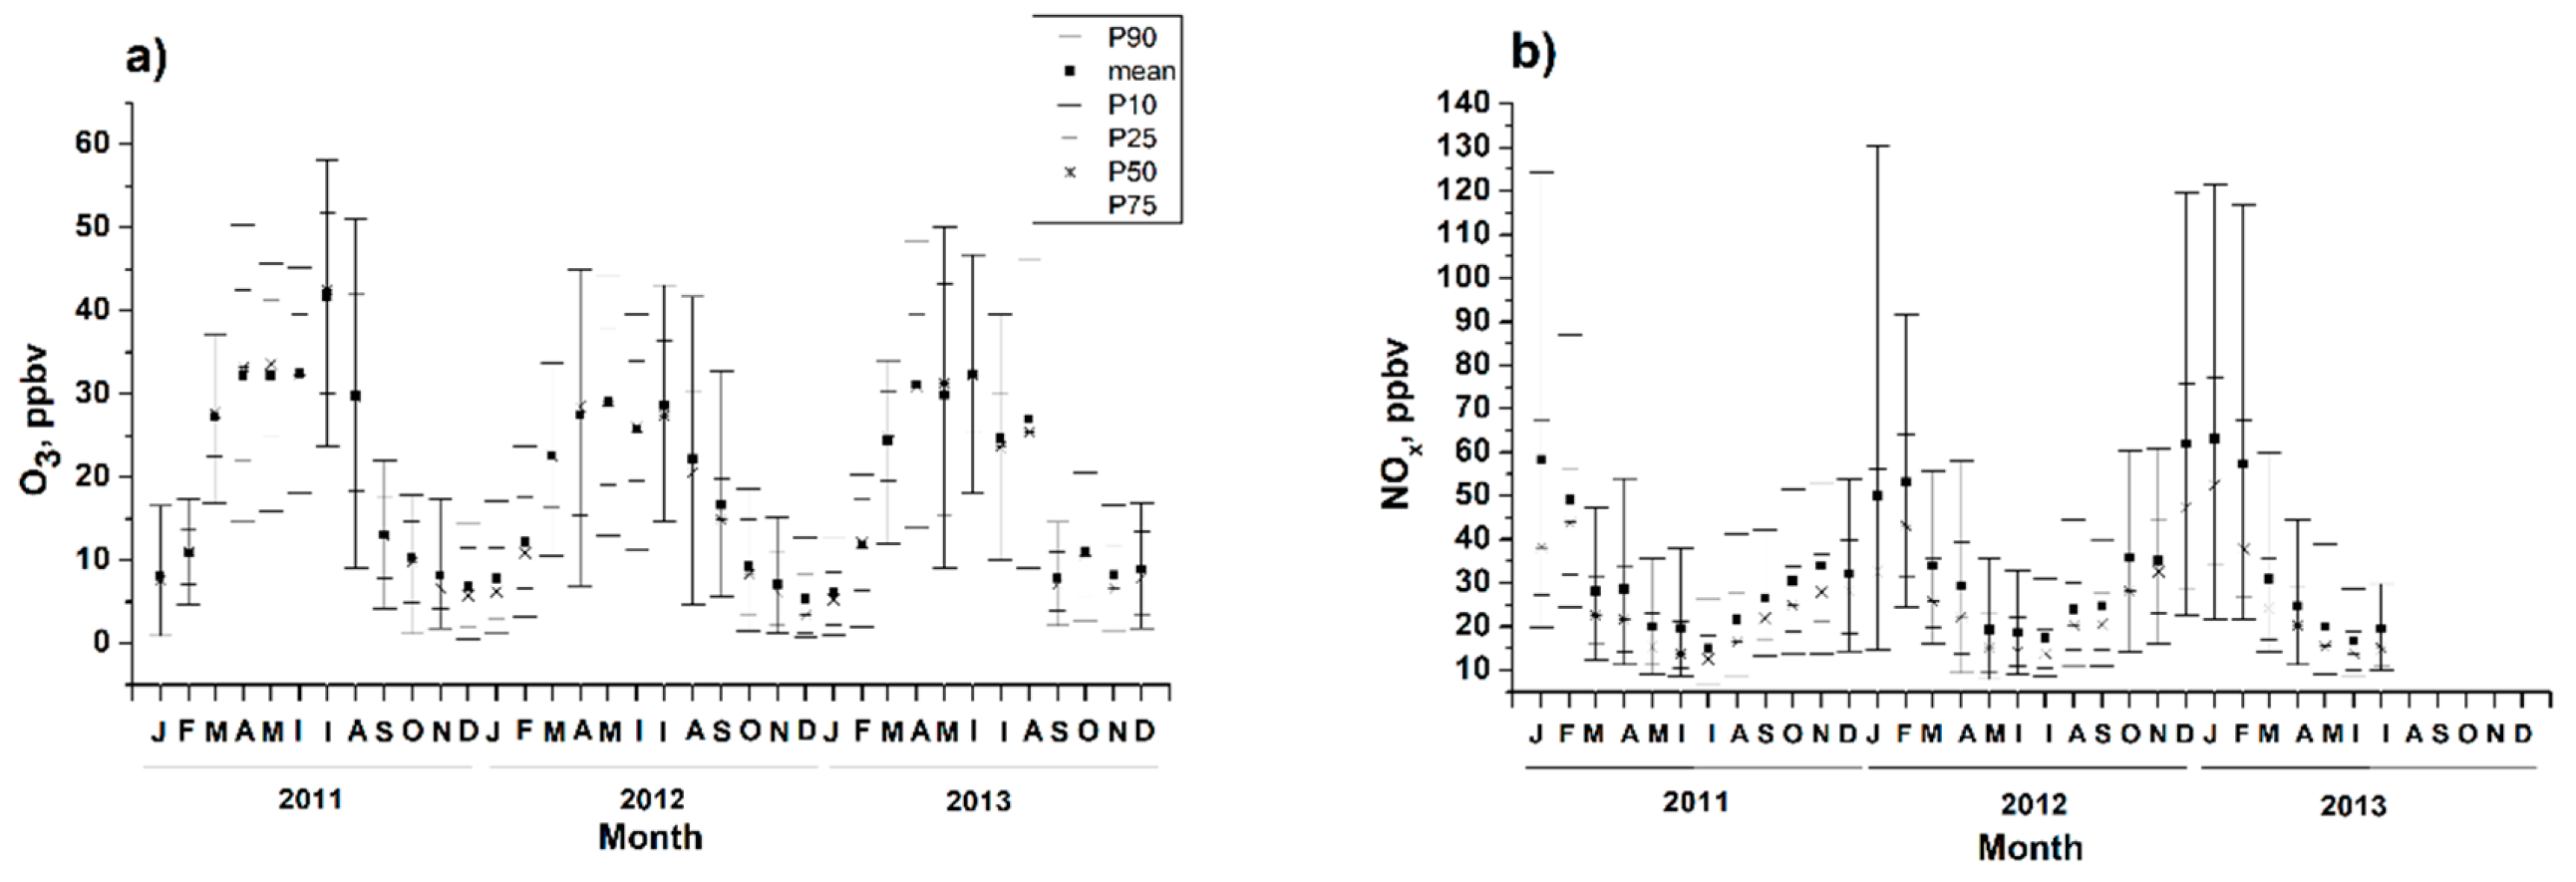
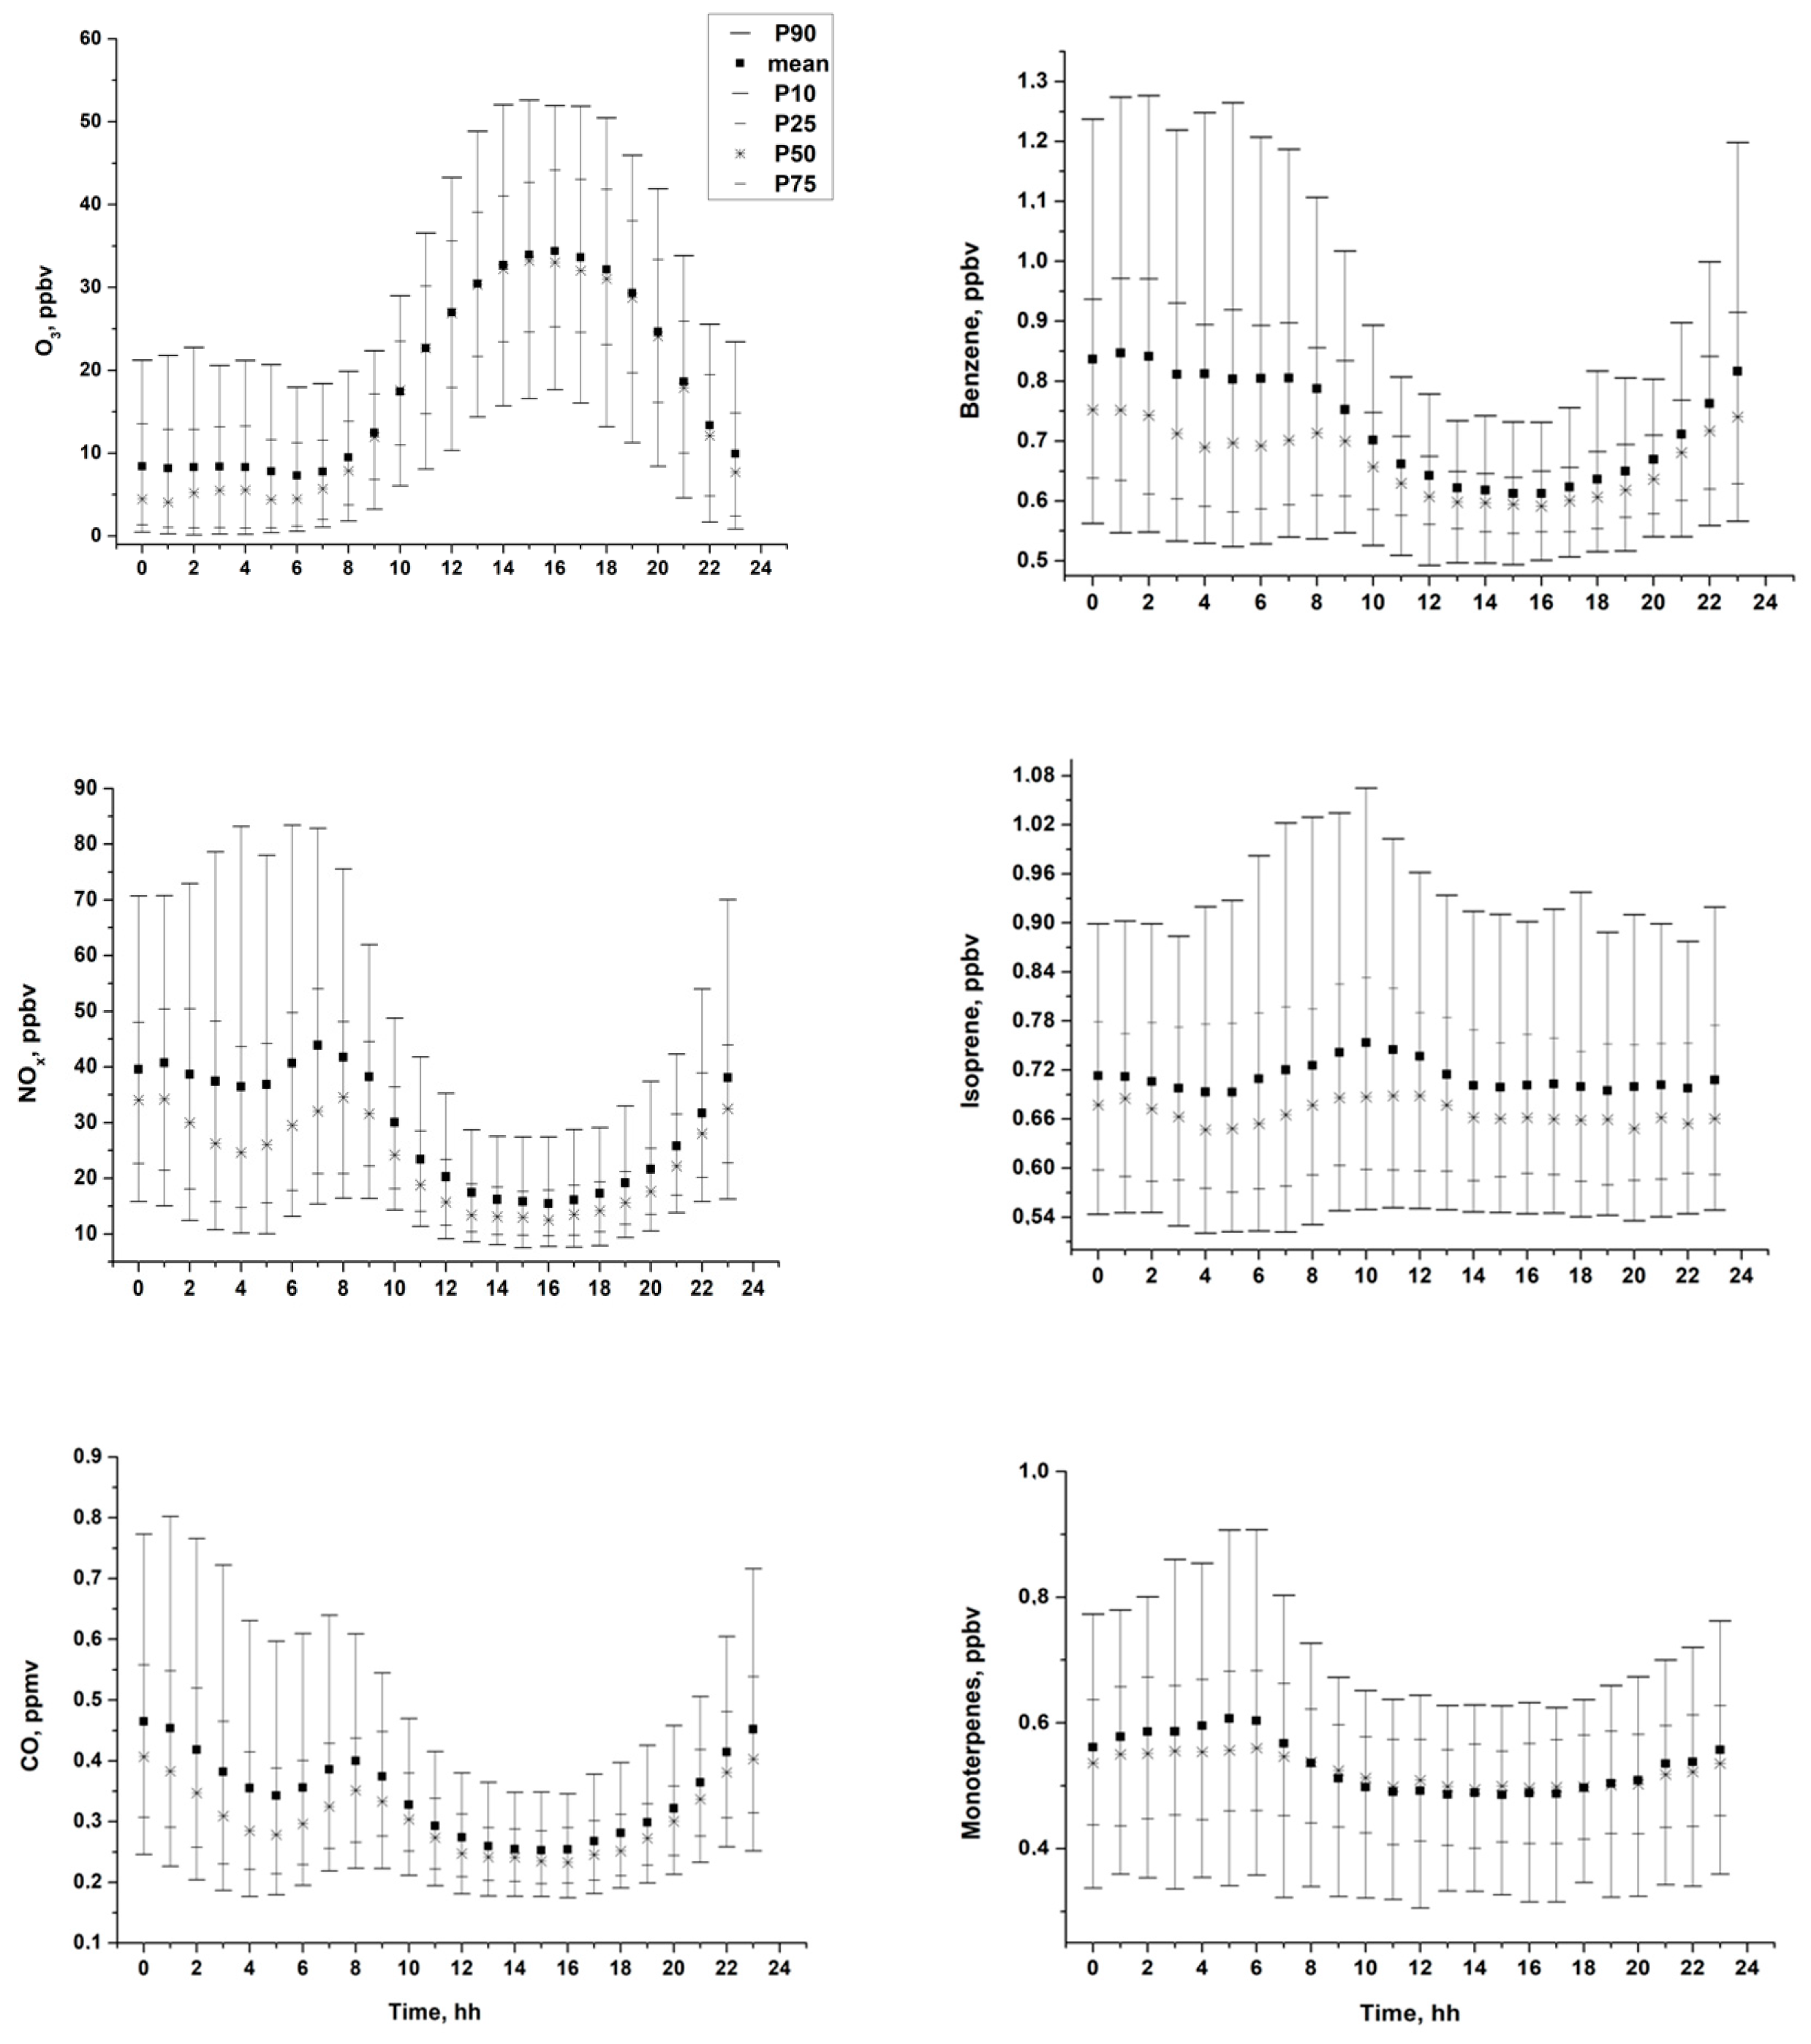
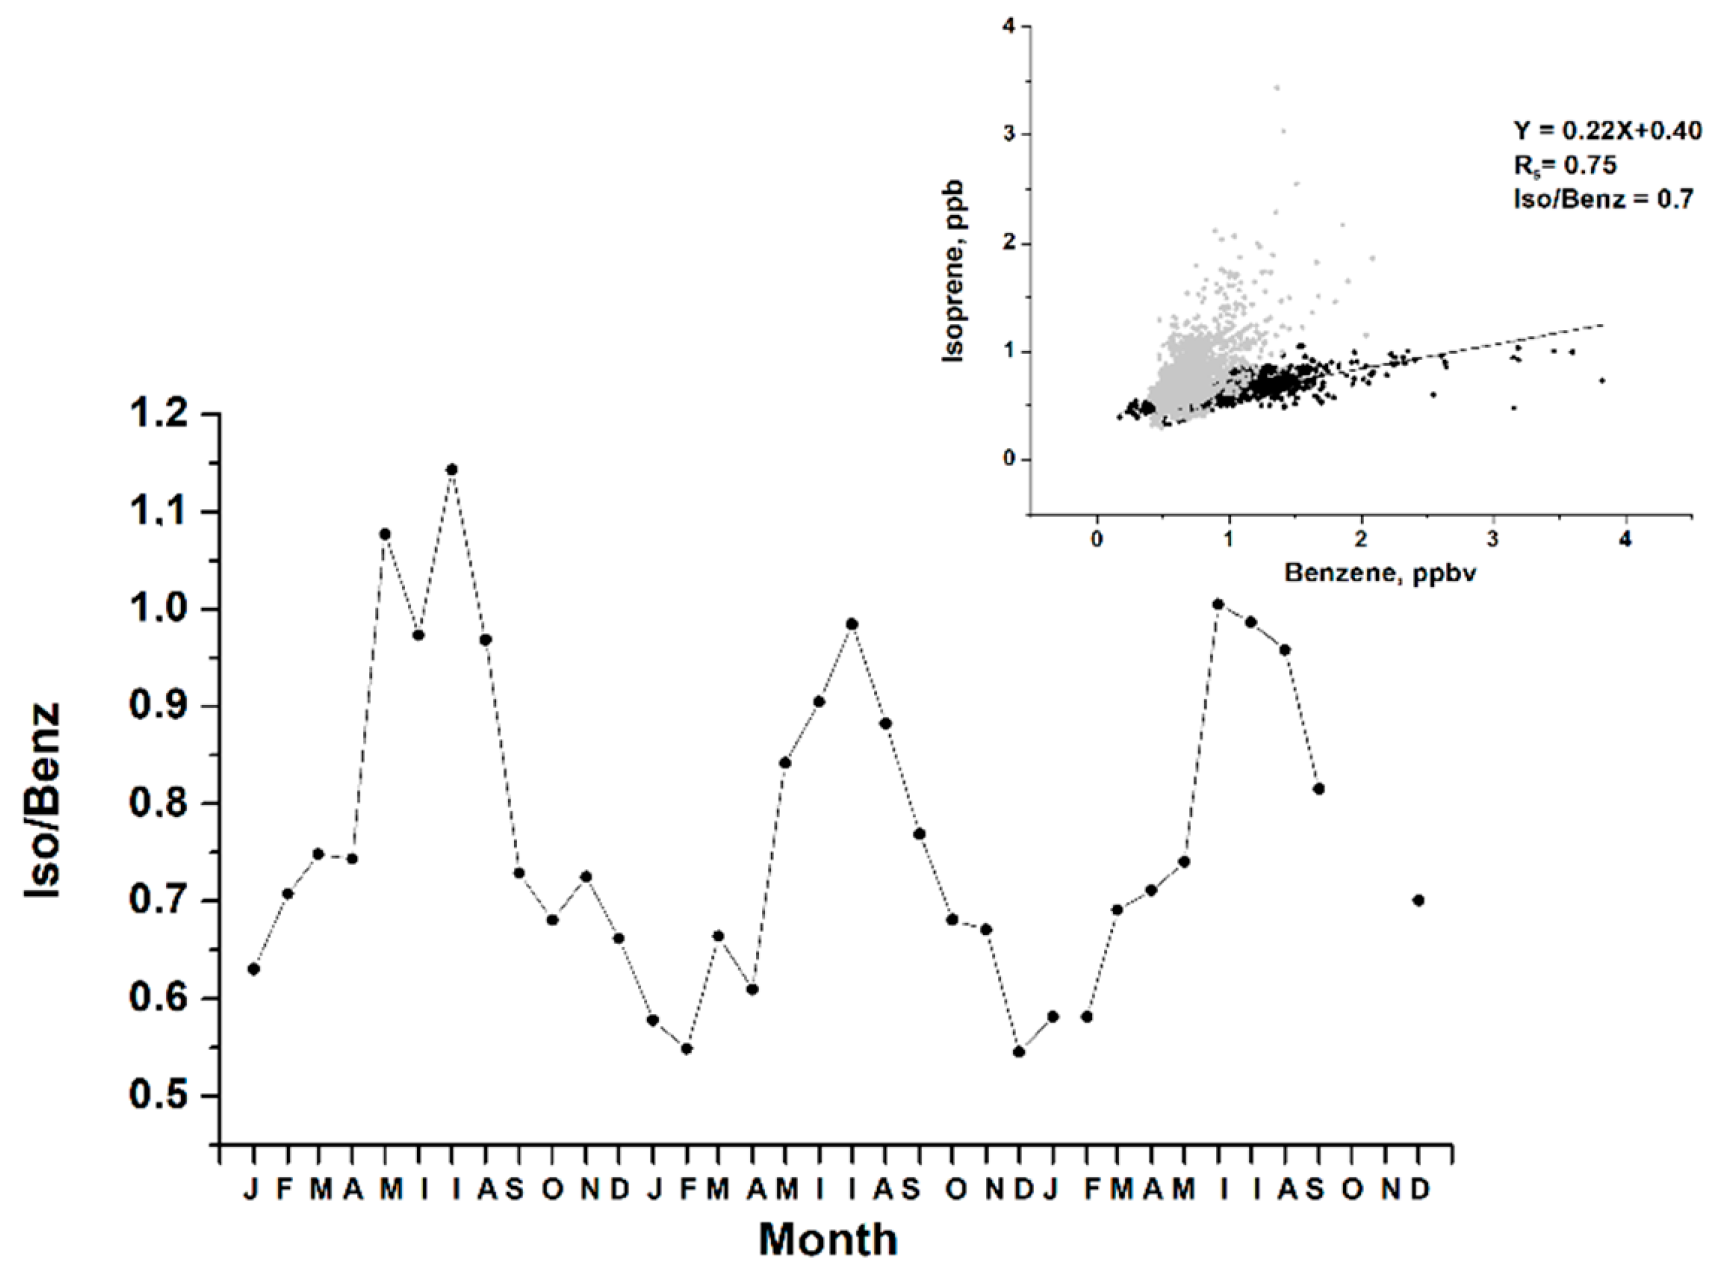
3.1. Diurnal and Seasonal Variability of Inorganic and Organic Species
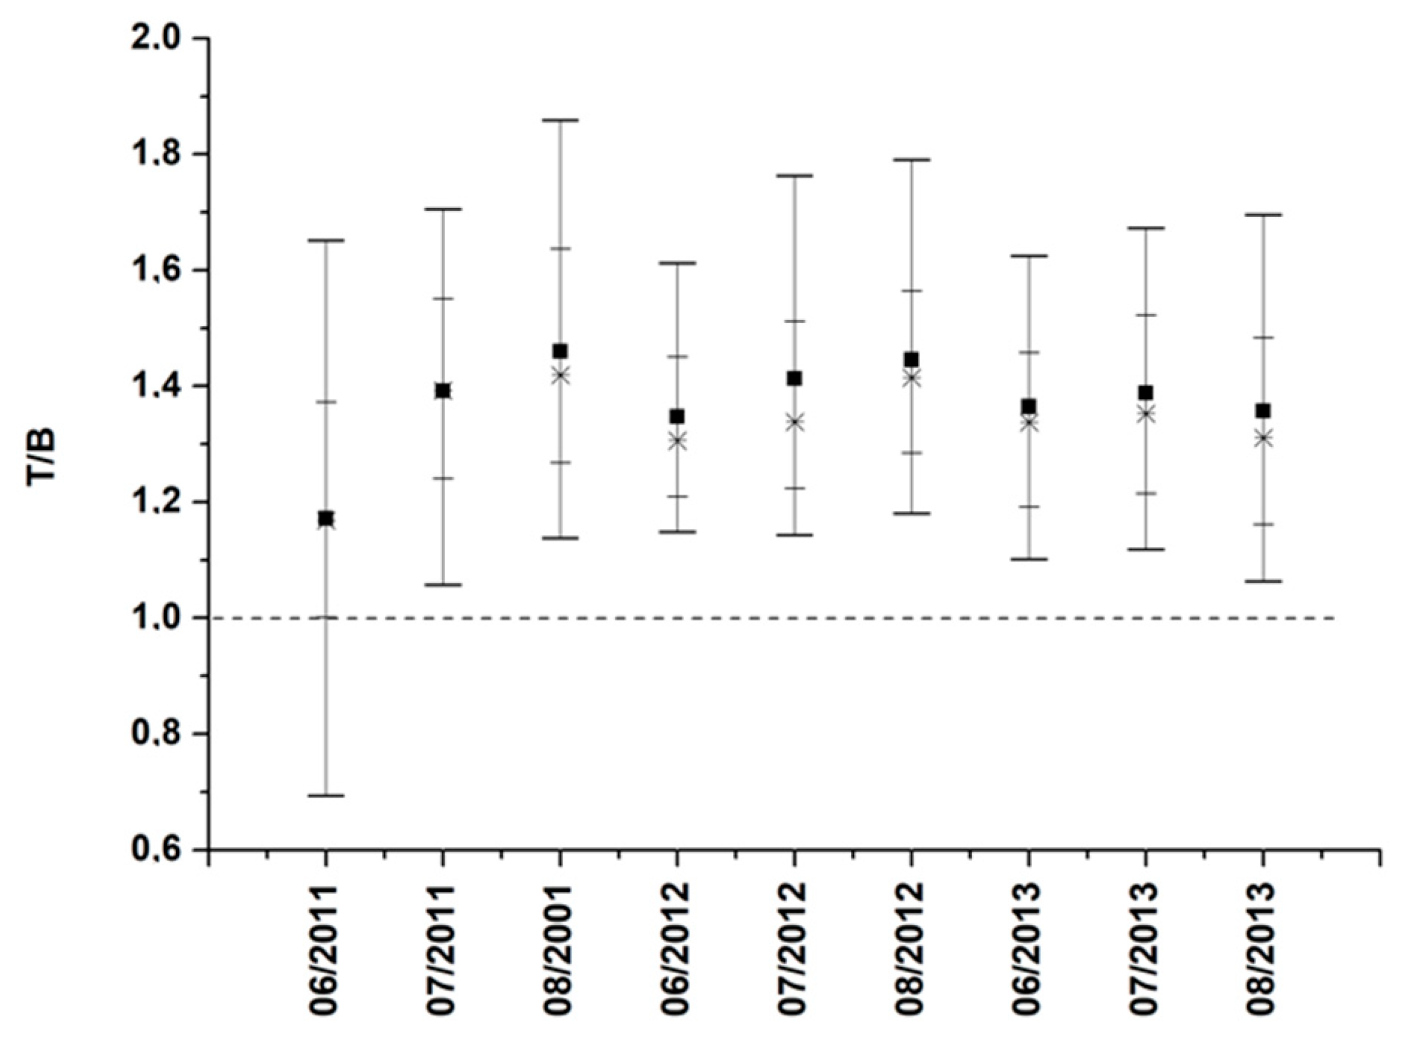
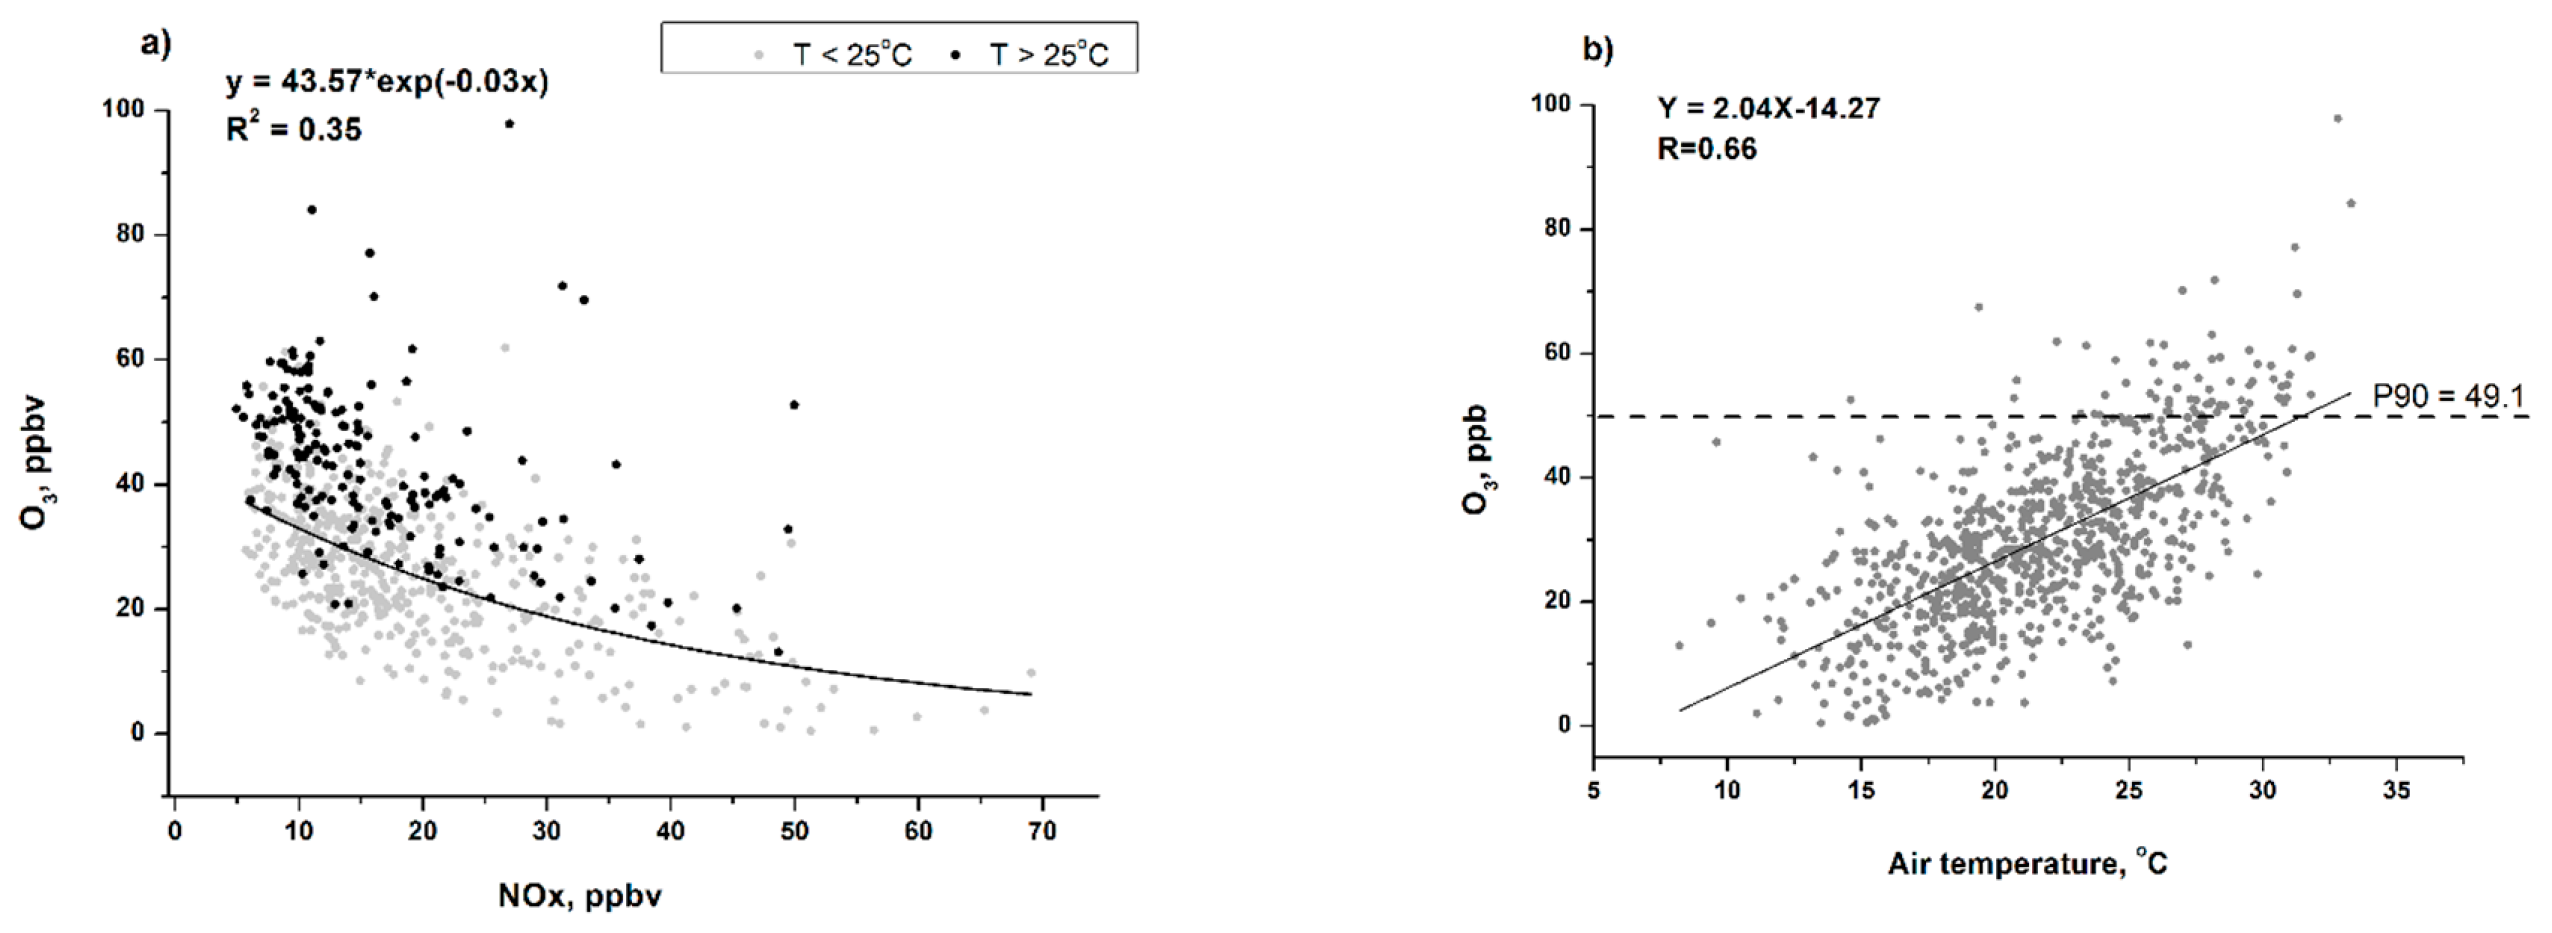
3.2. Ozone Generation in Moscow
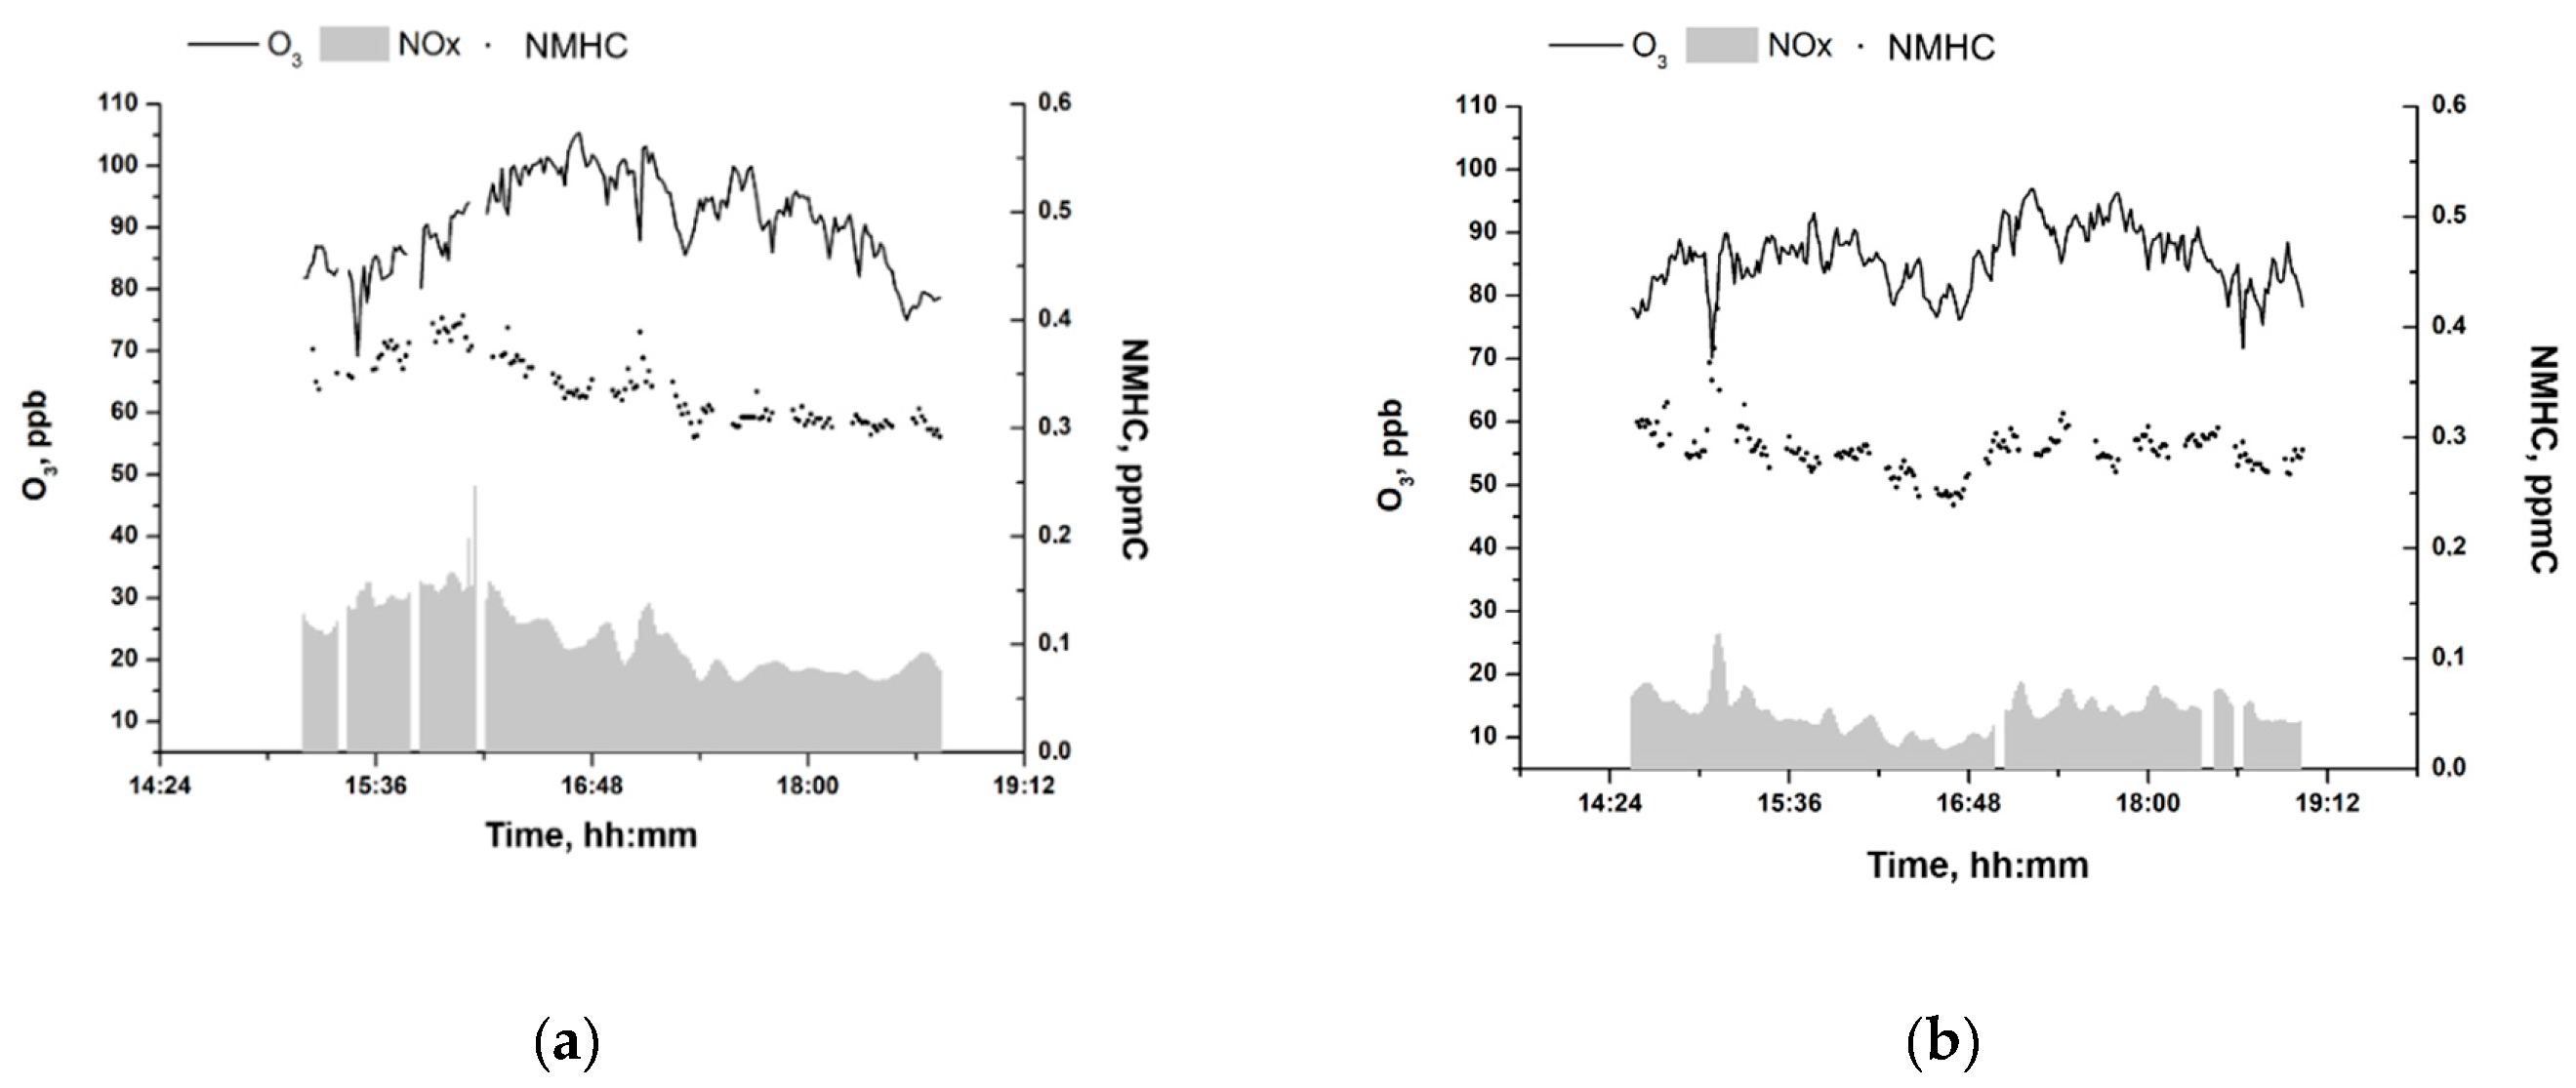
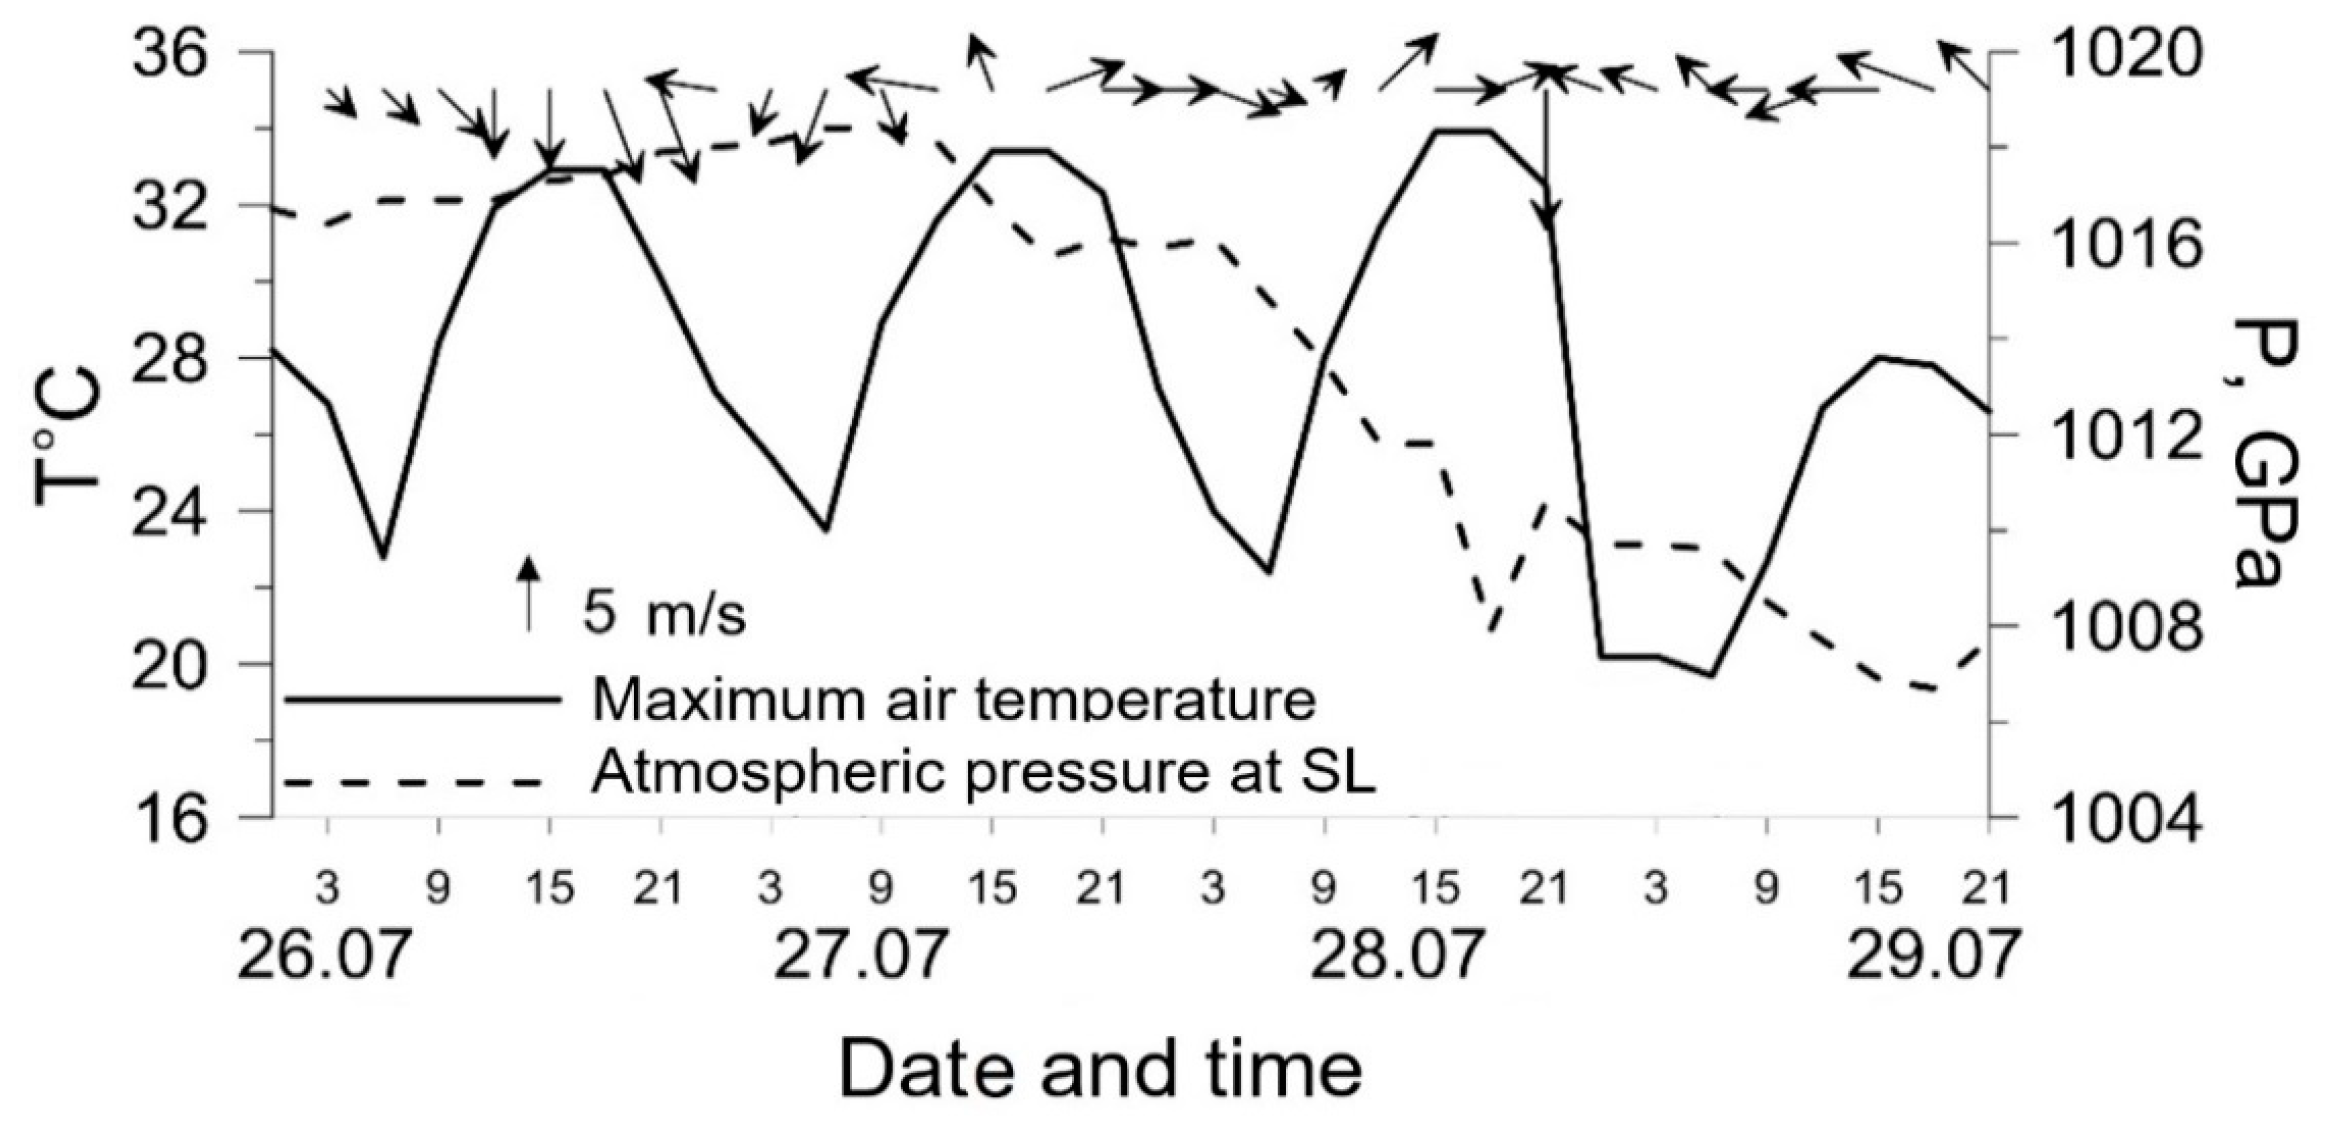
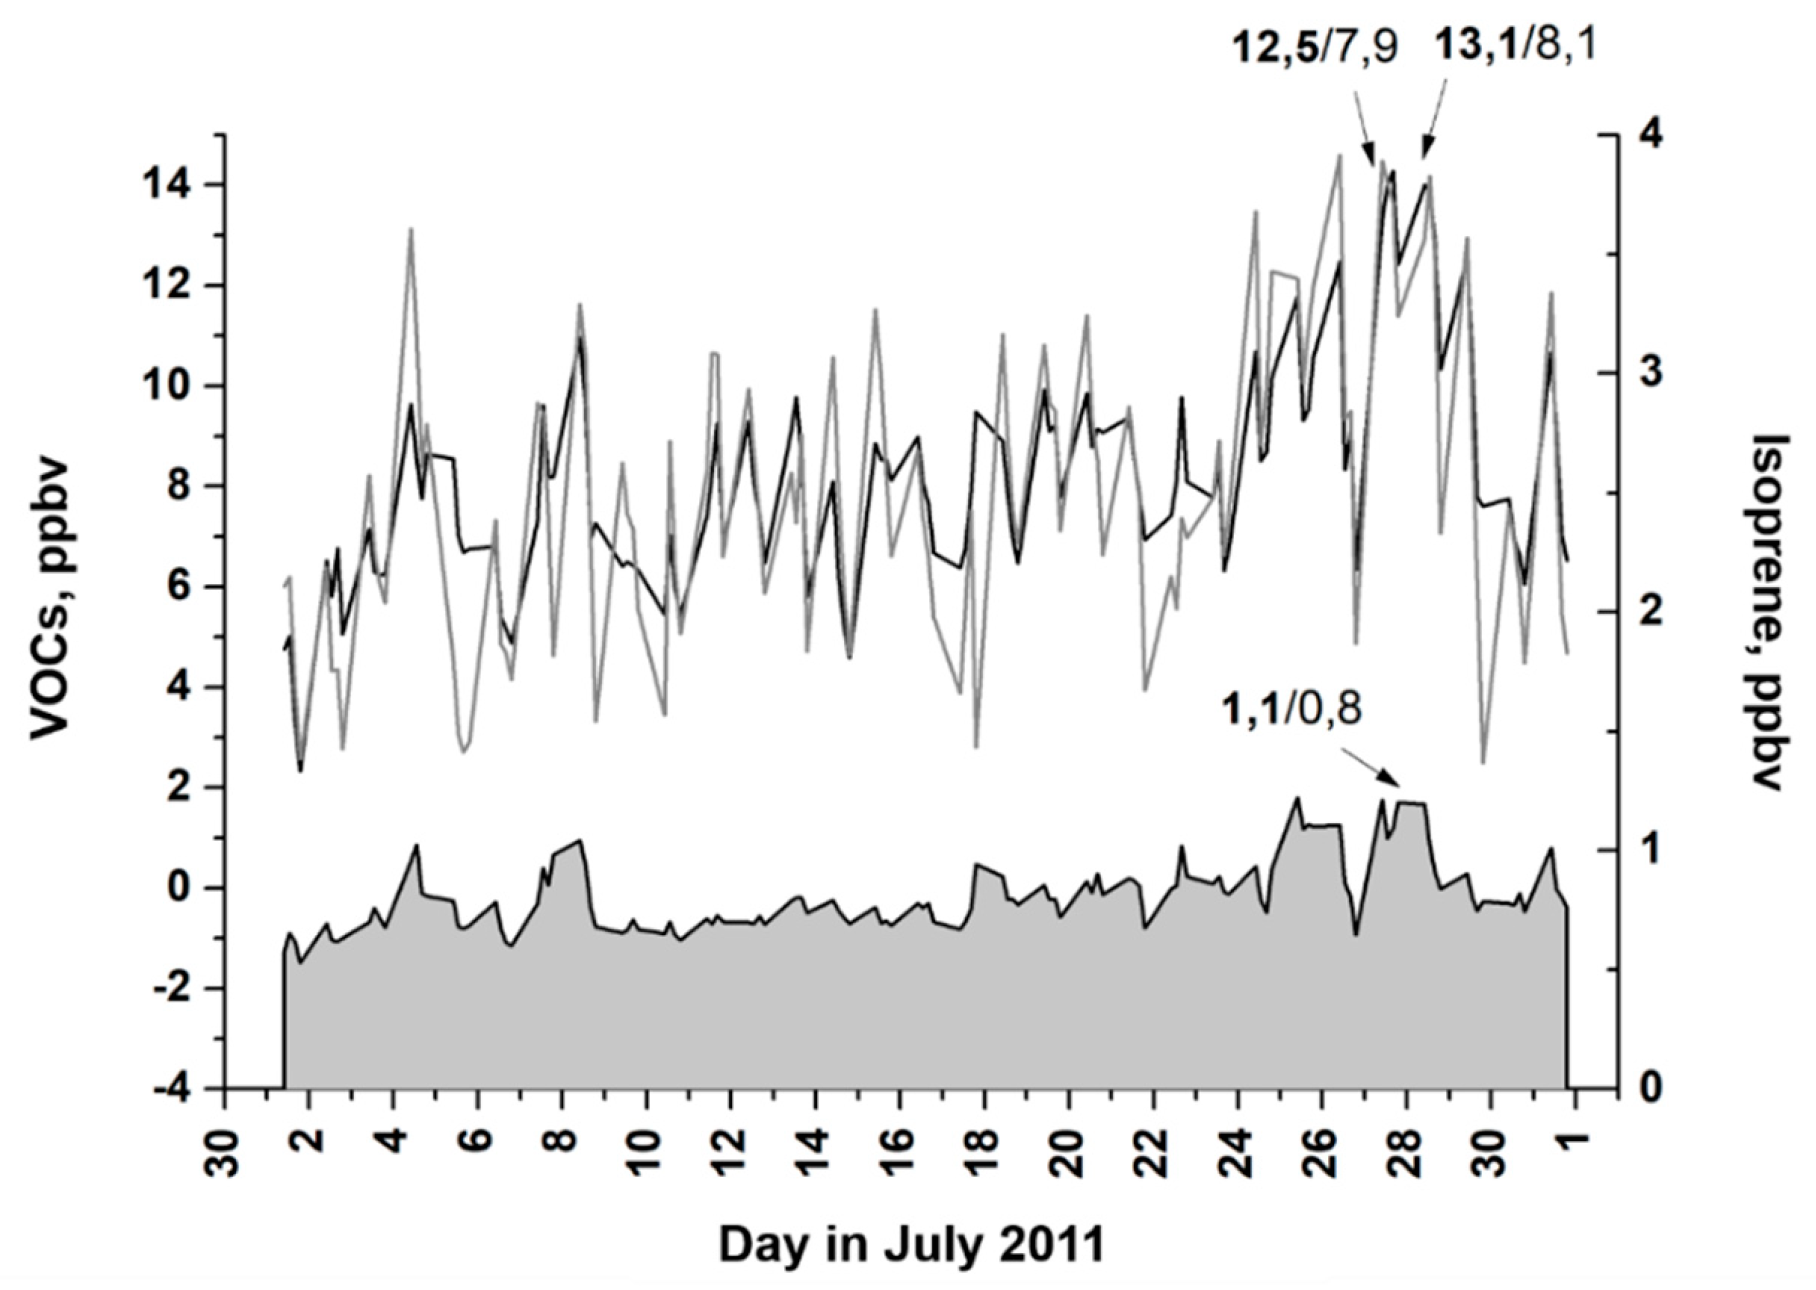
3.3. High O3 Episodes in Moscow
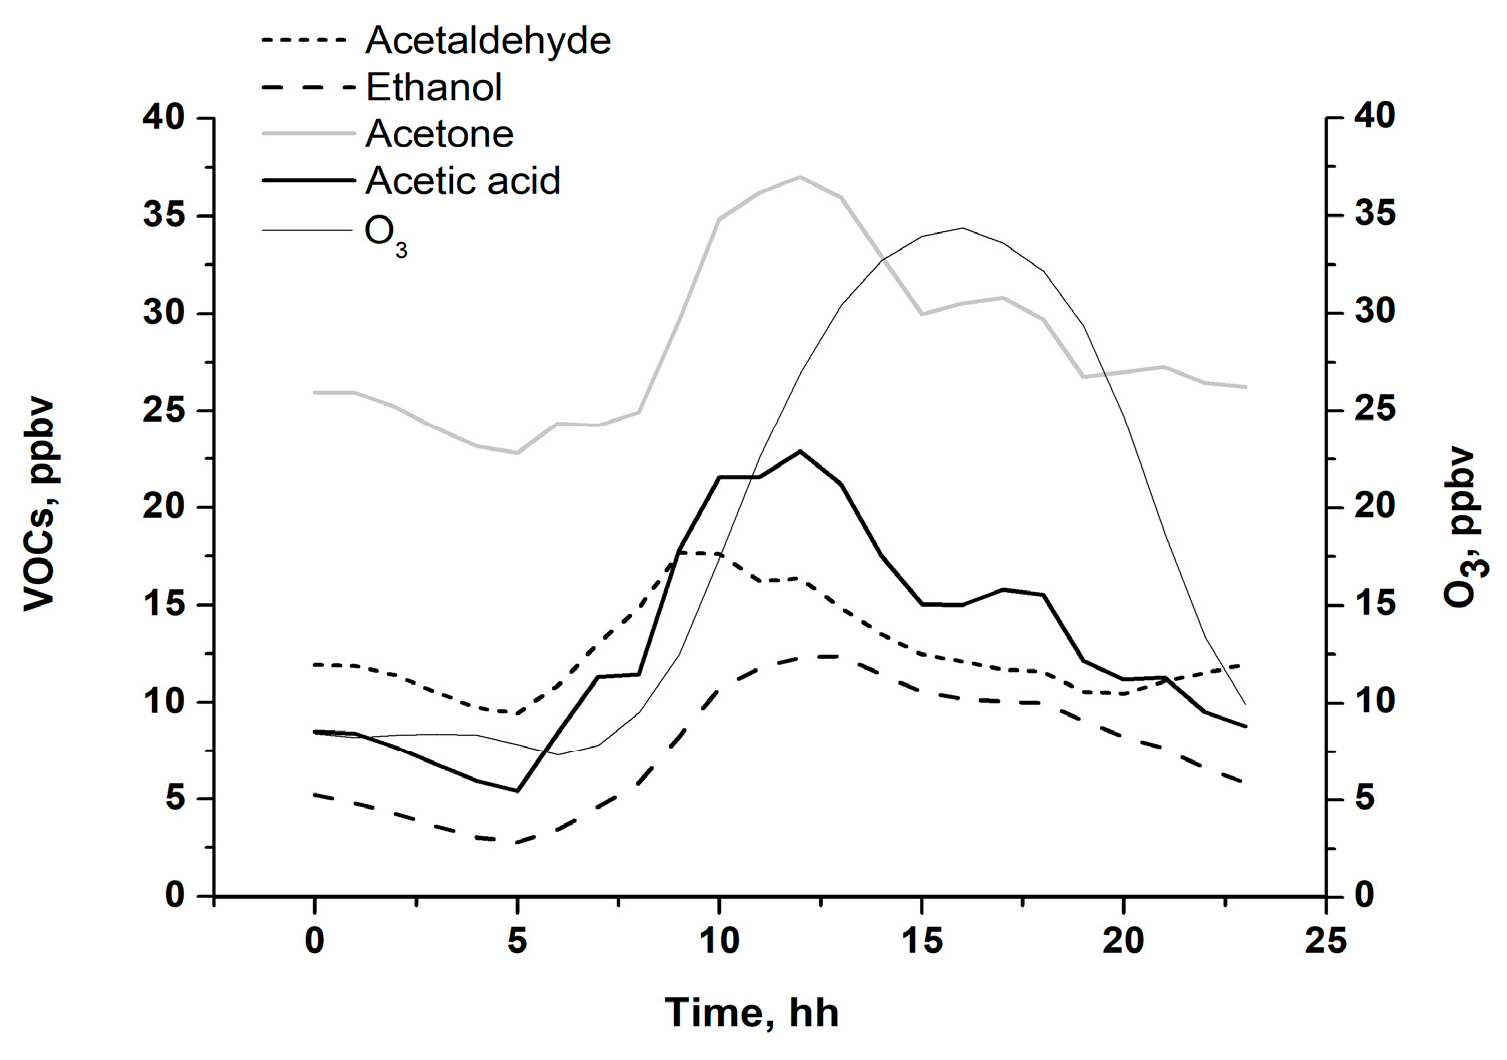
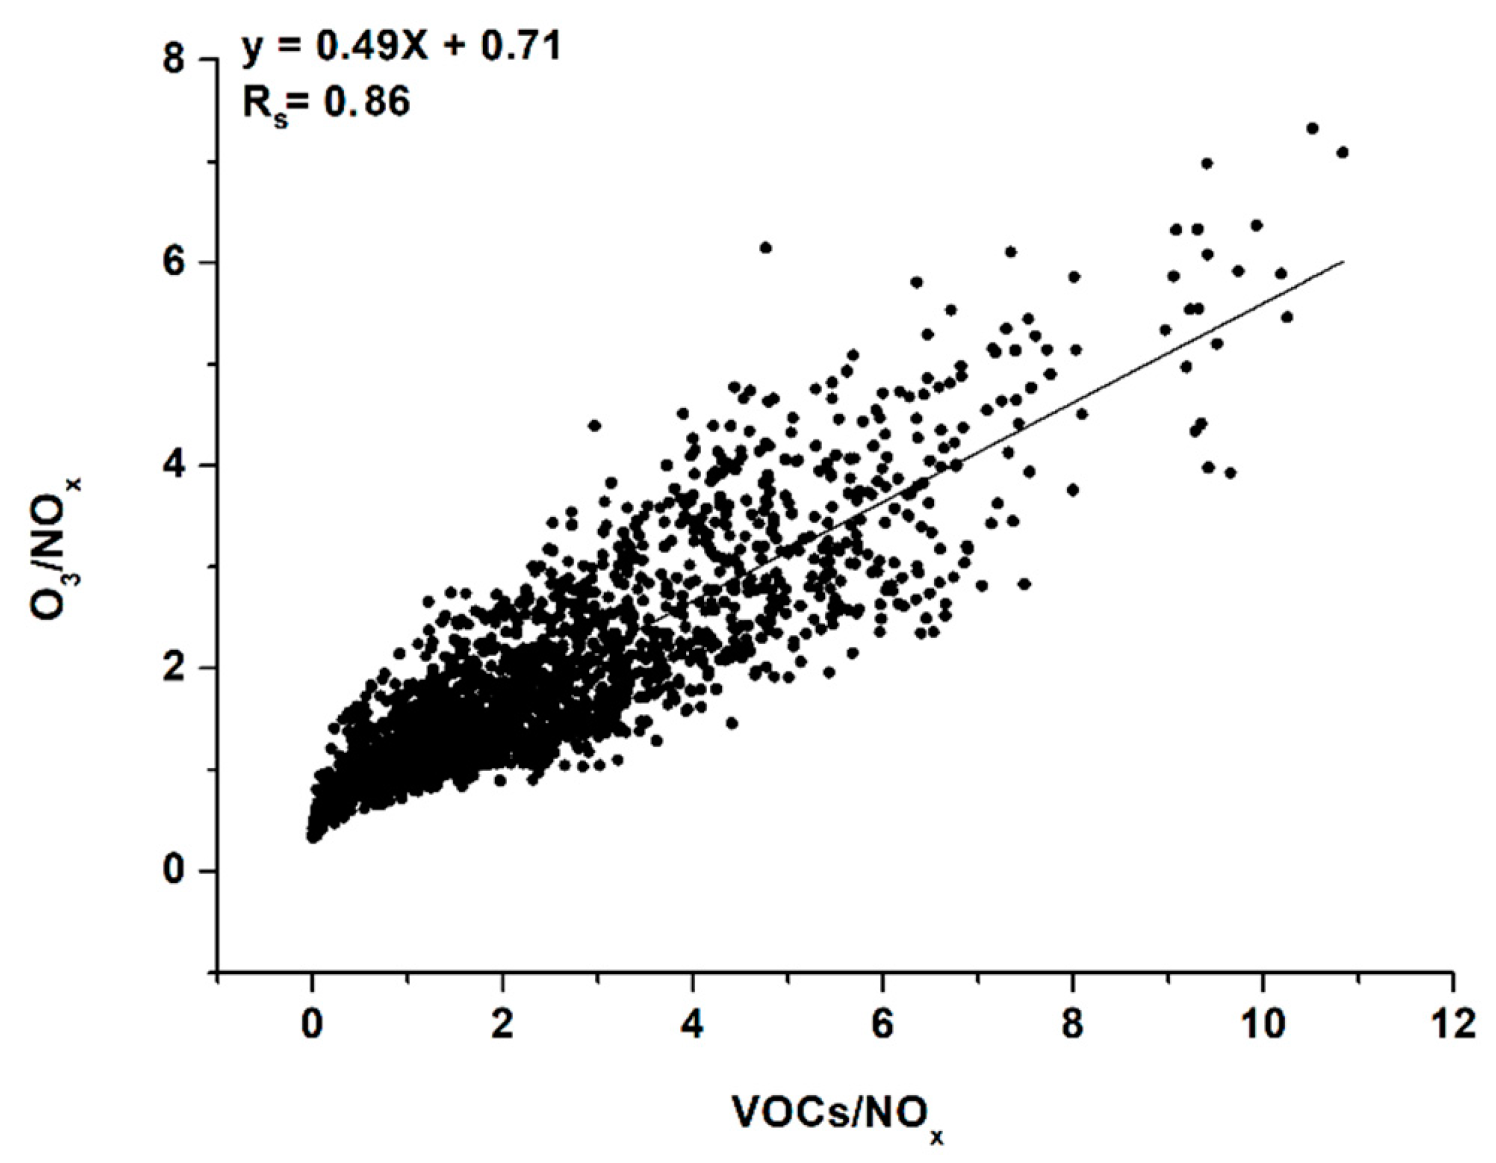
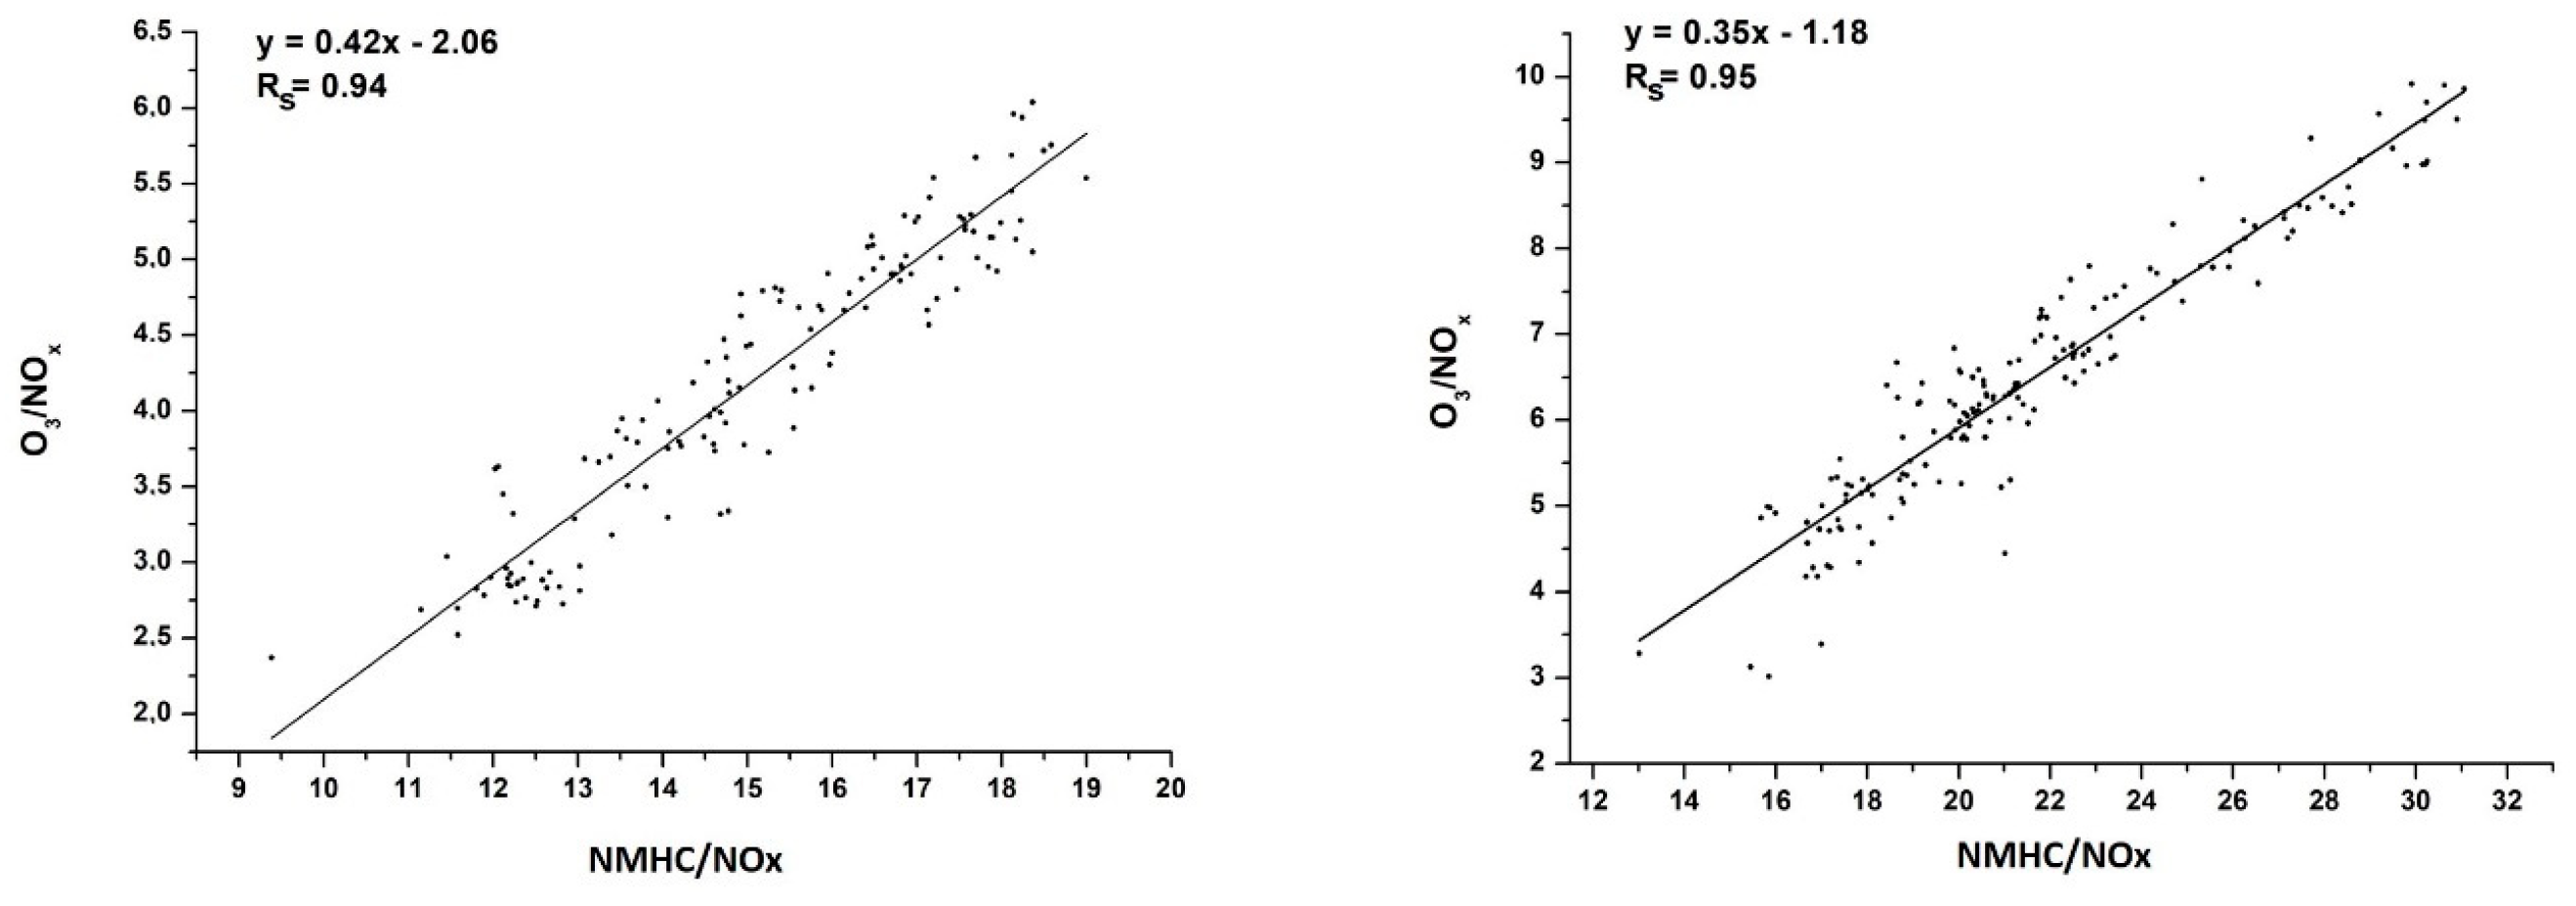
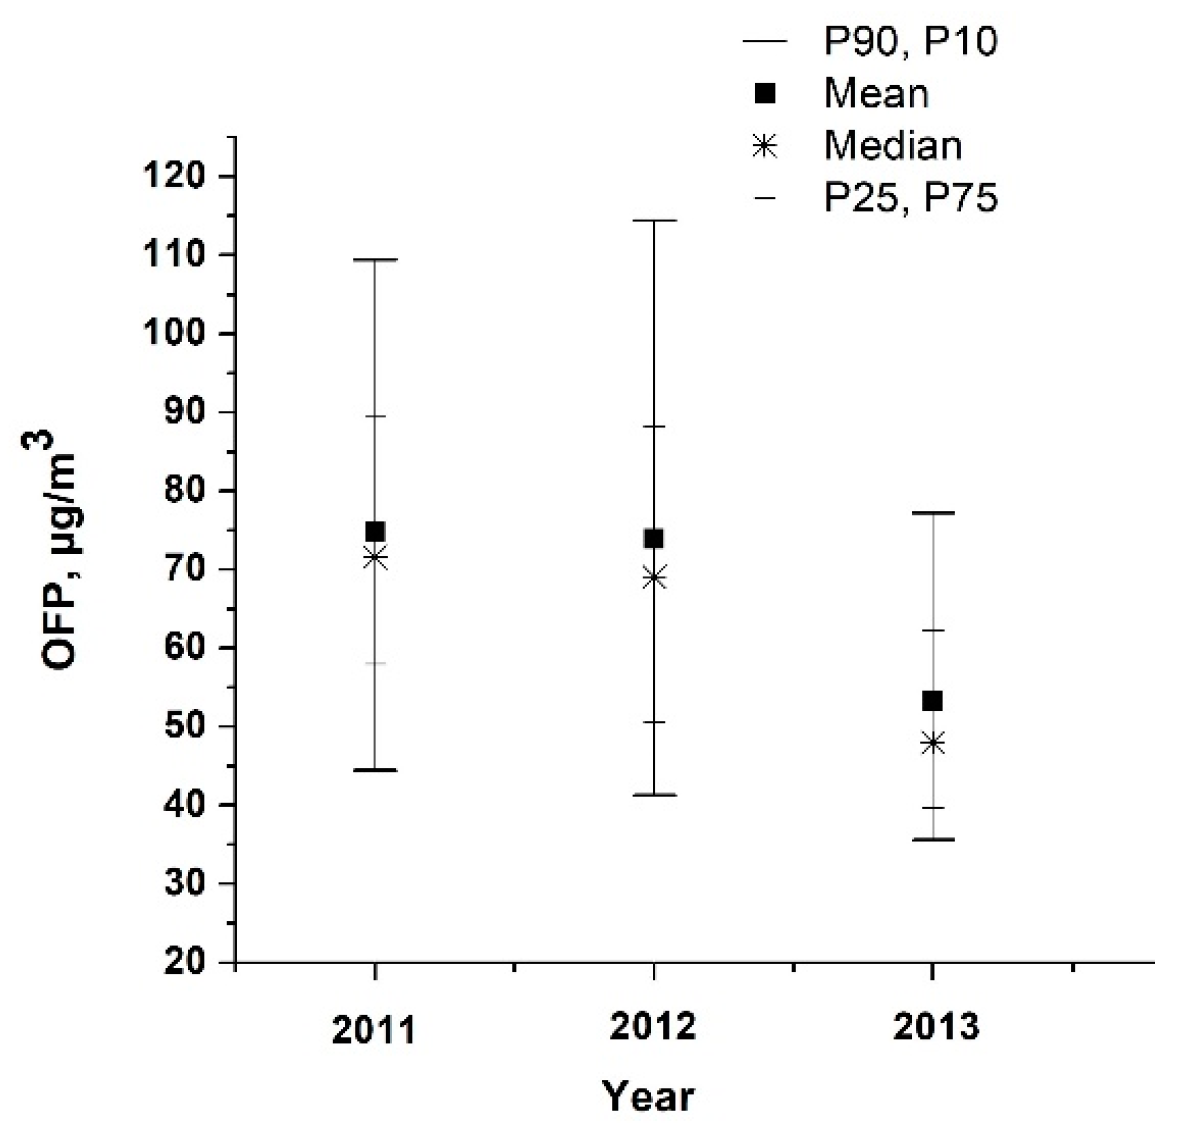
3.4. VOCs Impact on O3 Generation in Moscow
4. Conclusions
Supplementary Materials
Author Contributions
Funding
Acknowledgments
Conflicts of Interest
References
- Lefohn, A.S.; Malley, C.S.; Smith, L.; Wells, B.; Hazucha, M.; Simon, H.; Naik, V.; Mills, G.; Schultz, M.G.; Paoletti, E.; et al. Tropospheric ozone assessment report: Global ozone metrics for climate change, human health, and crop/ecosystem research. Elem. Sci. Anth. 2018, 6, 1–28. [Google Scholar] [CrossRef] [Green Version]
- Manisalidis, I.; Stavropoulou, E.; Stavropoulos, A.; Bezirtzoglou, E. Environmental and Health Impacts of Air Pollution: A Review. Front. Public Health 2020, 8, 14. [Google Scholar] [CrossRef] [PubMed] [Green Version]
- Seinfeld, J.H. Chemistry of Ozone in The Urban and Regional Atmosphere. In Conical Intersections; World Scientific Publishing Co Pte Ltd.: Singapore, 1995; Volume 3, pp. 34–57. [Google Scholar]
- Thielmann, A.; Grüebler, F.C.; Prévôt, A.S.H.; Staehelin, J. Empirical ozone isopleths as a tool to identify ozone production regimes. Geophys. Res. Lett. 2001, 28, 2369–2372. [Google Scholar] [CrossRef]
- Bowman, F.M.; Seinfeld, J.H. Ozone productivity of atmospheric organics. J. Geophys. Res. Space Phys. 1994, 99, 5309–5324. [Google Scholar] [CrossRef]
- Mazzuca, G.M.; Ren, X.; Loughner, C.P.; Estes, M.; Crawford, J.H.; Pickering, K.E.; Weinheimer, A.J.; Dickerson, R.R. Ozone production and its sensitivity to NOx and VOCs: Results from the DISCOVER-AQ field experiment, Houston 2013. Atmos. Chem. Phys. Discuss. 2016, 16, 14463–14474. [Google Scholar] [CrossRef] [Green Version]
- Sharma, A.; Sharma, S.K.; Rohtash; Mandal, T.K. Influence of ozone precursors and particulate matter on the variation of surface ozone at an urban site of Delhi, India. Sustain. Environ. Res. 2016, 26, 76–83. [Google Scholar] [CrossRef] [Green Version]
- Chang, C.-Y.; Faust, E.; Hou, X.; Lee, P.; Kim, H.C.; Hedquist, B.C.; Liao, K.-J. Investigating ambient ozone formation regimes in neighboring cities of shale plays in the Northeast United States using photochemical modeling and satellite retrievals. Atmos. Environ. 2016, 142, 152–170. [Google Scholar] [CrossRef]
- Karl, T.; Graus, M.; Striednig, M.; Lamprecht, C.; Hammerle, A.; Wohlfahrt, G.; Held, A.; Von Der Heyden, L.; Deventer, M.J.; Krismer, A.; et al. Urban eddy covariance measurements reveal significant missing NOx emissions in Central Europe. Sci. Rep. 2017, 7, 1–9. [Google Scholar] [CrossRef] [Green Version]
- Sillman, S. The relation between ozone, NOx and hydrocarbons in urban and polluted rural environments. Atmos. Environ. 1999, 33, 1821–1845. [Google Scholar] [CrossRef]
- Goldberg, D.L.; Vinciguerra, T.P.; Anderson, D.C.; Hembeck, L.; Canty, T.P.; Ehrman, S.H.; Martins, D.K.; Stauffer, R.M.; Thompson, A.M.; Salawitch, R.J.; et al. CAMx Ozone Source Attribution in the Eastern United States using Guidance from Observations during DISCOVER-AQ Maryland. Geophys. Res. Lett. 2016, 43, 2249–2258. [Google Scholar] [CrossRef] [Green Version]
- Jin, X.; Fiore, A.M.; Murray, L.T.; Valin, L.C.; Lamsal, L.N.; Duncan, B.; Boersma, K.F.; De Smedt, I.; Abad, G.G.; Chance, K.; et al. Evaluating a Space-Based Indicator of Surface Ozone-NOx-VOC Sensitivity Over Midlatitude Source Regions and Application to Decadal Trends. J. Geophys. Res. Atmos. 2017, 122, 10–439. [Google Scholar] [CrossRef] [PubMed]
- Duan, J.; Tan, J.; Yang, L.; Wu, S.; Hao, J. Concentration, sources and ozone formation potential of volatile organic compounds (VOCs) during ozone episode in Beijing. Atmos. Res. 2008, 88, 25–35. [Google Scholar] [CrossRef]
- Guo, H.; Lyu, X.; Cheng, H.; Ling, Z.; Guo, H. Overview on the spatial–temporal characteristics of the ozone formation regime in China. Environ. Sci. Process. Impacts 2019, 21, 916–929. [Google Scholar] [CrossRef]
- Tan, Z.; Lu, K.; Jiang, M.; Su, R.; Dong, H.; Zeng, L.; Xie, S.; Tan, Q.; Zhang, Y. Exploring ozone pollution in Chengdu, southwestern China: A case study from radical chemistry to O3-VOC-NOx sensitivity. Sci. Total. Environ. 2018, 636, 775–786. [Google Scholar] [CrossRef]
- Thielmann, A.; Prévôt, A.S.H.; Staehelin, J. Sensitivity of ozone production derived from field measurements in the Italian Po basin. J. Geophys. Res. Space Phys. 2002, 107, 8194. [Google Scholar] [CrossRef]
- Ren, X.; Van Duin, D.; Cazorla, M.; Chen, S.; Mao, J.; Zhang, L.; Brune, W.H.; Flynn, J.; Grossberg, N.; Lefer, B.L.; et al. Atmospheric oxidation chemistry and ozone production: Results from SHARP 2009 in Houston, Texas. J. Geophys. Res. Atmos. 2013, 118, 5770–5780. [Google Scholar] [CrossRef]
- Xue, L.K.; Wang, T.; Gao, J.; Ding, A.; Zhou, X.H.; Blake, D.R.; Wang, X.F.; Saunders, S.M.; Fan, S.J.; Zuo, H.C.; et al. Ozone production in four major cities of China: Sensitivity to ozone precursors and heterogeneous processes. Atmos. Chem. Phys. Discuss. 2013, 13, 27243–27285. [Google Scholar] [CrossRef]
- Elansky, N.F. Impurities in the atmosphere of continental Russia. Priroda 2002, 2, 32–43, [In Russian]. [Google Scholar]
- Elansky, N.; Lokoshchenko, M.A.; Trifanova, A.V.; Belikov, I.B.; Ckorokhod, A.I. On Contents of Trace Gases in the Atmospheric Surface Layer over Moscow. Izv. Atmos. Ocean. Phys. 2015, 51, 39–51. [Google Scholar] [CrossRef]
- Elanskii, N.F.; Belikov, I.B.; Golitsyn, G.S.; Grisenko, A.M.; Lavrova, O.V.; Pankratova, N.V.; Safronov, A.N.; Skorokhod, A.I.; Shumskii, R.A. Observations of the atmosphere composition in the Moscow megapolis from a mobile laboratory. Dokl. Earth Sci. 2010, 432, 649–655. [Google Scholar] [CrossRef]
- Gorchakov, G.I.; Semutnikova, E.G.; Isakov, A.A.; Kopeikin, V.M.; Karpov, A.V.; Kurbatov, G.A.; Ponomareva, T.Y.; Sokolov, A.V. The Moscow smoke haze of 2010: Extreme aerosol and gaseous air pollution of in the Moscow region. Atmos. Ocean. Opt. 2011, 24, 6, 452–458. [Google Scholar]
- Yurganov, L.N.; Rakitin, V.; Dzhola, A.; August, T.; Fokeeva, E.; George, M.; Gorchakov, G.; Grechko, E.; Hannon, S.; Karpov, A.; et al. Satellite- and ground-based CO total column observations over 2010 Russian fires: Accuracy of top-down estimates based on thermal IR satellite data. Atmos. Chem. Phys. Discuss. 2011, 11, 7925–7942. [Google Scholar] [CrossRef] [Green Version]
- Lokoshchenko, M.A.; Elansky, N.F.; Trifanova, A.V.; Belikov, I.B.; Skorokhod, A.I. Limiting levels of air pollution in Moscow. Vestn. Mosk. Univ. Geogr. 2016, 5, 29–39. [Google Scholar]
- Lokoshchenko, M.A.; Elanskii, N.F.; Malyashova, V.P.; Trifanova, A.V. Dynamics of the surface content of sulfur dioxide in Moscow. Atmos. Ocean. Opt. 2015, 21, 384–391. [Google Scholar]
- Causes and factors of positive anomalies of surface ozone in the Moscow region and the south-eastern coast of the Crimea. Atmos. Ocean. Opt. 2016, 29, 493–502. [CrossRef]
- GOST 17.2.3.01-86. Environmental Protection. Atmospheric Air. Residential Air Quality Control Regulations; USSR State Committee of Standards: Moscow, Russia, 1986. (in Russian) [Google Scholar]
- Elansky, N.F.; Lokoshchenko, M.A.; Belikov, I.B.; Skorokhod, A.I.; Shumskii, R.A. Variability of trace gases in the atmospheric surface layer from observations in the city of Moscow. Izv. Atmos. Ocean. Phys. 2007, 43, 219–231. [Google Scholar] [CrossRef]
- Elansky, N.F.; Belikov, I.B.; Berezina, E.V. Atmospheric Composition over Northern Eurasia: The TROICA Experiments; Agrospas: Moscow, Russia, 2009; pp. 73–90. [Google Scholar]
- Chubarova, N.Y. UV variability in Moscow according to long-term UV measurements and reconstruction model. Atmos. Chem. Phys. Discuss. 2008, 8, 3025–3031. [Google Scholar] [CrossRef] [Green Version]
- Nezval, E.I.; Chubarova, N.E. Long-term variability of UV radiation in the spectral range of 300–380 nm in Moscow. Russ. Meteorol. Hydrol. 2017, 42, 693–699. [Google Scholar] [CrossRef]
- Elansky, N.F.; Shilkin, A.V.; Ponomarev, N.A.; Semutnikova, E.G.; Zakharova, P.V. Weekly patterns and weekend effects of air pollution in the Moscow megacity. Atmos. Environ. 2020, 224, 117303. [Google Scholar] [CrossRef]
- Crutzen, P.J.; Elansky, N.F.; Hahn, M.; Golitsyn, G.S.; Brenninkmeijer, C.A.M.; Scharffe, D.H.; Belikov, I.B.; Maiss, M.; Bergamaschi, P.; Röckmann, T.; et al. Trace Gas Measurements Between Moscow and Vladivostok Using the Trans-Siberian Railroad. J. Atmos. Chem. 1998, 29, 179–194. [Google Scholar] [CrossRef]
- Monks, P.S. A review of the observations and origins of the spring ozone maximum. Atmos. Environ. 2000, 34, 3545–3561. [Google Scholar] [CrossRef]
- Pochanart, P.; Kajii, Y.; Potemkin, V.M.; Khodzher, T.V.; Akimoto, H. Regional background ozone and carbon monoxide variations in remote Siberia/East Asia. J. Geophys. Res. Space Phys. 2003, 108, 4028. [Google Scholar] [CrossRef]
- Belikov, I.B.; Belousov, V.A.; Gubanova, D.P.; Skorokhod, A.I. Variations in the Concentrations of Volatile Organic Compounds and Aerosol Particles PM2.5 In the Surface Layer of the Atmosphere of Moscow. In Proceedings of the Fundamental and Applied Aspects of Geology, Geophysics and Geoecology Using Modern Information Technologies, Maykop, Russia, 20–24 May 2019; pp. 80–89, ISBN 978-5-907004-38-2. (in Russian). [Google Scholar]
- Lokoshchenko, M.A. Long-Term Sodar Observations in Moscow and a New Approach to Potential Mixing Determination by Radiosonde Data. J. Atmos. Ocean. Technol. 2002, 19, 1151–1162. [Google Scholar] [CrossRef]
- Liu, S.C.; Trainer, M.; Fehsenfeld, F.C.; Parrish, D.D.; Illiams, E.J.W.; Fahey, D.W.; Hübler, G.; Murphy, P.C. Ozone production in the rural troposphere and the implications for regional and global ozone distributions. J. Geophys. Res. Space Phys. 1987, 92, 4191–4207. [Google Scholar] [CrossRef]
- Tiwari, V.; Hanai, Y.; Masunaga, S. Ambient levels of volatile organic compounds in the vicinity of petrochemical industrial area of Yokohama, Japan. Air Qual. Atmos. Health 2010, 3, 65–75. [Google Scholar] [CrossRef] [PubMed] [Green Version]
- Shaw, M.D.; Lee, J.D.; Davison, B.; Vaughan, A.R.; Purvis, R.; Harvey, A.; Lewis, A.C.; Hewitt, C.N. Airborne determination of the temporo-spatial distribution of benzene, toluene, nitrogen oxides and ozone in the boundary layer across Greater London, UK. Atmos. Chem. Phys. Discuss. 2015, 15, 5083–5097. [Google Scholar] [CrossRef] [Green Version]
- Carballo-Pat., C.G.; Cerón-Bretón, J.G.; Cerón-Bretón, R.M.; Ramírez-Lara, E.; Aguilar-Ucán, C.A.; Montalvo-Romero, C.; Guevara-Carrió, E.; Córdova-Quiroz, A.V.; Gamboa-Fernández, J.M.; Uc-Chi, M.P. Latest trends in Energy. Environment and Development. In Proceedings of the 7-th International Conference on Environmental and Geological Sciences and Engineering (EG’14), Salerno, Italy, 3–5 June 2014; pp. 132–140. [Google Scholar]
- Warneke, C.; van der Veen, C.; Luxembourg, S.; de Gouw, J.A.; Kok, A. Measurements of benzene and toluene in ambient air using proton-transfer-reaction mass spectrometry: Calibration humidity dependence and field intercomparison. Int. J. Mass Spectrom. 2001, 207, 167–182. [Google Scholar] [CrossRef]
- Atkinson, R. Atmospheric chemistry of VOCs and NOx. Atmos. Environ. 2000, 34, 2063–2101. [Google Scholar] [CrossRef]
- Gelencsér, A.; Siszler, A.K.; Hlavay, J. Toluene−Benzene Concentration Ratio as a Tool for Characterizing the Distance from Vehicular Emission Sources. Environ. Sci. Technol. 1997, 31, 2869–2872. [Google Scholar] [CrossRef]
- Wagner, P.; Kuttler, W. Biogenic and anthropogenic isoprene in the near-surface urban atmosphere—A case study in Essen, Germany. Sci. Total Environ. 2014, 475, 104–115. [Google Scholar] [CrossRef] [Green Version]
- Wang, J.L.; Chew, C.; Chang, C.Y.; Liao, W.C.; Lung, S.C.C.; Chen, W.N.; Lee, P.J.; Lin, P.H.; Chang, C.C. Biogenic isoprene in subtropical urban settings and implications for air quality. Atmos. Environ. 2013, 79, 369–379. [Google Scholar] [CrossRef]
- Chang, C.-Y.; Wang, J.-L.; Lung, S.-C.; Lee, P.-J.; Chew, C.; Liao, W.-C.; Chen, W.-N.; Ou-Yang, C.-F. Seasonal characteristics of biogenic and anthropogenic isoprene in tropical–subtropical urban environments. Atmos. Environ. 2014, 99, 298–308. [Google Scholar] [CrossRef] [Green Version]
- Borbon, A.; Fontaine, H.; Locoge, N.; Veillerot, M.; Galloo, J. Developing receptor-oriented methods for non-methane hydrocarbon characterisation in urban air—Part I: Source identification. Atmos. Environ. 2003, 37, 4051–4064. [Google Scholar] [CrossRef]
- Carter, W.P.L. Development of Ozone Reactivity Scales for Volatile Organic Compounds. J. Air Waste Manag. Assoc. 1994, 44, 881–899. [Google Scholar] [CrossRef] [Green Version]
- Carter, W.P.L. Development of the SAPRC-07 Chemical Mechanism and Updated Ozone Reactivity Scales, Final report to the California Air Resources Board Contract No. 03-318. California, USA. 27 January 2010. Available online: https://intra.engr.ucr.edu/~carter/pubs/ (accessed on 20 November 2020).


| Compound | Instrument | Response Time, s | Range Limits |
|---|---|---|---|
| NOx, ppbv | TE42C-TL (Thermo Inc., USA) | 60 | 0.05–200 |
| O3, ppbv | 1008AH (Dasibi Inc., USA) | 60 | 1–1000 |
| CO, ppmv | TE48S (Thermo Inc., USA) | 60 | 0.05–10 |
| NMHC, μ/m3 | APHA-360 (Horiba Inc., Japan) | 60 | 0.1–100 |
| VOCs, ppbv | Compact PTR-MS (Ionicon Analytic GmbH, Austria) | 0.5/each comp. | 0.05–1000 |
| Acetaldeh. | Acetone | Acet.acid | Ethanol | MVK + MACR | O3 | CO | NOx | |
|---|---|---|---|---|---|---|---|---|
| Acetaldeh. | 1.00 | 0.91 | 0.62 | 0.55 | 0.81 | 0.47 | 0.00 | 0.00 |
| Acetone | 0.91 | 1.00 | 0.58 | 0.45 | 0.82 | 0.45 | 0.11 | 0.00 |
| Acet.acid | 0.62 | 0.58 | 1.00 | 0.82 | 0.75 | 0.60 | −0.09 | 0.00 |
| Ethanol | 0.55 | 0.45 | 0.82 | 1.00 | 0.67 | 0.52 | −0.16 | −0.09 |
| MVK + MACR | 0.78 | 0.82 | 0.75 | 0.67 | 1.00 | 0.49 | 0.00 | 0.00 |
| O3 | 0.47 | 0.45 | 0.60 | 0.52 | 0.49 | 1.00 | −0.39 | −0.49 |
| CO | 0.00 | 0.11 | −0.09 | −0.16 | 0.00 | −0.39 | 1.00 | 0.82 |
| NOx | 0.00 | 0.00 | 0.00 | −0.09 | 0.00 | −0.49 | 0.82 | 1 |
| VOC | N Total | Mean | Standard Deviation | P10 | P90 |
|---|---|---|---|---|---|
| Acetaldehyde | 2416 | 20.39 | 14.71 | 4.82 | 39.84 |
| Ethanol | 2422 | 4.74 | 3.12 | 1.65 | 9.89 |
| 1.3-Butadiene | 2424 | 13.86 | 9.73 | 6.74 | 28.87 |
| Acetone | 2424 | 1.45 | 0.96 | 0.23 | 2.71 |
| Acetic acid | 2418 | 2.91 | 1.69 | 1.04 | 5.33 |
| Isoprene | 2424 | 9.58 | 12.06 | 3.53 | 26.20 |
| MVK + MACR | 2424 | 3.57 | 1.16 | 2.53 | 5.14 |
| Benzene | 2424 | 0.28 | 0.08 | 0.20 | 0.36 |
| MBO | 2424 | 1.88 | 0.49 | 1.44 | 2.50 |
| Toluene | 2424 | 1.86 | 0.80 | 1.22 | 2.73 |
| Phenol | 2424 | 0.87 | 0.39 | 0.62 | 1.22 |
| Styrene | 2424 | 0.43 | 0.07 | 0.36 | 0.51 |
| C8-aromatics | 2424 | 2.71 | 1.17 | 1.77 | 4.03 |
| C9-aromatics | 2424 | 2.24 | 0.84 | 1.50 | 3.02 |
| Terpenes | 2424 | 0.78 | 0.25 | 0.52 | 1.03 |
| Total VOCs | 2424 | 67.27 | 27.04 | 38.13 | 102.90 |
| VOC | N Total | Mean | Standard Deviation | P10 | P90 | |||||
|---|---|---|---|---|---|---|---|---|---|---|
| 1 | 2 | 1 | 2 | 1 | 2 | 1 | 2 | 1 | 2 | |
| Acetaldehyde | 207 | 264 | 49.92 | 33.08 | 8.76 | 7.04 | 39.54 | 24.6 | 60.29 | 42.06 |
| Ethanol | 207 | 264 | 14.43 | 13.39 | 1.16 | 1.45 | 12.88 | 11.35 | 15.97 | 15.07 |
| 1.3-Butadiene | 207 | 264 | 15.73 | 12.92 | 2.15 | 2.11 | 13.08 | 10.39 | 18.60 | 15.47 |
| Acetone | 204 | 264 | 4.23 | 3.87 | 0.40 | 0.46 | 3.71 | 3.38 | 4.78 | 4.45 |
| Acetic acid | 182 | 263 | 7.27 | 6.78 | 0.95 | 0.90 | 6.09 | 5.67 | 8.59 | 7.98 |
| Isoprene | 207 | 264 | 7.98 | 6.93 | 1.64 | 1.57 | 5.95 | 4.85 | 10.20 | 8.85 |
| MVK + MACR | 207 | 264 | 7.76 | 6.03 | 1.39 | 1.02 | 5.90 | 4.73 | 9.46 | 7.42 |
| Benzene | 207 | 264 | 0.42 | 0.31 | 0.06 | 0.06 | 0.35 | 0.23 | 0.51 | 0.39 |
| MBO | 207 | 264 | 3.25 | 2.96 | 0.51 | 0.53 | 2.66 | 2.33 | 3.95 | 3.67 |
| Toluene | 207 | 264 | 3.03 | 2.09 | 0.59 | 0.45 | 2.30 | 1.55 | 3.91 | 2.66 |
| Phenol | 207 | 264 | 0.81 | 0.91 | 0.18 | 0.18 | 0.57 | 0.67 | 1.06 | 1.15 |
| Styrene | 207 | 264 | 0.37 | 0.43 | 0.09 | 0.08 | 0.25 | 0.32 | 0.48 | 0.54 |
| C8-aromatics | 207 | 264 | 3.57 | 3.01 | 0.94 | 0.65 | 2.52 | 2.20 | 4.85 | 3.79 |
| C9-aromatics | 207 | 264 | 2.12 | 2.05 | 0.59 | 0.61 | 1.33 | 1.29 | 2.97 | 2.88 |
| Terpenes | 207 | 264 | 0.76 | 0.71 | 0.33 | 0.32 | 0.30 | 0.32 | 1.19 | 1.13 |
| Total VOCs | 207 | 264 | 121.70 | 95.50 | 12.22 | 11.27 | 105.86 | 81.3 | 136.38 | 110.36 |
Publisher’s Note: MDPI stays neutral with regard to jurisdictional claims in published maps and institutional affiliations. |
© 2020 by the authors. Licensee MDPI, Basel, Switzerland. This article is an open access article distributed under the terms and conditions of the Creative Commons Attribution (CC BY) license (http://creativecommons.org/licenses/by/4.0/).
Share and Cite
Berezina, E.; Moiseenko, K.; Skorokhod, A.; Pankratova, N.V.; Belikov, I.; Belousov, V.; Elansky, N.F. Impact of VOCs and NOx on Ozone Formation in Moscow. Atmosphere 2020, 11, 1262. https://doi.org/10.3390/atmos11111262
Berezina E, Moiseenko K, Skorokhod A, Pankratova NV, Belikov I, Belousov V, Elansky NF. Impact of VOCs and NOx on Ozone Formation in Moscow. Atmosphere. 2020; 11(11):1262. https://doi.org/10.3390/atmos11111262
Chicago/Turabian StyleBerezina, Elena, Konstantin Moiseenko, Andrei Skorokhod, Natalia V. Pankratova, Igor Belikov, Valery Belousov, and Nikolai F. Elansky. 2020. "Impact of VOCs and NOx on Ozone Formation in Moscow" Atmosphere 11, no. 11: 1262. https://doi.org/10.3390/atmos11111262
APA StyleBerezina, E., Moiseenko, K., Skorokhod, A., Pankratova, N. V., Belikov, I., Belousov, V., & Elansky, N. F. (2020). Impact of VOCs and NOx on Ozone Formation in Moscow. Atmosphere, 11(11), 1262. https://doi.org/10.3390/atmos11111262


