Mutual Interference of Local Gravity Wave Forcings in the Stratosphere


Abstract
:1. Introduction
2. Numerical Model Experiments
2.1. Model Description
2.2. Reference MUAM Run
2.3. Experiment Description
3. Effect on the Circulation
3.1. Hotspot Effects on the Background Circulation
3.2. Hotspot Effects on Distribution of the Geopotential Height and Vorticity
4. Effect on Planetary Wave Activity—Amplitudes and Propagation Conditions
4.1. Impact on the Atmospheric Wave Activity in the Region of the GW Hotspots
4.2. Impact on the SPW 1 Activity in the Middle Atmosphere
5. Conclusions
Author Contributions
Funding
Conflicts of Interest
Abbreviations
| AO | Atlantic Oscillation |
| CMAM | Canadian Middle atmosphere Model |
| EA | East Asia |
| ENSO | El Nino Southern Oscillation |
| EP | Eliassen–Palm |
| EUV | Extreme ultra violet |
| GCM | Global circulation model |
| GPS | Global positioning system |
| GW | Gravity wave |
| GWD | Gravity wave drag |
| GWD | zonal gravity wave drag |
| GWD | meridional gravity wave drag |
| GWD | heating due to breaking gravity waves |
| HI | Himalayas |
| L | Linearity factor |
| MUAM | Middle and upper atmosphere model |
| NAO | North Atlantic Oscillation |
| NH | Northern Hemisphere |
| OGW | Orographic gravity wave |
| PW | Planetary wave |
| QBO | Quasi-Biennial Oscillation |
| Ref | Reference |
| RM | Rocky Mountains |
| SH | Southern Hemisphere |
| SPW | Stationary planetary wave |
| SSW | Sudden stratospheric warming |
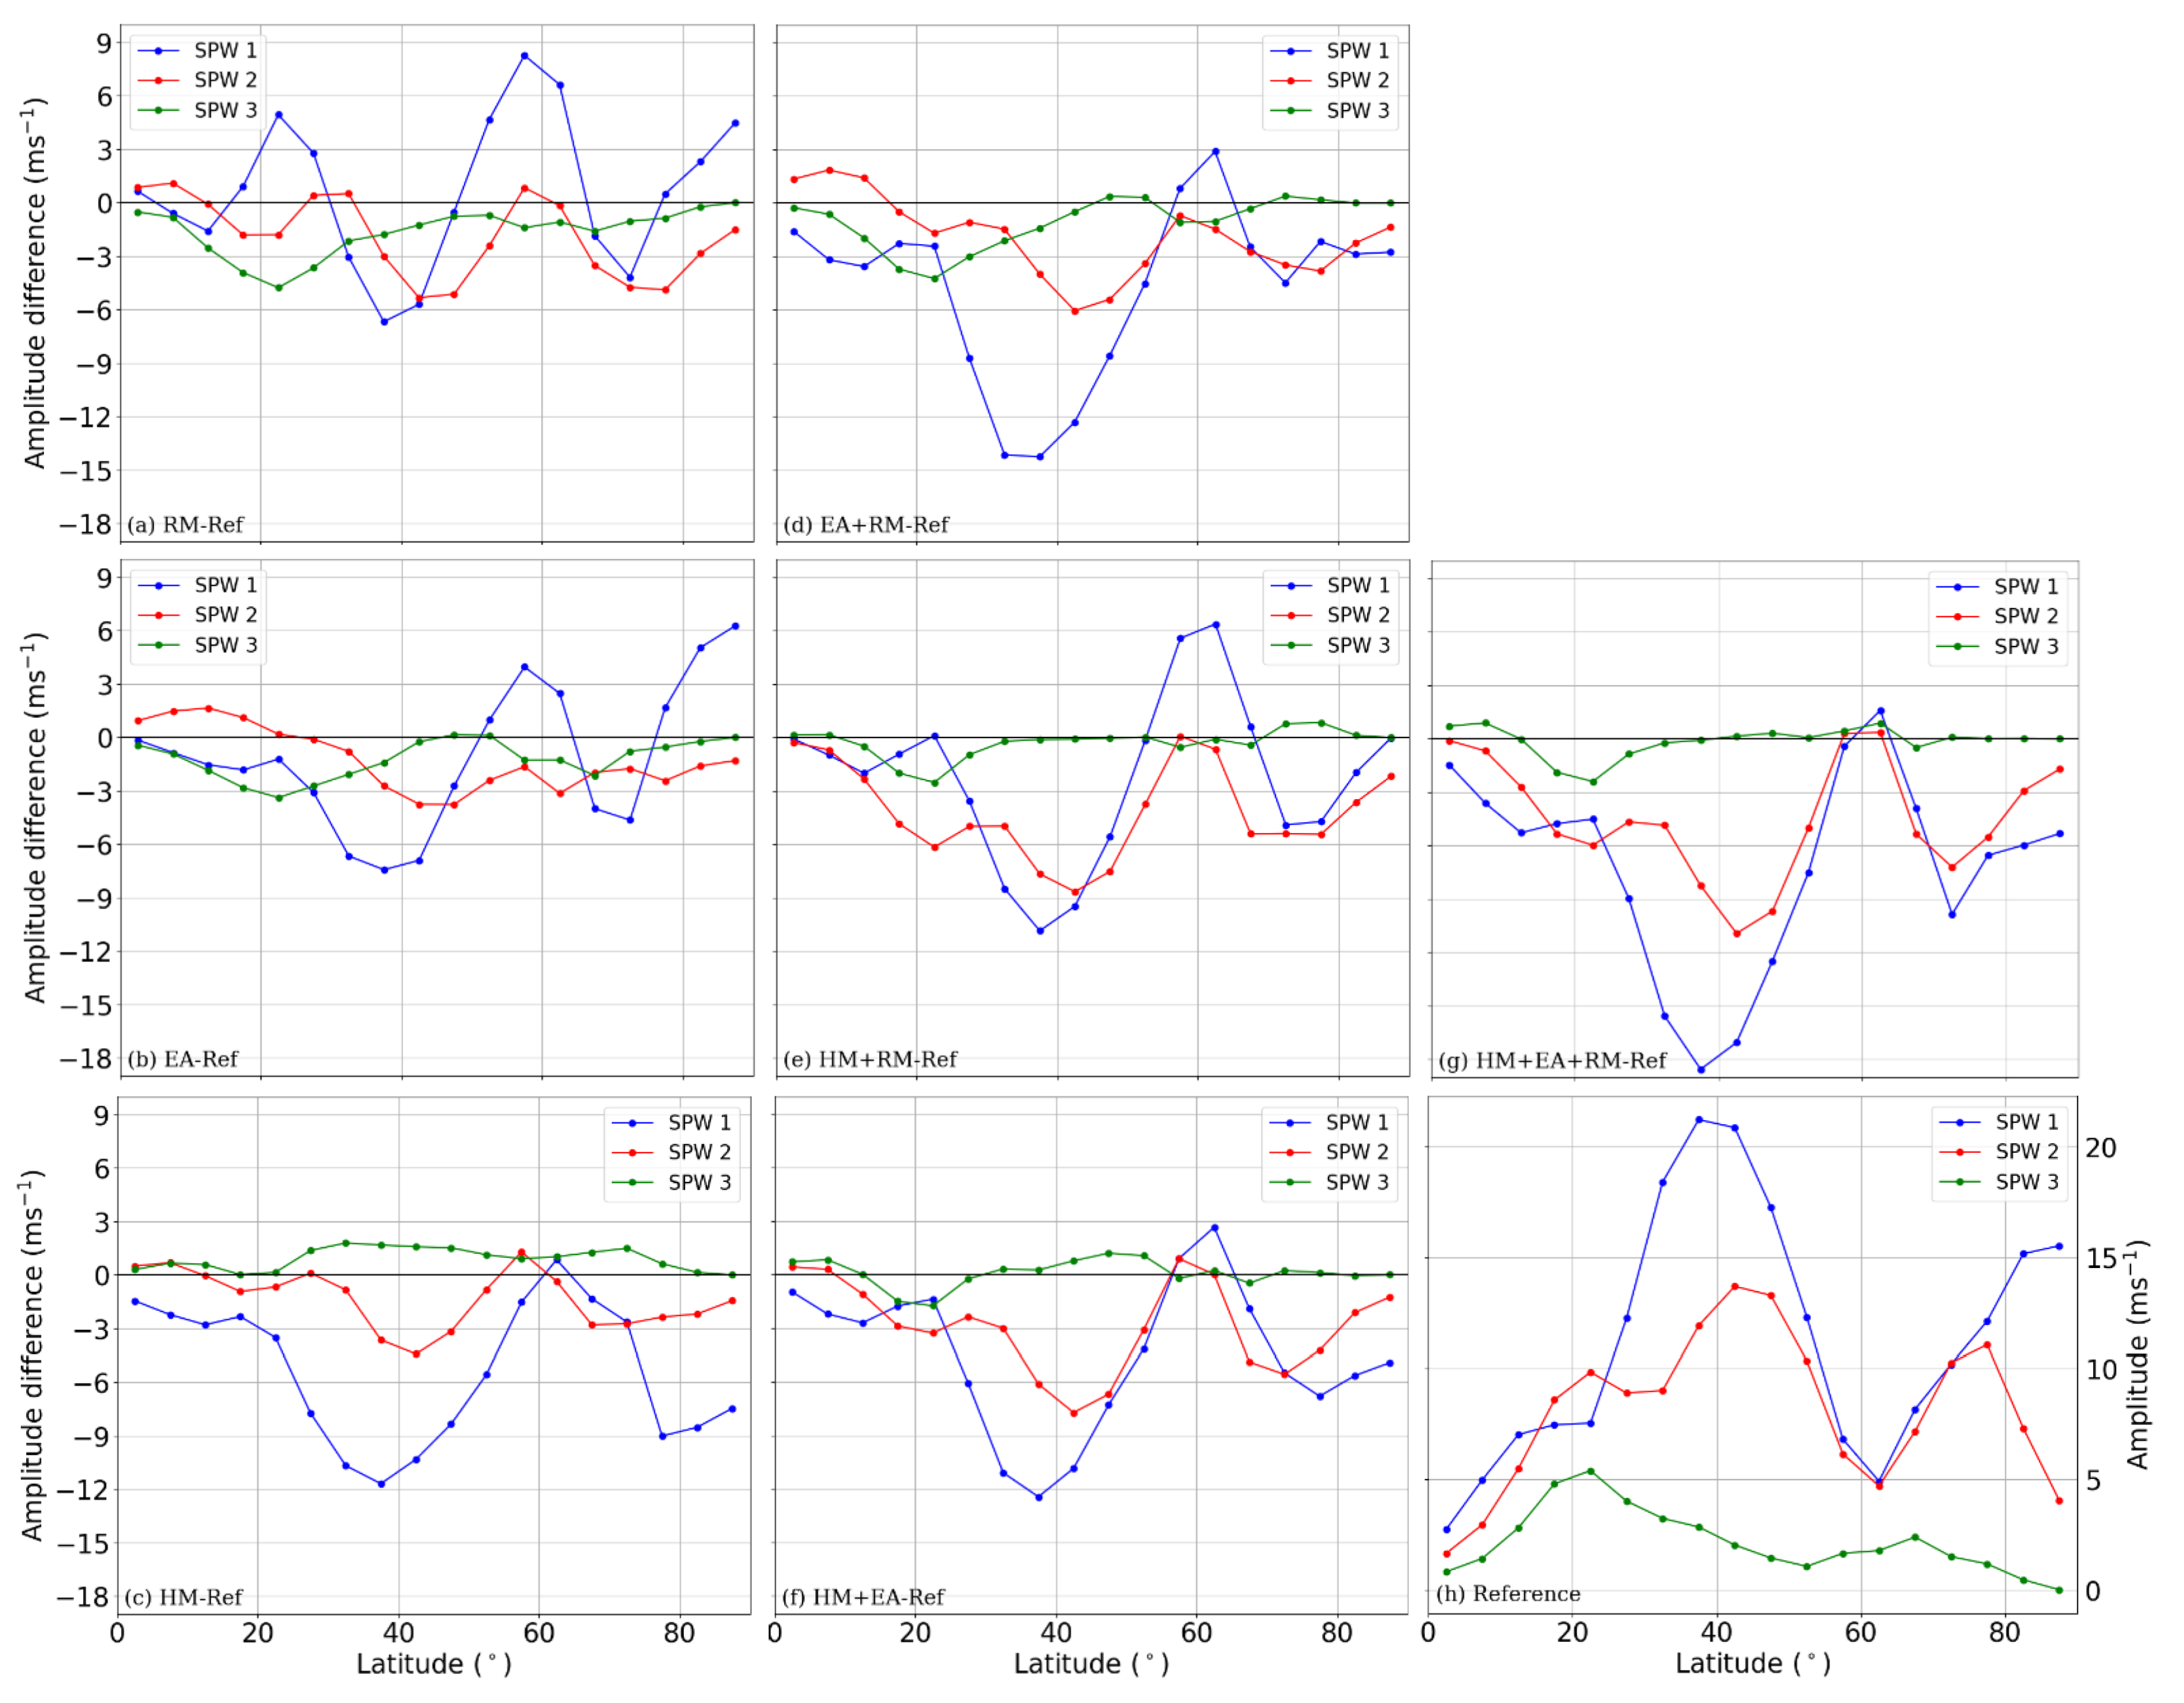
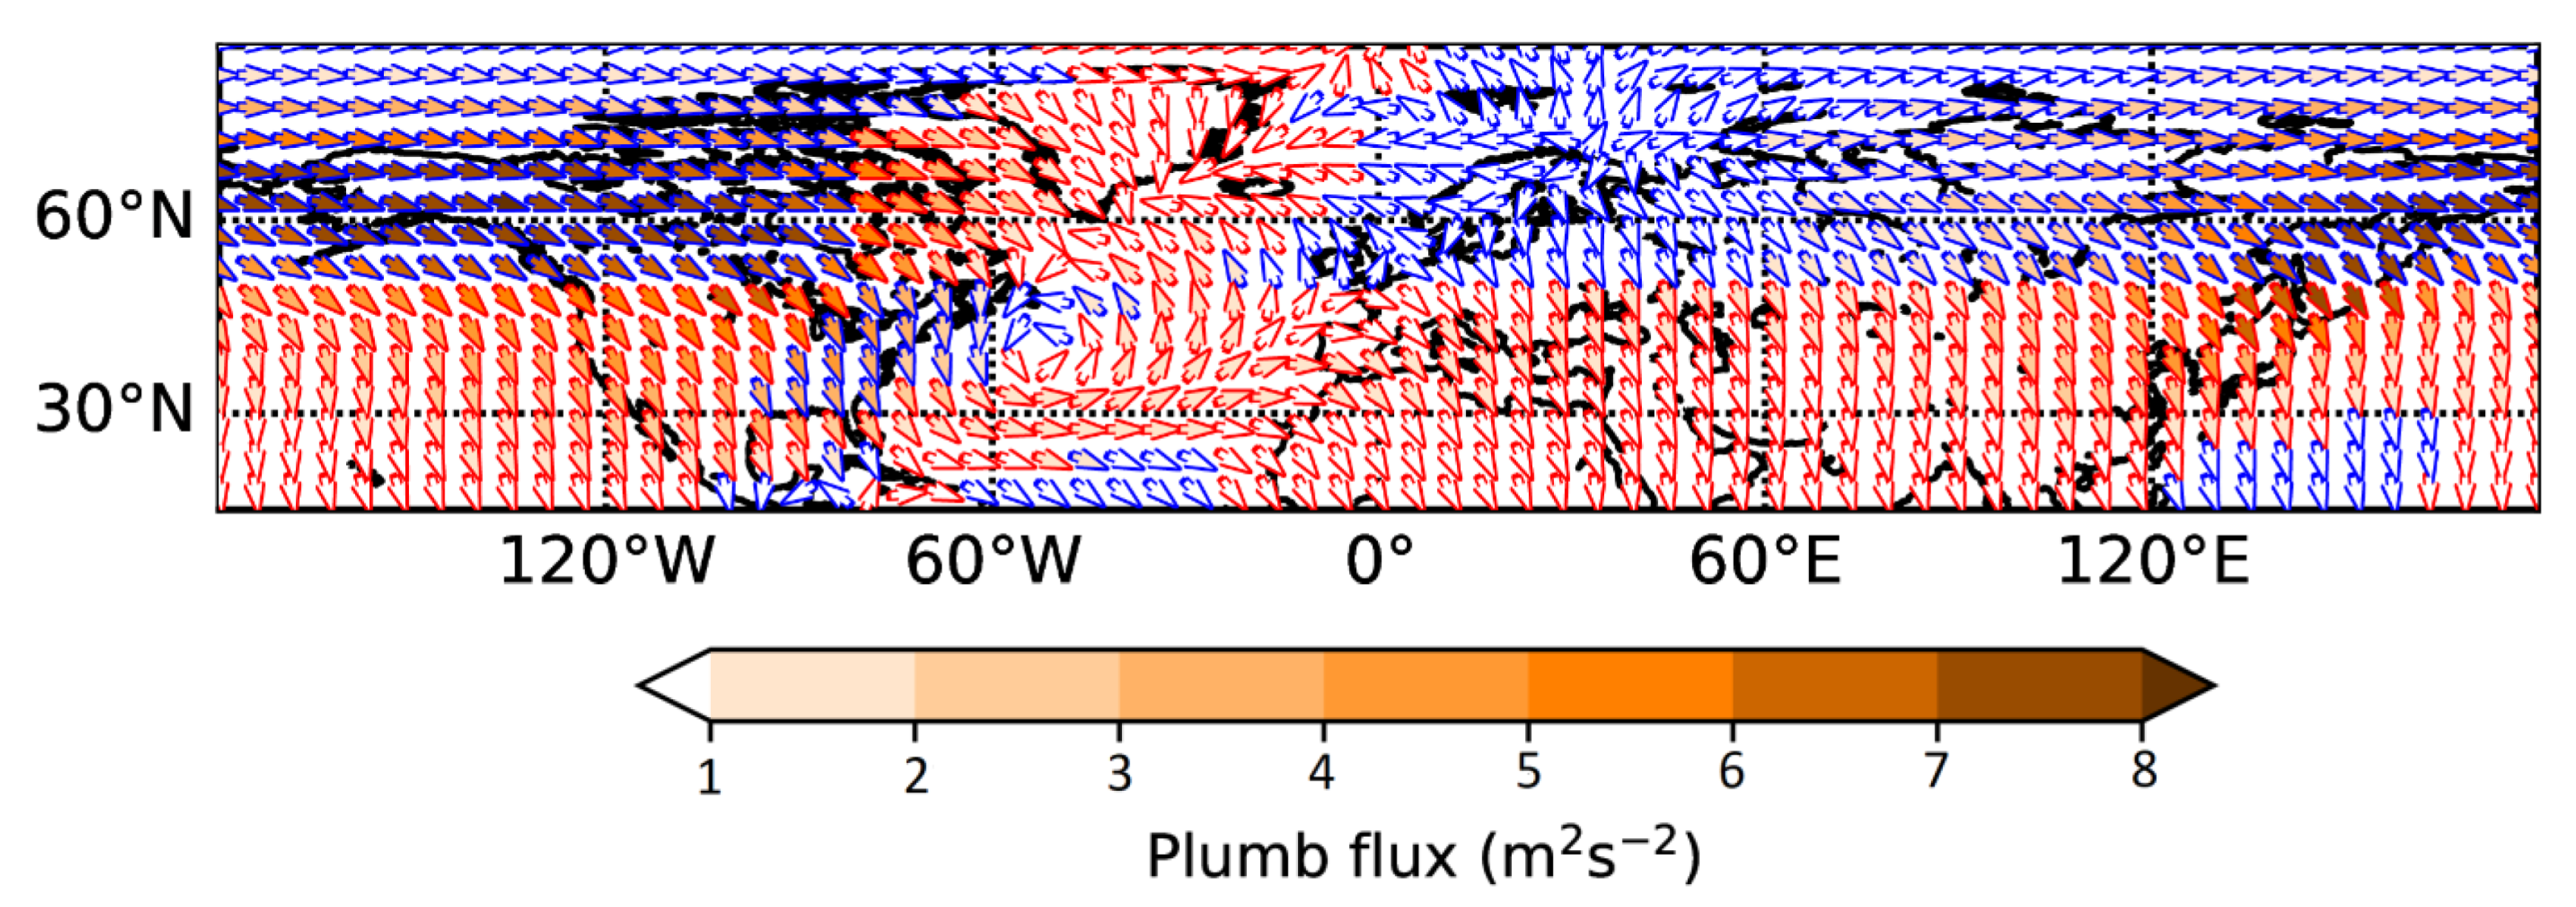
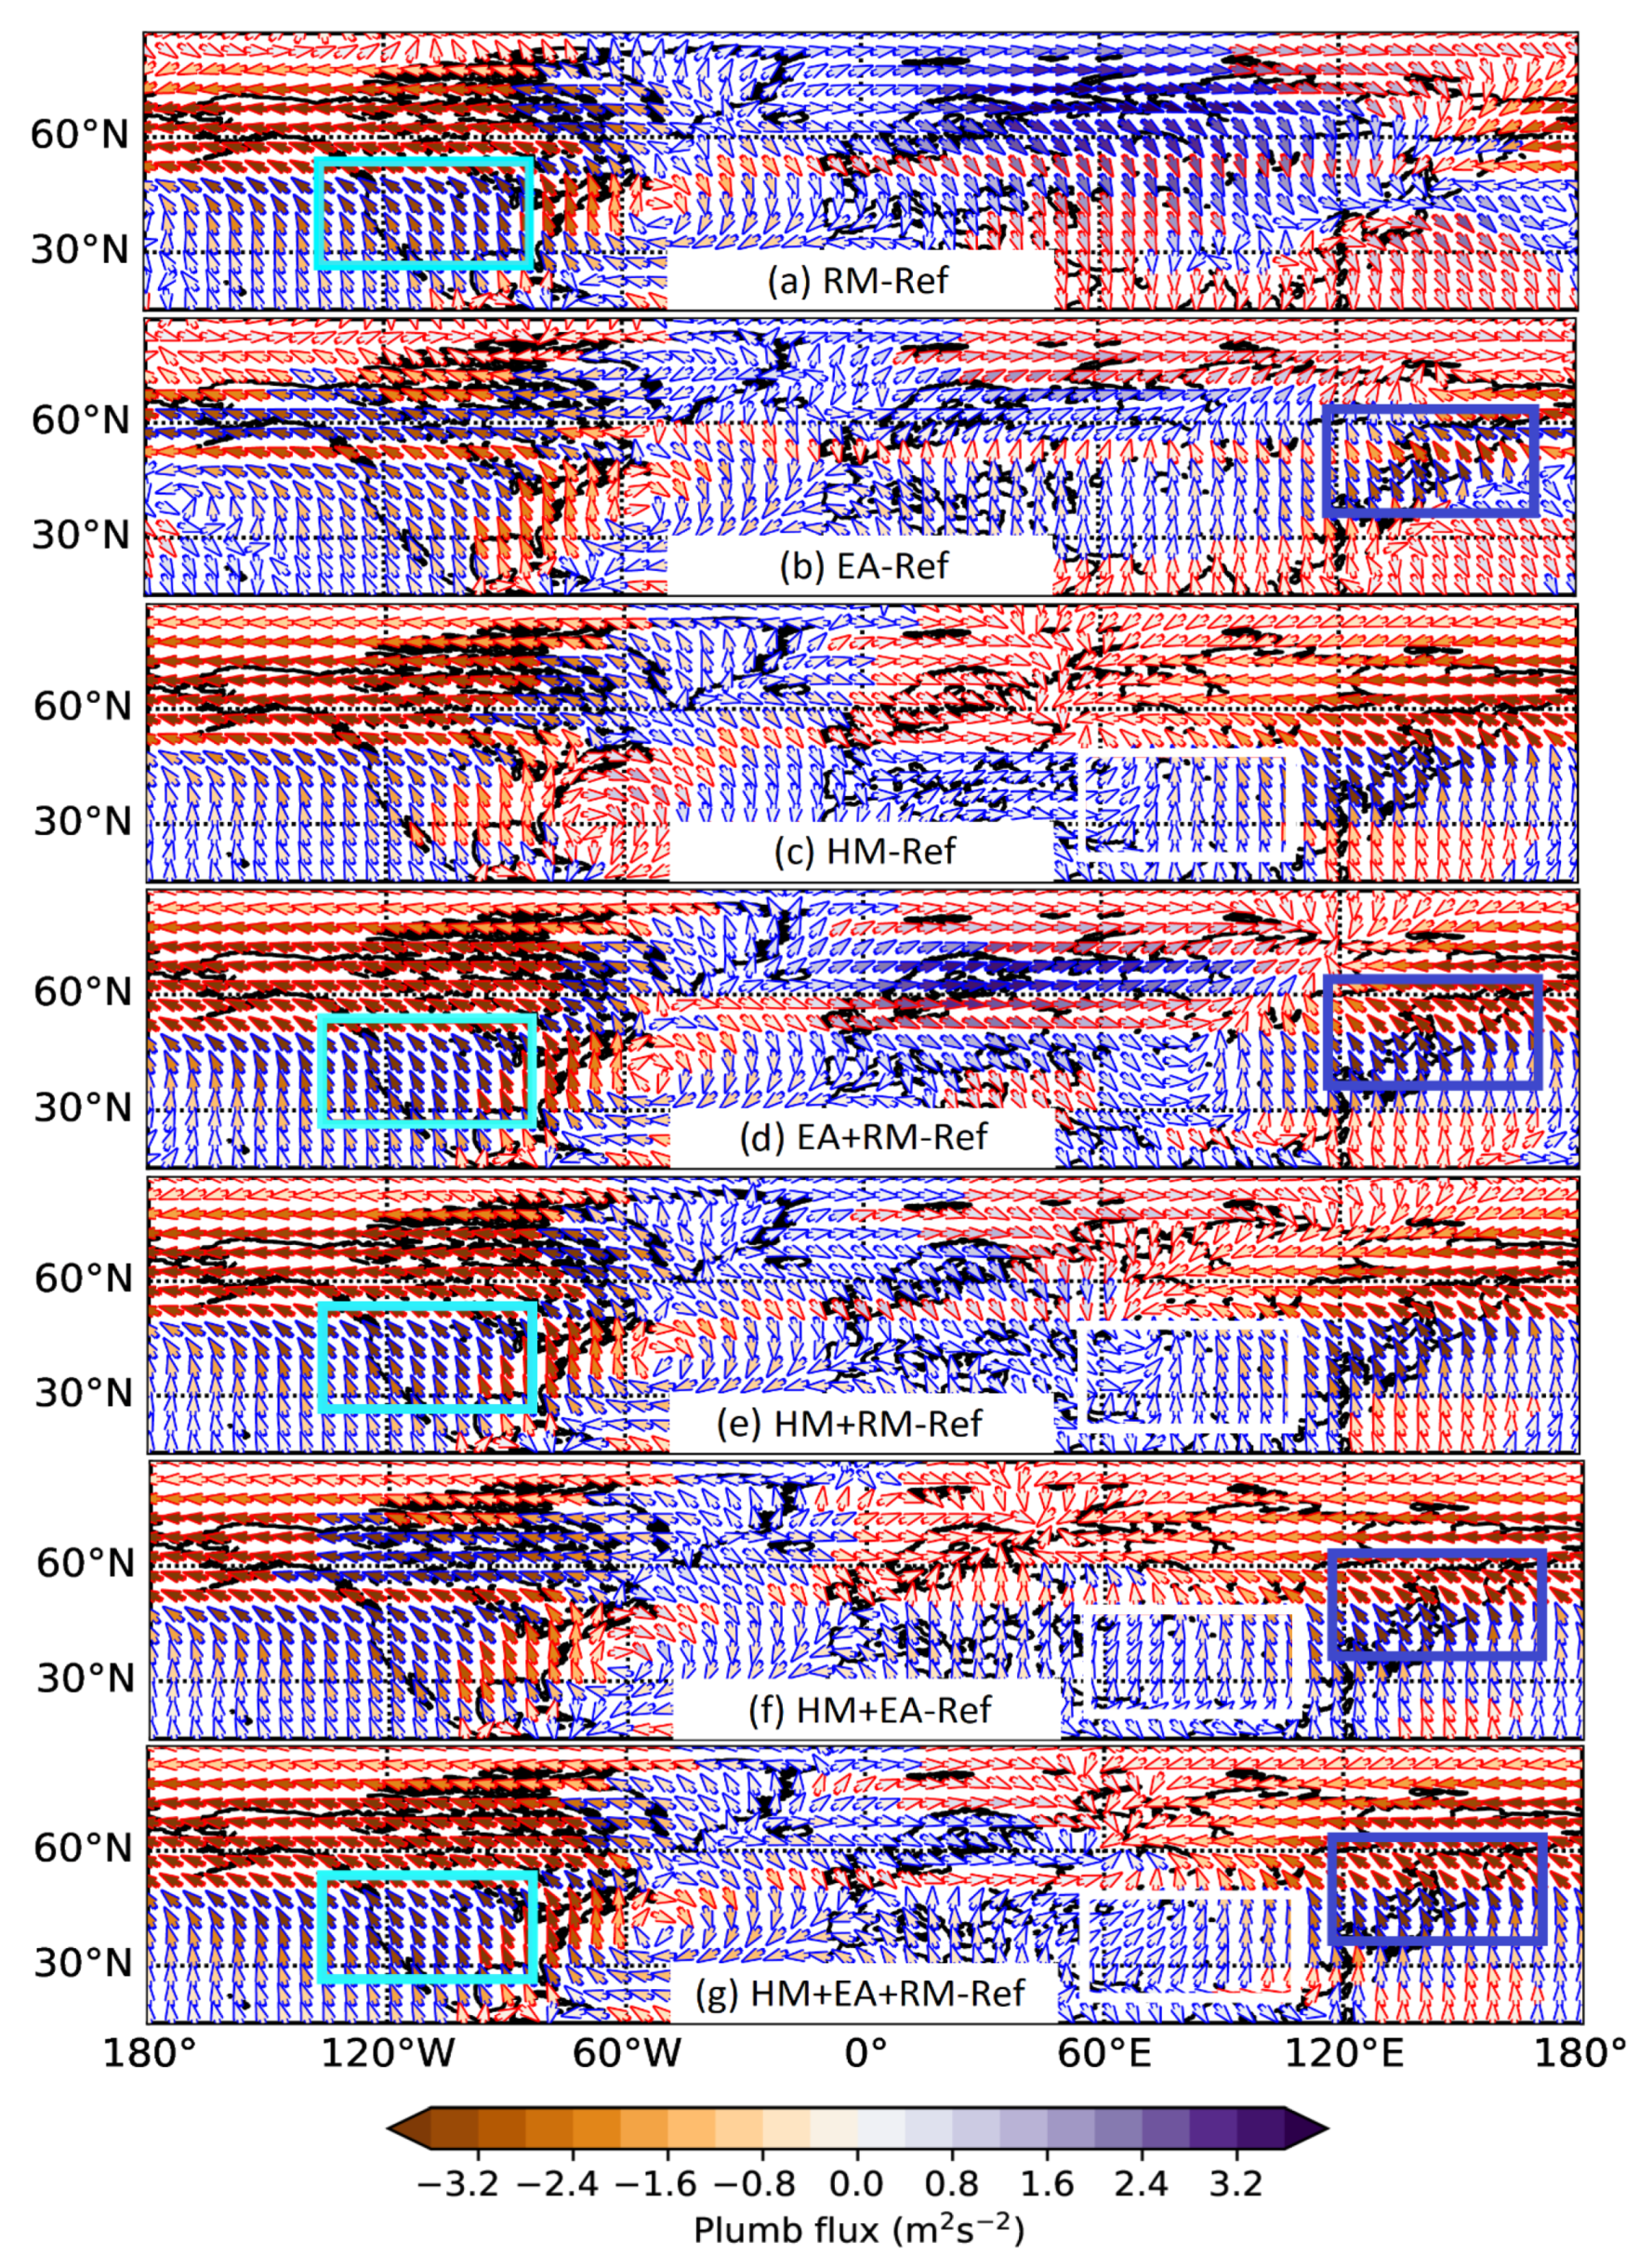
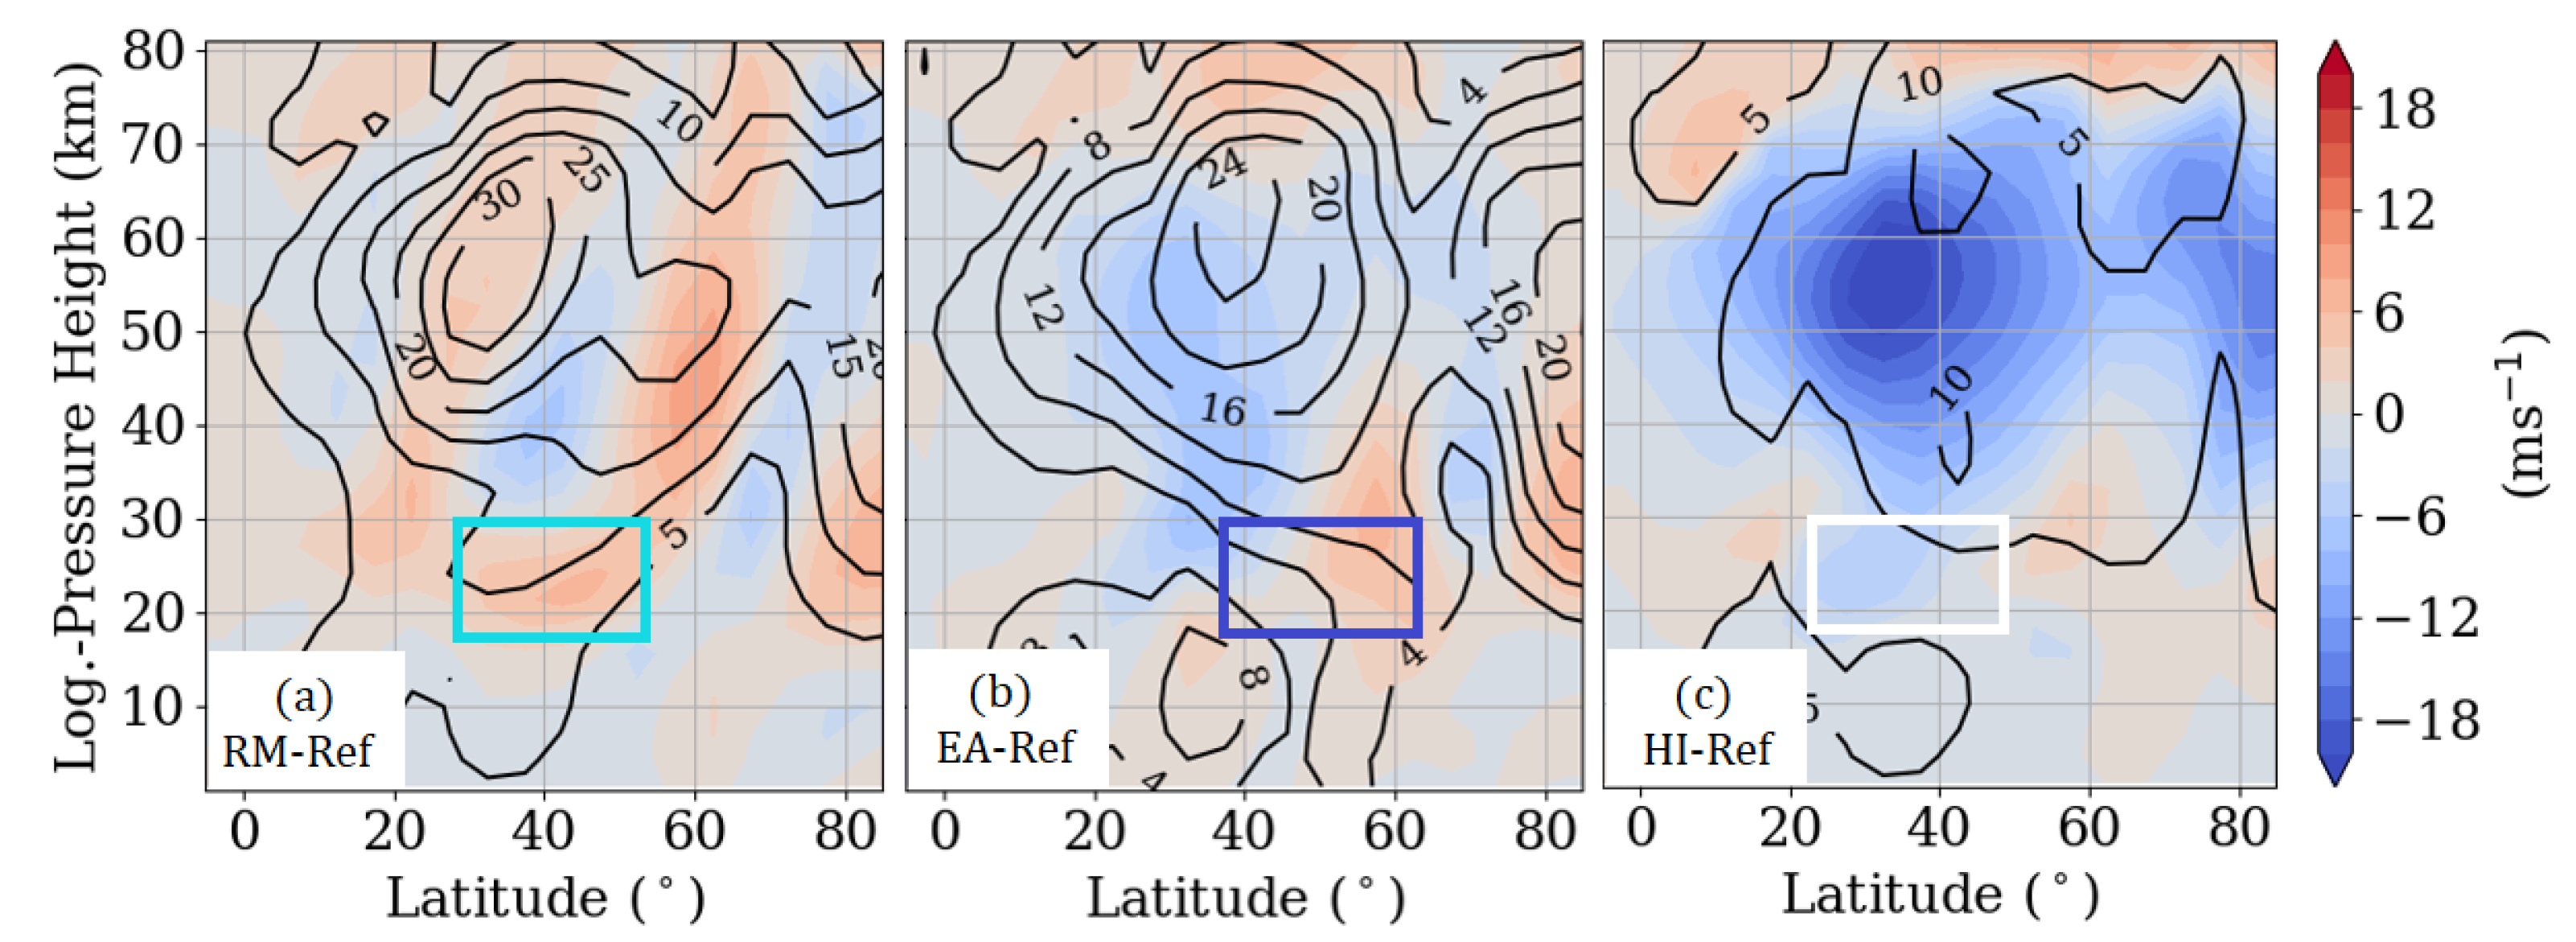
Appendix A. Figures
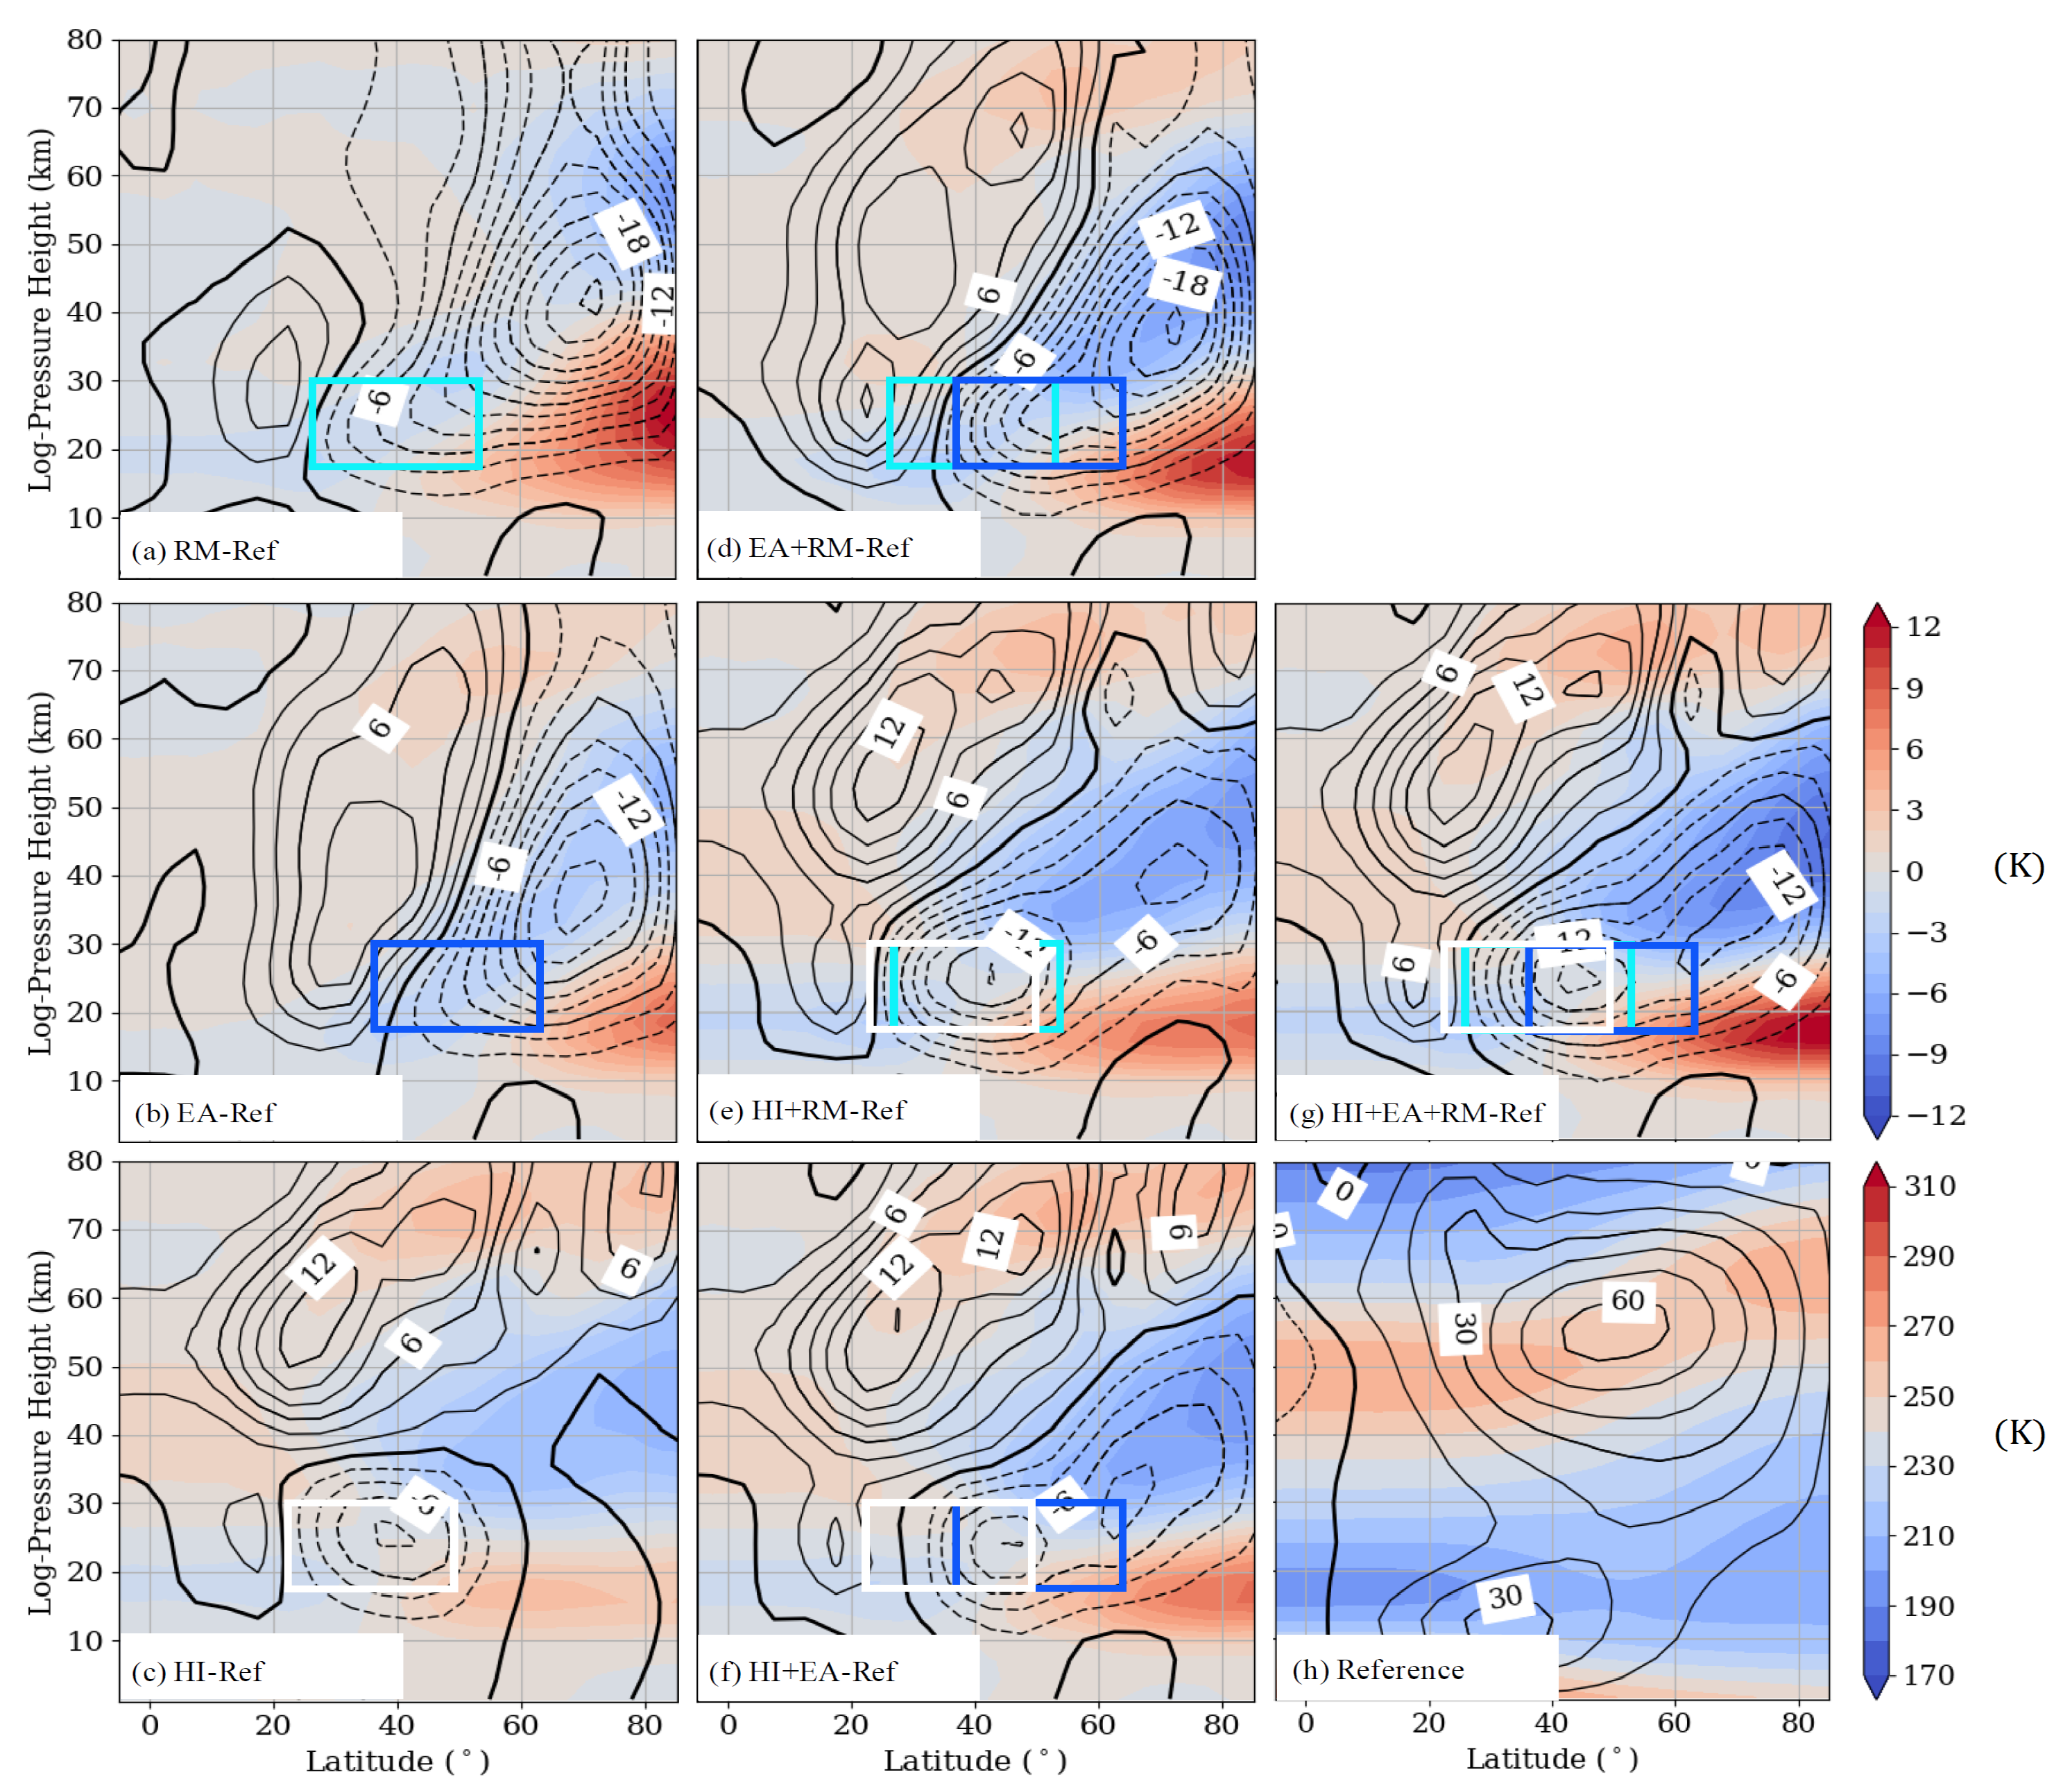
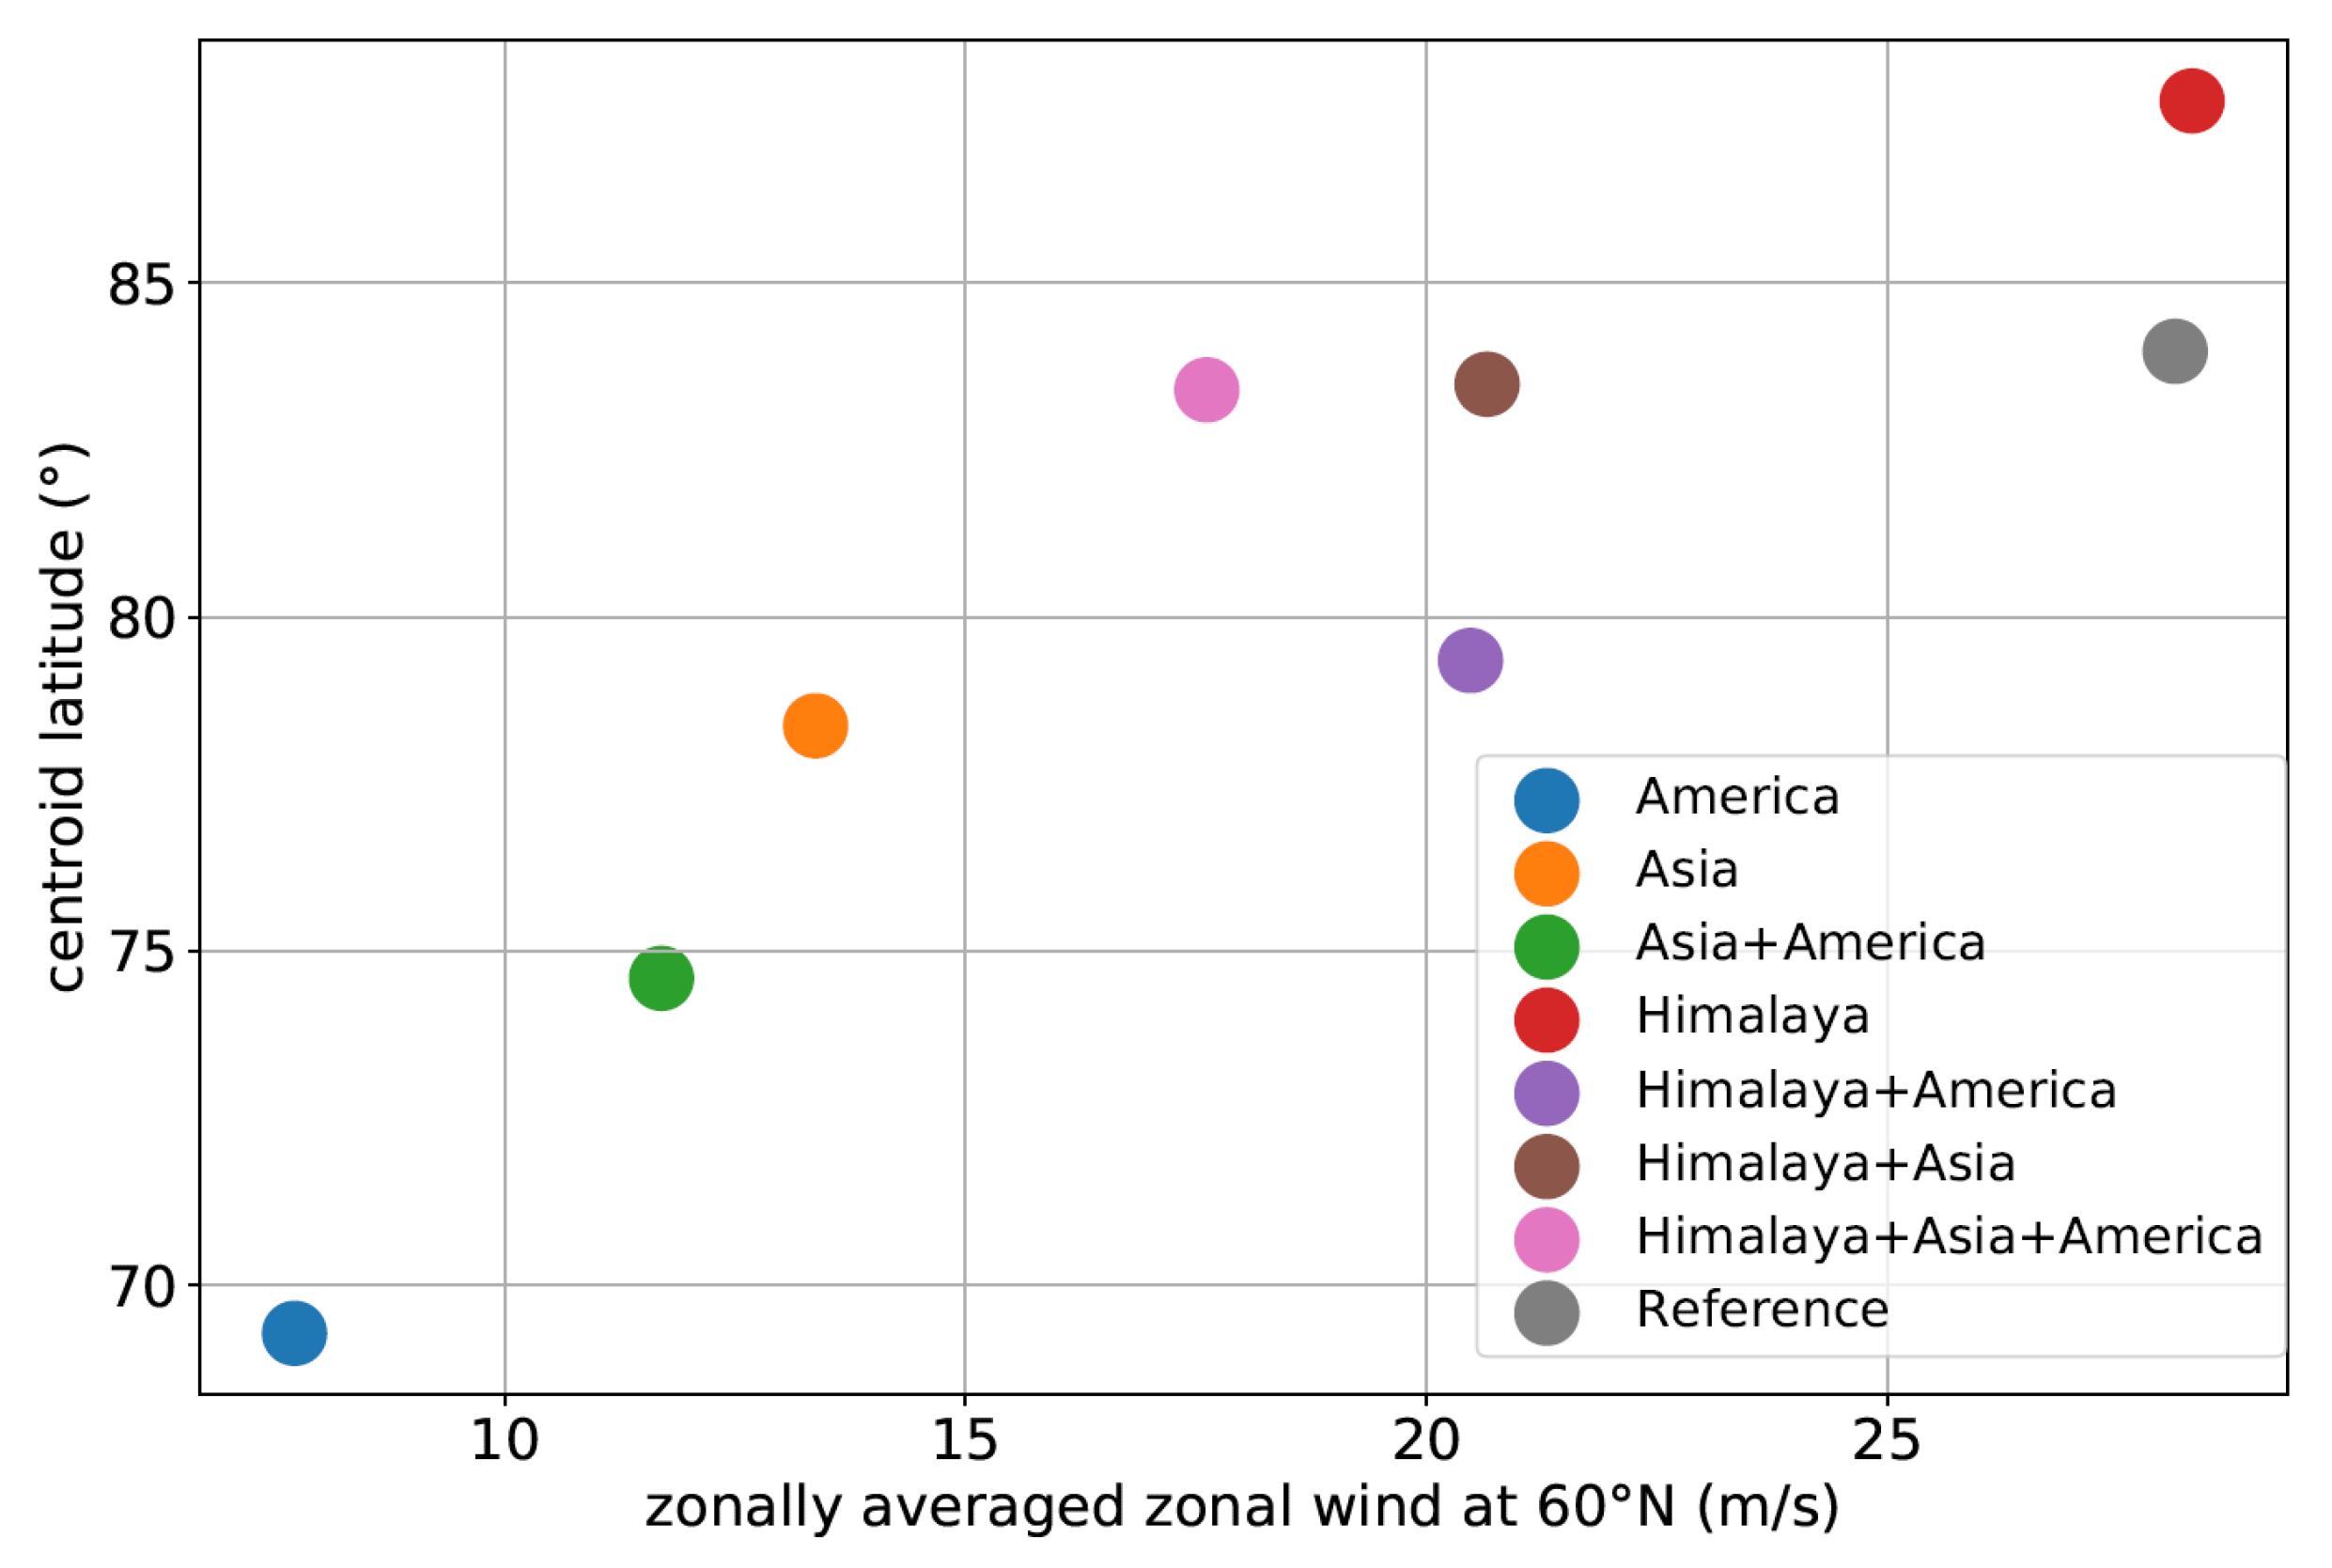
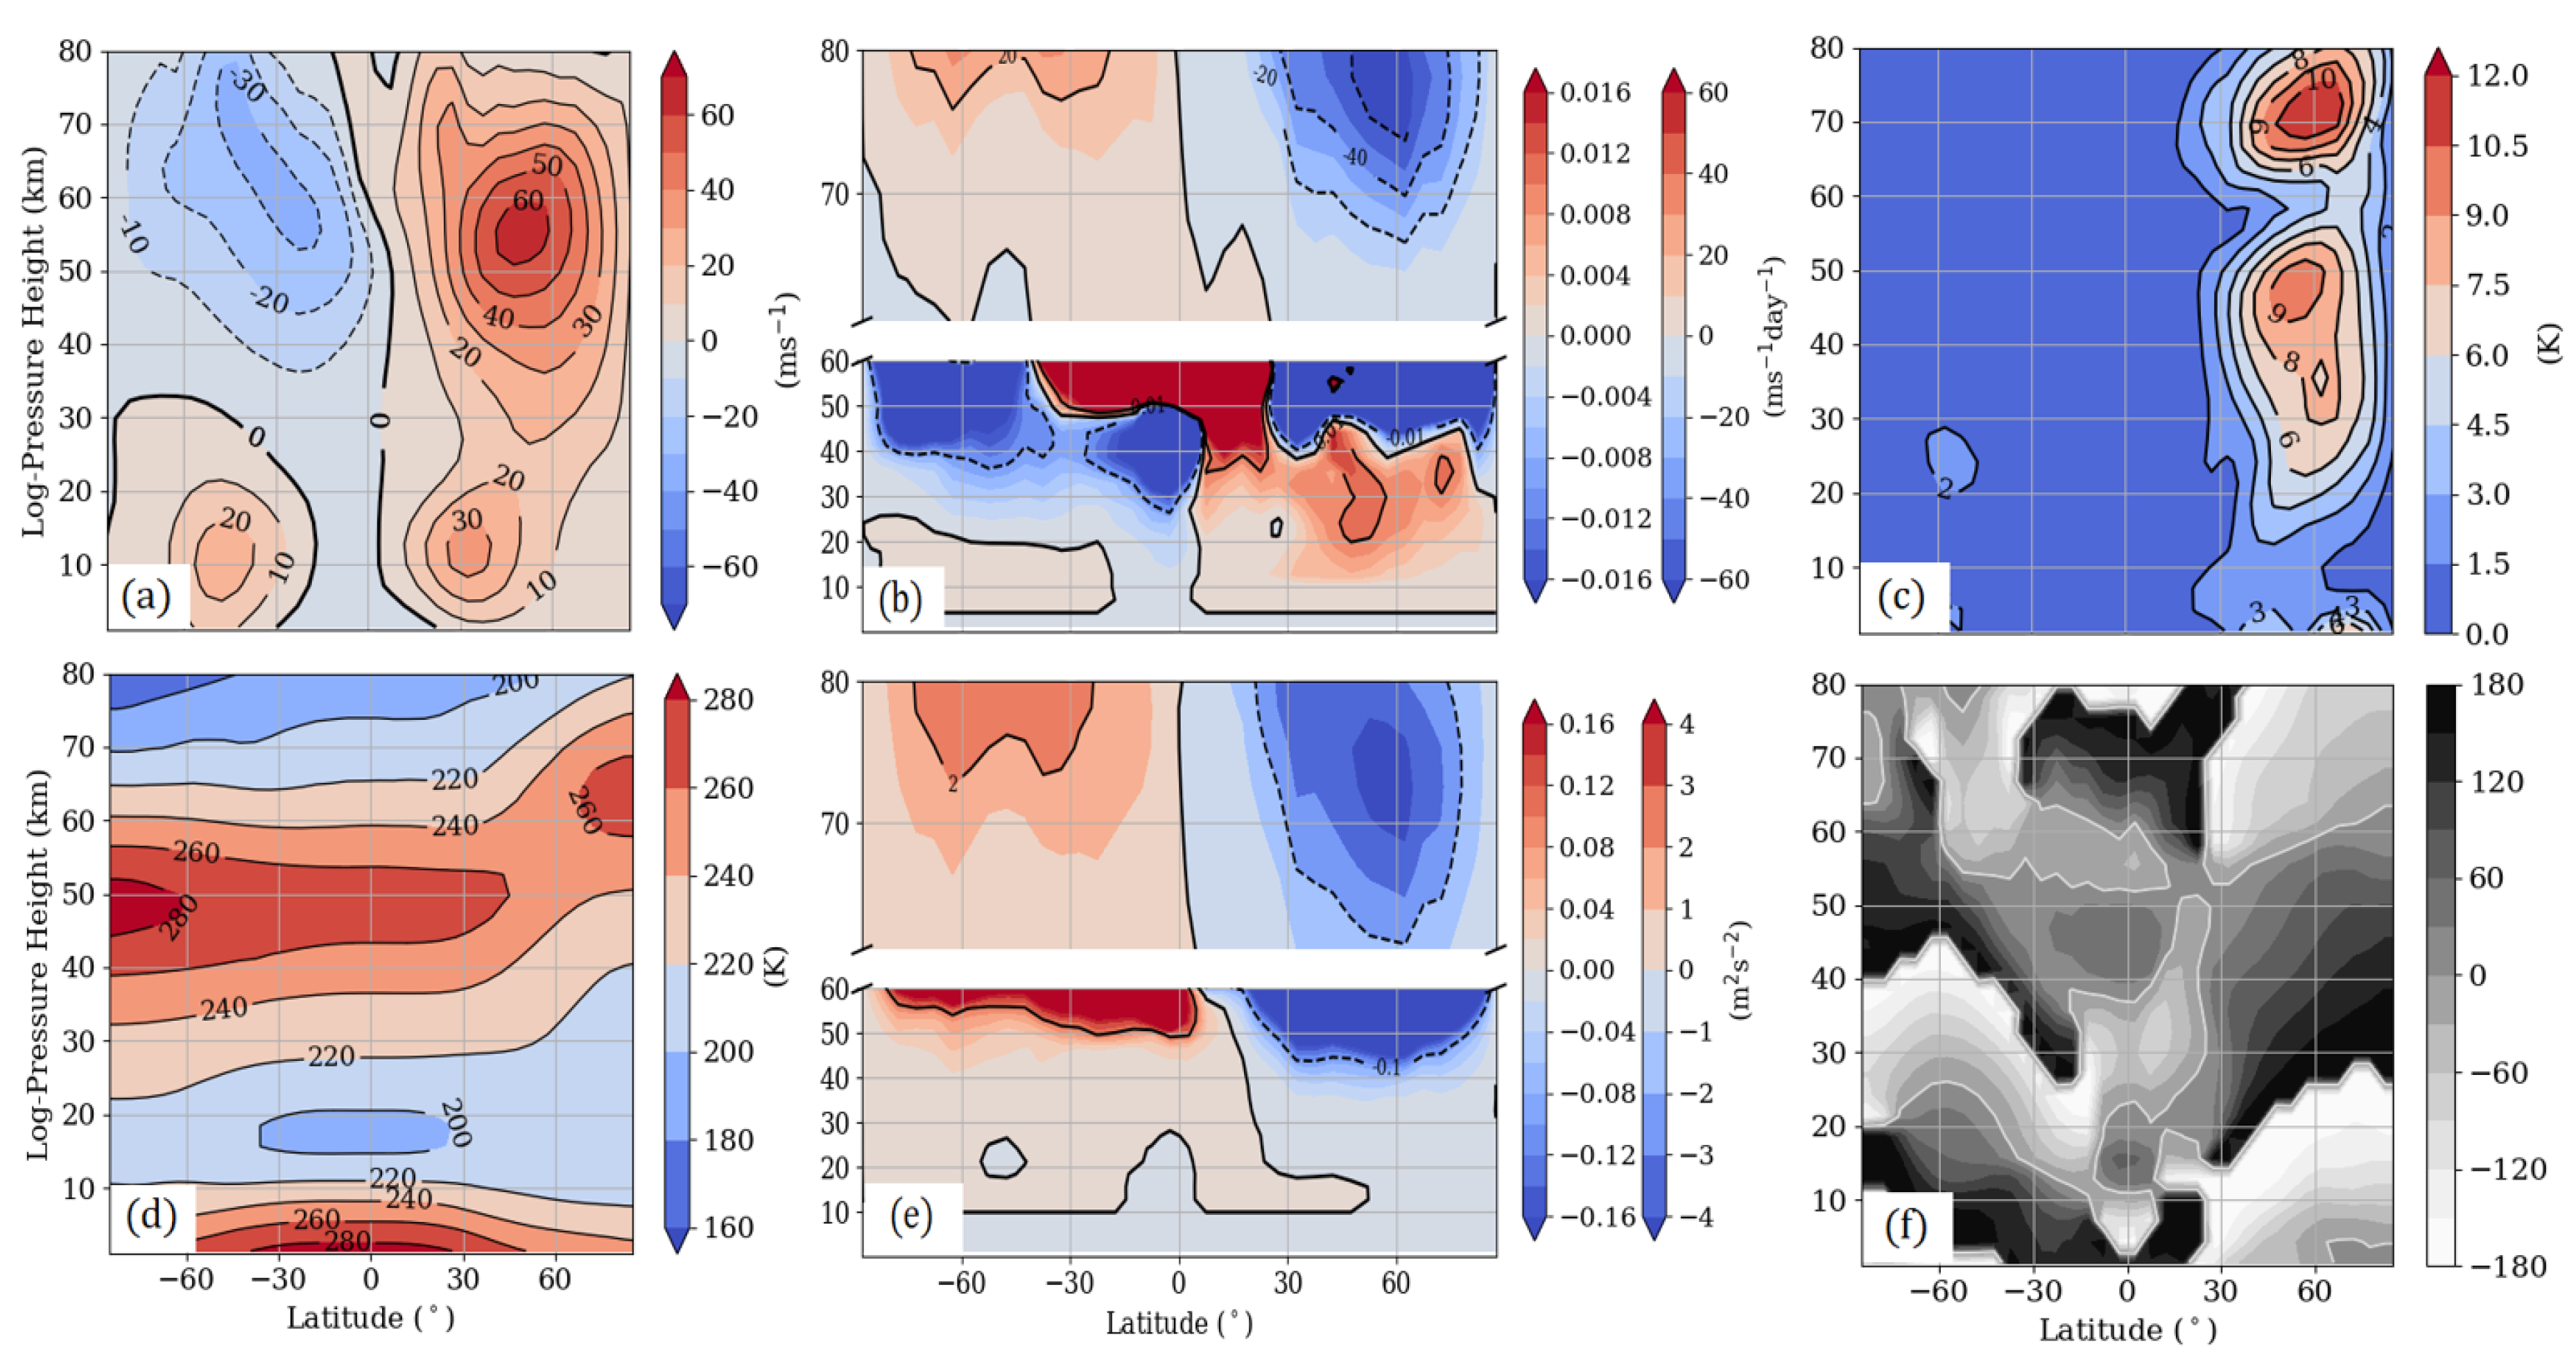
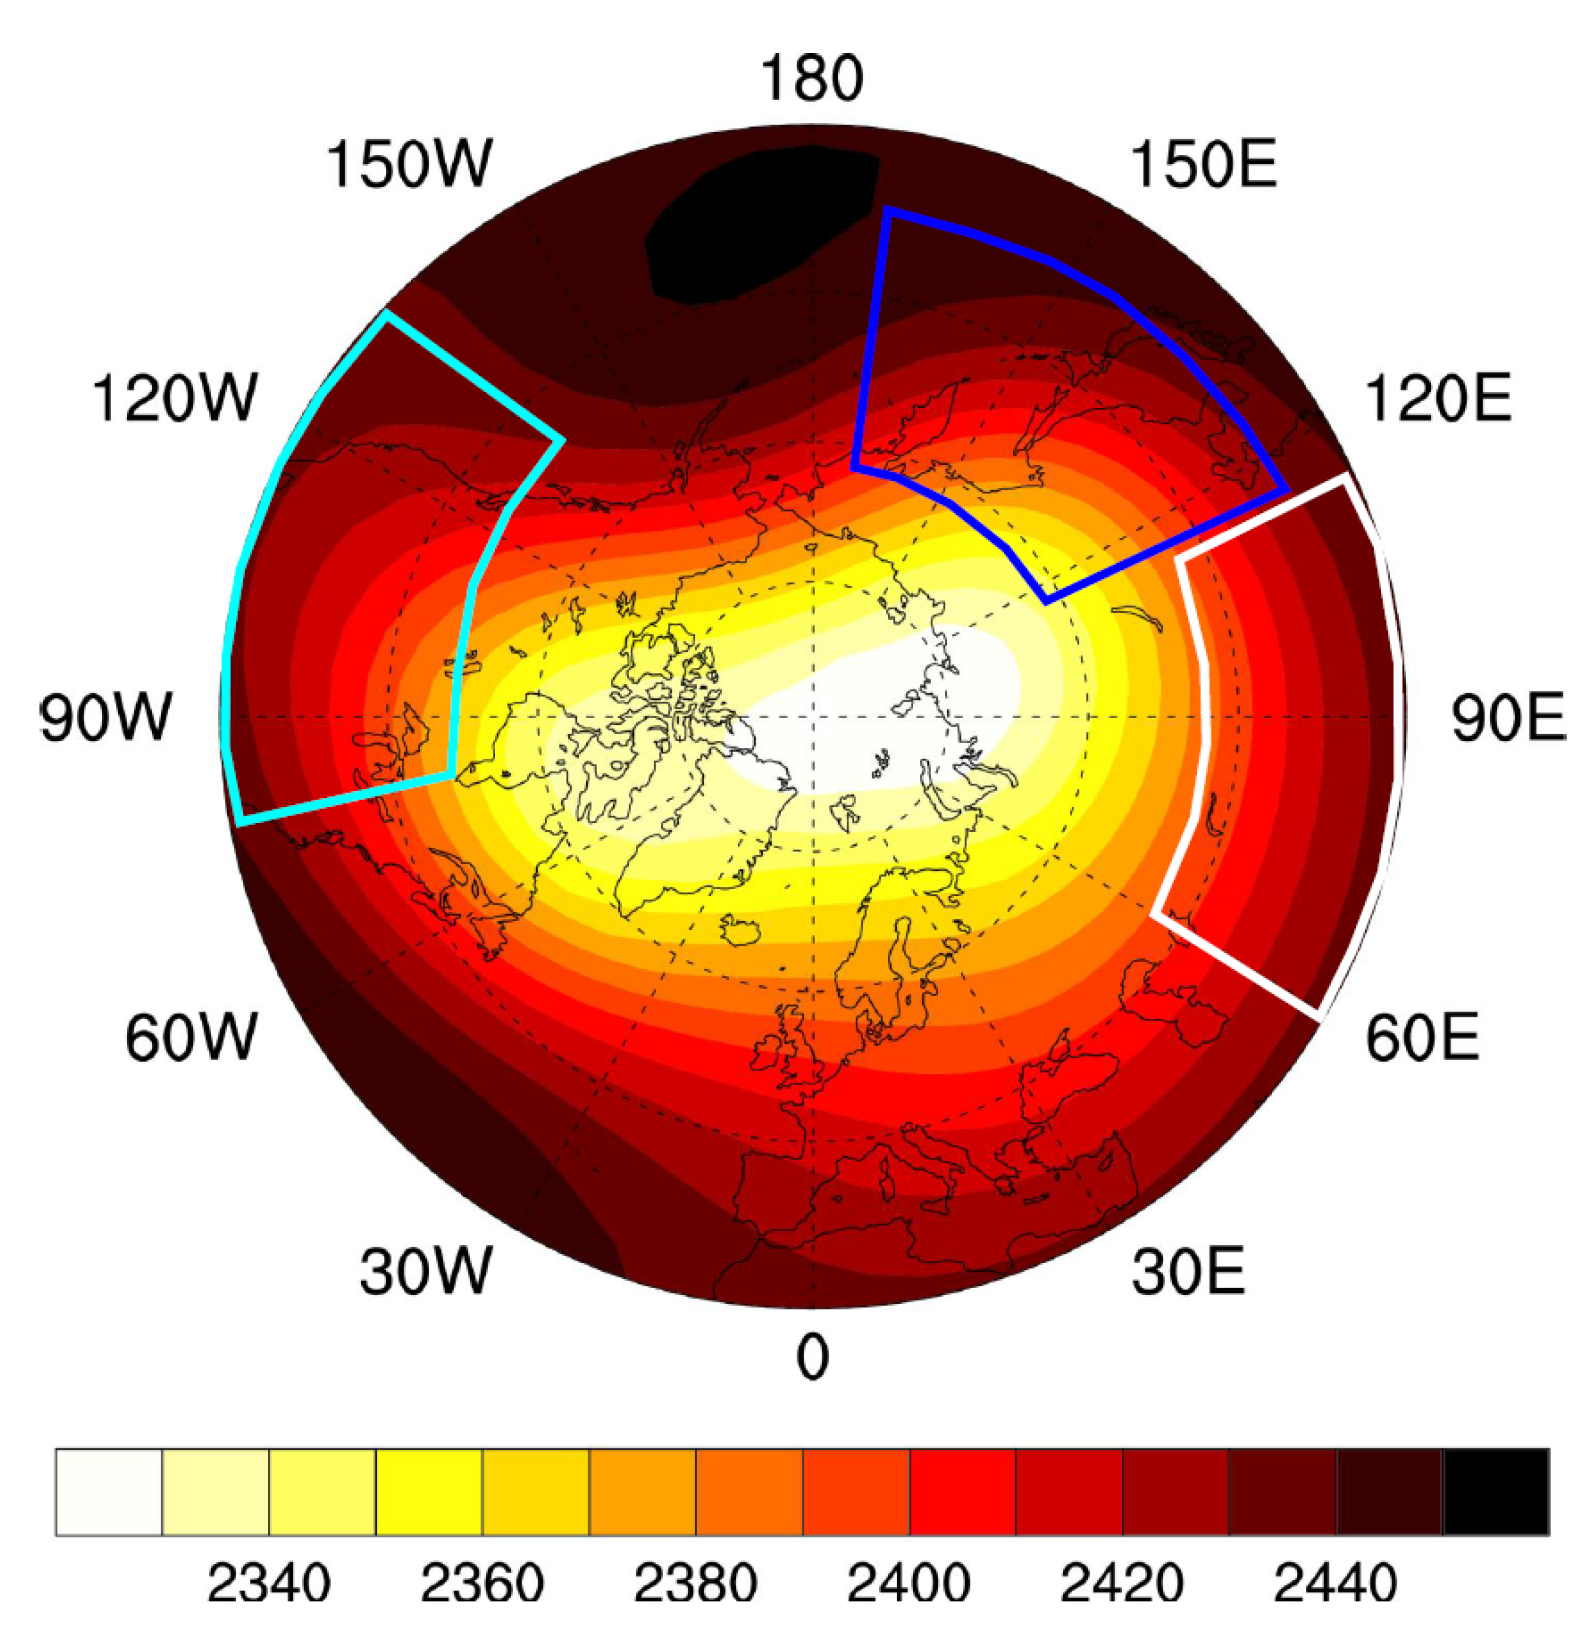
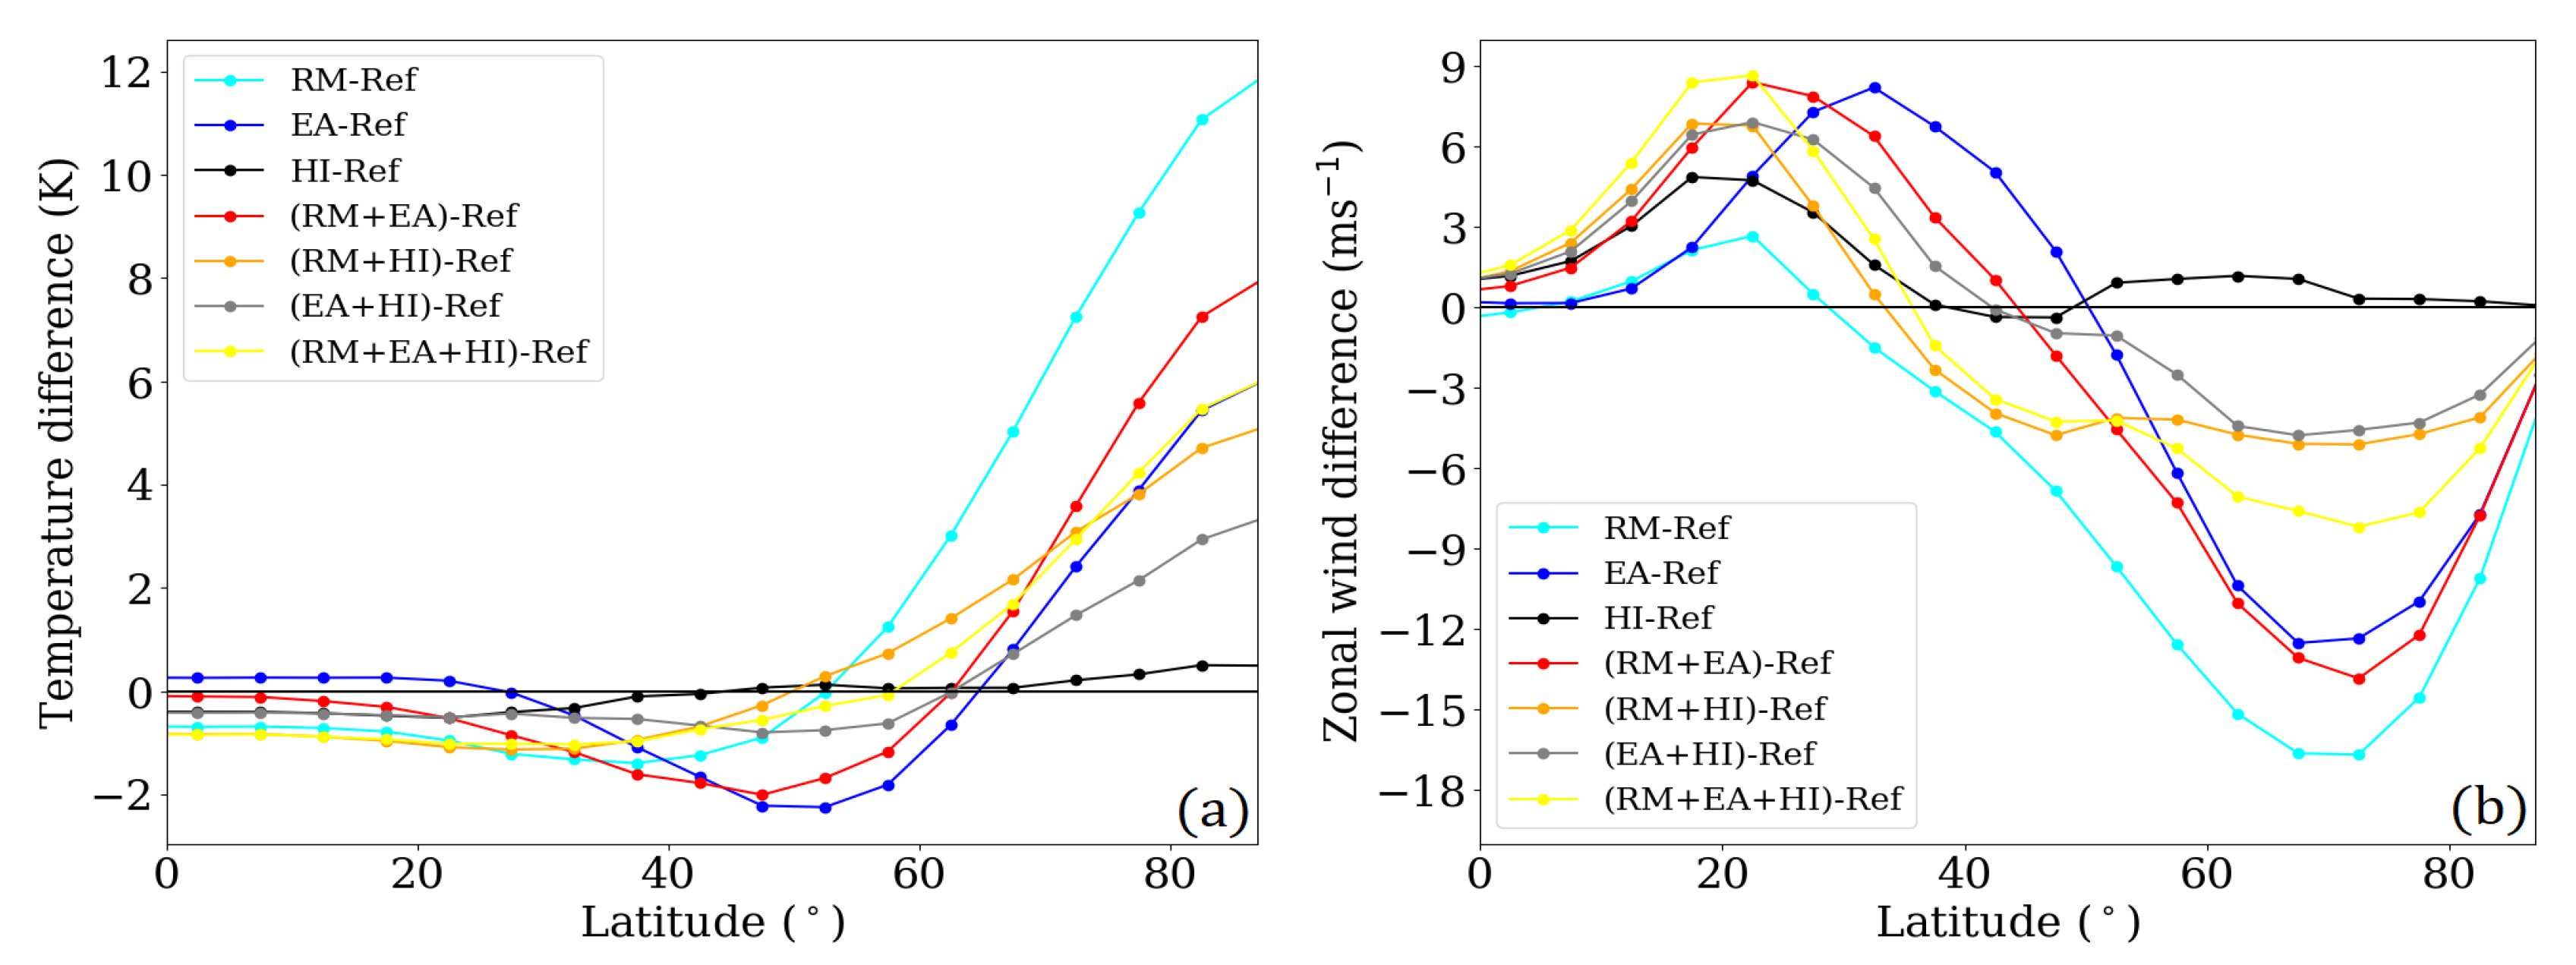
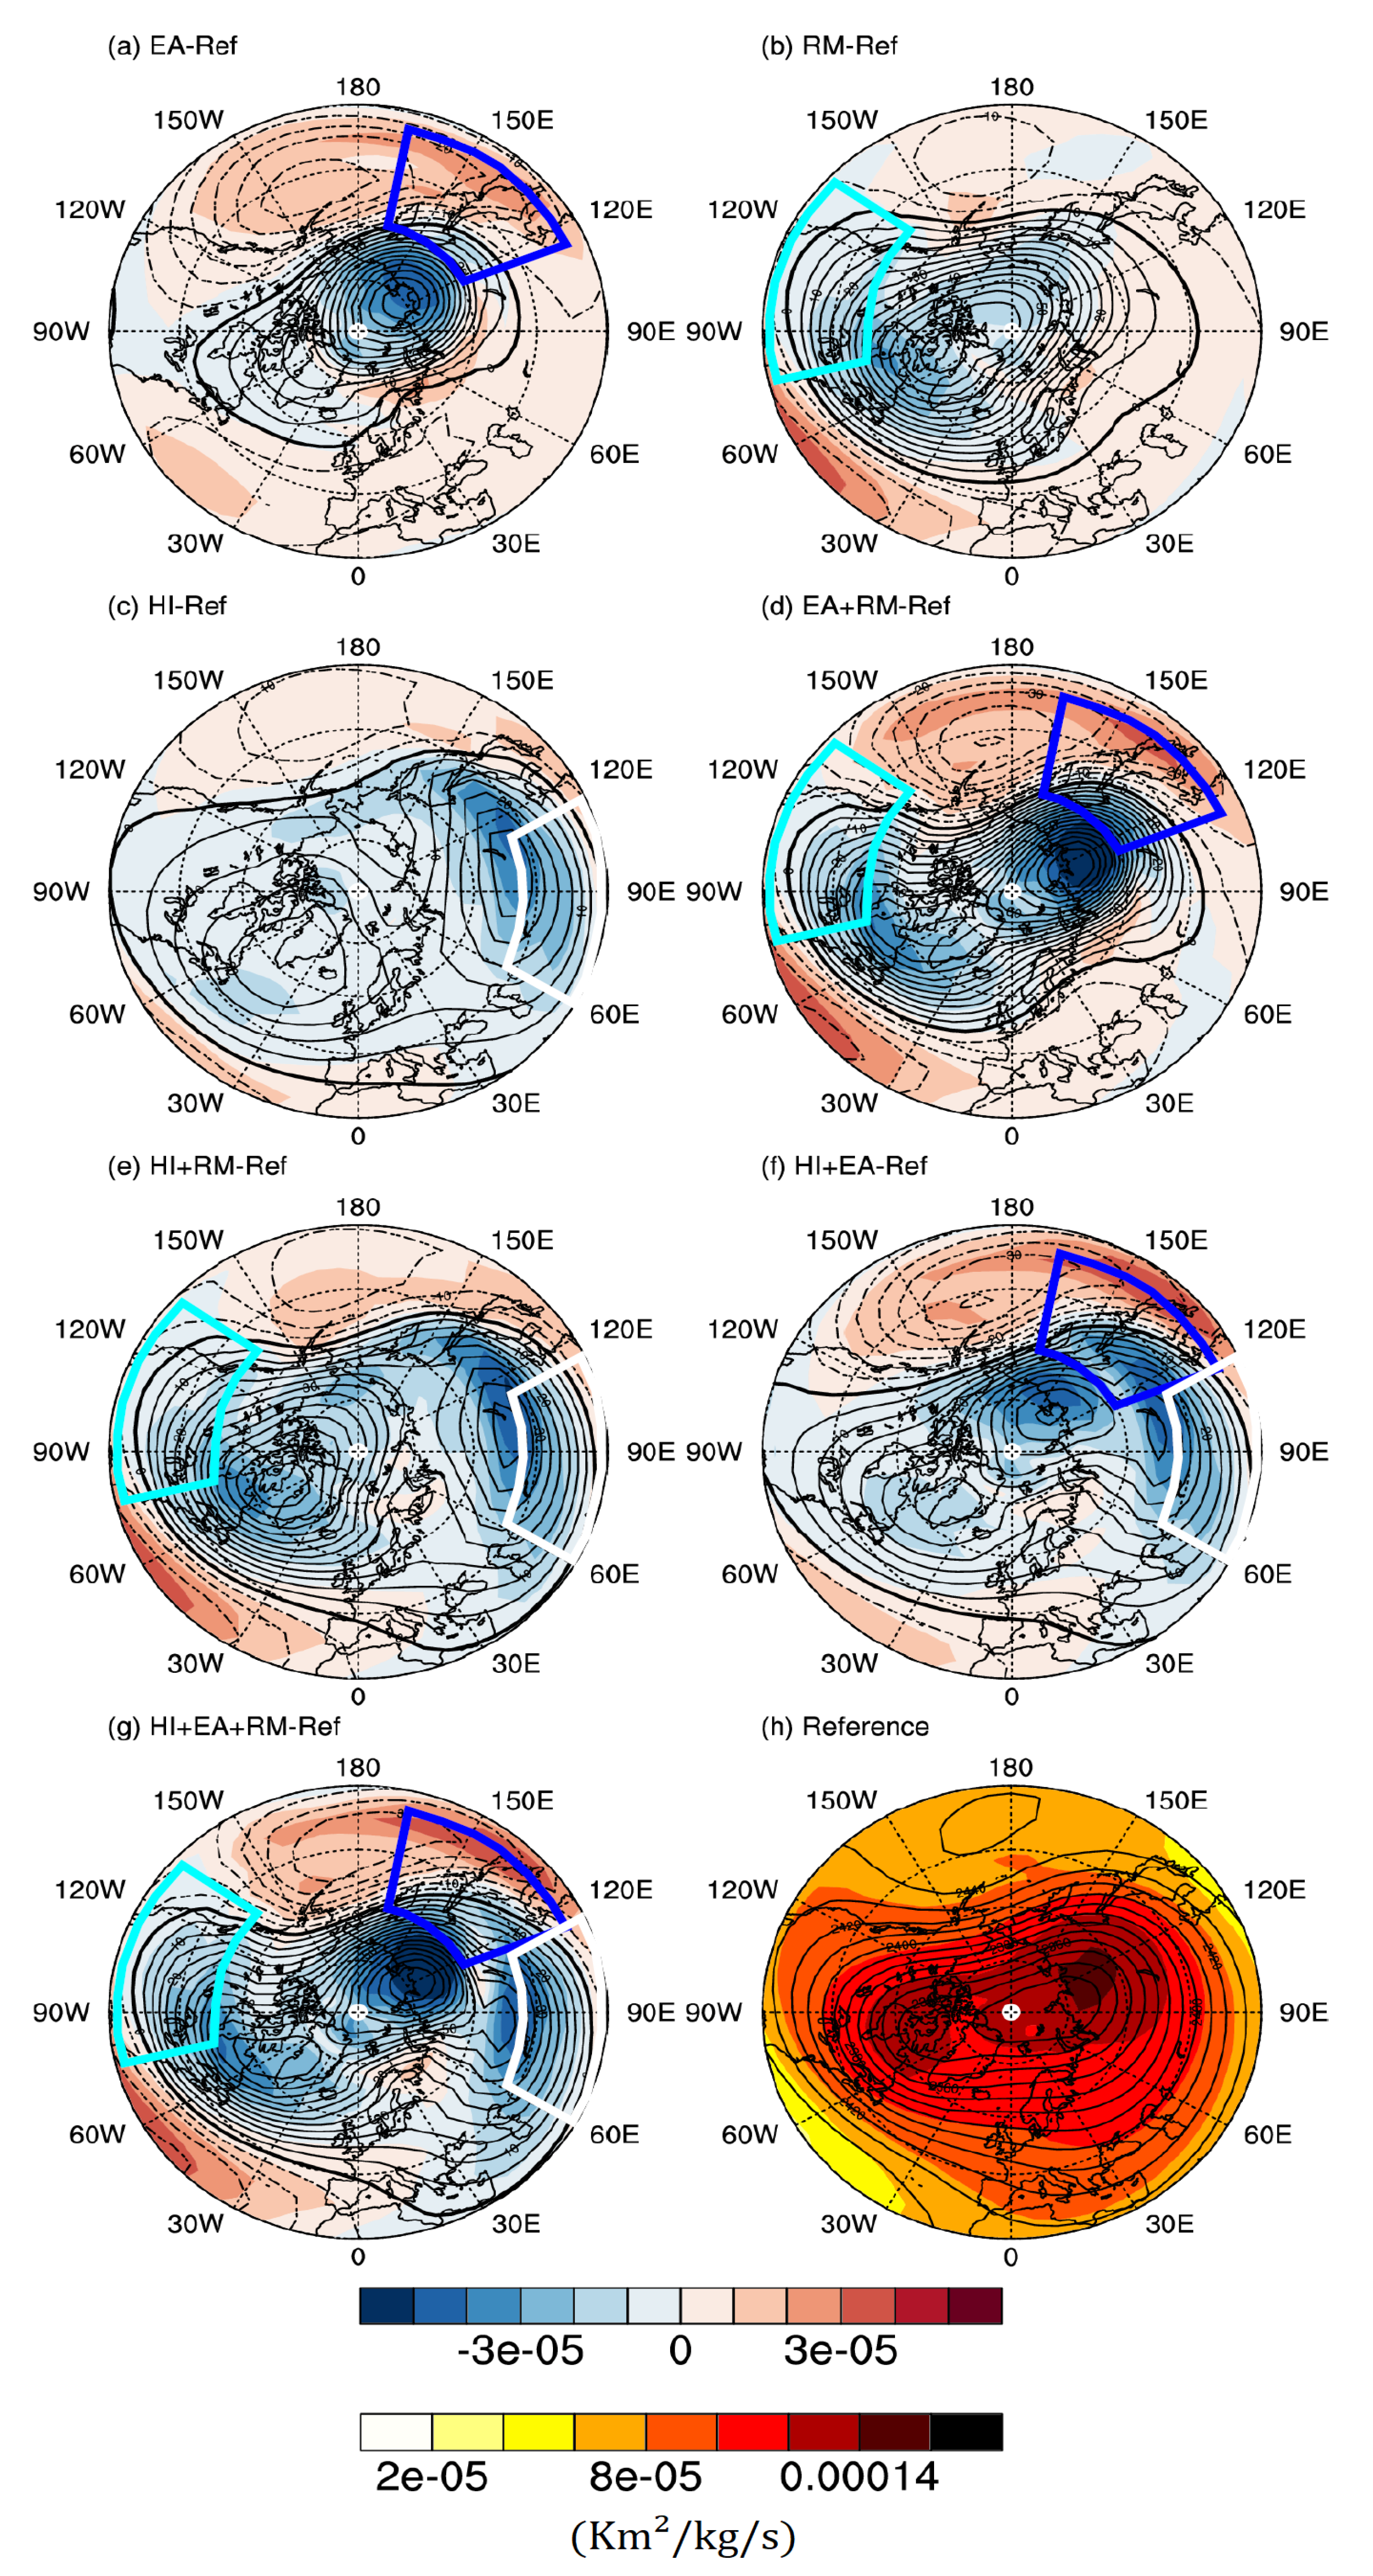
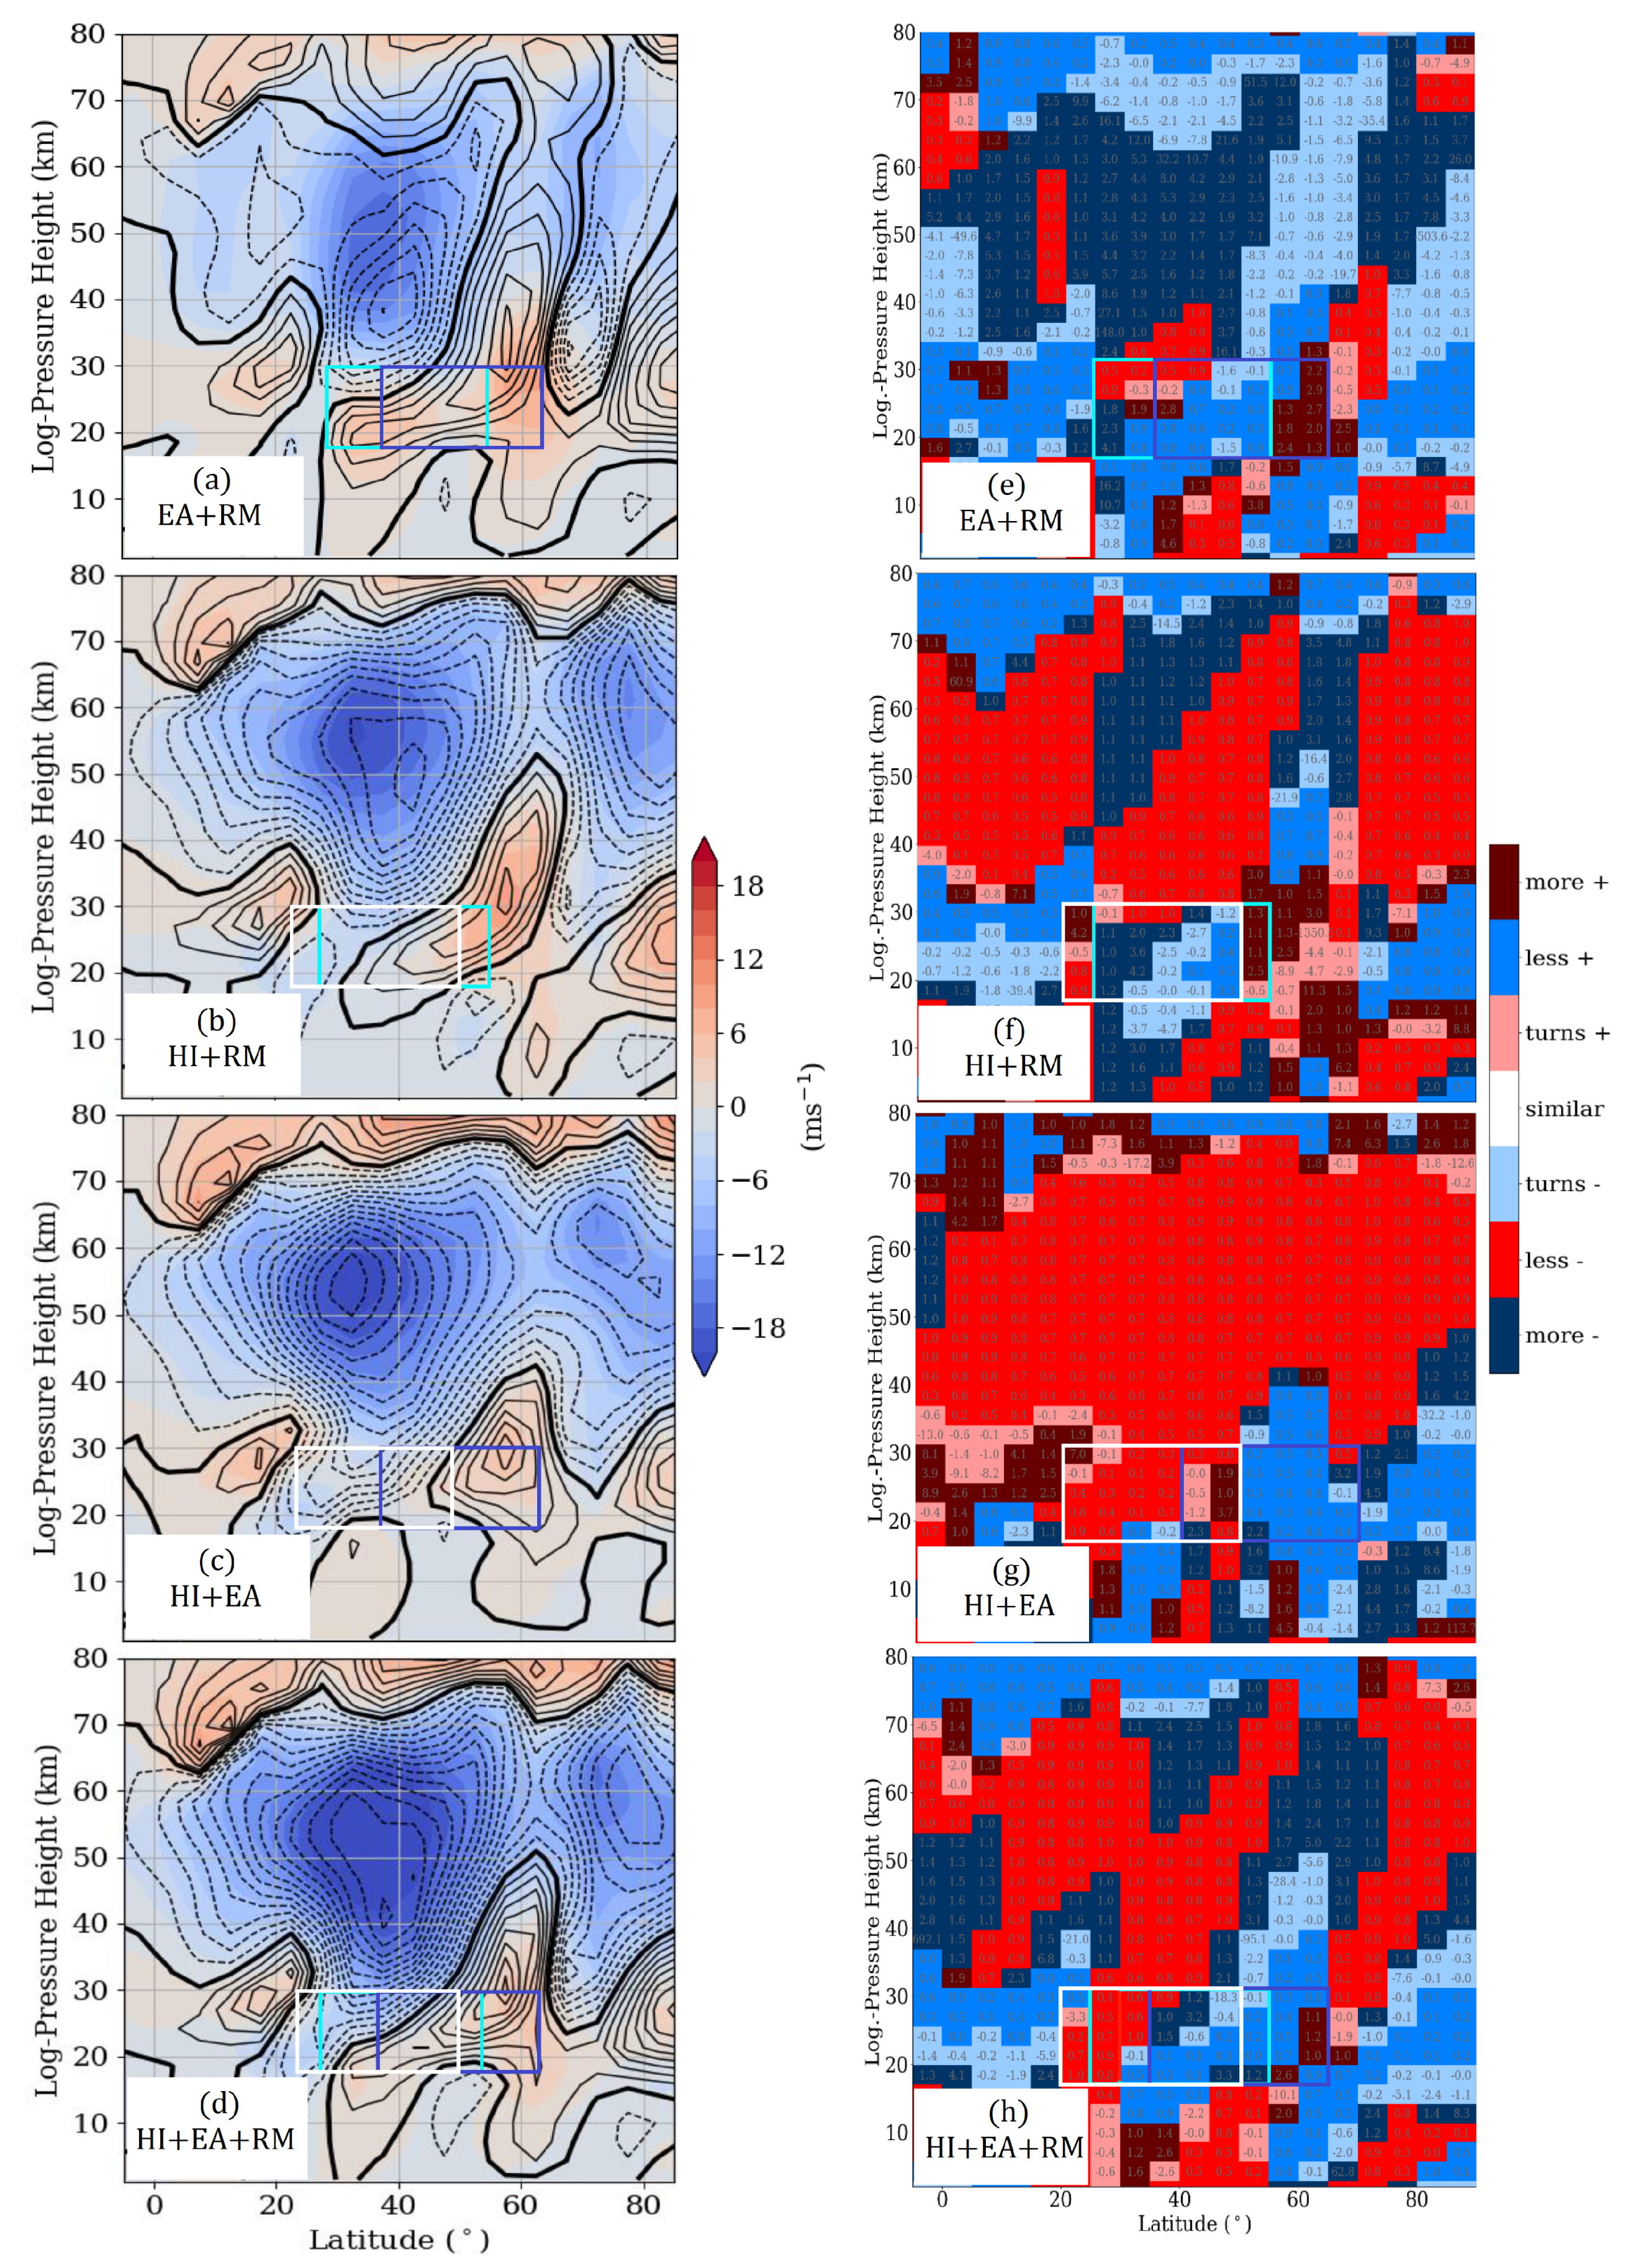
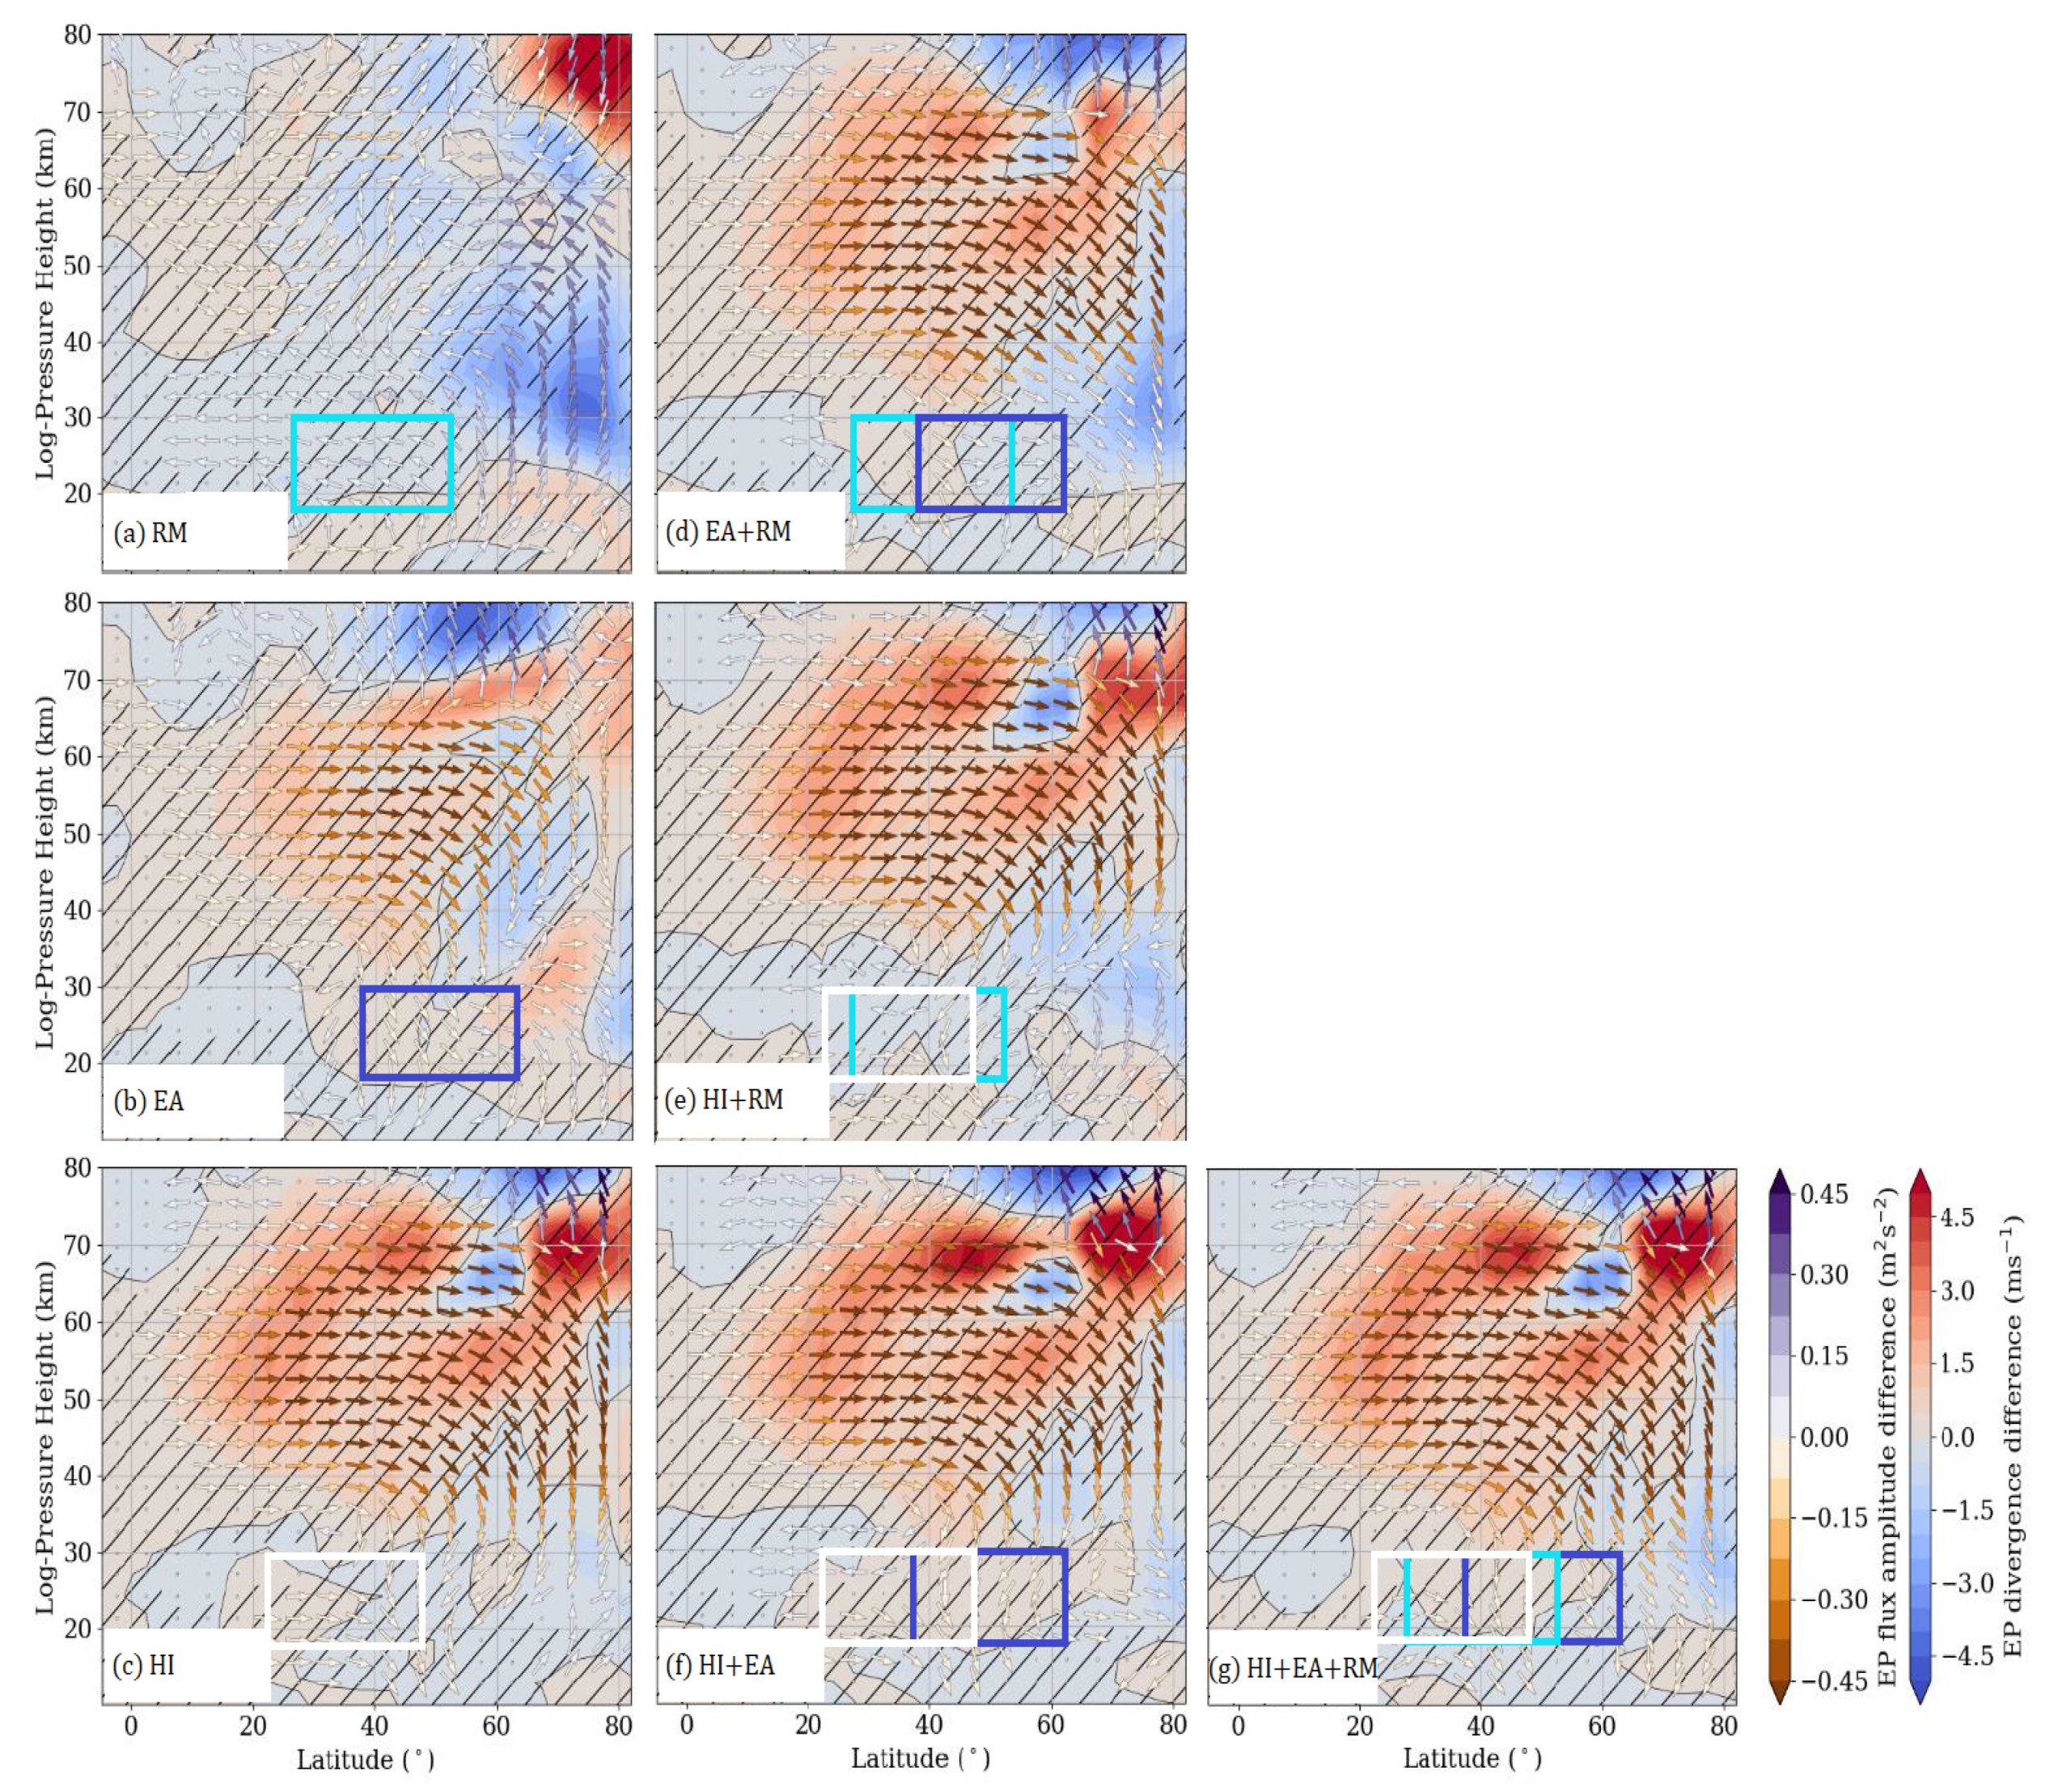
References
- Baldwin, M.P.; Dunkerton, T.J. Propagation of the Arctic Oscillation from the stratosphere to the troposphere. J. Geophys. Res. 1999, 104, 30937–30946. [Google Scholar] [CrossRef]
- Zhou, S.; Miller, A.J.; Wang, J.; Angell, J.K. Trends of NAO and AO and their associations with stratospheric processes. Geophys. Res. Lett. 2001, 28, 4107–4110. [Google Scholar] [CrossRef]
- Wang, L.; Chen, W. Downward Arctic Oscillation signal associated with moderate weak stratospheric polar vortex and the cold December 2009. Geophys. Res. Lett. 2010, 37. [Google Scholar] [CrossRef]
- Savenkova, E.; Kanukhina, A.; Pogoreltsev, A.; Merzlyakov, E. Variability of the springtime transition date and planetary waves in the stratosphere. J. Atmos.-Sol.-Terr. Phys. 2012, 90–91, 1–8. [Google Scholar] [CrossRef]
- Camp, C.D.; Tung, K.K. Stratospheric polar warming by ENSO in winter: A statistical study. Geophs. Res. Lett. 2007, 34. [Google Scholar] [CrossRef] [Green Version]
- Garfinkel, C.I.; Hartmann, D.L. Different ENSO teleconnections and their effects on the stratospheric polar vortex. J. Geophys. Res. 2008, 113. [Google Scholar] [CrossRef] [Green Version]
- Calvo, N.; Giorgetta, A.M.; Garcia-Herrera, R.; Manzini, E. Nonlinearity of the combined warm ENSO and QBO effects on the Northern Hemisphere polar vortex in MAECHAM5 simulations. J. Geophs. Res. 2009, 114. [Google Scholar] [CrossRef] [Green Version]
- Jacobi, C.; Ermakova, T.; Mewes, D.; Pogoreltsev, A. El Nino influence on the mesosphere/lower thermosphere circulation at midlatitudes as seen by a VHF meteor radar at Collm (51.3 N, 13 E). Adv. Radio Sci. 2017, 15, 199–206. [Google Scholar] [CrossRef] [Green Version]
- Ermakova, T.S.; Aniskina, O.G.; Statnaia, I.A.; Motsakov, M.A.; Pogoreltsev, A. Simulation of the ENSO influence on the extra-tropical middle atmosphere. Earth Planets Space 2019, 71. [Google Scholar] [CrossRef]
- Baldwin, M.P.; Holton, J.R. Climatology of the stratospheric polar vortex and planetary wave breaking. J. Atmos. Sci. 1988, 45, 1123–1142. [Google Scholar] [CrossRef] [Green Version]
- Albers, J.R.; Birner, T. Vortex Preconditioning due to Planetary and Gravity Waves prior to Sudden Stratospheric Warmings. J. Atmos. Sci. 2014, 71, 4028–4054. [Google Scholar] [CrossRef]
- Garcia, R.R.; Smith, A.K.; Kinnison, D.E.; Camara, A.; Murphy, D.J. Modification of the gravity wave parameterization in the whole atmosphere community climate model: Motivation and results. J. Atmos. Sci. 2017, 74, 275–291. [Google Scholar] [CrossRef]
- Šácha, P.; Lilienthal, F.; Jacobi, C.; Pišoft, P. Influence of the spatial distribution of gravity wave activity on the middle atmospheric circulation and transport. Atmos. Chem. Phys. 2016, 16, 15755–15775. [Google Scholar] [CrossRef] [Green Version]
- Scheffler, G.; Pulido, M.; Rodas, C. The role of gravity wave drag optimization in the splitting of the Antarctic vortex in the 2002 sudden stratospheric warming. Geophys. Res. Lett. 2018, 45, 6719–6725. [Google Scholar] [CrossRef] [Green Version]
- Gavrilov, N.M.; Koval, A.V.; Pogoreltsev, A.I.; Savenkova, E.N. Simulating planetary wave propagation to the upper atmosphere during stratospheric warming events at different mountain wave scenarios. Adv. Space Res. 2018, 61, 1819–1836. [Google Scholar] [CrossRef]
- Samtleben, N.; Jacobi, C.; Pišoft, P.; Šácha, P.; Kuchař, A. Effect of latitudinally displaced gravity wave forcing in the lower stratosphere on the polar vortex stability. Ann. Geophys. 2019, 37, 507–523. [Google Scholar] [CrossRef] [Green Version]
- Samtleben, N.; Kuchař, A.; Šácha, P.; Pišoft, P.; Jacobi, C. Impact of local gravity wave forcing in the lower stratosphere on the polar vortex stability: Effect of longitudinal displacement. Ann. Geophys. 2020, 38, 95–108. [Google Scholar] [CrossRef] [Green Version]
- Fritts, D.C.; Alexander, M.J. Gravity wave dynamics and effects in the middle atmosphere. Rev. Geophys. 2003, 41, 1003. [Google Scholar] [CrossRef] [Green Version]
- Yiǧit, E.; Medvedev, A.S. Internal wave coupling processes in Earth’s atmosphere. Adv. Space Res. 2015, 55, 983–1003. [Google Scholar] [CrossRef] [Green Version]
- Smith, R.B. On severe downslope winds. J. Atmos. Sci. 1985, 42, 2597–2603. [Google Scholar] [CrossRef] [Green Version]
- Nastrom, G.D.; Fritts, D.C. Sources of mesoscale variability of gravity waves. Part I: Topographic Excitation. J. Atmos. Sci. 1992, 49, 101–110. [Google Scholar] [CrossRef]
- Tsuda, T.; Muayama, Y.; Wiryosumarto, H.; Harijono, S.W.B.; Kato, S. Radiosonde observations of equatorial atmosphere dynamics over Indonesia. II: Characteristics of gravity waves. J. Geophys. Res. 1994, 99. [Google Scholar] [CrossRef]
- Adushkin, V.V.; Nifadiev, V.I.; Chen, B.B.; Popel, S.I.; Kogai, G.A.; Dubinskii, A.Y.; Weidler, P.G. Variations of the Parameters of Internal Gravity Waves in the Atmosphere of Central Asia before Earthquakes. Dokl. Earth Sci. 2019, 487, 841–845. [Google Scholar] [CrossRef]
- Adushkin, V.V.; Nifadiev, V.I.; Chen, B.B.; Popel, S.I.; Kogai, G.A.; Dubinskii, A.Y.; Weidler, P.G. Characteristics of Internal Gravity Waves and Earthquake Prediction. Dokl. Earth Sci. 2020, 493, 632–635. [Google Scholar] [CrossRef]
- Fröhlich, K.; Schmidt, T.; Ern, M.; Preusse, P.; de la Torre, A.; Wickert, J.; Jacobi, C. The global distribution of gravity wave energy in the lower stratosphere derived from GPS data and gravity wave modelling: Attempt and challenges. J. Atmos. Sol.-Terr. Phys. 2007, 69, 2238–2248. [Google Scholar] [CrossRef]
- Šácha, P.; Kuchar, A.; Jacobi, C.; Pišoft, P. Enhanced internal gravity wave activity and breaking over the Northeastern Pacific / Eastern Asian region. Atmos. Chem. Phys. 2015, 15, 13097–13112. [Google Scholar] [CrossRef] [Green Version]
- Lilienthal, F.; Jacobi, C.; Schmidt, T.; de la Torre, A.; Alexander, P. On the influence of zonal gravity wave distributions on the Southern Hemisphere winter circulation. Ann. Geophys. 2017, 35. [Google Scholar] [CrossRef] [Green Version]
- Gavrilov, N.M.; Fukao, S.; Nakamura, T.; Jacobi, C.; Kürschner, D.; Manson, A.H.; Meek, C.E. Comparative study of interannual changes of the mean winds and gravity wave activity in the middle atmosphere over Japan, Central Europe and Canada. J. Atmos.-Sol.-Terr. Phys. 2002, 64, 1003–1010. [Google Scholar] [CrossRef]
- Ern, M.; Preusse, P.; Alexander, M.J.; Warner, C.D. Absolute values of gravity wave momentum flux derived from satellite data. J. Geophys. Res. 2004, 109. [Google Scholar] [CrossRef] [Green Version]
- McDonald, A.J.; Tan, B.; Chu, X. Role of gravity waves in the spatial and temporal variability of stratospheric temperature measured by COSMIC/FORMOSAT-3 and Rayleigh lidar observations. J. Geophs. Res. 2010, 115. [Google Scholar] [CrossRef] [Green Version]
- Baumgarten, K.; Gerding, M.; Baumgarten, G.; Lübken, F.J. Temporal variability of tidal and gravity waves during a record long 10-day continuous lidar sounding. Atmos. Chem. Phys. 2018, 18, 371–384. [Google Scholar] [CrossRef] [Green Version]
- Šácha, P.; Miksovsky, J.; Pišoft, P. Interannual variability in the gravity wave drag - vertical coupling and possible climate links. Earth Syst. Dyn. 2018, 9, 647–661. [Google Scholar] [CrossRef] [Green Version]
- Cohen, N.Y.; Gerber, E.P.; Bühler, O. Compensation between resolved and unresolved wave driving in the stratosphere: Implications for downward control. J. Atmos. Sci. 2013, 70, 3780–3798. [Google Scholar] [CrossRef] [Green Version]
- Cohen, N.Y.; Gerber, E.P.; Bühler, O. What drives the Brewer-Dobson circulation? J. Atmos. Sci. 2014, 71, 3837–3855. [Google Scholar] [CrossRef]
- Sigmond, M.; Shepherd, T.G. Compensation between resolved wave driving and parameterized orographic gravity wave driving of the Brewer-Dobson circulation and its response to climate change. J. Clim. 2014, 27, 5601–5610. [Google Scholar] [CrossRef]
- Eichinger, R.; Garny, H.; Sacha, P.; Danker, J.; Dietmüller, S.; Oberländer-Hayn, S. Effects of missing gravity waves on stratospheric dynamics Part I: Climatology. Clim. Dyn. 2020, 54. [Google Scholar] [CrossRef] [Green Version]
- McLandress, C.; Sheherd, T.G.; Polavarapu, S.; Beagley, S.R. Is Missing Orographic Gravity Wave Drag near 60S the Cause of the Stratospheric Zonal Wind Biases in Chemistry-Climate Models? J. Atmos. Sci. 2012, 69. [Google Scholar] [CrossRef] [Green Version]
- Polichtchouk, I.; Shepherd, T.; Hogan, R.; Bechtold, P. Sensitivity of the Brewer–Dobson Circulation and Polar Vortex Variability to Parameterized Nonorographic Gravity Wave Drag in a High-Resolution Atmospheric Model. J. Atmos. Sci. 2018, 75, 1525–1543. [Google Scholar] [CrossRef]
- Ren, R.; Xia, X.; Rao, J. Topographic Forcing from East Asia and North America in the Northern Winter Stratosphere and Their Mutual Interference. J. Clim. 2019, 32, 8639–8658. [Google Scholar] [CrossRef]
- Pogoreltsev, A.I.; Vlasov, A.A.; Fröhlich, K.; Jacobi, C. Planetary waves in coupling the lower and upper atmosphere. J. Atmos. Sol.-Terr. Phys. 2007, 69, 2083–2101. [Google Scholar] [CrossRef]
- Koval, A.V.; Gavrilov, N.M.; Pogoreltsev, A.I.; Savenkova, E.N. Comparisons of planetary wave propagation to the upper atmosphere during stratospheric warming events at different QBO phases. J. Ournal Atmos. Sol. Terr. Phys. 2018, 171, 201–209. [Google Scholar] [CrossRef]
- Jakobs, H.J.; Bischof, M.; Ebel, A.; Speth, P. Simulation of gravity wave effects under solstice conditions using a 3-D circulation model of the middle atmosphere. J. Atmos. Terr. Phys. 1986, 48, 1203–1223. [Google Scholar] [CrossRef]
- Dee, D.P.; Uppala, S.M.; Simmons, A.J.; Berrisford, P.; Poli, P.; Kobayashi, S.; Andrae, U.; Balmaseda, M.A.; Balsamo, G.; Bauer, P.; et al. The ERA-Interim reanalysis: Configuration and performance of the data assimilation system. Q. J. R. Meteorol. Soc. 2011, 137, 553–597. [Google Scholar] [CrossRef]
- Strobel, D.F. Parameterization of the atmospheric heating rate from 15 to 120 km due to O2 and O3 Absorption of solar radiation. J. Geophys. Res. 1986, 83, 6225–6230. [Google Scholar] [CrossRef] [Green Version]
- Fomichev, V.I.; Shved, G.M. Parameterization of the radiative flux divergence in the 9.6 μm O3 band. J. Atmos. Terr. Phys. 1985, 47, 1037–1049. [Google Scholar] [CrossRef]
- Fomichev, V.I.; Blanchet, J.P.; Turner, D.S. Matrix parameterization of the 15 mm CO2 band cooling in the middle and upper atmosphere for variable CO2 concentration. J. Geophys. Res. 1998, 103, 11505–11528. [Google Scholar] [CrossRef] [Green Version]
- Lindzen, R.S. Turbulence and stress owing to gravity wave and tidal breakdown. J. Geophys. Res. 1981, 86, 9707–9714. [Google Scholar] [CrossRef] [Green Version]
- Fröhlich, K.; Pogoreltsev, A.; Jacobi, C. The 48-layer COMMA-LIM model. Rep. Inst. Meteorol. Univ. Leipzig 2003, 30, 157–185. [Google Scholar]
- Jacobi, C.; Fröhlich, K.; Pogoreltsev, A. Quasi two-day-wave modulation of gravity wave flux and consequences for the planetary wave propagation in a simple circulation model. J. Atmos. Sol. Terr. Phys. 2006, 68, 283–292. [Google Scholar] [CrossRef]
- Samtleben, N.; Jacobi, C. Impact of intermittent gravity wave activity on the middle atmospheric circulation during boreal winter. Rep. Inst. Meteorol. Univ. Leipzig 2018, 56, 31–44. [Google Scholar]
- Fleming, E.L.; Chandra, S.; Barnett, J.J.; Corney, M. Zonal mean temperature, pressure, zonal wind and geopotential height as functions of latitude. Adv. Space Res. 1988, 10. [Google Scholar] [CrossRef]
- Swinbank, R.; Ortland, D.A. Compilation of wind data for the Upper Atmosphere Research Satellite (UARS) Reference Atmosphere Project. J. Geophys. Res. 2003, 108, 4615. [Google Scholar] [CrossRef]
- Ern, M.; Trinh, Q.T.; Kaufmann, M.; Krisch, I.; Preusse, P.; Ungermann, J.; Zhu, Y.; Gille, J.C.; Mlynczak, M.G., III; Schwartz, M.J.; et al. Satellite observations of middle atmosphere gravity wave absolute momentum flux and of its vertical gradient during recent stratospheric warmings. Atmos. Chem. Phys. 2016, 16, 9983–10019. [Google Scholar] [CrossRef] [Green Version]
- Perlwitz, J.; Graf, H.F. Troposphere-stratosphere dynamic coupling under strong and weak polar vortex conditions. Geophys. Res. Lett. 2001, 28, 271–274. [Google Scholar] [CrossRef] [Green Version]
- Xiao, C.; Hu, X.; Tian, J. Global temperature stationary planetary waves extending from 20 to 120 km observed by TIMED/SABER. J. Geophys. Res. 2009, 114. [Google Scholar] [CrossRef] [Green Version]
- Mukhtarov, P.; Pancheva, D.; Andonov, B. Climatology of the stationary planetary waves seen in the SABER/TIMED temperatures (2002–2007). J. Geophs. Res. 2010, 115. [Google Scholar] [CrossRef] [Green Version]
- Kruse, C.G. Regional to global evolution of impacts of parameterized mountain-wave drag in the lower stratosphere. J. Clim. 2020, 33. [Google Scholar] [CrossRef]
- Plumb, R.A. On the Three-Dimensional Propagation of Stationary Waves. J. Atmos. Sci. 1985, 42, 217–229. [Google Scholar] [CrossRef]
- Kumar, K.; Ramkumar, T.K.; Krishnaiah, M. Analysis of large-amplitude stratospheric mountain wave event observed from the AIRS and MLS sounders over the western Himalayan region. J. Geophys. Res. 2012, 117. [Google Scholar] [CrossRef] [Green Version]
- Lilly, D.K.; Nicholls, J.M.; Kennedy, P.J.; Klemp, J.B.; Chervin, R.M. Aircraft measurements of wave momentum flux over the Colorado Rocky mountains. Q. J. R. Meteorol. Soc. 1982, 108, 625–641. [Google Scholar] [CrossRef]
- Hoffmann, L.; Xue, X.; Alexander, M.J. A global view of stratospheric gravity wave hotspots located with Atmospheric Infrared Sounder observations. J. Geophys. Res. 2013, 118, 416–434. [Google Scholar] [CrossRef] [Green Version]
- Trinh, Q.T.; Kalisch, S.; Preusse, P.; Chun, H.Y.; Eckermann, S.D.; Ern, M.; Riese, M. A comprehensive observational filter forsatellite infrared limb sounding of gravity waves. Atmos. Meas. Tech. 2015, 8, 1491–1517. [Google Scholar] [CrossRef] [Green Version]
- Wright, C.J.; Osprey, S.M.; Gille, J.C. Global distributions of overlapping gravity waves in HIRDLS data. Atmos. Chem. Phys. 2015, 15. [Google Scholar] [CrossRef] [Green Version]
- Available online: http://climate-modelling.canada.ca/climatemodeldata/cmam/output/CMAM/CMAM30-SD/index.shtml (accessed on 18 September 2020).
- Matthewman, N.J.; Esler, J.G.; Charlton-Perez, A.J.; Polvani, L.M. A new look on stratospheric sudden warmings. Part III: Polar vortex evolution and vertical structure. J. Clim. 2009, 22, 1479–1494. [Google Scholar] [CrossRef]
- Seviour, W.J.M.; Mitchell, D.M.; Gray, L.J. A practical method to identify displaced and split stratospheric polar vortex events. Geophys. Res. Lett. 2013, 40. [Google Scholar] [CrossRef] [Green Version]


Publisher’s Note: MDPI stays neutral with regard to jurisdictional claims in published maps and institutional affiliations. |
© 2020 by the authors. Licensee MDPI, Basel, Switzerland. This article is an open access article distributed under the terms and conditions of the Creative Commons Attribution (CC BY) license (http://creativecommons.org/licenses/by/4.0/).
Share and Cite
Samtleben, N.; Kuchař, A.; Šácha, P.; Pišoft, P.; Jacobi, C. Mutual Interference of Local Gravity Wave Forcings in the Stratosphere. Atmosphere 2020, 11, 1249. https://doi.org/10.3390/atmos11111249
Samtleben N, Kuchař A, Šácha P, Pišoft P, Jacobi C. Mutual Interference of Local Gravity Wave Forcings in the Stratosphere. Atmosphere. 2020; 11(11):1249. https://doi.org/10.3390/atmos11111249
Chicago/Turabian StyleSamtleben, Nadja, Aleš Kuchař, Petr Šácha, Petr Pišoft, and Christoph Jacobi. 2020. "Mutual Interference of Local Gravity Wave Forcings in the Stratosphere" Atmosphere 11, no. 11: 1249. https://doi.org/10.3390/atmos11111249
APA StyleSamtleben, N., Kuchař, A., Šácha, P., Pišoft, P., & Jacobi, C. (2020). Mutual Interference of Local Gravity Wave Forcings in the Stratosphere. Atmosphere, 11(11), 1249. https://doi.org/10.3390/atmos11111249