1. Introduction
Most of the indices are based on one variable or a combination of two variables (e.g., geopotential height, precipitation, pressure, and temperature). Few indices influence the climate worldwide from month to decadal-scale, e.g., Southern Oscillation Index (SOI), Arctic Oscillation (AO), and North Atlantic Oscillations are widely use in statistical and diagnostic indices.
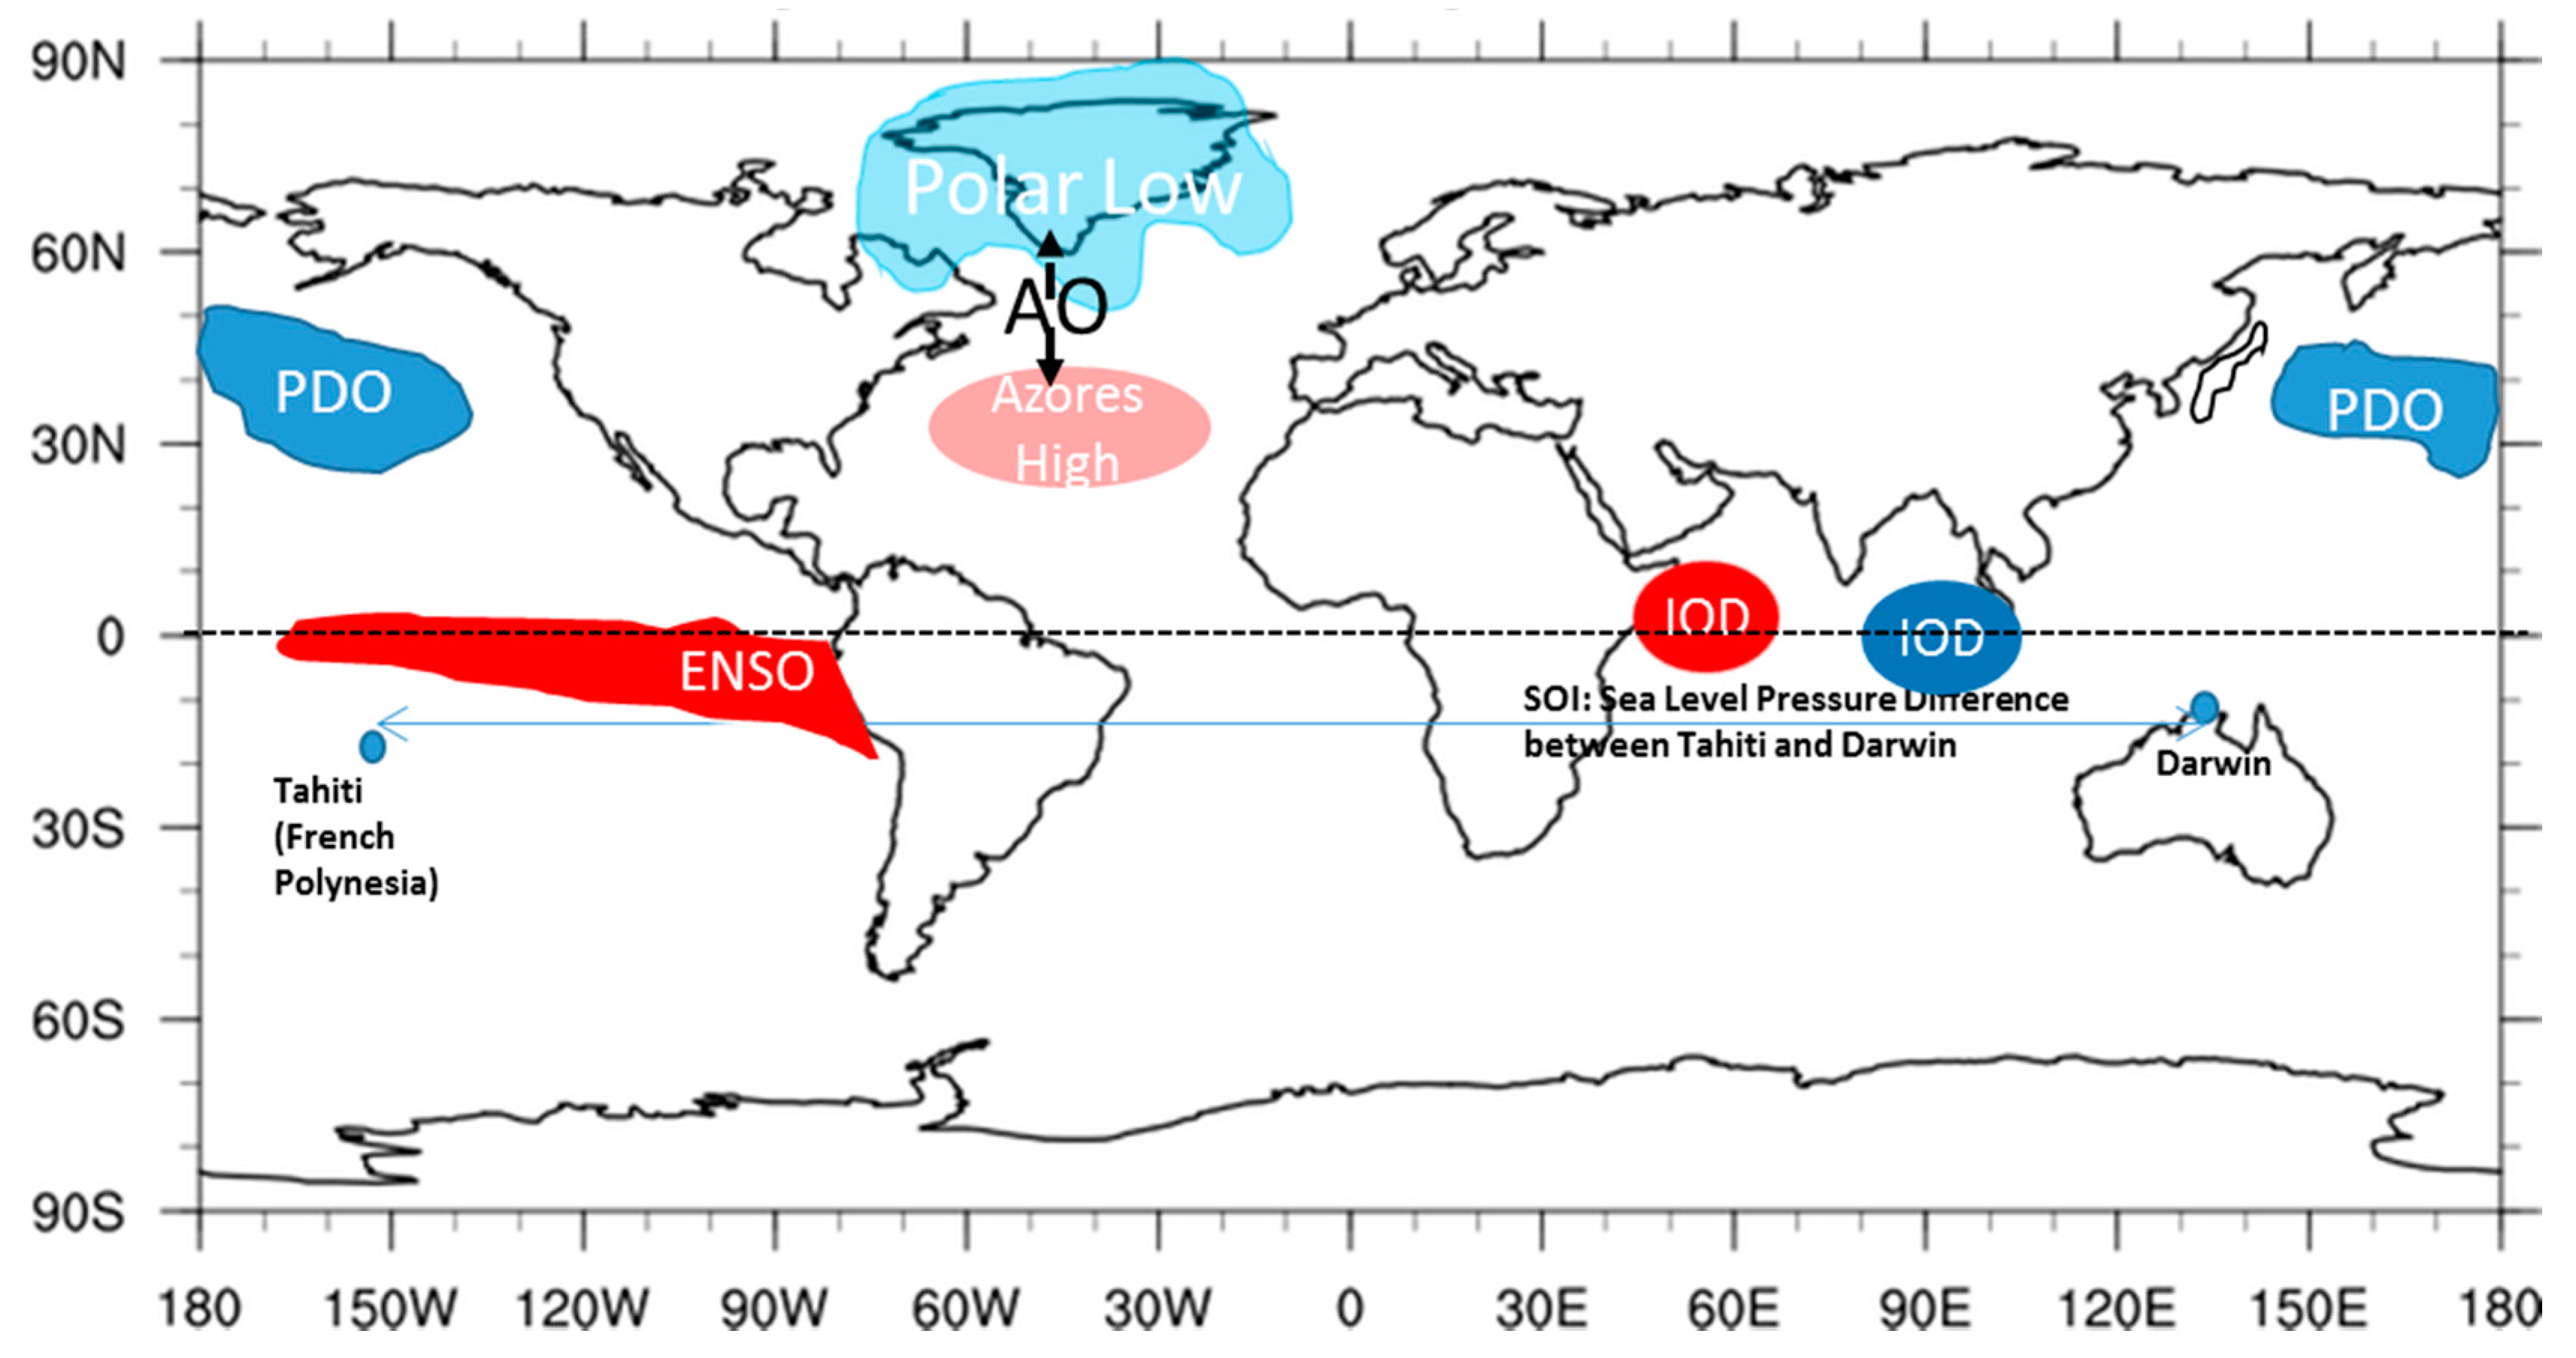
Figure 1 displays the location of the most widely known teleconnection points and their names.
Indices are a well-known tool and have proven fundamental importance in understanding global teleconnection patterns (e.g., Arctic Oscillations, Atlantic Oscillations, El-Nino, and Indian Ocean Dipole) to predict the weather and climate. New indices have been used to calculate the length of dry/wet spell, heat degrees, comfort, and mood swings. Additionally, ENSO, IOD, and El-Nino indices have been widely used to predict south Asian monsoonal rainfall. With the advent of new satellites, these indices provide high-resolution data in time and space; the old indices may be redefined. Furthermore, the new variables (cloud mixing ratio, buoyancy, etc.) can be utilized to define new indices.
New and emerging fields, e.g., lighting in tropical cyclones, cloud microphysics, the hydrology of extreme rainfall events, air quality, sea-level rise due to ice melt, and changing ecology of polar regions, have the opportunity to construct and redefine the indices.
An appropriate index can be put together to access and analyze climate change and the global warming issue. New insights based on new indices, themselves in turn based on new advances and variables, can provide new dimensions to climate change science. Multi-disciplinary disciplines may help one to better understand climate change using indices from their field.
2. Summary of the Special Issue
A summary of each manuscript is explained in the following way.
2.1. Climate indices for Holiday and Tourism
The climate of a region is an important incentive for traveling to a holiday or business destination. However, a timely check of the weather may better enable one to plan a trip. Rutty et al. [
1] investigated the relationship between the Caribbean climate and tourist arrival. They relate the Holiday Climate Index (HCI) of Antigua and Barbuda, Barbados, and Saint Lucia with the Tourism Climate Index (TCI) to know the increase and decrease in tourism. The results show a significant correlation between tourist arrivals from Canada to the Caribbean. Further, their results claim to help in the prediction of tourist demand.
Figure 2 shows the higher values of daily mean index HCI: Beach.
2.2. Indicator of Climate Change
Grigoriva [
2] addressed the analysis of the thermal component of climate change on agriculture. This research highlights two aspects: one, review methods and indices used to estimate changes in the climate’s thermal component over the climate-sensitive area where high-temperature extremes occur. Second, they defined composite indicator Growing Degree Day Sensitivity Index (GDDSI) and percentage change in Growing Degree Day (GDD) for warming scenarios (1 to 3 °C). The data of 50 weather stations for 1966–2017 were analyzed, and a strong GDDSI north-south gradient was found. The warming rates and sensitivity do not increase accordingly. GDDs for 15 °C had the highest sensitivity in the north of the study area. Thus, sensitivity remains higher for higher base threshold. Further, the results obtained are useful to identify the areas of high sensitivity to climate change and impact due to warming.
2.3. Climate: Temperature-Precipitation Tele-Connection
Kumar et al. [
3] analyzed a historical flood event (Kerala Flood Event, KFE, 15–16 August 2018, in India) meteorologically and hydrologically. A combination of lower systems (low-pressure system over the Bay of Bengal and off-shore trough) and dry air intrusion in the middle of the troposphere instigated the unstable weather to lead to KFE. Ingredients like moisture and low-pressure systems are local and regional, but their connection to remote influences remains unclear. Dams could not help in the mitigation process due to extended rainfall.
Yamada et al. [
4] investigated the frequency of the record-breaking precipitation events over 58 stations in Japan between 1901 and 2018 using statistical methods. They found the average number of events 5.8 for 118 years as compared to the theoretical value of 5.4 (assuming the climate system over the period remains stationary). They applied the sampling theory on long-term temperature trends, which is ~0.5 K/100 years, and found many record-breaking events.
Hoshino et al. [
5] worked on the increase in “Tropical Cyclones (TC) induced rainfall” with “global warming”. The TC-induced rainfall is governed by its position and topography of the basin. A large number of ensembles at 5 km resolution were used to understand the rainfall characteristics over four basins. Their results show differences in the TC-induced rainfall characteristics (volume, intensity) over the selected basins.
Kristof et al. [
6] used the Coupled Model Intercomparison Project Phase 5 (CMIP5) product to investigate the impact of atmospheric teleconnections over global and regional climate. To quantify the General Circulation Models (GCMs), they used the Simple Diversity Index based on time series of the geopotential height (500 hPa) in the Northern Hemisphere. This new method is quite convenient to help make arbitrary decisions. The introduced method could help the scientific community evaluate the best performing GCMs and reanalysis products for some regions for regional downscaling exercise and impact studies.
2.4. Adaption and Climate Change
Chen and Niu [
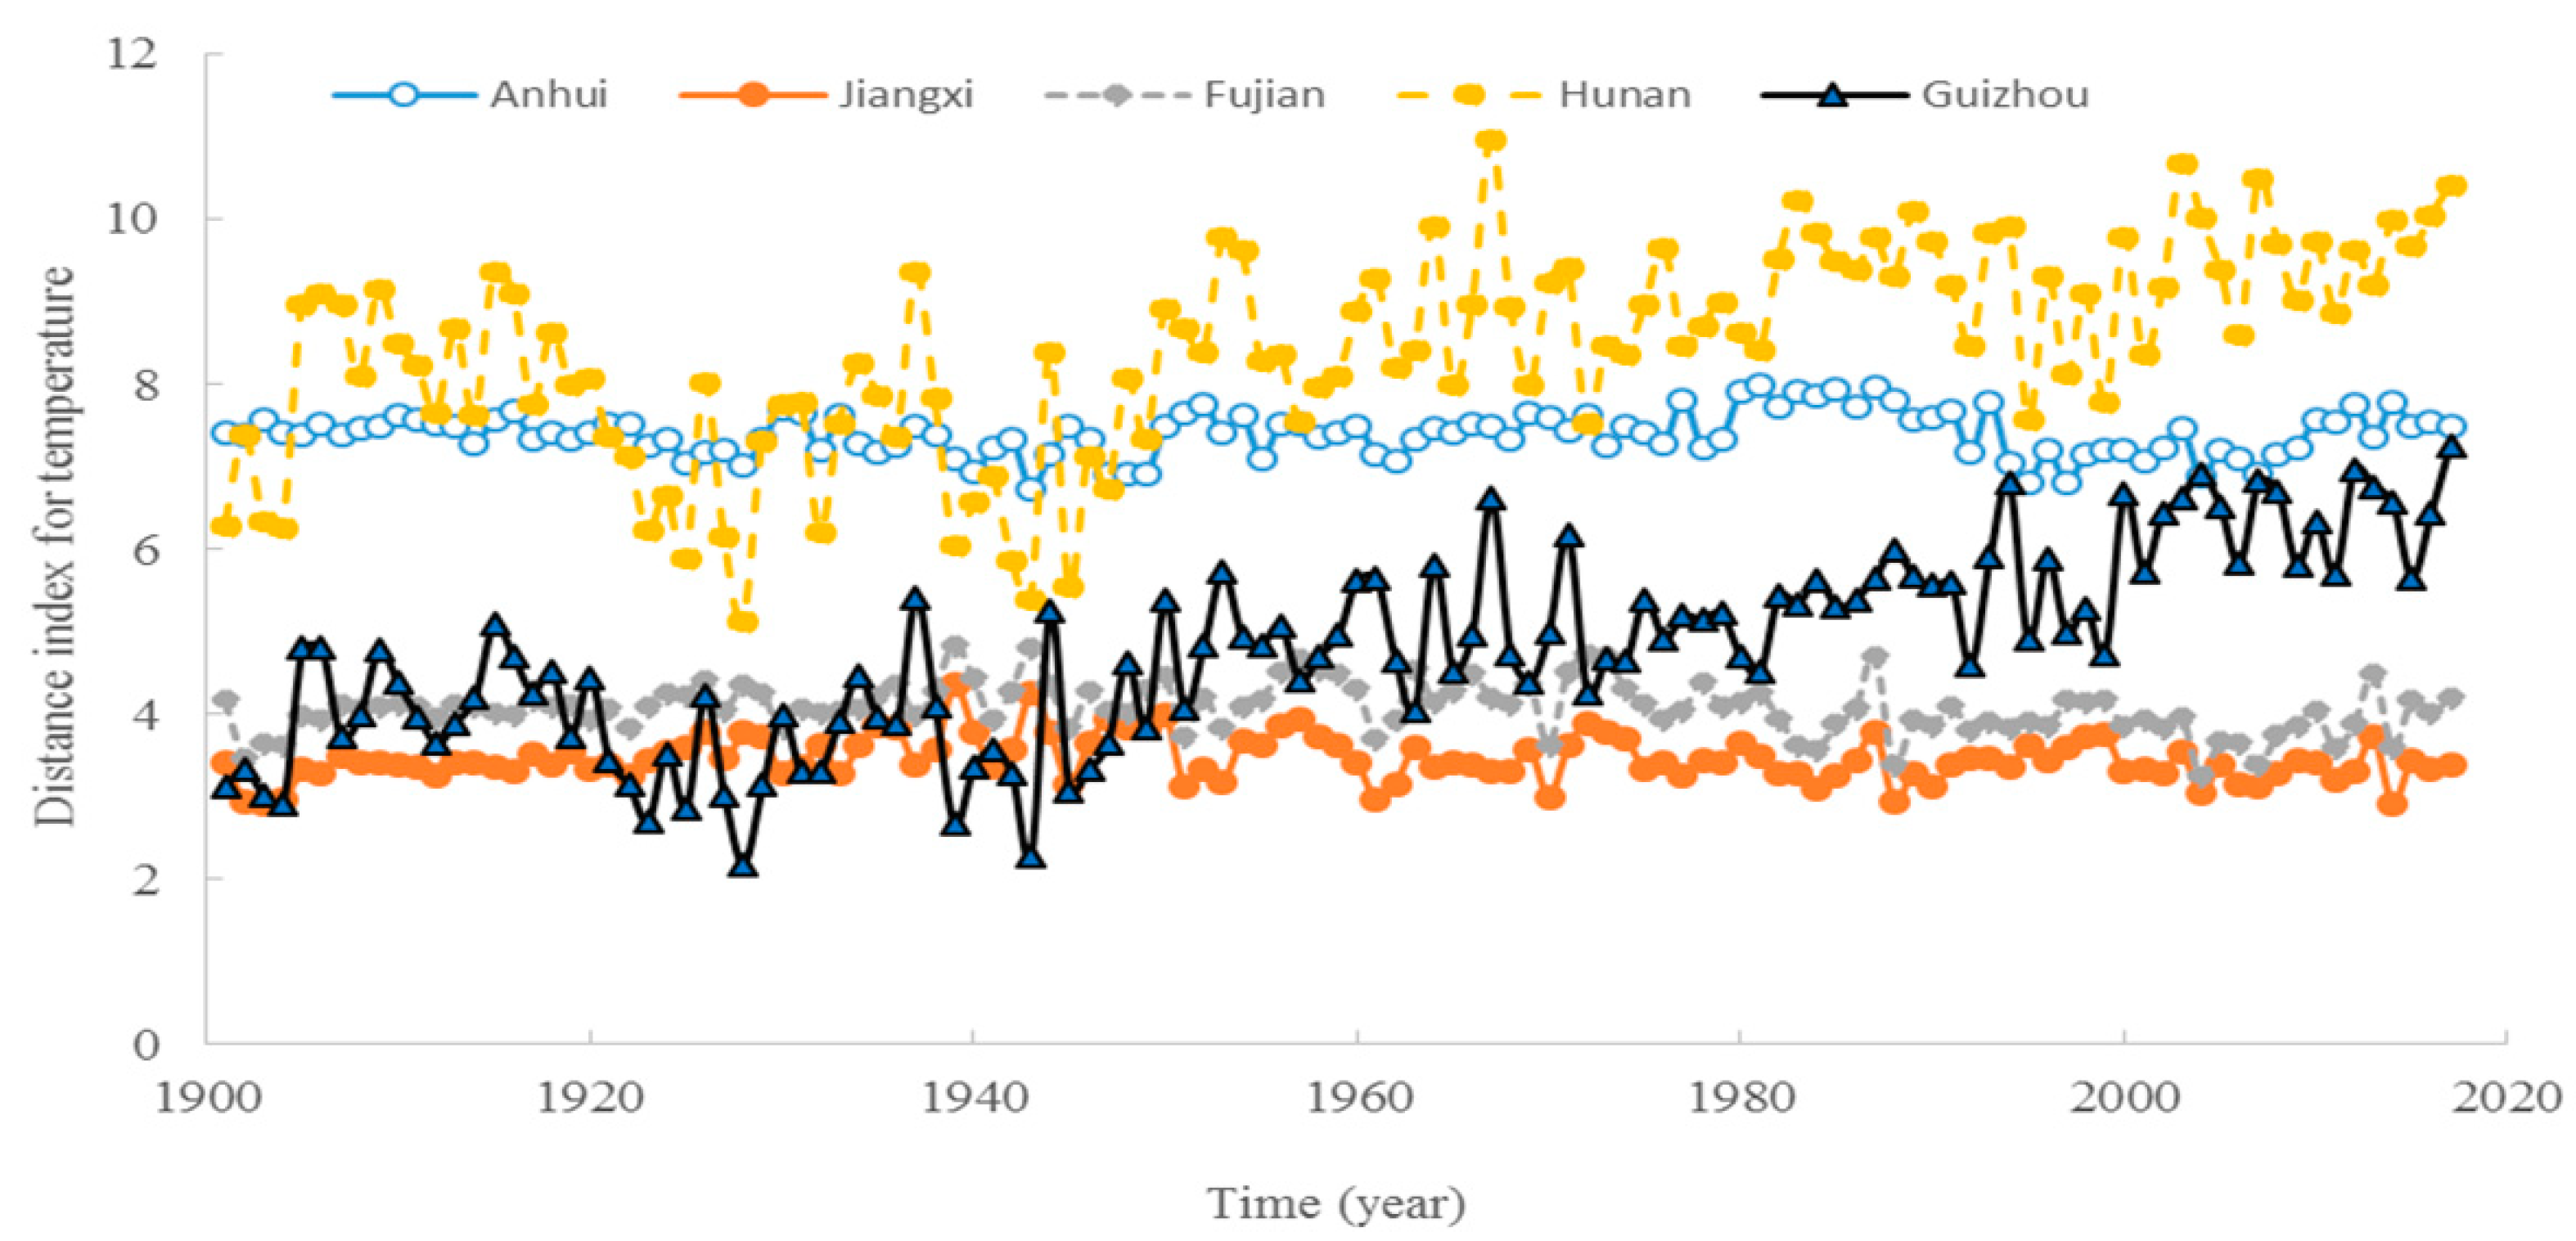
7] studied climate change adaption for Chinese Torreya (Torreya grandis “Merrillii”, a thousand old crops tree in China) from 1901 to 2017. The annual temperature increased by ~2 °C over six regions in southern China, while precipitation did not show any such trend. Zhuji, a central production region of Chinese Torreya, showed no significant correlation of precipitation with Hunan and Guizhou precipitation. An almost similar climate distance index for temperature was accessed for grown Chinese Torreya over these regions but different climate distance indices were accessed for precipitation. That is, an increased range of temperature remained similar over the region, while precipitation varied a lot. These results provide a way to evaluate the adaption of other plants to climate change.
Figure 3 compares the relationship between Climate Distance Index (CDI) and temperature in Zijhu with other regions.
Yatagai et al. [
8] evaluated extreme events and end-of-the-day (EOD) judgment based on Asian Precipitation Highly Resolved Observational Data Integration Towards Evaluation of Extreme Events (APHRODITE-2). APHRODITE-2 ensures the informatively in the daily accumulation period (end of the day, EOD) over a specific domain. EOD products use reanalysis precipitation products CMORPH V1.0 and ERA-Interim. With this method, we can judge EOD precipitation over a station against unknown observation time.
3. Discussion and Conclusions
This Special Issue attracted more than a dozen contributors. However, due to COVID-19 the research of many authors was not submitted on time. Nevertheless, the present Special Issue collected eight contributions, discussing a wide range of climate indices, and regional and remote influences, on a region of interest. The indices and results discussed in this Issue will be of interest to modelers and researchers to understand future climate variability. Finally, the author hopes that the research offered here will motivate new ideas in climate modeling.
Many new datasets for various variables are being collected from the polar satellites, with great accuracy in space and time. Recently, multi-disciplinary researchers have working together to apply new methods and data analysis in meteorology, hydrology, and geoscience. Grid-based computations, cloud-based imagery analysis, and many more fields may bring new indices to understand the climate in a better way. Accordingly, most of the climate indices are based on a few fundamental variables. In the near future, some of the new climate indices may be researched based on high-resolution datasets. With the increase of surface temperature, atmospheric water vapor, cloudiness, and extreme rainfall, there has been increased hardship, stress, anxiety, migraine, and flu. By combining the meteorological parameter with health, new indices may be created to measure wellness and prepare for safety.
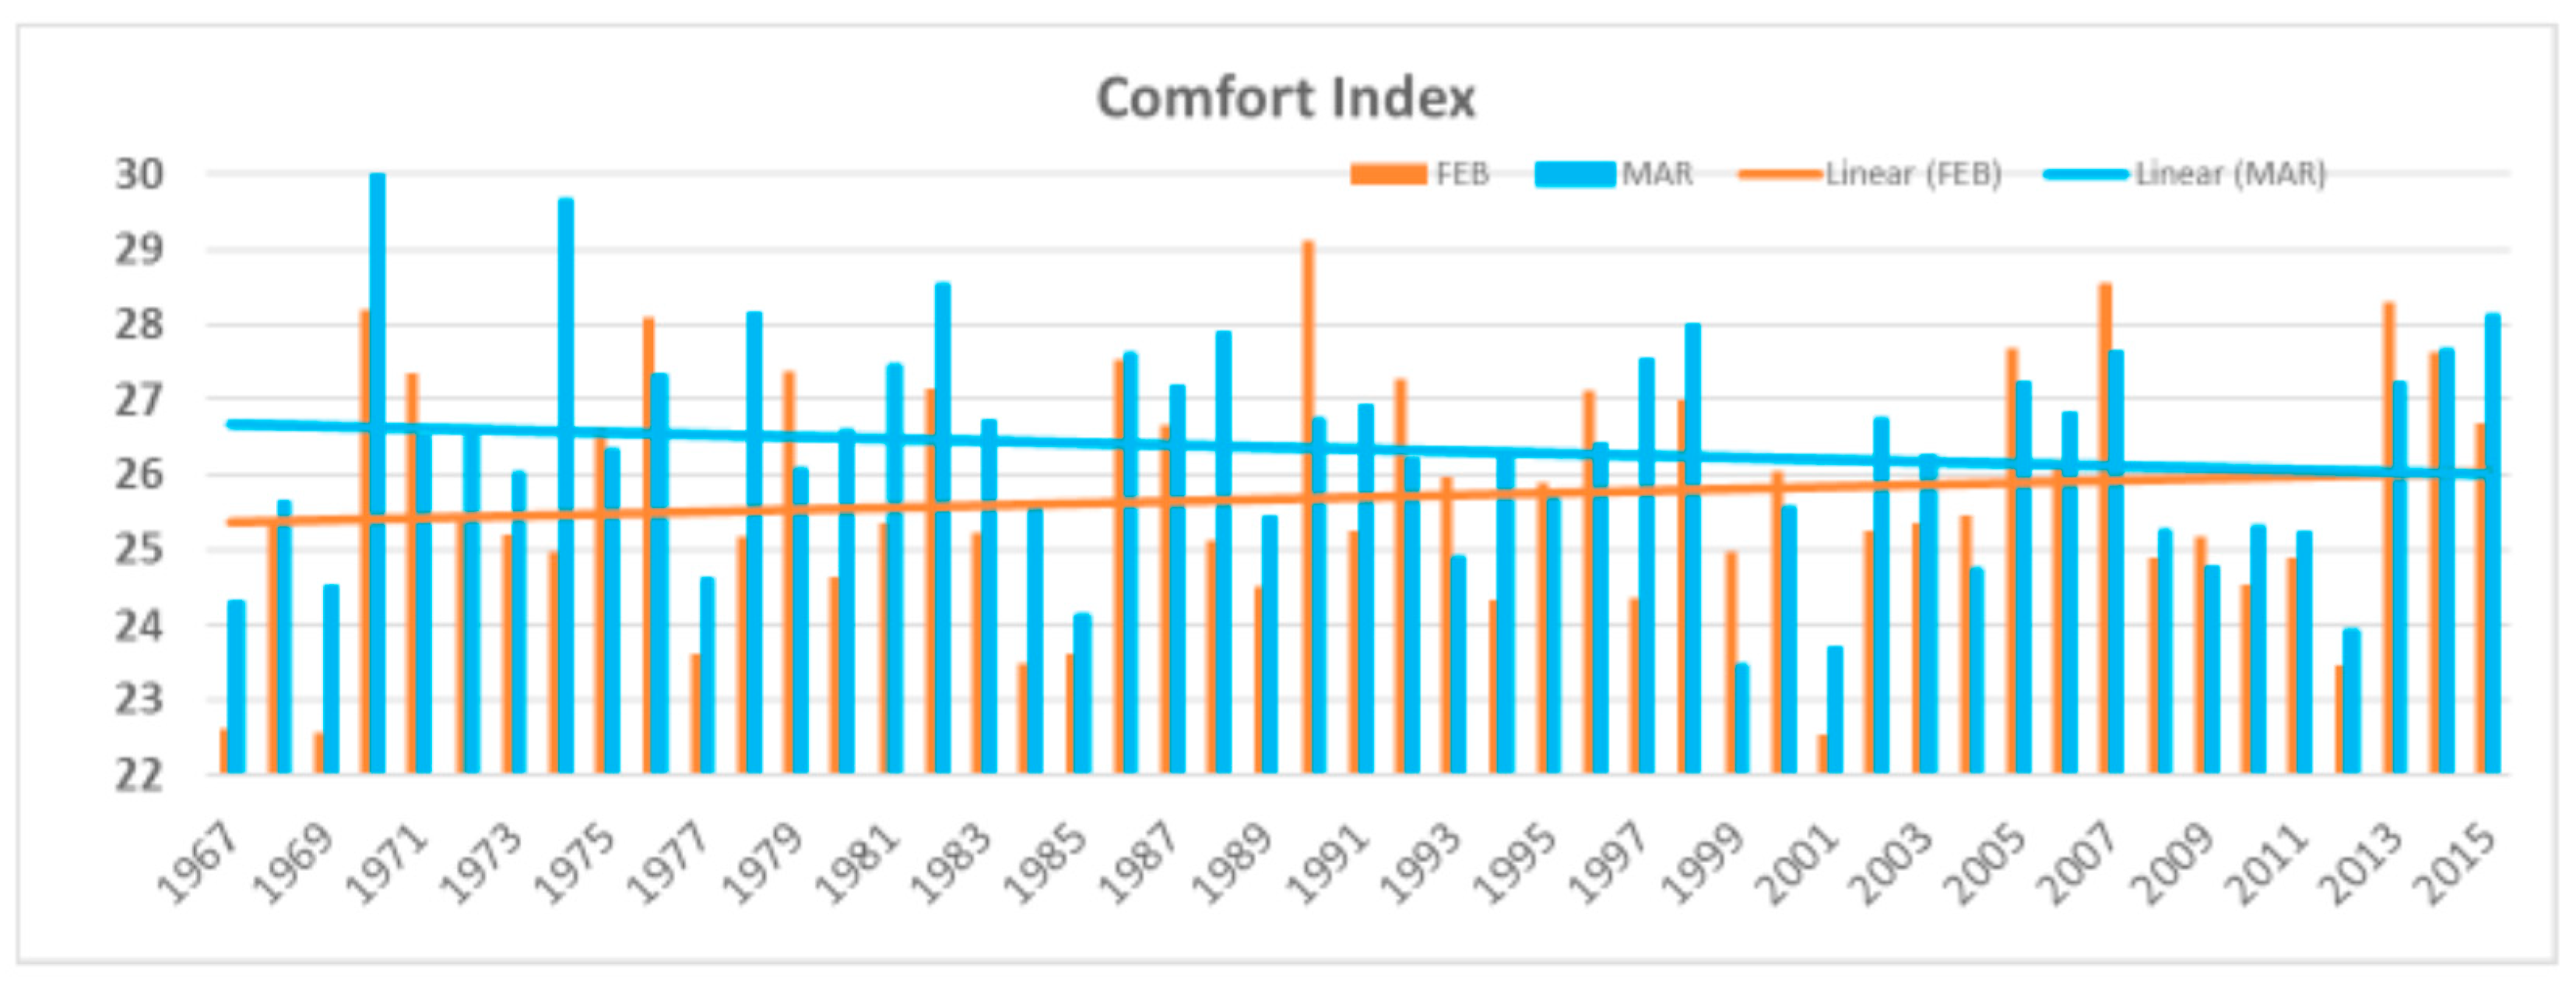
Figure 4 shows the Comfort Index increasing in February.
The Issue attracted eight manuscripts that were dedicated to the atmospheric field. In the future, new researchers may get help from European Climate Assessment and Dataset (ECAD) project [
10], climate indices from NOAA [
11], and Climdex project [
12] to work on various indices.


