Abstract
Several versions of Asian Precipitation-Highly-Resolved Observational Data Integration Towards Evaluation of Extreme Events (APHRODITE-2) have been released for analyzing rain-gauge-based daily precipitation. APHRODITE-2 constitutes an improvement compared with the previous versions for evaluating extreme precipitation. One advantage of APHRODITE-2 products (versions 1801R1 and 1901) over APHRODITE-1 products is the ability to ensure uniformity in the daily accumulation period (end of the day, EOD) used in a specific domain. To create these EOD segregated or EOD adjusted products, we applied an EOD judgment scheme using multi-satellite merged precipitation products CMORPH V1.0 and ERA-Interim reanalysis. The novelty of the current methodology was tested against rain-gauge datasets with known EOD information. Despite the difference in horizontal resolution, ERA-Interim shows similar EOD detection performance to CMORPH. However, CMORPH showed better performance over India than ERA-Interim. The current method has potential to judge EOD of rain-gauge station data with an unknown observation time. Having prior EOD information as metadata is very important for gridded datasets as well as station data. Here, we also present deterministic/estimated EOD that we used for V1801R1 over Monsoon Asia.
1. Introduction
Long-term meteorological datasets have a significant role in advancing our scientific understanding of the nature of climate change as well as projecting future changes. Analyses of climate data for various meteorological parameters can be used to infer the possible connections between extreme meteorological events and climate change. However, despite significant improvements in global/regional models, precipitation is still a challenging element to quantify and parameterize accurately through models and observations [1,2,3]. Although several platforms are considered as sources for precipitation datasets, rain-gauge measurements are treated as accurate measurements over land. Hence, rain-gauge-based datasets are considered as a reference for evaluating other precipitation estimates obtained by satellites and modeling. Rain-gauges deployed over different spatial domains (regional/continental) with high/low density are often converted to uniform grids of specific spatial/temporal resolutions with robust statistical interpolation/extrapolation methods to overcome rain-gauge point specific issue, i.e., to obtain areal precipitation, etc. [4,5]. Efforts are also made to try to improve the interpolation scheme, for instance, the representation of local geographical/physical factors such as topography, the climatology of a specific variable, and the spatial variability of parameters in interpolation methods.
Against this background, several different kinds of long-term meteorological datasets based on ground-based observations have emerged in recent decades. Among these, a few are exclusively generated for basic parameters such as precipitation and temperature [6,7,8,9,10,11,12]. The preparation of such datasets involves significant effort, especially in obtaining daily station data from different jurisdictions within a studied area. Meteorological organizations have developed such public domain datasets like the Global Summary of the Day (GSOD) or Global Historical Climatology Network (GHCN) [13]. Nevertheless, the limited density and low quality of measurements often prevent them from being applicable for specific applications [14,15]. Therefore, data developers have often attempted to combine several openly accessible datasets (GSOD or GHCN) with regional station datasets after performing rigorous quality checks and improving interpolation methods [6,7]. Extensive quality checks and robust interpolation methods certainly improve the quality and applicability of the datasets [4,6,9,11,15,16]. However, when the original station datasets are merged to develop gridded products, there is often a lack of information about the location of the station and time during which the 24-h precipitation was accumulated.
Asian Precipitation-Highly-Resolved Observational Data Integration Towards Evaluation of Water Resources (APHRODITE-1) [6,7,17] developed long-term daily precipitation and temperature datasets for the meteorological community as well as those working in other related scientific fields. The APHRO_V1101 algorithm was designed and developed to evaluate water resources (e.g., precipitation over the mountains and the river catchments) [6,15,16]. Enormous feedback from data users on APHRODITE-1 products and its wide applicability motivated the developers of APHRODITE-2 (operated from 2016 to 2019) to extend the availability of APHRODITE products up to 2015, with significant efforts to enhance the quality of the product. APHRODITE-2 version 1801 (hereafter APHRO_V1801R1) and version 1901 (APHRO_V1901) datasets over Monsoon Asia are exclusively generated to evaluate extreme precipitation events (available at http://aphrodite.st.hirosaki-u.ac.jp).
Significant efforts have been made to achieve this goal. For example, we improved quality control (QC) schemes, tested some interpolation schemes, and carefully examined the end of the day (EOD) of each original dataset and applied EOD adjustments. Such efforts were intended to make the APHRODITE-2 products particularly suitable for evaluating extreme precipitation. For the earlier product APHRO_V1801R1, we segregated different EOD data within particular geographical domains/countries. In the latest APHRODITE-2 product APHRO_V1901, we adjusted the end of the day to 00:00–24:00 h UTC and established a gridded product over Monsoon Asia (APHRO_MA).
The purpose of this paper is to explain and conceptualize EOD and to show the results of a test examining 24-h accumulation time (EOD). This resulted in the production of APHRO_V1801R1. To examine EOD, we used both a satellite precipitation product, namely, CMORPH [18,19], and a meteorological reanalysis dataset, namely, ERA-Interim [20]. The rest of the article is organized into three sections. Section 2 explains datasets used in this study, the concept of EOD, and the methodology for estimating EOD. Section 3 presents the results and discussion. A brief conclusion is presented in Section 4.
2. Materials and Methods
2.1. Rain-Gauge Data
The rain-gauge data used in this study consist of two categories, namely, offline and global telecommunication system (GTS)-based data. During the analysis of both APHRODITE-1 and APHRODITE-2, we used individual collection data as well as pre-compiled data that included data on more than one country (e.g., ASEAN compendium climate database, former USSR data by CDIAC). These are referred to as offline data in this study. Here, datasets that include data on more than one country are separated into data on individual countries.
In addition, we used global surface summary of the day (GSOD), which is a widely used set of GTS-based data. It is available at the website of the National Centers for Environmental Information (NCEI) of the National Oceanic and Atmospheric Administration (NOAA) (https://data.nodc.noaa.gov/cgi-bin/iso?id=gov.noaa.ncdc:C00516). GSOD provides information about 18 essential meteorological elements on a daily scale. Nearly 9000 weather stations collect information on 18 surface meteorological variables around the globe. GSOD is assembled from sub-daily or daily reports to GTS, and each set of precipitation data has a flag showing the quality information including processes to get “daily” precipitation value of the day which was applied at NCEI/NOAA relevant persons. Each “daily” precipitation sometimes involves the summation of three 6-hourly precipitation reports or one 12-hourly precipitation report (Table 1). Therefore, we have only considered those reports of which the accumulation represents daily precipitation. The three kinds of report are thus four 6-hourly reports (D), two 12-hourly reports (F), and one daily report (G). These different types of data source reports are indicated with different flags (e.g., D, F, and G), as mentioned in GSOD readme file (ftp://ftp.ncdc.noaa.gov/pub/data/gsod/readme.txt).

Table 1.
Flags of Global Summary of the Day (GSOD) precipitation data.
After the EOD check described in this study, we selected a station precipitation dataset to use country by country and year by year. A list of the countries for both offline and GSOD over Monsoon Asia is available in the Appendix A, with information on EOD and on whether or not we used it for APHRO_V1801R1.
2.2. CMORPH
The Climate Prediction Center (CPC) MORPHing technique, CMORPH [18,19], is a multi-satellite-based precipitation product derived by a morphing technique that exclusively makes use of low-level orbit passive microwave (PMW) observations to estimate precipitation. Precipitation features obtained from microwave observations are propagated in the spatial/temporal domain by a forward/backward morphing technique. Cloud system advection vectors derived from infrared measurements are used to propagate precipitation features over grids, where PMW observations are not available. The dataset is available with multiple spatial and temporal resolutions from 1998 to the present over the latitude range of 60° N to 60° S.
A reprocessed and bias-corrected version (V1.0) of CMORPH daily precipitation data has been released into the public domain. The latest version of CMORPH data has several advantages, such as fixed interpolation algorithms and microwave observations being considered from identical versions of passive microwave sensors. The updated version of CMORPH precipitation retrievals showed potential improvement over the earlier version in reproducing the spatial and temporal variability of precipitation. Moreover, the latest CMORPH precipitation estimates have been proven to be better than widely used TRMM-3B42 datasets at sub-daily/daily scales [19]. Although CMORPH precipitation estimates are available with various spatial/temporal resolutions, we used a special version of hourly precipitation estimates with 0.25° latitude/longitude spatial resolution provided by Dr. Xie for EOD estimates.
2.3. ERA-Interim
EOD detection with satellite-based estimates of precipitation was impracticable in the pre-satellite era given the limited number of observations. Moreover, satellite-based estimates of precipitation do not work well over high altitudes. Thus, we used 3-hourly/0.75° precipitation forecasts of ERA-Interim to estimate the EOD over various sub-continental regions. We compared the performance of ERA-Interim and CMORPH datasets to evaluate their strengths and weaknesses. ERA-Interim is a long-term global atmospheric reanalysis dataset produced by the European Centre for Medium-range Weather Forecasts (ECMWF). It contains multiple meteorological variables available from 1979 to August 2019. The ERA-Interim dataset was developed with a four-dimensional data assimilation scheme by incorporating analysis/forecast cycles [20]. In each cycle, the available observations, which do not include precipitation, are combined with prior information from a forecast model to estimate the evolving state of the global atmosphere and the surface underlying it. We used 3-h, 6-h, 9-h, 12-h precipitation forecasts starting with 00:00 h UTC (hereafter 00 UTC) and 12:00 h UTC (12 UTC) (Figure 1). Each successive 3-h precipitation value used in this study is obtained by subtracting accumulated precipitation at consecutive time intervals. For example, 3-h precipitation between 03–06 UTC is obtained by subtracting 3-h forecast initialized at 00 UTC from 6-h forecast initialized at 00 UTC. The computational steps to estimate the 3-hourly precipitation from ERA-Interim measurements are shown in Figure 1.
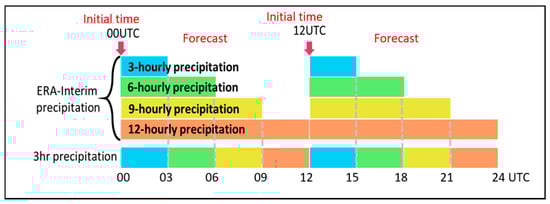
Figure 1.
A schematic diagram showing the methodology for estimating 24-h accumulated precipitation from ERA-Interim sub-daily scale forecasts.
2.4. Definition of EOD
EOD is one of the significant aspects through which APHRODITE-2 products constitute improvements over earlier versions. The estimated or deterministic EOD information was used for the time-adjusted product (APHRO_V1901) as well as to choose the station data for APHRO_V1801R1.
Rain-gauge measurements are available with different temporal intervals. Daily data may often be collected from different data holders within the same country/region using various 24-h accumulation periods. Each dataset of an individual country is generated according to the local organization’s convenience following WMO guidance. For example, in the case of India, the Indian Meteorological Department measures the daily rain-gauge data in the morning at 08:30 h (IST, which corresponds to 03 UTC) and stamps on that specific day. Precipitation (in mm/day) stamped on 11th July is the actual precipitation accumulated from the previous day (10 July) 08:30 h to 11 July 08:30 h IST. Therefore, EOD is 3 UTC for IMD rain-gauge measurements (see Figure 2a). EOD may differ for each dataset collected from various data sources.
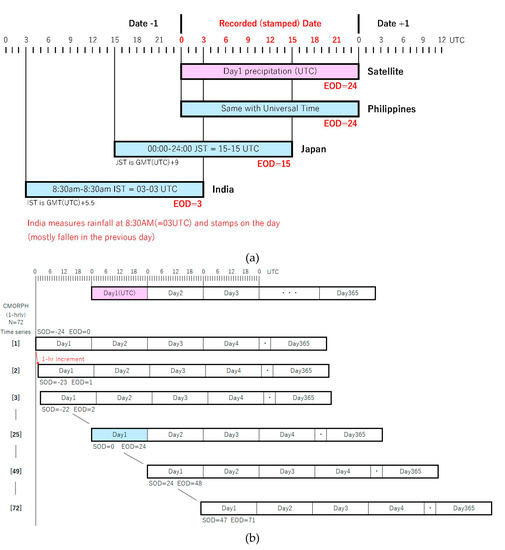
Figure 2.
Schematic diagram showing (a) the end of the day for some countries. Light blue bars indicate 24-h period of accumulated precipitation for the stamped date. (b) Schematic diagram showing 72 sets of different “daily” precipitation time series summed up from CMORPH sub-daily time series.
GSOD daily precipitation data are available with different rain flags D, F, and G. Precipitation accumulated with D, F, and G flags represents the summation of four reports of 6-h precipitation (D), two reports of 12-h precipitation (F), and one report of 24-h precipitation (G); however, they are not associated with EOD information. Mixing such kinds of datasets, especially GSOD data with different flags with offline data, may reduce the extreme values. In a previous version of APHRODITE products, namely APHRO_V1101, we mixed all available data including GSOD with flags other than D, F, and G as well as various offline data. Mixing precipitation data with varying EOD may change the nature of the event. To avoid such data mixing ambiguity, the APHRODITE-2 team carefully selected data with unmixed EOD to be used for generating APHRO_V1801R1 gridded products (see Appendix A).
2.5. Methodology for EOD Estimation
EOD is estimated for each rain-gauge as a specific data source using statistical metrics such as correlation coefficient (r) and root mean square error (RMSE). We used the updated version (V1.0) of the CMORPH and ERA-interim dataset to estimate EOD information for each rain-gauge location.
“Daily” precipitation time series were computed from hourly CMORPH (3-hourly ERA-interim) as shown in Figure 2b. In addition to the universal “daily” precipitation from the day 00 UTC to 24 UTC (SOD = 0, EOD = 24), we prepared 71 (23 for ERA-interim) different time series starting from SOD = −24 (EOD = 0) to SOD = 47 (EOD = 71). Namely, for each rain-gauge station data, there are 72 (24) different “daily” precipitation time series which were summed up from CMORPH hourly (ERA-interim 3-hourly) precipitation with 1-h (3-h) increments.
The r and RMSE between referenced rain-gauge daily precipitation data and the nearest CMORPH 0.25° grid pixel (ERA-interim 0.75° grid pixel) daily accumulated precipitation are computed. Namely, we obtain 72 correlation coefficients (r), between a daily rain-gauge station precipitation and CMORPH “daily” precipitation with different SOD (−24 to 47). Figure 3 shows an example of r and RMSE between the daily station precipitation time series and 72 different CMORPH “daily” time series of the Philippines for 1998. After computing r and RMSE for each station at each CMORPH time series, we averaged r and RMSE of the 52 stations in the Philippines. The averaged highest r and lowest RMSE were obtained at SOD = 0 (EOD = 24) (Figure 3), which is the correct 24-h accumulation period for the Philippines.
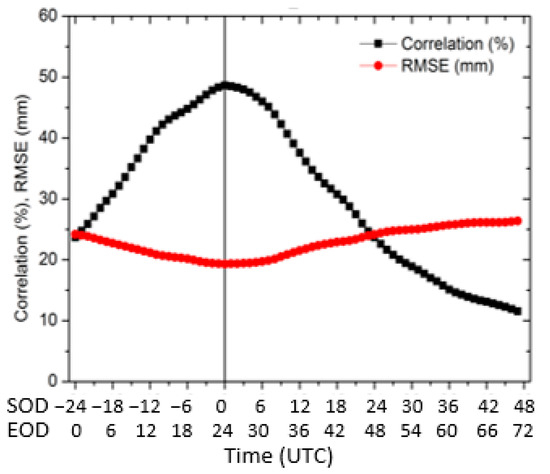
Figure 3.
A sample result of EOD estimation. Seventy-two-hour running r and RMSE computed for the Philippines against CMORPH hourly precipitation data for 1998. The start of the day (SOD), which is 24 h prior to EOD, is shown with a black line (maximum r and minimum RMSE) at x-axis = 0 (EOD = SOD + 24).
For satellite precipitation data and for reanalysis precipitation data, we often use SOD to show the time of observation/forecasts. However, rain-gauge observations are often recorded when the hydro-meteorological service measures precipitation, which is EOD. Hence, we mainly use the word EOD rather than SOD for our analysis. Several earlier studies reported that satellite-based remote sensing products underperform in winter and over cold regions [19,21,22,23,24,25]. Thus, we estimated EOD for summer (JJAS) as well as the whole year.
Following the computation of EOD for each rain-gauge, we selected rain-gauges with a correlation coefficient equal to or greater than 0.4 (r ≥ 0.4) and the number of valid days (data availability) as 270 days to obtain stable EOD information (Figure 4 and Figure 5). The thresholds for the summer are similar to the annual ones, except that the number of valid days is relaxed to 90 days (Figure 4). The r and number of valid days are relaxed to 0.1 and 50 days for the GSOD data (Figure 6).
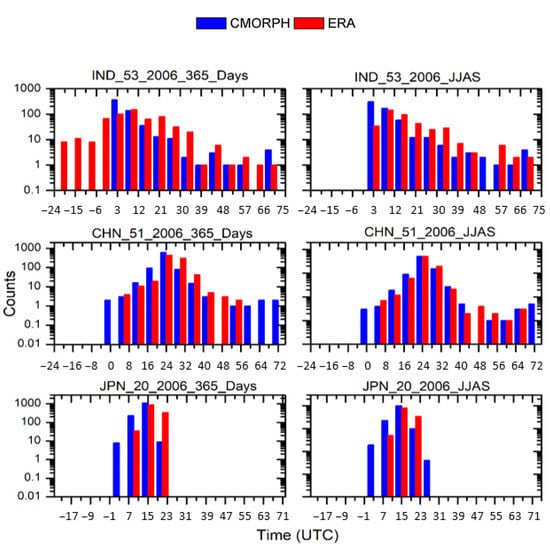
Figure 4.
EOD comparison results as estimated by CMORPH and ERA-Interim data for some selected countries during two different periods (whole year and summer monsoon months JJAS). The country codes IND, CHN, and JPN, represent India, China, and Japan, respectively. Color bars represent number of stations (count) with EOD information estimated by CMORPH and ERA-Interim.
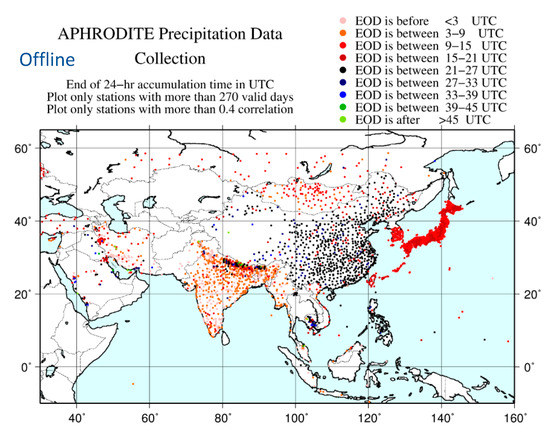
Figure 5.
Spatial distribution of offline rain-gauge data collection for APHRODITE-2 in 2008. The color represents the EOD estimated by CMORPH at each rain-gauge location. The estimated EOD is indexed with different colors. Each color represents a temporal window of EOD estimates. For instance, black represents rain-gauge stations with EOD ≥ 21 and <27 UTC. Similarly, dark blue represents EOD ≥ 27 and <33 UTC.
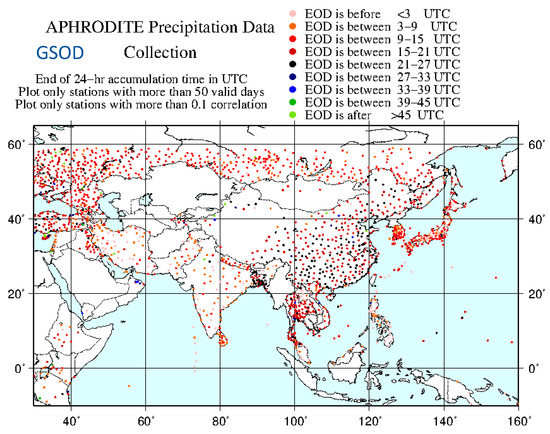
Figure 6.
EOD results obtained for GSOD data with different flags D (four 6-h accumulations), F (two 12-h accumulations), and G (one 24-h accumulation) for 2015. EOD is distinguishable for different flags with different accumulation periods. Each color represents a temporal window of EOD estimates. For instance, black represents rain-gauge stations with EOD ≥ 21 and <27 UTC. Similarly, dark blue represents EOD ≥ 27 and <33 UTC.
The proposed methodology is also applied to estimate EOD information using ERA-Interim data, such that the suitability of ERA-Interim data could be evaluated and hence would be used in the pre-satellite era (before 1979) to determine EOD information. Moreover, it would also be very useful to compare the detection ability of EOD estimates obtained from two kinds of reference datasets, such as CMORPH and ERA-Interim.
3. Results and Discussion
3.1. Evaluation of EOD Estimation Methodology
The EOD detection skills of CMORPH and ERA-Interim with deterministic EOD precipitation during the whole year and the summer, 2006, are shown in Figure 4 for three different countries. We considered offline rain-gauge datasets for three countries, India, China, and Japan, with deterministic (known) EOD 3 UTC, 24 UTC, and 15 UTC for evaluation, respectively. The number of counts showing exact EOD is larger for CMORPH than for ERA-Interim in all 6 panels. Both reference datasets estimate the exact EOD by the maximum number of stations, except for ERA-Interim estimates of India. It is noted that estimated EOD distribution is narrower in Japan than that of the other two countries. The widespread distribution of stations over India and China may have been contributed to by the quality of rain-gauge data or quality issues of satellite-based estimates of precipitation. We will see the distribution of estimated EOD in the next section. The dominant occurrence of convective precipitation in India may have contributed to higher counts by the higher resolution of CMORPH than that of ERA-Interim. Interestingly, CMORPH tends to show more counts in earlier time before the exact (correct) time than that of ERA-Interim, and vice versa. As both datasets perform well over China, the current method can be assumed to better estimate the EOD information over that country. Despite the lower resolution, ERA-Interim notably performs well over Japan. However, overall, CMORPH appears to perform better than ERA-Interim.
Overall, there was no notable difference in the EOD distribution and spatial distribution of stations with deterministic EOD when considering just the summer (JJAS). Over Japan, some stations located in the north of the country are affected by snow, however, EOD estimates of the whole year and that of only JJAS are not different from each other. Impact of snow condition on EOD estimate by CMORPH seems to be small in Japan. In the case of EOD estimates by ERA-Interim, stations with deterministic EOD information are reduced when restricting the time length to JJAS in India. Moreover, the number of stations with abnormal earlier EOD information is decreased in the summer in India. With the current evaluation results, the EOD methodology is applied for offline and GSOD data. The offline and GSOD results by using CMORPH are shown in Section 3.2 and Section 3.3, respectively.
3.2. Offline Data
We selected datasets with the same EOD information, at least at the national domain, for generating gridded product APHRO_V1801R1. Figure 5 shows the spatial distribution of rain-gauge station data showing EOD information at offline stations for the year 2008. The original station datasets are not always the same through the target period for APHRO_V1801R1 (1998–2015, see Appendix A). The color represents the estimated EOD at each rain-gauge location. EOD information shared by rain-gauges appears to be similar at least nationally. However, rain-gauge locations over China and Nepal show different EOD, which highlights that the EOD of datasets does not need to be similar despite being generated for the same country. For instance, countries such as China show the spatial distribution of rain-gauge station with different EOD, namely, most of them are in black (EOD = 24) but there are also many red (EOD = 12) stations. Mixing such data with EOD information differing by more than several hours may degrade the quality of the gridded product, especially for representing extreme events. The daily accumulation timestamps, namely EOD, of most of the Asian countries’ datasets appear to be ≥3 and <27 UTC, but some stations show later value (blue dots, showing EOD ≥ 33 and <39). The spatial consistency in EOD information shared by station data appears to be more consistent over East Asian countries than in West Asian countries.
The EOD estimates obtained with the ERA-Interim dataset were compared with the EOD output derived from CMORPH data (figure not shown). Overall, there was good agreement in terms of spatial homogeneity of EOD information estimated by the two kinds of reference datasets (CMORPH, ERA-Interim) with different temporal/spatial resolutions. Variability of sub-daily precipitation might also be attributed to variation in EOD information.
3.3. GSOD Data
The timestamp information of GSOD daily precipitation data (D, F, and G) generated from sub-daily/daily reports should be crucial for data users when using GSOD data for different research applications. Users may either consider or convert native rain-gauge station data to merge with GSOD data, such that conflicts of data accumulation time can be resolved. The EOD estimation method is applied to GSOD data to reveal the unknown timestamp of daily precipitation data with different flags (D, F, and G) over the Monsoon Asia (MA) region, since EOD information was necessary to make APHRO_MA_V1801R1 as well as APHRO_MA_V1901. Figure 6 shows the EOD distribution of GSOD daily precipitation data accumulated from a combination of different flags for the year 2015. The reason to choose a different year with that of offline data (Figure 5) was 1) 2015 is the latest period that we created the above two products and 2) relatively large number of offline data were assembled for 2008.
For some of the Asian countries, two kinds of timestamp of GSOD data are depicted with EOD information differing by ~12 to 24 h. The difference in daily timestamp for rain-gauge locations is accounted for by the original temporal resolutions (D, F, and G). For instance, GSOD China contains the three flagged data, and number of each flagged input data is different from year to year. It offers two sets of daily precipitation datasets with an EOD difference of 12 h. Segregation of such kinds of flagged data (D, F, and G) according to the nature of the daily accumulation period would help data users to select and combine GSOD data with local data for correct utilization. The EOD information of each dataset (both offline and GSOD) considered for V1801R1 for a specific country is tabulated in the Appendix A.
Comparing Figure 5 and Figure 6, GSOD (Figure 6) has more early EOD data (EOD ≤ 15), which is attributed from the nature of GTS data. It is considered four 6-hourly reports (D) and two 12-hourly reports (F) are summed up according to the day (24-h interval) that NCEI/NOAA stamped at EST/EDT of the United States.
3.4. Impact of EOD on the Evaluation of Extreme Events
Previous sections reveal that EODs are different over China within each dataset (offline and GSOD) and among the datasets as shown in Figure 5 and Figure 6. Thanks to some international collaborations, APHRODITE-2 obtained 12-hourly precipitation data over China. Then we could sum up that precious offline data for both EOD = 12 and EOD = 24. Actually, APHRODITE-1 products (APHRO_V0902, APHRO_V1003, and APHRO_V1101) are generated with such mixed EOD datasets. However, we segregated such input data that differ from other EOD for APHRO_V1801R1. Hence, we evaluated the impact of EOD on the APHRO_V1801R1 gridded precipitation product over certain selected countries in Asia. Qualitative/quantitative assessment of the APHRO_V1801R1 product was performed to check the impact of EOD on extreme events. The precipitation gridded products were generated with unmixed (rain-gauge datasets with EOD = 12) and mixed EOD datasets (EOD with 12, 24, and GSOD data) over China for 2007.
Figure 7a,b shows the difference in the spatial distribution of precipitation events and precipitation fractions computed for events more significant than 50 mm over China. The experimental design is clearly explained in a previous paper [16]. The east of China, which is generally a wet part of the country, shows a significant impact of EOD on the gridded product. The EOD-implemented version of APHRO_V1801R1 gridded product shows larger (red) and smaller (blue) values of precipitation events with intensity greater than 50 mm. The resultant precipitation fraction from events greater than 50 mm is unevenly distributed over China (Figure 7b). As discussed in an earlier section, mixing rain-gauge datasets with a different EOD stamp may underestimate (overestimate) the number of extreme precipitation events in the regions shown in red (blue). Quantitative assessment of EOD impact on APHRO_V1801R1 is evaluated with a total number of events greater than 50 mm recorded over a country. Figure 7c,d illustrates the total number of precipitation events greater than 50 mm over the Philippines, China, and Japan for 2007. Total number of precipitation events is computed with unmixed EOD (YES) datasets and mixed EOD (NO) datasets. Extreme precipitation events estimated from gridded products generated with mixed EOD data are less than the product generated with unmixed (segregated) EOD. Gridded product with mixed EOD datasets such as local data and GSOD data certainly alters the magnitude of actual precipitation events due to the mixing of datasets with differentiable EOD. The massive difference in the number of events greater than 50 mm may be attributed to contamination of the actual precipitation by the previous day’s precipitation while averaging and/or interpolating across all precipitation stations available over a grid pixel.
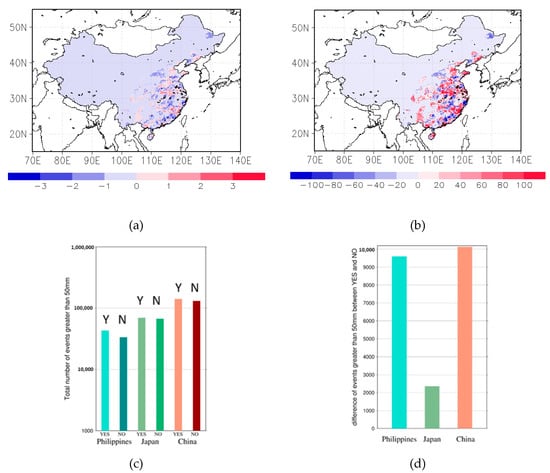
Figure 7.
The qualitative/quantitative assessment of EOD impact on APHRO_V1801R1 product in 2007. (a) The difference in the total number of precipitation events greater than 50 mm, with unmixed EOD and mixed EOD datasets. (b) Difference in mean precipitation magnitude of events greater than 50 mm with unmixed EOD and mixed EOD datasets. (c) Spatial summation of precipitation events greater than 50 mm with unmixed EOD (YES, Y) and mixed EOD (NO, N) datasets over the three selected countries. (d) The difference in the number of precipitation events greater than 50 mm with unmixed EOD (YES) and mixed EOD (NO) over the three selected countries.
4. Summary
This paper proposes a novel approach to judge the end of the day (EOD) timestamp for rain-gauge datasets across the globe with the help of satellite-based precipitation estimates and reanalysis of datasets. Bias-corrected CMORPH V1.0 precipitation data were used for the current approach. The scope of ERA-Interim data was validated to judge EOD as estimated by CMORPH, such that it would be useful to determine the EOD of rain-gauge data obtained during the pre-satellite era. The current methodology was applied to rain-gauge station datasets (1998–2015) collected from various countries by APHRODITE projects. The present method was evaluated for certain selected countries with known EOD (deterministic). Based on the evaluation results, it was concluded that CMORPH works better to judge the approximate EOD of rain-gauge stations over India. Although ERA-Interim has coarser temporal/spatial resolution than that of CMORPH, it estimates almost similar EOD distribution with that of CMORPH. To retain the nature of GSOD flagged daily precipitation data, the proposed method was also implemented for GSOD data. The methodology adopted in this study should be very helpful to judge EOD information of rain-gauge data with unknown EOD information. Having EOD information would be beneficial for users of rain-gauge data to avoid any ambiguity regarding timestamps.
Concerning the EOD judgment results, the estimated EOD for offline datasets over most of Asia appeared to be around ≥3 and <27 (e.g., India (3 UTC), China (12, 24 UTC), and Japan (15 UTC)). EOD information of GSOD data reflected the effect of the combination of rain-gauge data with different accumulation periods, but generally, EOD of GSOD is the same or earlier than that of offline. The impact of EOD on APHRODITE gridded product was evaluated qualitatively/quantitatively over three selected countries. The spatial distribution of extreme events and precipitation fraction revealed a significant impact of EOD on the gridded product. Based on a test for China, the number of extreme events obtained with unmixed EOD was shown to be much higher than the extreme events captured with mixed EOD.
Author Contributions
Conceptualization, A.Y. and P.X.; methodology, A.Y.; software, S.K., M.M.(Minami Masuda) and A.Y.; validation, S.K., M.M.(Mio Maeda) and A.Y.; formal analysis, A.Y., S.K. and M.M. (Minami Masuda); investigation, A.Y. and S.K.; resources, A.Y.; data curation, M.M.(Mio Maeda); writing—original draft preparation, S.K. and A.Y.; writing—review and editing, A.Y., M.M.(Mio Maeda) and S.K.; visualization, M.M.(Minami Masuda), S.K. and A.Y.; supervision, A.Y. and P.X.; project administration, A.Y.; funding acquisition, A.Y. All authors have read and agreed to the published version of the manuscript.
Funding
This research was supported by the Environment Research and Technology Development Fund (2-1602) of the Environmental Restoration and Conservation Agency (ERCA), Japan. Part of this work was supported by Hirosaki University Institutional Fund, Bilateral programs with Turkey by Japan Society for Promotion of Science (JSPS), Sakura Science program by Japan Science and Technology Agency (JST).
Acknowledgments
The authors are grateful to data providers of GSOD and ERA-Interim for making such data available to carry out the present study. The authors are also grateful to the rain-gauge data providers for sharing their original station data with APHRODITE. The authors thank Edanz (https://en-author-services.edanzgroup.com) for editing the English text of a draft of this manuscript.
Conflicts of Interest
The authors declare no conflict of interest.
Appendix A
List of country-wise datasets and corresponding data sources with EOD information. Datasets with black circles are considered for APHRO_V1801R1. D, F, and G are SOD data flags of GSOD data. D, four reports of 6-hourly precipitation; F, two reports of 12-hourly precipitation; and G, one report of 24-hourly precipitation. d, deterministic EOD; e, EOD estimated by CMORPH_V1.0.
| Country Name | Source | Flag of GSOD | d/e | EOD | V1801 Target | Period |
| China | Offline | - | d | 12 | ● | 1998–2007 |
| Offline | - | d | 24 | ● | 2008–2015 | |
| Japan | Offline | - | d | 15 | ● | 1998–2015 |
| GSOD | D | e | 10 | × | - | |
| GSOD | G | e | 0 | × | - | |
| Korea | Offline | - | e | 14 | ● | 1998–2015 |
| N. Korea | GSOD | F | e | 10 | ● | 1998–2015 |
| GSOD | G | e | 0 | × | - | |
| Macao | GSOD | D | - | - | ● | 1998 |
| GSOD | F | e | 13 | ● | 1999–2016 | |
| GSOD | G | e | 3 | × | - | |
| Mongolia | Offline | - | d | 12 | ● | 1998–2015 |
| Taiwan | Offline | - | e | 18 | × | - |
| Offline | - | e | 15 | ● | 1998–2006 | |
| Offline | - | - | - | ● | 2007–2015 | |
| Brunei | GSOD | G | e | 2 | ● | 1998–2015 |
| Cambodia | Offline | - | e | 17 | ● | 1998–1999 |
| Offline | - | e | 24 | ● | 2000–2013 | |
| GSOD | G | e | 10 | ● | 2014–2015 | |
| Indonesia | Offline | - | e | 0 | ● | 1998–2004 |
| Offline | - | e | 0 | × | - | |
| GSOD | F | e | 10 | × | - | |
| GSOD | D | e | 21 | ● | 2005–2015 | |
| Laos | Offline | - | e | 24 | ● | 1998–2003 |
| GSOD | D | e | 5 | × | - | |
| GSOD | G | e | 0 | ● | 2004–2015 | |
| Malaysia | Offline | - | e | 24 | ● | 1998–2003 |
| Offline | - | e | 24 | × | - | |
| Offline | - | e | 0 | ● | 2004–2014 | |
| GSOD | G | e | 0 | ● | 2004–2015 | |
| Myanmar | Offline | - | e | 2 | ● | 1998–2014 |
| GSOD | G | e | 24 | × | - | |
| Philippines | Offline | - | e | 24 | ● | 1998–2015 |
| GSOD | D | e | −4 | × | - | |
| GSOD | G | e | −24 | × | - | |
| Singapore | Offline | - | - | - | ● | 1998–2002 |
| GSOD | G | e | 3 | ● | 2003–2015 | |
| Thailand | Offline | - | e | 24 | ● | 1998–2015 |
| GSOD | G | e | 18 | ● | 2008–2009 | |
| Vietnam | Offline | - | e | 12 | ● | 1998–2006 |
| Offline | - | e | 12 | × | - | |
| GSOD | G | e | 12 | ● | 2007–2015 | |
| Afghanistan | GSOD | G | e | 4 | ● | 1998–2015 |
| Bangladesh | Offline | - | e | 0 | × | - |
| Offline | - | e | 24 | ● | 1998–2007 | |
| Offline | - | e | 24 | × | - | |
| Offline | - | e | 3 | ● | 2008–2015 | |
| GSOD | G | e | 18 | × | - | |
| Bhutan | Offline | - | e | 4 | ● | 1998–2015 |
| India | Offline | - | d | 3 | ● | 1998–2015 |
| Offline | - | d | 3 | × | - | |
| GSOD | G | e | 0 | × | - | |
| Maldives | GSOD | D | - | - | ● | 2002 |
| GSOD | G | e | 0 | ● | 1998–2015 | |
| Nepal | Offline | - | d | 3 | ● | 1998–2015 |
| Offline | - | e | 0 | × | - | |
| Offline | - | e | 3 | × | - | |
| Pakistan | Offline | - | e | 0 | ● | 1998–2007 |
| Offline | - | e | 4 | × | - | |
| GSOD | D | e | 0 | × | - | |
| GSOD | F | e | 11 | × | - | |
| GSOD | G | e | 2 | ● | 2008–2015 | |
| Sri Lanka | Offline | - | e | 24 | ● | 1998–2004 |
| GSOD | G | e | 8 | ● | 2005–2015 |
References
- Kim, I.-W.; Oh, J.; Woo, S.; Kripalani, R.H. Evaluation of rainfall extreme over the Asian domain: Observation and modeling studies. Clim. Dyn. 2019, 52, 1317–1342. [Google Scholar] [CrossRef]
- Kidd, C.; Levizzani, V. Status of satellite rainfall retrievals. Hydrol. Earth Syst. Sci. 2011, 15, 1109–1116. [Google Scholar] [CrossRef]
- Mikaelidis, S. Rainfall: Advances in Measurement, Estimation, and Prediction; Springer: Berlin/Heidelberg, Germany, 2008; 540p. [Google Scholar]
- Chen, M.; Xie, P.; Janowiak, J.E.; Arkin, P.A. Global Land Rainfall: A 50-yr Monthly Analysis Based on Gauge Observations. J. Hydrometeorol. 2002, 3, 249–266. [Google Scholar] [CrossRef]
- Wang, S.; Huang, G.H.; Lin, Q.G.; Li, Z.; Zhang, H.; Fan, Y.R. Comparison of interpolation methods for estimating the spatial distribution of rainfall in Ontario, Canada. Int. J. Climatol. 2014, 34, 3745–3751. [Google Scholar] [CrossRef]
- Yatagai, A.; Kamiguchi, K.; Arakawa, O.; Hamada, A.; Yasutomi, N.; Kitoh, A. APHRODITE: Constructing a Long-Term Daily Gridded Rainfall Dataset for Asia Based on a Dense Network of Rain Gauges. Bull. Am. Meteorol. Soc. 2012, 93, 1401–1415. [Google Scholar] [CrossRef]
- Yasutomi, N.; Hamada, A.; Yatagai, A. Development of a long-term daily gridded temperature dataset and its application to rain/snow discrimination of daily rainfall. Global Environ. Res. 2011, 15, 165–172. [Google Scholar]
- Donat, M.G.; Alexander, L.V.; Yang, H.; Durre, I.; Vose, R.; Caesar, J. Global Land-Based Datasets for Monitoring Climatic Extremes. Bull. Am. Meteorol. Soc. 2013, 94, 997–1006. [Google Scholar] [CrossRef]
- Harris, I.; Jones, P.D.; Osborn, T.J.; Lister, D.H. Updated high-resolution grids of monthly climatic observations—The CRU TS3.10 Dataset. Int. J. Climatol. 2014, 34, 623–642. [Google Scholar] [CrossRef]
- Lawrimore, J.H.; Menne, M.J.; Gleason, B.E.; Williams, C.N.; Wuertz, D.B.; Vose, R.S.; Rennie, J. An overview of the Global Historical Climatology Network monthly mean temperature data set, version 3. J. Geophys. Res. Atmos. 2011, 116. [Google Scholar] [CrossRef]
- Schneider, U.; Becker, A.; Finger, P.; Meyer-Christoffer, A.; Ziese, M.; Rudolf, B. GPCC’s new land surface rainfall climatology based on quality-controlled in situ data and its role in quantifying the global water cycle. Theor. Appl. Climatol. 2014, 115, 15–40. [Google Scholar] [CrossRef]
- Steefan Contractor, S.; Alexander, L.V.; Donat, M.G.; Nicholas, H. How well do gridded datasets of observed daily rainfall compare over Australia. Adv. Meteorol. 2015. [Google Scholar] [CrossRef]
- Menne, M.J.; Durre, I.; Vose, R.S.; Gleason, B.E.; Houston, T.G. An overview of the Global Historical Climatology Network-Daily Database. J. Atmos. Ocean. Technol. 2012, 29, 897–910. [Google Scholar] [CrossRef]
- Abatzoglou, J.T. Development of gridded surface meteorological data for ecological applications and modelling. Int. J. Climatol. 2013, 33, 121–131. [Google Scholar] [CrossRef]
- Xie, P.; Chen, M.; Yang, S.; Yatagai, A.; Hayasaka, T.; Fukushima, Y.; Liu, C. A Gauge-Based Analysis of Daily Rainfall over East Asia. J. Hydrometeorol. 2007, 8, 607–626. [Google Scholar] [CrossRef]
- Yatagai, A.; Maeda, M.; Masuda, M.; Suetou, N.; Yasutomi, N.; Khadgarai, S. Asian Precipitation—Highly-Resolved Observational Data Integration Towards Evaluation of Extreme Events (APHRODITE-2). IPSJ Tohoku Branch SIG Technical Report. 2019. 2018-9-A2-2. Available online: http://www.topic.ad.jp/ipsj-tohoku/lib/exe/fetch.php?media=report:20180221-a2-2.pdf (accessed on 21 June 2020).
- Hamada, A.; Arakawa, O.; Yatagai, A. An automated quality control method for daily rain-gauge data. Glob. Environ. Res. 2011, 15, 183–192. [Google Scholar]
- Joyce, R.J.; Janowiak, J.E.; Arkin, P.A.; Xie, P. CMORPH: A Method that Produces Global Rainfall Estimates from Passive Microwave and Infrared Data at High Spatial and Temporal Resolution. J. Hydrometeorol. 2004, 5, 487–503. [Google Scholar] [CrossRef]
- Xie, P.; Joyce, R.; Wu, S.; Yoo, S.-H.; Yarosh, Y.; Sun, F.; Lin, R. Reprocessed, Bias-Corrected CMORPH Global High-Resolution Rainfall Estimates from 1998. J. Hydrometeorol. 2017, 18, 1617–1641. [Google Scholar] [CrossRef]
- Dee, D.P.; Uppala, S.M.; Simmons, A.J.; Berrisford, P.; Poli, P.; Kobayashi, S.; Andrae, U.; Balmaseda, M.A.; Balsamo, G.; Bauer, P.; et al. The ERA-Interim reanalysis: Configuration and performance of the data assimilation system. Q. J. R. Meteorol. Soc. 2011, 137, 553–597. [Google Scholar] [CrossRef]
- Tian, Y.; Peters-Lidard, C.D.; Eylander, J.B.; Joyce, R.J.; Huffman, G.J.; Adler, R.F.; Hsu, K.; Turk, F.J.; Garcia, M.; Zeng, J. Component analysis of errors in satellite-based rainfall estimates. J. Geophys. Res. Atmos. 2009, 114. [Google Scholar] [CrossRef]
- Xie, P.; Joyce, R.J. Integrating Information from Satellite Observations and Numerical Models for Improved Global Precipitation Analyses. In Remote Sensing of the Terrestrial Water Cycle; Lakshmi, V., Alsdorf, D., Anderson, M., Biancamaria, S., Cosh, M., Entin, J., Huffman, G., Kustas, W., van Oevelen, P., Painter, T., et al., Eds.; American Geophysical Union: Washington, DC, USA, 2014. [Google Scholar] [CrossRef]
- Sunilkumar, K.; NarayanaRao, T.; Saikranthi, K.; Purnachandra Rao, M. Comprehensive evaluation of multi-satellite rainfall estimates over India using gridded rainfall data. J. Geophys. Res. Atmos. 2015, 120. [Google Scholar] [CrossRef]
- Sunilkumar, K.; NarayanaRao, T.; Satheeshkumar, S. Assessment of small-scale variability of rainfall and multi-satellite rainfall estimates using measurements from a dense rain gauge network in Southeast India. Hydrol. Earth Syst. Sci. 2016, 20, 1719–1735. [Google Scholar] [CrossRef]
- Sunilkumar, K.; Yatagai, A.; Masuda, M. Preliminary evaluation of GPM-IMERG rainfall estimates over three distinct climate zones with APHRODITE. Earth Space Sci. 2019, 6, 1321–1335. [Google Scholar] [CrossRef]
© 2020 by the authors. Licensee MDPI, Basel, Switzerland. This article is an open access article distributed under the terms and conditions of the Creative Commons Attribution (CC BY) license (http://creativecommons.org/licenses/by/4.0/).