Article

Detection of Aerosol Particles from Siberian Biomass Burning over the Western North Pacific

1
Graduate School of Science, Tokyo University of Science, Tokyo 162-8601, Japan
2
Japan Agency for Marine-Earth Science and Technology, Yokohama 236-0001, Japan
3
Meteorological Research Institute, Tsukuba 305-0052, Japan
4
Graduate School of Integrated Sciences for Life, Hiroshima University, Higashi-Hiroshima 739-8521, Japan
5
National Institute for Environmental Studies, Tsukuba 305-8506, Japan
6
Faculty of Science Division I, Tokyo University of Science, Tokyo 162-8601, Japan
*
Author to whom correspondence should be addressed.
Atmosphere 2020, 11(11), 1175; https://doi.org/10.3390/atmos11111175
Submission received: 30 September 2020 / Revised: 26 October 2020 / Accepted: 27 October 2020 / Published: 30 October 2020
(This article belongs to the Special Issue Carbonaceous Aerosol)

Abstract

:
Carbonaceous aerosol particles emitted from biomass burning (BB) have a large impact on the global climate. In particular, tarball particles (TBs), which are spherical organic aerosol particles, account for a large proportion of aerosol particles from BB. In this study, we collected aerosol particles over the western North Pacific and analyzed them using transmission electron microscopy with energy-dispersive X-ray spectroscopy (TEM-EDX) to reveal their shape and composition. We detected TBs and organic carbon particles originating from Siberian forest fires. To the best of our knowledge, this is the first case in which a large number of TBs have been found over the Pacific Ocean far from the BB source. The spherical shapes of the TBs were maintained even after long-range transport. In addition, our individual analysis of TBs showed that the size and composition of TBs differ depending on the air mass origin. The occurrence and microphysical properties of TBs are important to accurately evaluate the impact of TBs on climate. Our results imply that TBs can be transported to the Arctic and have an influence on radiative forcing over the ocean and in the Arctic.

1. Introduction

Biomass burning (BB) emits large amounts of various aerosols and gases and has a significant impact on the global climate. Carbonaceous aerosol emissions from BB, e.g., black carbon and organic carbon, significantly contribute to the atmospheric aerosol burden on a global scale [1]. Recently, emissions from BB have been increasing globally due to anthropogenic climate change [2]. The estimation of radiative forcing from BB-derived aerosol particles has a large uncertainty, partially because of the difficulty in evaluating the balance between the positive forcing by light-absorbing aerosols (e.g., black and brown carbon) and the negative forcing by light-scattering and hygroscopic aerosols [3].
Studies have reported that the occurrence of spherical organic particles refers to tarball particles (TBs) in BB smoke [4,5,6,7,8,9]. Sedlacek et al. [8] reported that TBs contributed to approximately 30% of the BB aerosol mass, indicating that TBs are one of the most abundant particles in BB smoke. Hand et al. [5] and Chakrabarty et al. [10] showed that TBs are brown carbon and absorb sunlight at UV and short-visible wavelengths. Chung et al. [11] suggested that brown carbon globally contributes −20% of the aerosol absorption. On the other hand, Sedlacek et al. [8] suggested that there are significant uncertainties associated with the optical properties of TBs and their optical properties dependent on their fuel source, formation mechanism, and aging. In addition, various values of TBs hygroscopicity have been reported ([4,5]). When TBs are coated with hygroscopic substances such as sulfate, they act as cloud condensation nuclei and can be removed from the atmosphere. Although TBs could make a significant contribution to the global climate, little is known about them. Thus, it is important to quantitatively understand the physical and chemical properties, lifetime, and removal process of TBs from both the BB source area and downwind regions.
In this study, we detected and observed the shape and composition of aerosol particles from Siberian forest fires in samples collected over the western North Pacific, which is commonly affected by air masses originating from Siberian forest fires during summer [12]. They were analyzed using energy-dispersive X-ray spectroscopy with transmission electron microscopy (TEM-EDX). To the best of our knowledge, this is the first time that a large number of TBs have been observed over the Pacific Ocean far from the BB source. Air masses originating from Siberian forest fires and carried over the North Pacific Ocean are important sources of Arctic haze [13]. Light-absorbing particles from the BB are a cause of warming in the Arctic [14] and can accelerate the melting of snow [15]. Thus, the aerosol particles collected in this study have a potential impact on the Arctic climate, and understanding their properties is important in clarifying the climate impacts of BB particles in the Arctic.
This study aims to analyze the occurrence of TBs that were found over the western North Pacific during a research cruise for implications on their climate impacts.

2. Materials and Analysis

2.1. Observations and Sampling

Aerosol sampling for individual particle analysis was conducted onboard the R/V MIRAI during the MR-16-06 cruise over the western North Pacific Ocean at 58.04° N and 179.28° E (no. 1; 26 September 2016 1:12–1:20), 49.13° N and 164.64° E (no. 2; 28 September 2016 23:16–23:27), and 46.05° N and 159.32° E (no. 3; 29 September 2016 23:19–23:30) [16]. Sampling for TEM-EDX analysis was conducted on the upper deck (18 m above sea level (m a.s.l.)) and upwind of the vessel exhaust using a three-stage cascade impactor. The impactor sampler collects particles passing through a nozzle on a collection plate by inertial force and has been used in a previous campaign [17]. The 50% aerodynamic diameter cutoffs of the impactor were 0.25 µm, 1.0 µm, and 4.0 µm with a volumetric flow of 1 L/min. The sampling time was approximately 10 min. Carbon-coated nitrocellulose (collodion) films supported on copper grids were used for the collection substrates. Furthermore, a high-volume air sampler (SIBATA Inc., HV-700F) collected aerosol particles with diameters of less than 2.5 μm (PM2.5) on the filters to measure the concentration of levoglucosan and water-soluble ion components. The sampling of PM2.5 was performed every 1–2 days. These samplings were performed only when there was no contamination from the vessel itself, based on the particle number concentration and the wind direction, which were measured continuously on the vessel.
During the cruise, we continuously measured ambient particles and gases using several instruments. The details are described in [16,18]. Briefly, refractory black carbon (BC) mass concentrations were measured using a single-particle soot photometer (SP2; Droplet Measurement Technologies, model D) with a laser-induced incandescence technique. The sample air was introduced from the upper deck and dried prior to sampling to a relative humidity of less than 30% at room temperature.

2.2. TEM Analysis

We analyzed samples collected at the lowest impactor stage (50% diameter cutoff: 0.25 µm) using TEM-EDX (TEM: JEM-1400, JEOL; EDX: Oxford X-MAX-80, Oxford Instruments) to acquire particle images and compositions. An acceleration voltage of 120 kV and an acquisition time of 10 sec were used for the semiquantitative composition measurements using EDX software (INCA Energy version 5.02, Oxford Instruments, Tokyo, Japan). Element compositions were normalized to 100% among the selected elements (C, N, O, Na, Mg, Al, Si, P, S, Cl, K, Ca, Ti, Mn, Fe, and Zn). We classified the particles as C-rich, sea salt, modified sea salt, sulfate, potassium salt, sea salt + mineral, modified sea salt + mineral, sulfate + mineral, potassium salt + mineral, mineral, and other using the criteria in [16].

3. Results and Discussion

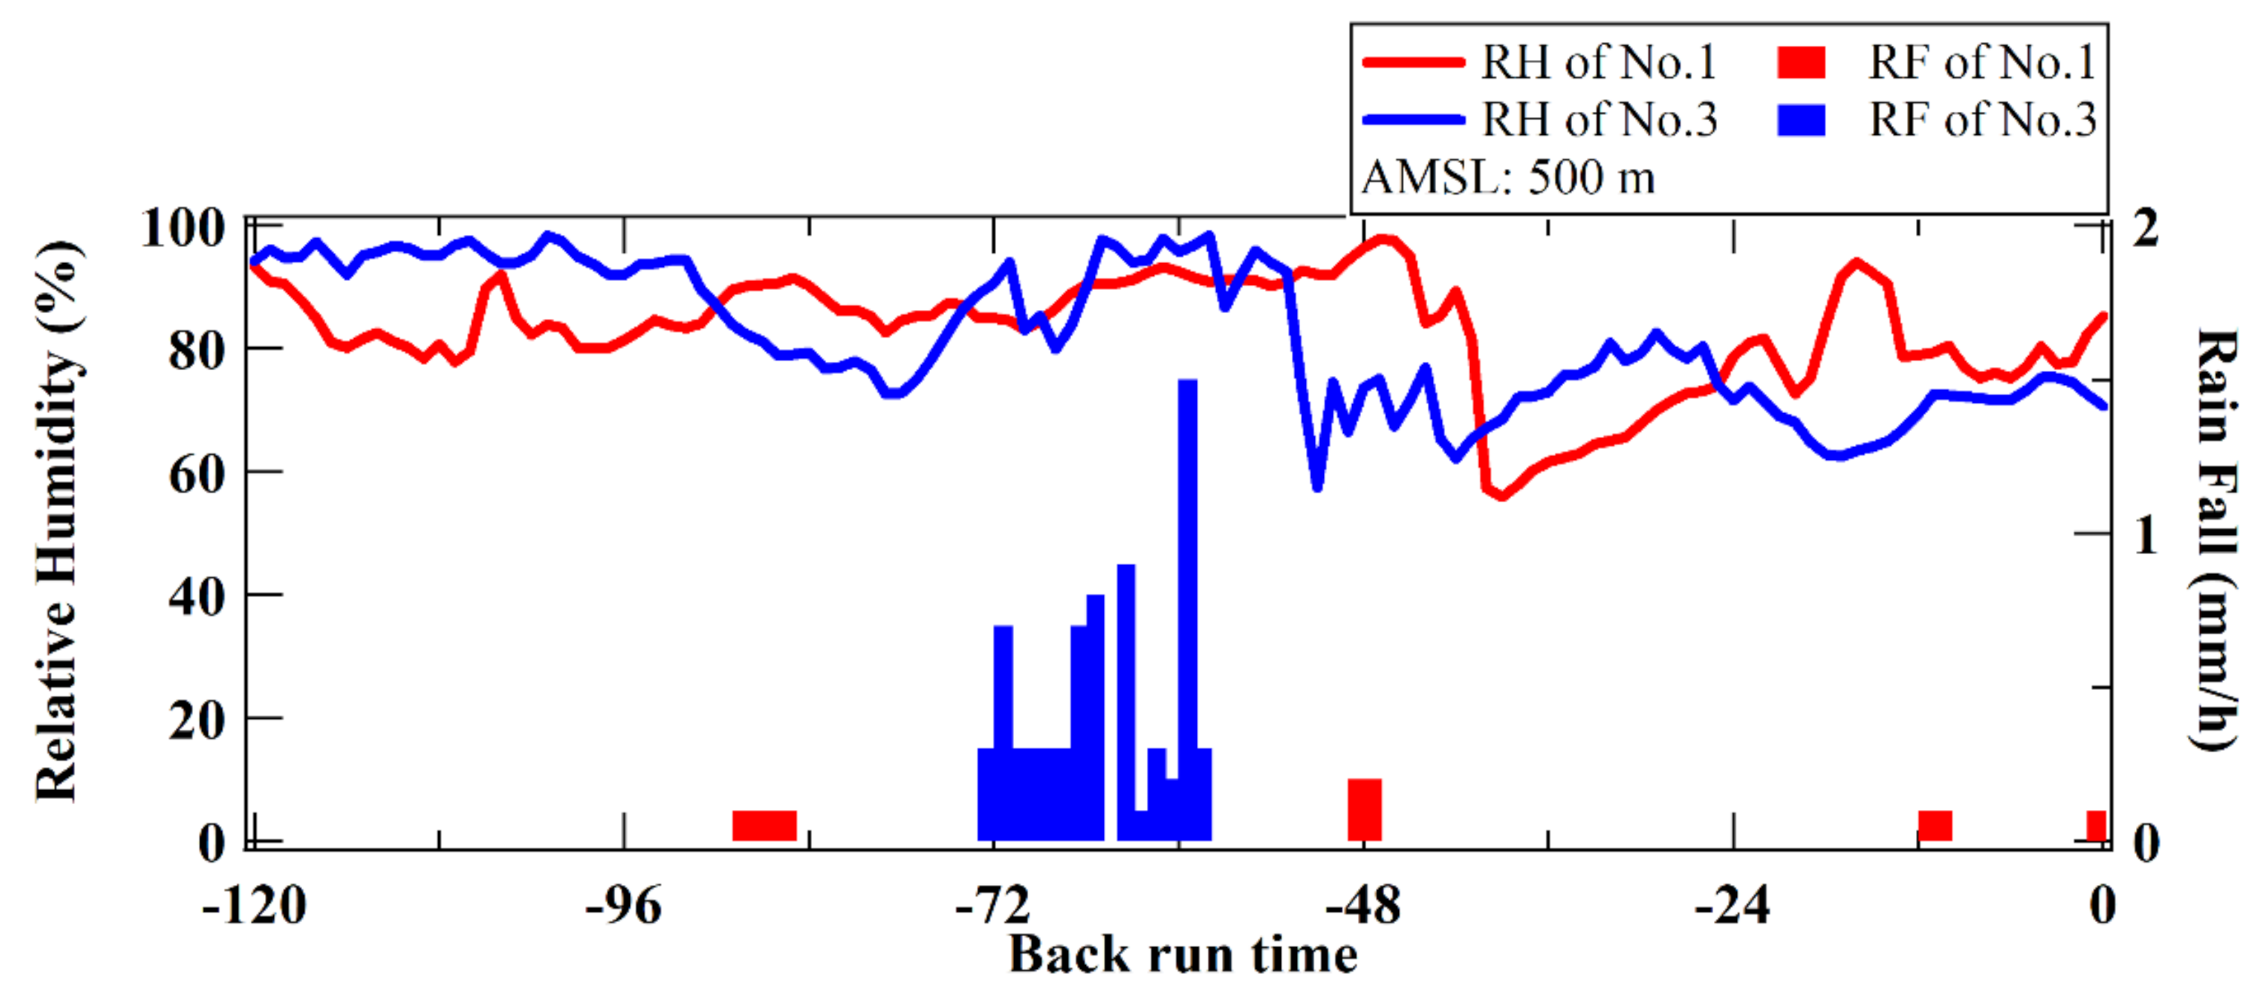
3.1. Estimates of the Origins of Air Masses during Sampling for TEM-EDX Analysis

Figure 1 shows five-day backward trajectories starting from 500 m a.s.l. at the sampling points calculated using the NOAA HYSPLIT model [19,20,21]. In addition, we show the BB locations using the accumulated fire maps from MODIS [22] for the backward trajectory period. Figure 1 shows that air masses nos. 1 and 3 originated from Siberia, where heavy BB occurred around Lake Baikal (sample nos. 1 and 3) and the Lena River (sample no. 1). The results indicate that air masses nos. 1 and 3 were affected by Siberian BB. In contrast, air mass no. 2 originated from the western North Pacific.
The mass concentrations of BC and levoglucosan were measured during the TEM sampling (Figure 2). BC is mainly emitted from both fossil fuel combustion and BB [1]. Levoglucosan (1,6-anhydro-β-D-glucose) is mainly emitted from BB [23] and accounts for 15–30% of the organic aerosols from wood burning [24]. In our study, BC mass concentrations increased during the sampling periods for nos. 1 and 3. The mass concentrations of BC and levoglucosan were approximately 200 ng/m3 and 70–80 ng/m3, respectively, during the sampling periods for nos. 1 and 3. These results suggest that sample nos. 1 and 3 include an air mass from BB. On the other hand, during the sampling for no. 2, almost no BC was observed, although the concentration of levoglucosan was high. The increase is possibly due to an influence of the BB plume arrived during the sampling for no. 3. Air mass no. 2 originated from the western North Pacific (Figure 1) with no BC source, consistent with the BC measurement.

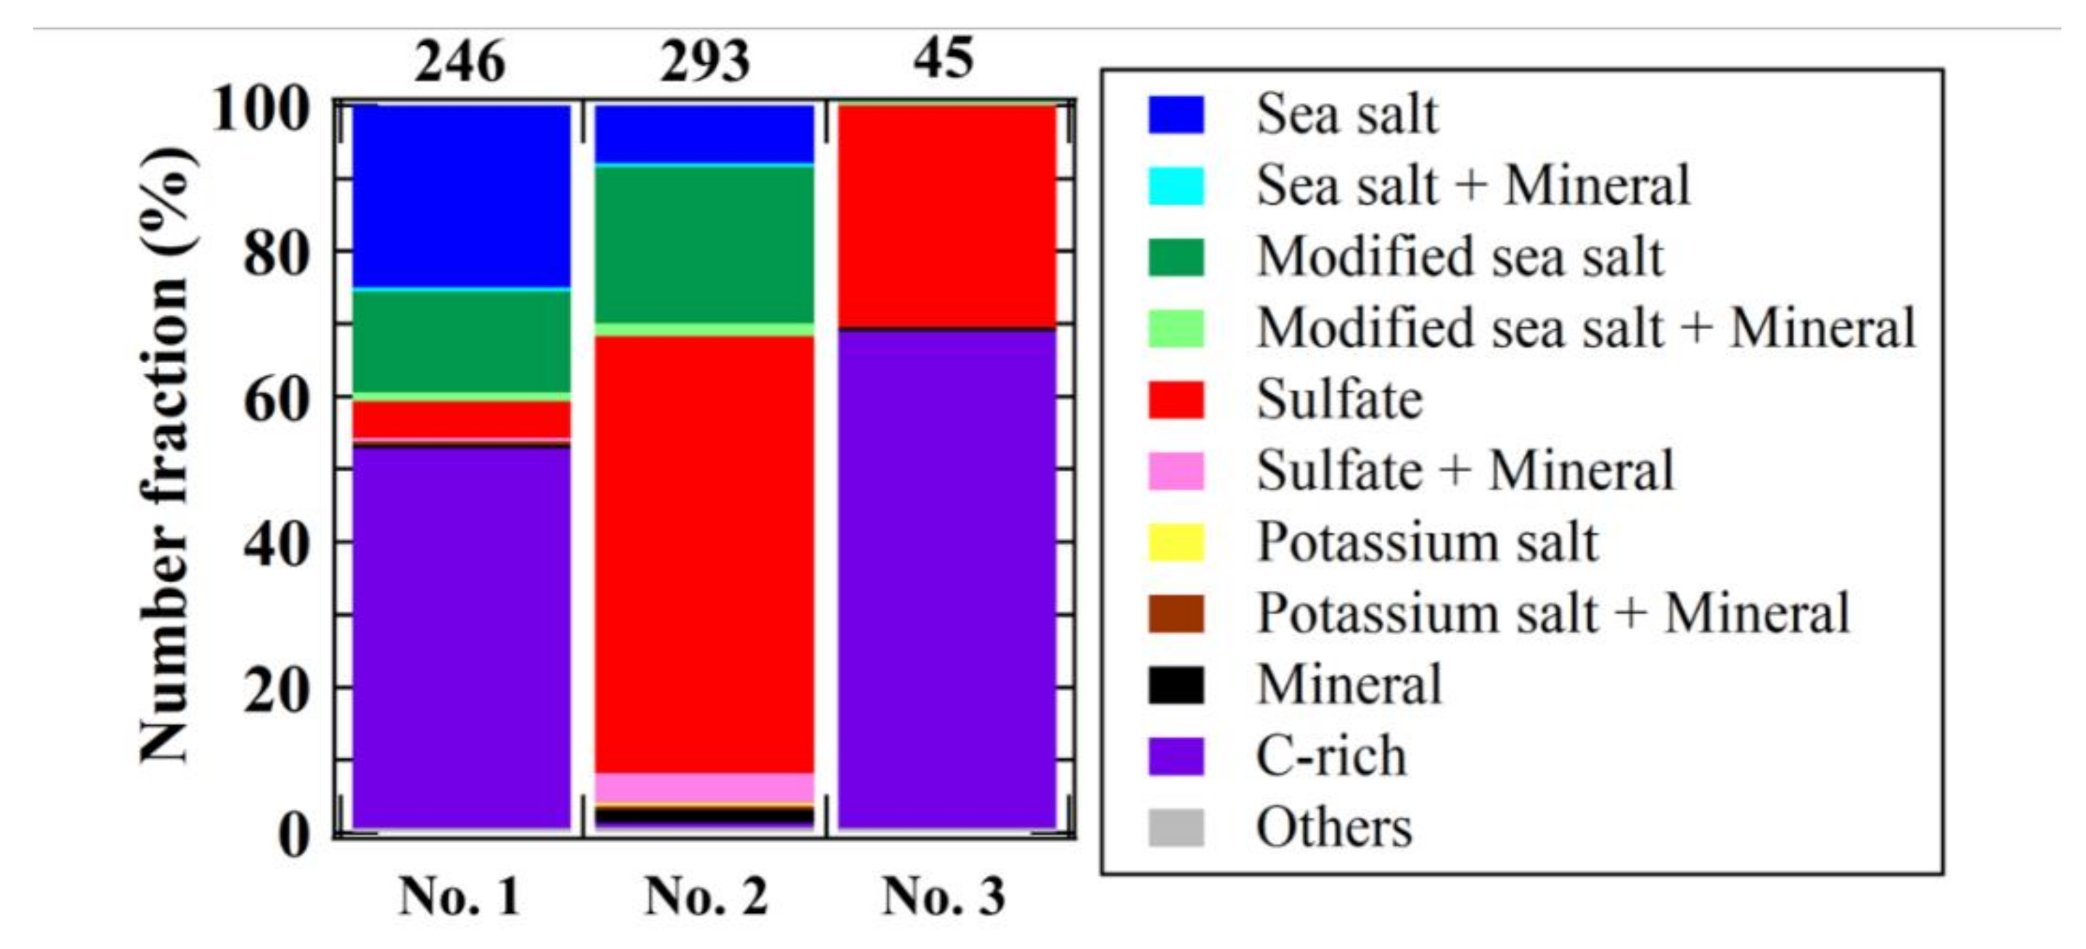
3.2. Individual Particle Analyses

The particle classification is shown in Figure 3. C-rich particles accounted for more than 50% of nos. 1 and 3. The number fractions of particles containing greater than 1 wt.% potassium (K) were 80%, 39%, and 93% for samples nos. 1, 2, and 3, respectively. As organic matter and K are major BB aerosol components [4,25], these TEM-EDX results also indicate that nos. 1 and 3 were affected by BB. No. 2 was dominated by sulfates and sea-salt particles, indicating that air masses corresponding to no. 2 were affected by marine sources and anthropogenic sources containing acidic substances originating from Japan.
The TEM images showed many round C-rich particles in samples nos. 1 and 3 (Figure 4). For reference, the TEM image of sample no. 2 is shown in supplement (Figure S1). These round particles created either black or gray contrasts in the images. The black, round particles were spheres on the substrate, indicating that they did not deform when collected (Figure 4). On the other hand, the gray round particles were flattened on the substrate, suggesting that they were deformed and spread over the substrate when collected. The former particles were TBs, and the latter particles were non-TB organic particles [9]. In this study, we identified TBs from C-rich particles based on their spherical shape, elemental composition (e.g., carbon and nitrogen), amorphous nanostructure, and resistance to the electron beam, followed by the criteria in [4]. The TB number fractions within C-rich particles was 61% in sample no. 3, higher than that in no. 1 (28%). On-line particle number concentrations measured by a scanning mobility particle sizer (SMPS) also showed that the concentrations of particles with diameters of 100–400 nm were higher during the sampling period for no. 3 than during that for no. 1 (Text S1 and Figure S2). The size range includes the average diameter of the TBs (200–300 nm). Both the TEM and SMPS results indicated that the concentrations of TBs in the atmosphere were higher in the air mass at sampling no. 3 than in that at sampling no. 1.

3.3. Morphological and Elemental Characteristics of the TBs

The TBs were spherical without apparent sulfate coatings, and some were aggregated with two to several tens of TBs (Figure 4b). The spherical shapes were the same as those in fresh samples (e.g., [9]), although the current samples were transported for several thousand kilometers. This result suggests that TBs were transported without being coated with hygroscopic substances and were less likely to be removed by precipitation. Figure 5 shows the relative humidity and rain fall on the backward trajectories of samples nos. 1 and 3 (500 m a.s.l.). High humidity continued during the transport and air masses of both nos. 1 and 3 experienced precipitation. It is possible that some hygroscopic substances had been removed by precipitation before they condensed on TBs. As BB in Siberia is one of the important sources of aerosols in the Arctic (e.g., [26,27]), our findings provide an example of BB aerosol particles transported for a long distance, potentially to the Arctic.
Aggregates of TBs have been observed in BB source areas (e.g., [7,8,10]). Our study also showed, for the first time, that TB aggregates in a remote area. Girotto et al. [7] suggested that TB aggregates might have a single scattering albedo higher than that of individual TBs. Thus, their aggregate shapes can influence TB optical properties. The TB equivalent-circle diameter (ECD) of no. 3 (median diameter: 0.41 μm) was larger than that of no. 1 (median diameter: 0.29 μm) (Figure 6a). The difference in their sizes could be a result of an increase in aggregated TBs, which are counted as single particles, in sample no. 3 than in sample no. 1. In addition, the air mass collected for no. 1 was affected by the fires around the Lena River, and the difference in particle size may be influenced by this origin.
We calculated the relative mass ratios of N and S over K in TBs (Figure 6b,c). K is a conserved tracer and is neither lost nor added during aging, whereas volatile organic carbon can be lost after sampling and can not be measured using TEM-EDX [9]. As a result, the ratios do not change for non-volatile components. The selected elements were reported as TB constituents in previous studies [4,5,6,9]. Compared with No.1 and No.3, TBs in No.3 contained more N/K and S/K than those in No.1, although they have similar ambient atmospheric concentrations of SO42− and NO3 and trace gases (ΔCH4/ΔCO2, ΔCH4/ΔCO, and ΔCO/ΔCO2) (Figures S3 and S4 and Text S2). The differences in composition suggested that nos. 1 and 3 might have different BB sources. Some studies also detected Cl in TB [4,9], and others did not [6]. Our study did not detect Cl in TBs, and further study needs to understand how TBs take in Cl when emitted and how TBs release Cl during the aging process.

4. Summary

We found TBs over the western North Pacific for the first time. TBs have the potential to have a significant impact on the global climate through absorbing light and acting as cloud condensation nuclei depending on their modification during transport. However, there is little information about their impact.
Our results indicate that the TBs could originate from Siberian forest fires and were transported for a long distance. The TBs maintained their spherical shapes and were not coated by hygroscopic substances. Thus, they would not be easily removed by precipitation and could be transported to the Arctic, contributing to climate change in the Arctic area.
The TBs sizes, either as individual particles or aggregated, and compositions were different between the two samples that contained TBs. Our results imply that the diversity of TB microphysical properties can influence the estimations of TB climate impacts. Therefore, individual-particle analysis measuring microphysical properties such as size and composition is important. Our study highlights the microphysical properties of aged TBs originating from Siberian forest fires. Given the global increase in emissions from BB due to anthropogenic climate change, the findings will be useful for accurate estimations of their transport processes and climate impacts.

Supplementary Materials

The following are available online at https://www.mdpi.com/2073-4433/11/11/1175/s1: Figure S1, TEM image of no. 2; Text S1 and Figure S2, the particle number concentration measured by an SMPS; Figure S3, the concentrations of SO42− and NO3; Text S2 and Figure S4, the ratios of ΔCH4/ΔCO2, ΔCH4/ΔCO, and ΔCO/ΔCO2.

Author Contributions

Methodology, M.Y., F.T., K.A. and Y.T.; Observation, F.T.; Formal analysis, M.Y., T.F., K.A. and Y.T.; Writing—Original Draft Preparation, M.Y., K.A., F.T., Y.T., Y.I., T.M. and K.M.; Writing—Review & Editing, M.Y. and K.A.; Supervision, K.M.; Funding acquisition, F.T., K.A. and M.Y. All authors have read and agreed to the published version of the manuscript.

Funding

This work was a part of the Arctic Challenge for Sustainability (ArCS) Project (Program Grant Number JPMXD1300000000). K.A. thanks the support of the Environment Research and Technology Development Fund (JPMEERF20205001) of the Environmental Restoration and Conservation Agency of Japan and the Japan Society for the Promotion of Science (JSPS) KAKENHI (grant numbers JP19K21905 and JP19H04259). This work was supported by the Grant for Joint Research Program of the Japan Arctic Research Network Center.

Acknowledgments

We would like to thank the captain and crews of the R/V MIRAI. We also thank the chief researcher S. Nishino and scientists of the MR-16-06 cruise for their support with the on-board aerosol measurements. MY and FT thank Takuma Miyakawa for support with the ambient aerosol measurements. The authors acknowledge the NOAA Air Resources Laboratory (ARL) for the provision of the HYSPLIT transport and dispersion model and/or READY website (https://www.ready.noaa.gov) and the Fire Information for Resource Management System (https://firms.modaps.eosdis.nasa.gov/map/).

Conflicts of Interest

The authors declare no conflict of interest.

References

  1. Bond, T.C.; Bergstrom, R.W. Light absorption by carbonaceous particles: An investigative review. Aerosol Sci. Technol. 2006, 40, 27–67. [Google Scholar] [CrossRef]
  2. Harvey, B.J. Human-caused climate change is now a key driver of forest fire activity in the western United States. Proc. Natl. Acad. Sci. USA 2016, 113, 11649–11650. [Google Scholar] [CrossRef] [PubMed] [Green Version]
  3. Bond, T.C.; Doherty, S.J.; Fahey, D.W.; Forster, P.M.; Berntsen, T.; DeAngelo, B.J.; Flanner, M.G.; Ghan, S.; Kärcher, B.; Koch, D.; et al. Bounding the role of black carbon in the climate system: A scientific assessment. J. Geophys. Res. Atmos. 2013, 118, 5380–5552. [Google Scholar] [CrossRef]
  4. Pósfai, M.; Gelencsér, A.; Simonics, R.; Arató, K.; Li, J.; Hobbs, P.V.; Buseck, P.R. Atmospheric tar balls: Particles from biomass and biofuel burning. J. Geophys. Res. 2004, 109, D06213. [Google Scholar] [CrossRef] [Green Version]
  5. Hand, J.L.; Malm, W.C.; Laskin, A.; Day, D.; Lee, T.; Wang, C.; Carrico, C.; Carrillo, J.; Cowin, J.P.; Collett, J., Jr.; et al. Optical, physical, and chemical properties of tar balls observed during the Yosemite Aerosol Characterization Study. J. Geophys. Res. 2005, 110, D21210. [Google Scholar] [CrossRef]
  6. Adachi, K.; Buseck, P.R. Atmospheric tar balls from biomass burning in Mexico. J. Geophys. Res. Atmos. 2011, 116, D05204. [Google Scholar] [CrossRef]
  7. Girotto, G.; China, S.; Bhandari, J.; Gorkowski, K.; Scarnato, B.V.; Capek, T.; Marinoni, A.; Veghte, D.P.; Kulkarni, G.; Aiken, A.C.; et al. Fractal-like Tar Ball Aggregates from Wildfire Smoke. Environ. Sci. Technol. Lett. 2018, 5, 360–365. [Google Scholar] [CrossRef]
  8. Sedlacek III, A.J.; Buseck, P.R.; Adachi, K.; Onasch, T.B.; Springston, S.R.; Kleinman, L. Formation and evolution of tar balls from northwestern US wildfires. Atmos. Chem. Phys. 2018, 18, 11289–11301. [Google Scholar] [CrossRef] [Green Version]
  9. Adachi, K.; Sedlacek III, A.J.; Kleinman, L.; Springston, S.R.; Wangb, J.; Chand, D.; Hubbe, J.M.; Shilling, J.E.; Onasch, T.B.; Kinase, T.; et al. Spherical tarball particles form through rapid chemical and physical changes of organic matter in biomass-burning smoke. Proc. Natl. Acad. Sci. USA 2019, 116, 19336–19341. [Google Scholar] [CrossRef] [Green Version]
  10. Chakrabarty, R.K.; Moosmüller, H.; Chen, L.-W.A.; Lewis, K.; Arnott, W.P.; Mazzoleni, C.; Dubey, M.K.; Wold, C.E.; Hao, W.M.; Kreidenweis, S.M. Brown carbon in tar balls from smoldering biomass combustion. Atmos. Chem. Phys. 2010, 10, 6363–6370. [Google Scholar] [CrossRef] [Green Version]
  11. Chung, C.E.; Ramanathan, V.; Decremer, D. Observationally constrained estimates of carbonaceous aerosol radiative forcing. Proc. Natl. Acad. Sci. USA 2012, 109, 11624–11629. [Google Scholar] [CrossRef] [PubMed] [Green Version]
  12. Jaffe, D.; Bertschi, I.; Jaeglé, L.; Norelli, P.; Reid, J.S.; Tanimoto, H.; Vingarzan, R.; Westphal, L.W. Long-range transport of Siberian biomass burning emissions and impact on surface ozone in western North America. Gephys. Res. Lett. 2004, 31, L16106. [Google Scholar] [CrossRef] [Green Version]
  13. Warneke, C.; Froyd, K.D.; Brioude, J.; Bahreini, R.; Brock, C.A.; Cozic, J.; Gouw, J.A.; Fahey, D.W.; Ferrare, R.; Holloway, J.S.; et al. An important contribution to springtime Arctic aerosol from biomass burning in Russia. Geophys. Res. Lett. 2010, 37, L01801. [Google Scholar] [CrossRef] [Green Version]
  14. Ritter, C.; Notholt, J.; Fischer, J.; Rathke, C. Direct thermal radiative forcing of tropospheric aerosol in the Arctic measured by ground based infrared spectrometry. Geophys. Res. Lett. 2005, 32, L23816. [Google Scholar] [CrossRef]
  15. Flanner, M.G.; Zender, C.S.; Randerson, J.T.; Rasch, P.J. Present-day climate forcing and response from black carbon in snow. J. Geophys. Res. 2007, 112, D11202. [Google Scholar] [CrossRef] [Green Version]
  16. Tohjima, Y.; Zeng, J.; Shirai, T.; Niwa, Y.; Ishidoya, S.; Taketani, F.; Sasano, D.; Kosugi, N.; Kameyama, S.; Takashima, H.; et al. Estimation of CH4 emissions from the East Siberian Arctic Shelf based on atmospheric observations aboard the R/V Mirai during fall cruises from 2012 to 2017. Polar Sci. 2020, in press. [Google Scholar] [CrossRef]
  17. Yoshizue, M.; Iwamoto, Y.; Adachi, K.; Kato, S.; Sun, S.; Miura, K.; Uematsu, M. Individual particle analysis of marine aerosols collected during the North–South transect cruise in the Pacifc Ocean and its marginal seas. J. Oceanogr. 2019, 75, 513–524. [Google Scholar] [CrossRef] [Green Version]
  18. Taketani, F.; Miyakawa, T.; Takigawa, M.; Yamaguchi, M.; Komazaki, Y.; Mordovskoi, P.; Takashima, H.; Nishino, S.; Tohjima, Y.; Kanaya, Y. Characteristics of atmospheric aerosol particles over the Arctic Ocean in early autumn 2016. Atmos. Environ. 2020. to be submitted. [Google Scholar]
  19. NOAA Air Resources Laboratory (ARL) for the Provision of the HYSPLIT Transport and Dispersion Model and/or READY. Available online: http://www.ready.noaa.gov/HYSPLIT.php (accessed on 22 September 2020).
  20. Rolph, G.; Stein, A.; Stunder, B. Real-time Environmental Applications and Display sYstem: READY. Environ. Model. Softw. 2017, 95, 210–228. [Google Scholar] [CrossRef]
  21. Stein, A.F.; Draxler, R.R.; Rolph, G.D.; Stunder, B.J.B.; Cohen, M.D.; Ngan, F. NOAA’s HYSPLIT atmospheric transport and dispersion modeling system. Bull. Am. Meteor. Soc. 2015, 96, 2059–2077. [Google Scholar] [CrossRef]
  22. Fire Information for Resource Management System. Available online: https://firms.modaps.eosdis.nasa.gov/map/ (accessed on 22 September 2020).
  23. Simoneit, B.R.T.; Schocer, J.J.; Notle, C.G.; Oros, D.R.; Elias, V.O.; Fraser, M.P.; Rogge, W.F.; Cass, G.R. Levoglucosan, a tracer for cellulose in biomass burning and atmospheric particles. Atmos. Environ. 1999, 33, 173–182. [Google Scholar] [CrossRef]
  24. Schauer, J.J.; Kleeman, M.J.; Cass, G.R.; Simoneit, B.R.T. Measurement of Emissions from Air Pollution Sources. 3. C1−C29 Organic Compounds from Fireplace Combustion of Wood. Environ. Sci. Technol. 2001, 35, 1716–1728. [Google Scholar] [CrossRef]
  25. Cachier, H.; Liousse, C.; Buatmenard, P.; Gaudichet, A. Particulate Content of Savanna Fire Emissions. J. Atmos. Chem. 1995, 22, 123–148. [Google Scholar] [CrossRef]
  26. Abbatt, J.P.D.; Leaitch, W.R.; Aliabadi, A.A.; Bertram, A.K.; Blanchet, J.-P.; Boivin-Rioux, A.; Bozem, H.; Burkart, J.; Chang, R.Y.W.; Charette, J.; et al. Overview paper: New insights into aerosol and climate in the Arctic. Atmos. Chem. Phys. 2019, 19, 2527–2560. [Google Scholar] [CrossRef] [Green Version]
  27. Warneke, C.; Bahreini, R.; Brioude, J.; Brock, C.A.; de Gouw, J.A.; Fahey, D.W.; Froyd, K.D.; Holloway, J.S.; Middlebrook, A.; Miller, L.; et al. Biomass burning in Siberia and Kazakhstan as an important source for haze over the Alaskan Arctic in April 2008. Geophys. Res. Lett. 2009, 36, L02813. [Google Scholar] [CrossRef] [Green Version]
Figure 1. Sampling points for individual particle analysis in this study. The colored lines show five-day backward trajectories starting from the sampling points at 500 m a.s.l. and sampling times for (a) no. 1 (26 September 1:00), (b) no. 2 (28 September 23:00), and (c) no. 3 (29 September 23:00). The colored dots show the fire locations and the degree of burning during the backward trajectory period. The black circles show the sampling points. The black lines show the cruise tracks.
Atmosphere 11 01175 g001
Figure 2. The concentrations of BC mass (1 h average) and levoglucosan. Red lines show the sampling times for the TEM-EDX samples.
Atmosphere 11 01175 g002
Figure 3. Number fractions of particles for each sample. The above numbers show the number of analyzed particles.
Atmosphere 11 01175 g003
Figure 4. TEM images of (a) no. 1 and (b) no. 3. The red arrows denote TBs.
Atmosphere 11 01175 g004
Figure 5. Relative humidity (RH) and rain fall (RF) on the backward trajectories of sample nos. 1 and 3.
Atmosphere 11 01175 g005
Figure 6. (a) The equivalent circle diameter (ECD) of TBs in each sample. (b,c) The relative mass ratios of N, and S to K in the TBs, respectively. The top, upper box line, black middle box line, lower box line, and bottom denote values of 90%, 75%, 50% (median), 25%, and 10%, respectively.
Atmosphere 11 01175 g006
Publisher’s Note: MDPI stays neutral with regard to jurisdictional claims in published maps and institutional affiliations.

