The Role of Tropical Cyclones on the Total Precipitation in Cuba during the Hurricane Season from 1980 to 2016

 ,
,  ,
,  ,
,  and
and 
Abstract
:1. Introduction
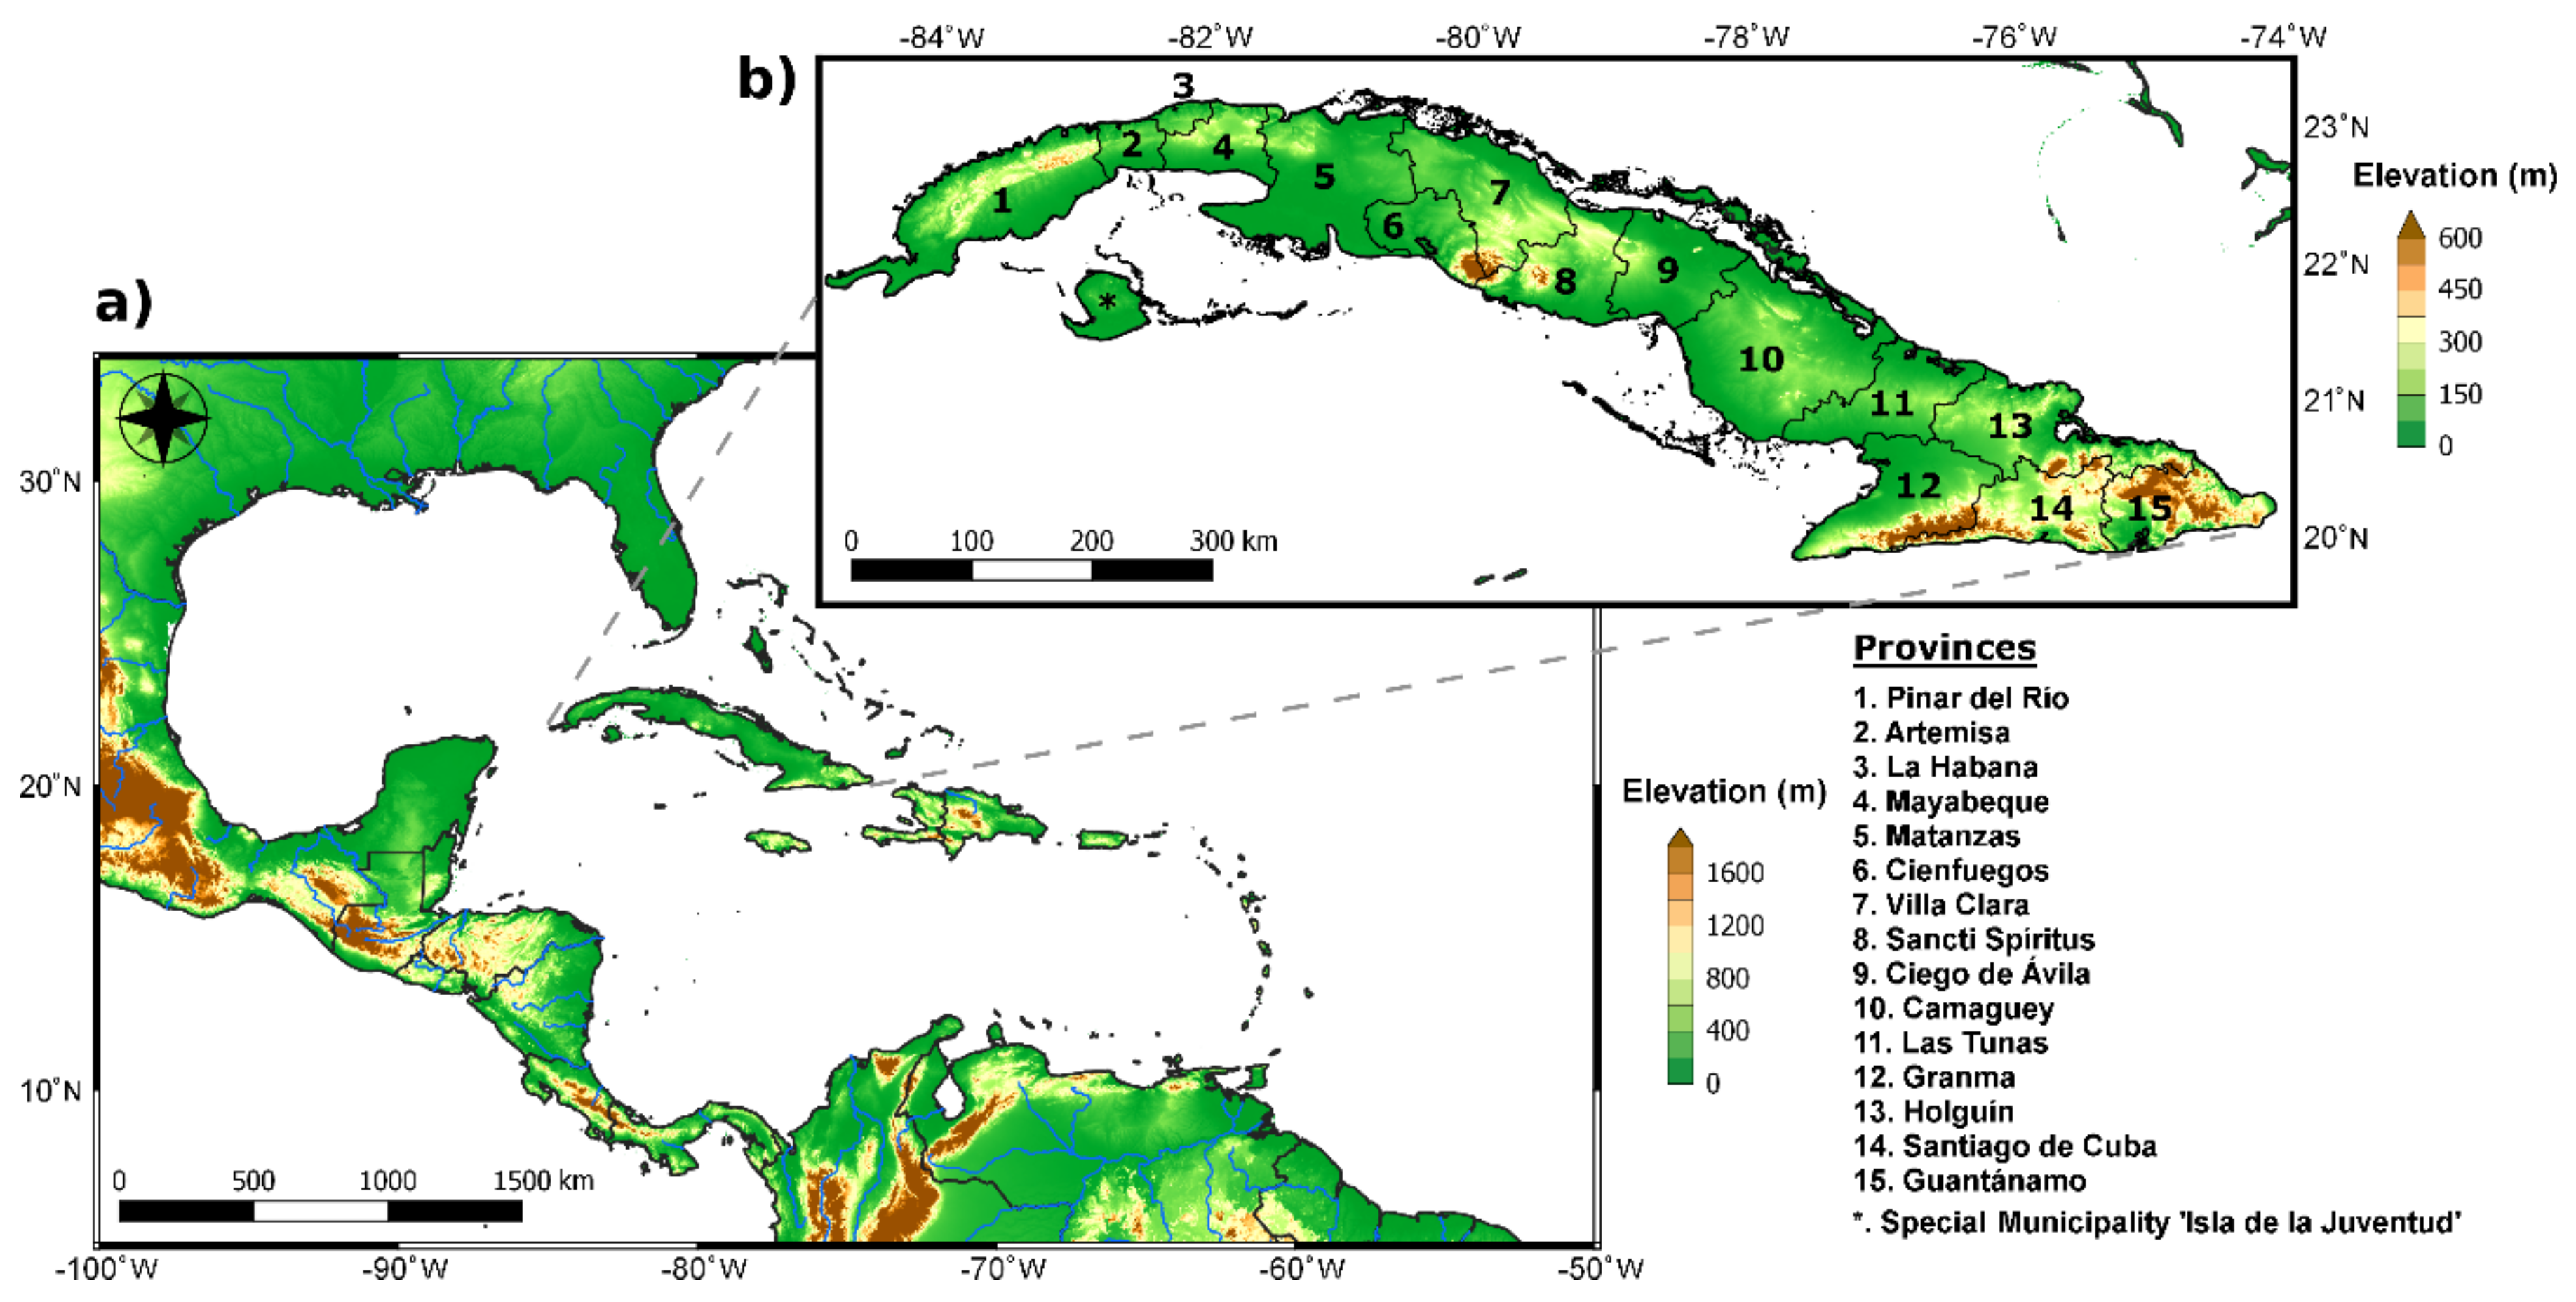
Region of Study
2. Data and Methodology
2.1. Datasets
2.2. Methodology
Identification of TCs that Affected Cuba
3. Results
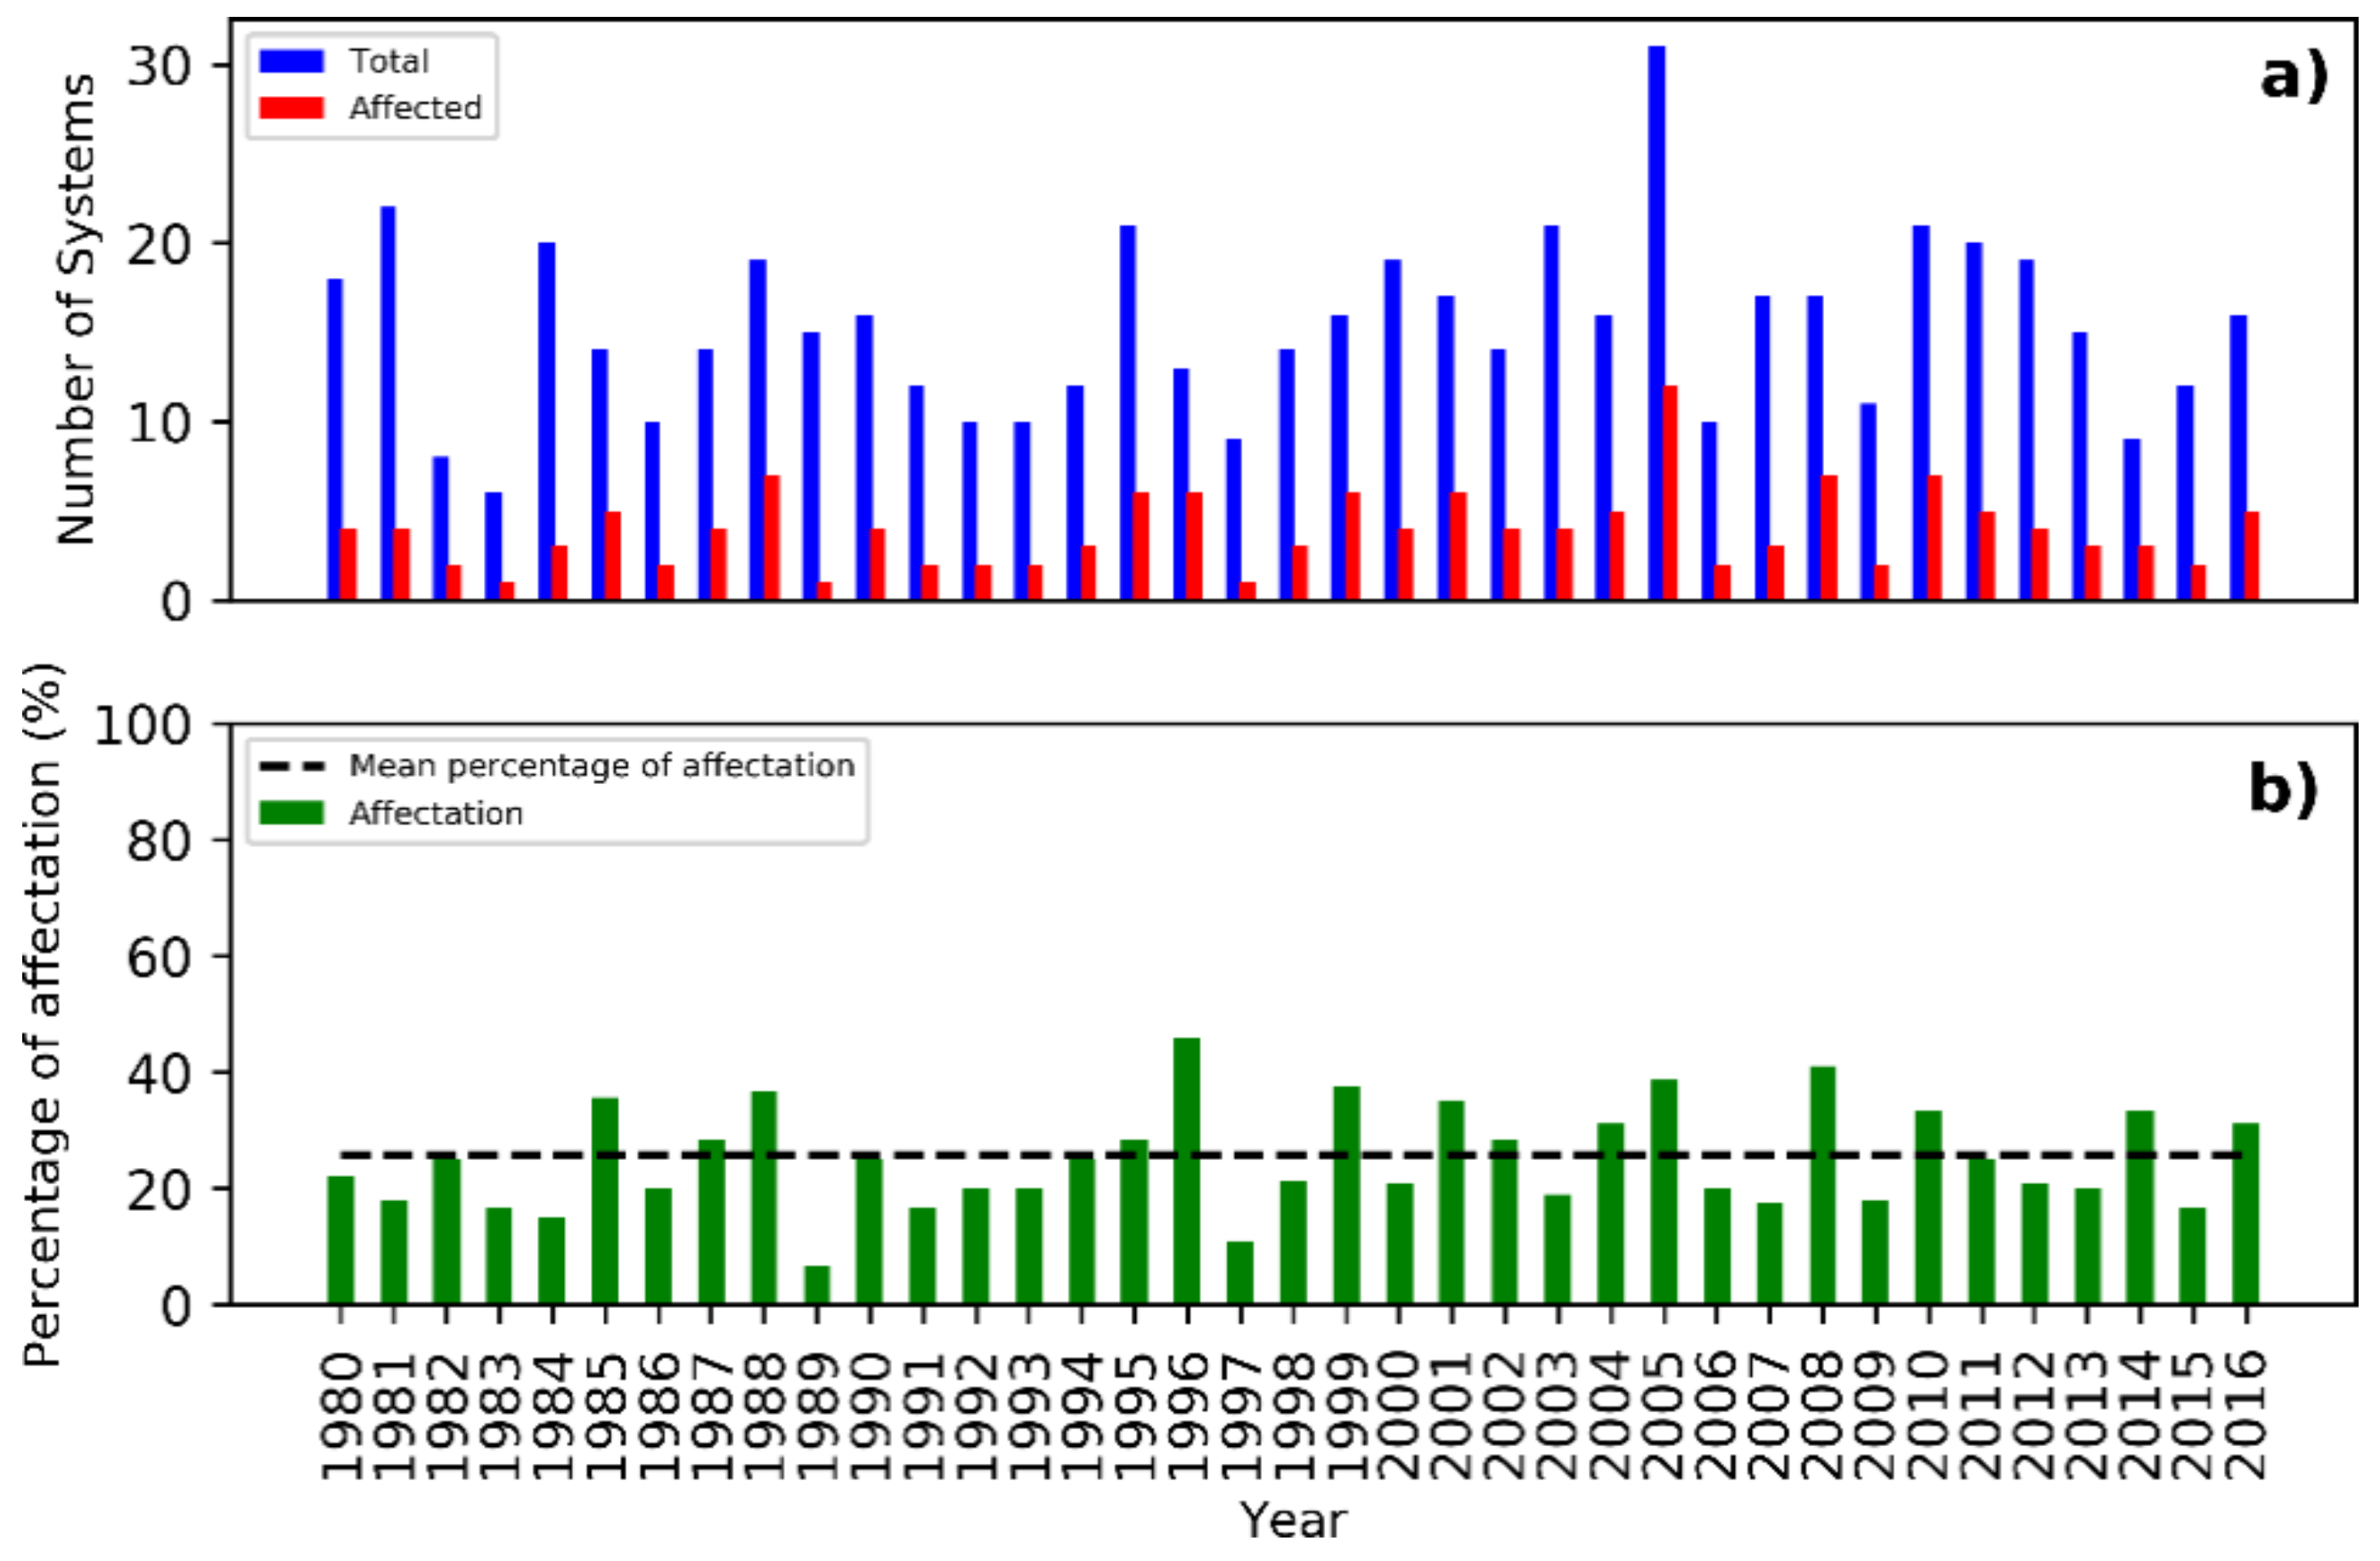
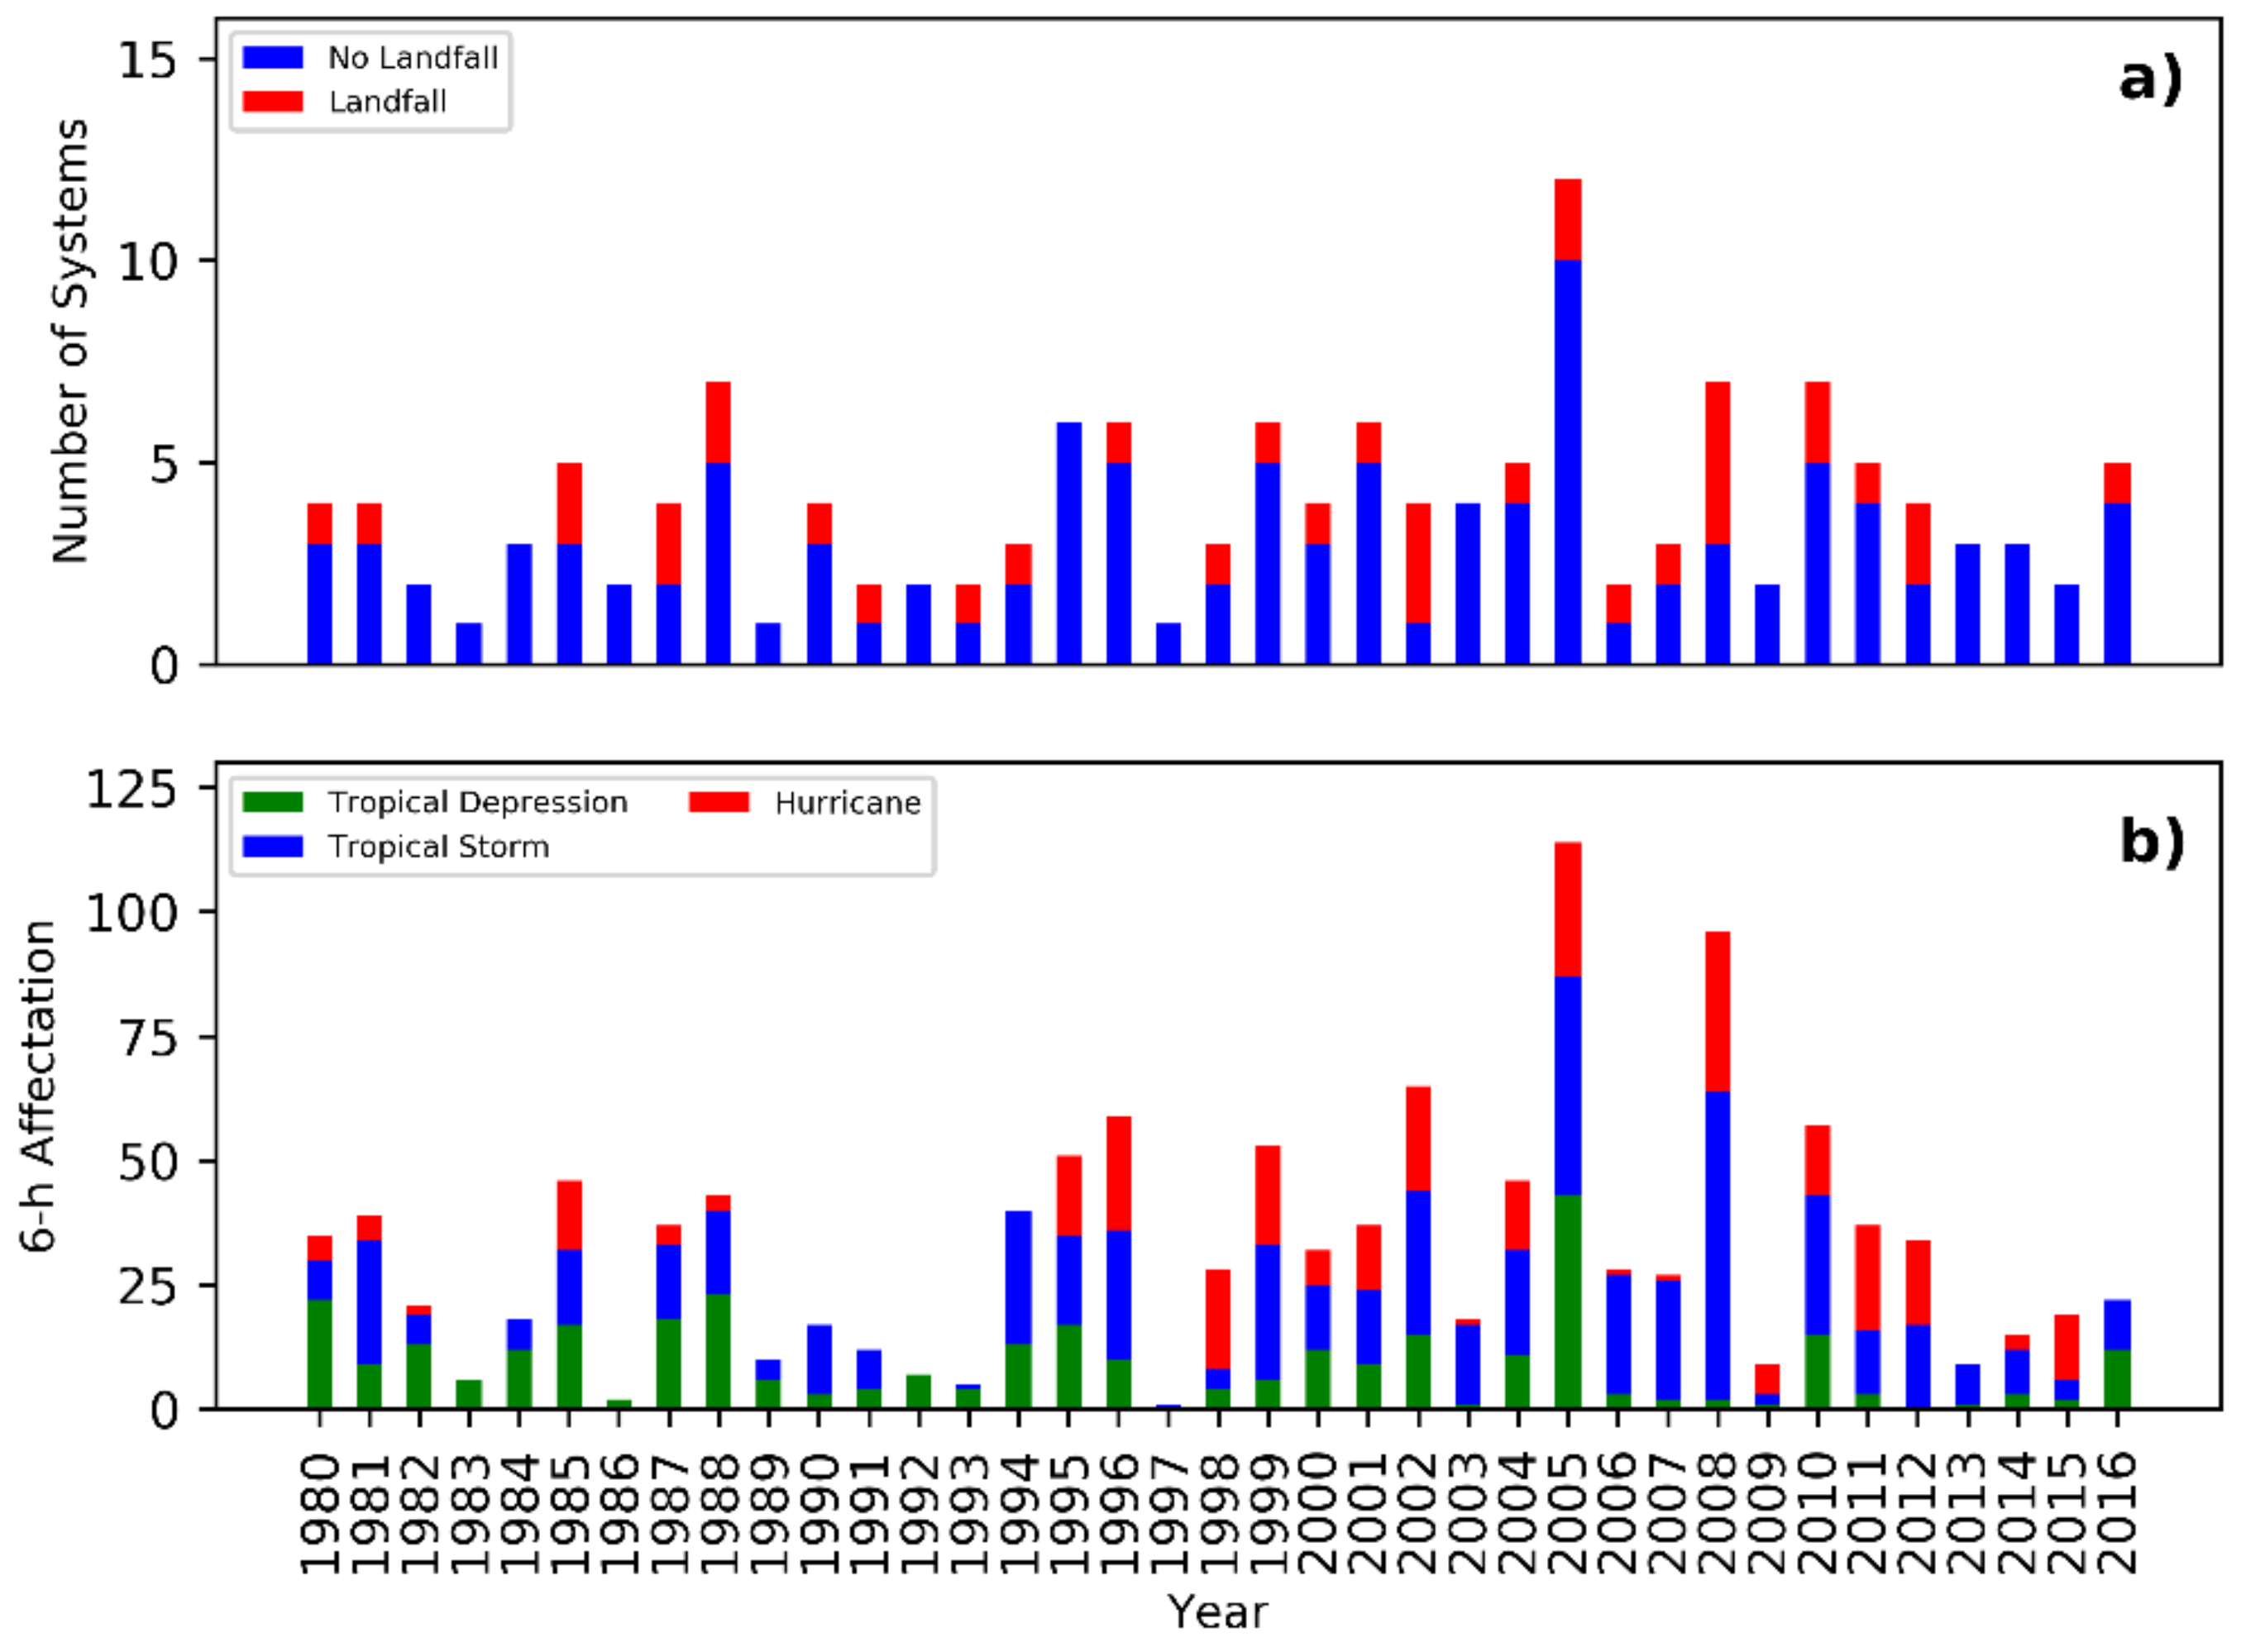
3.1. TC Activity During the Rainy Season in the Period 1980–2016
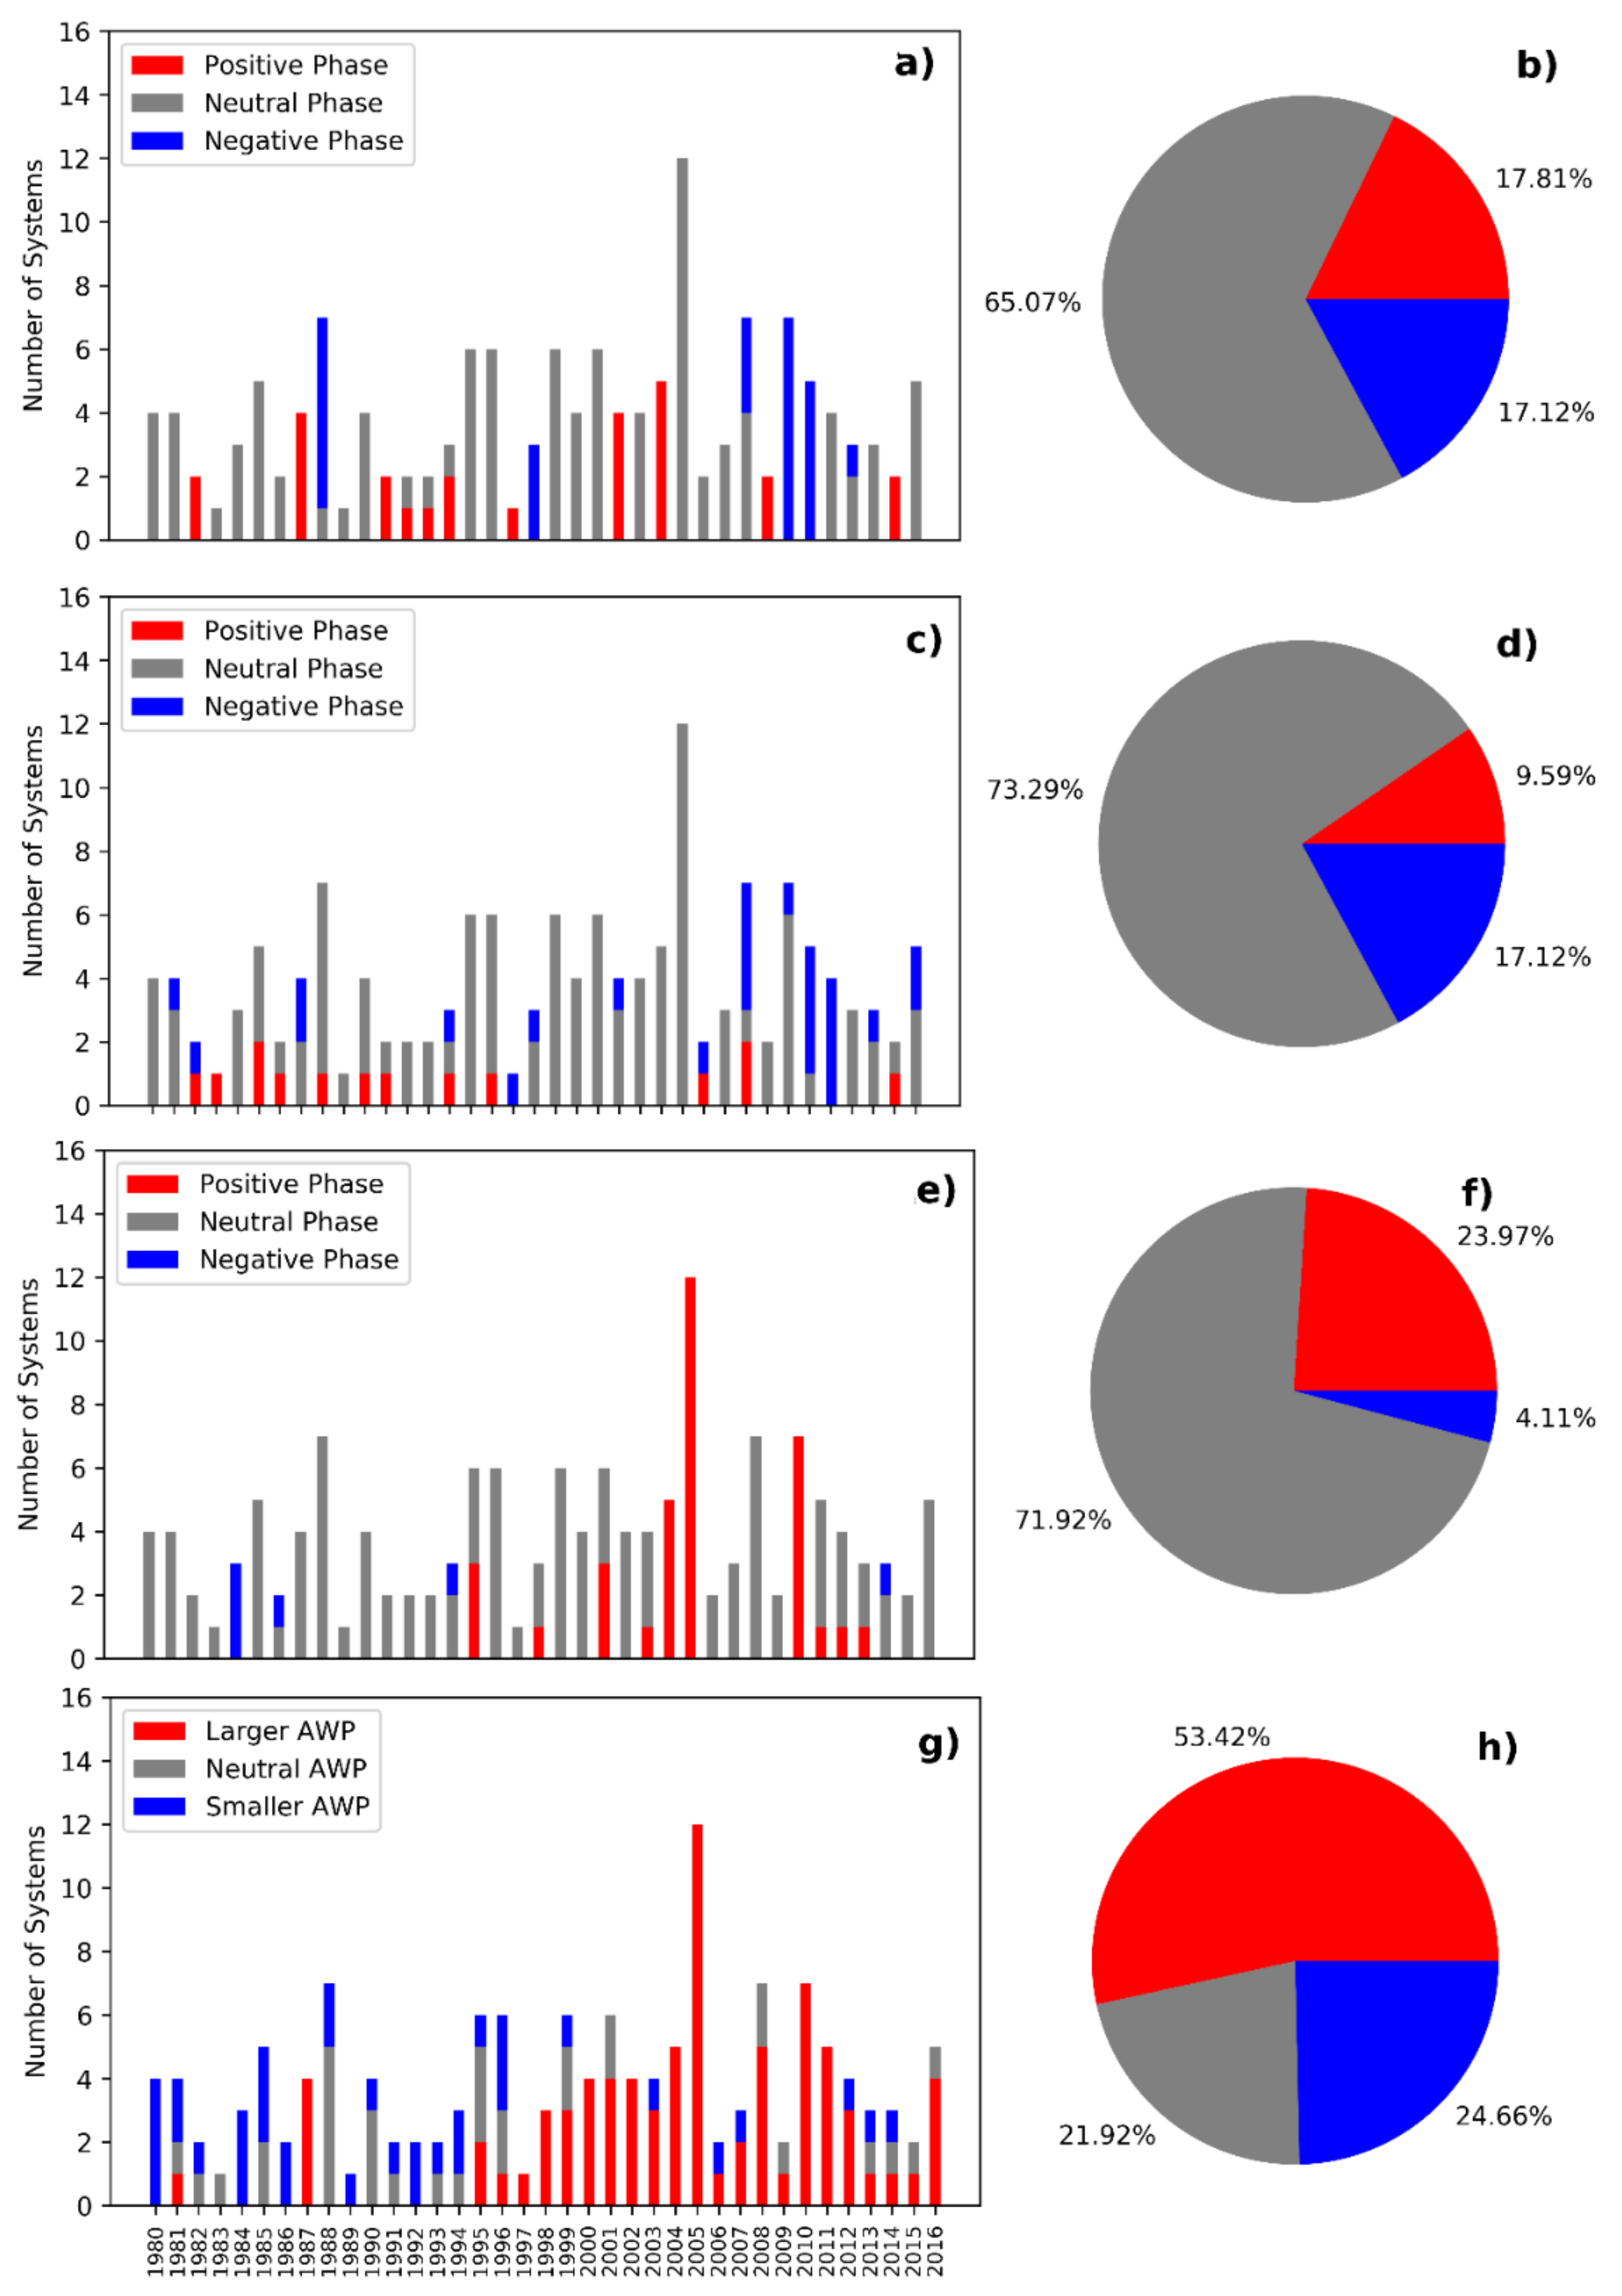
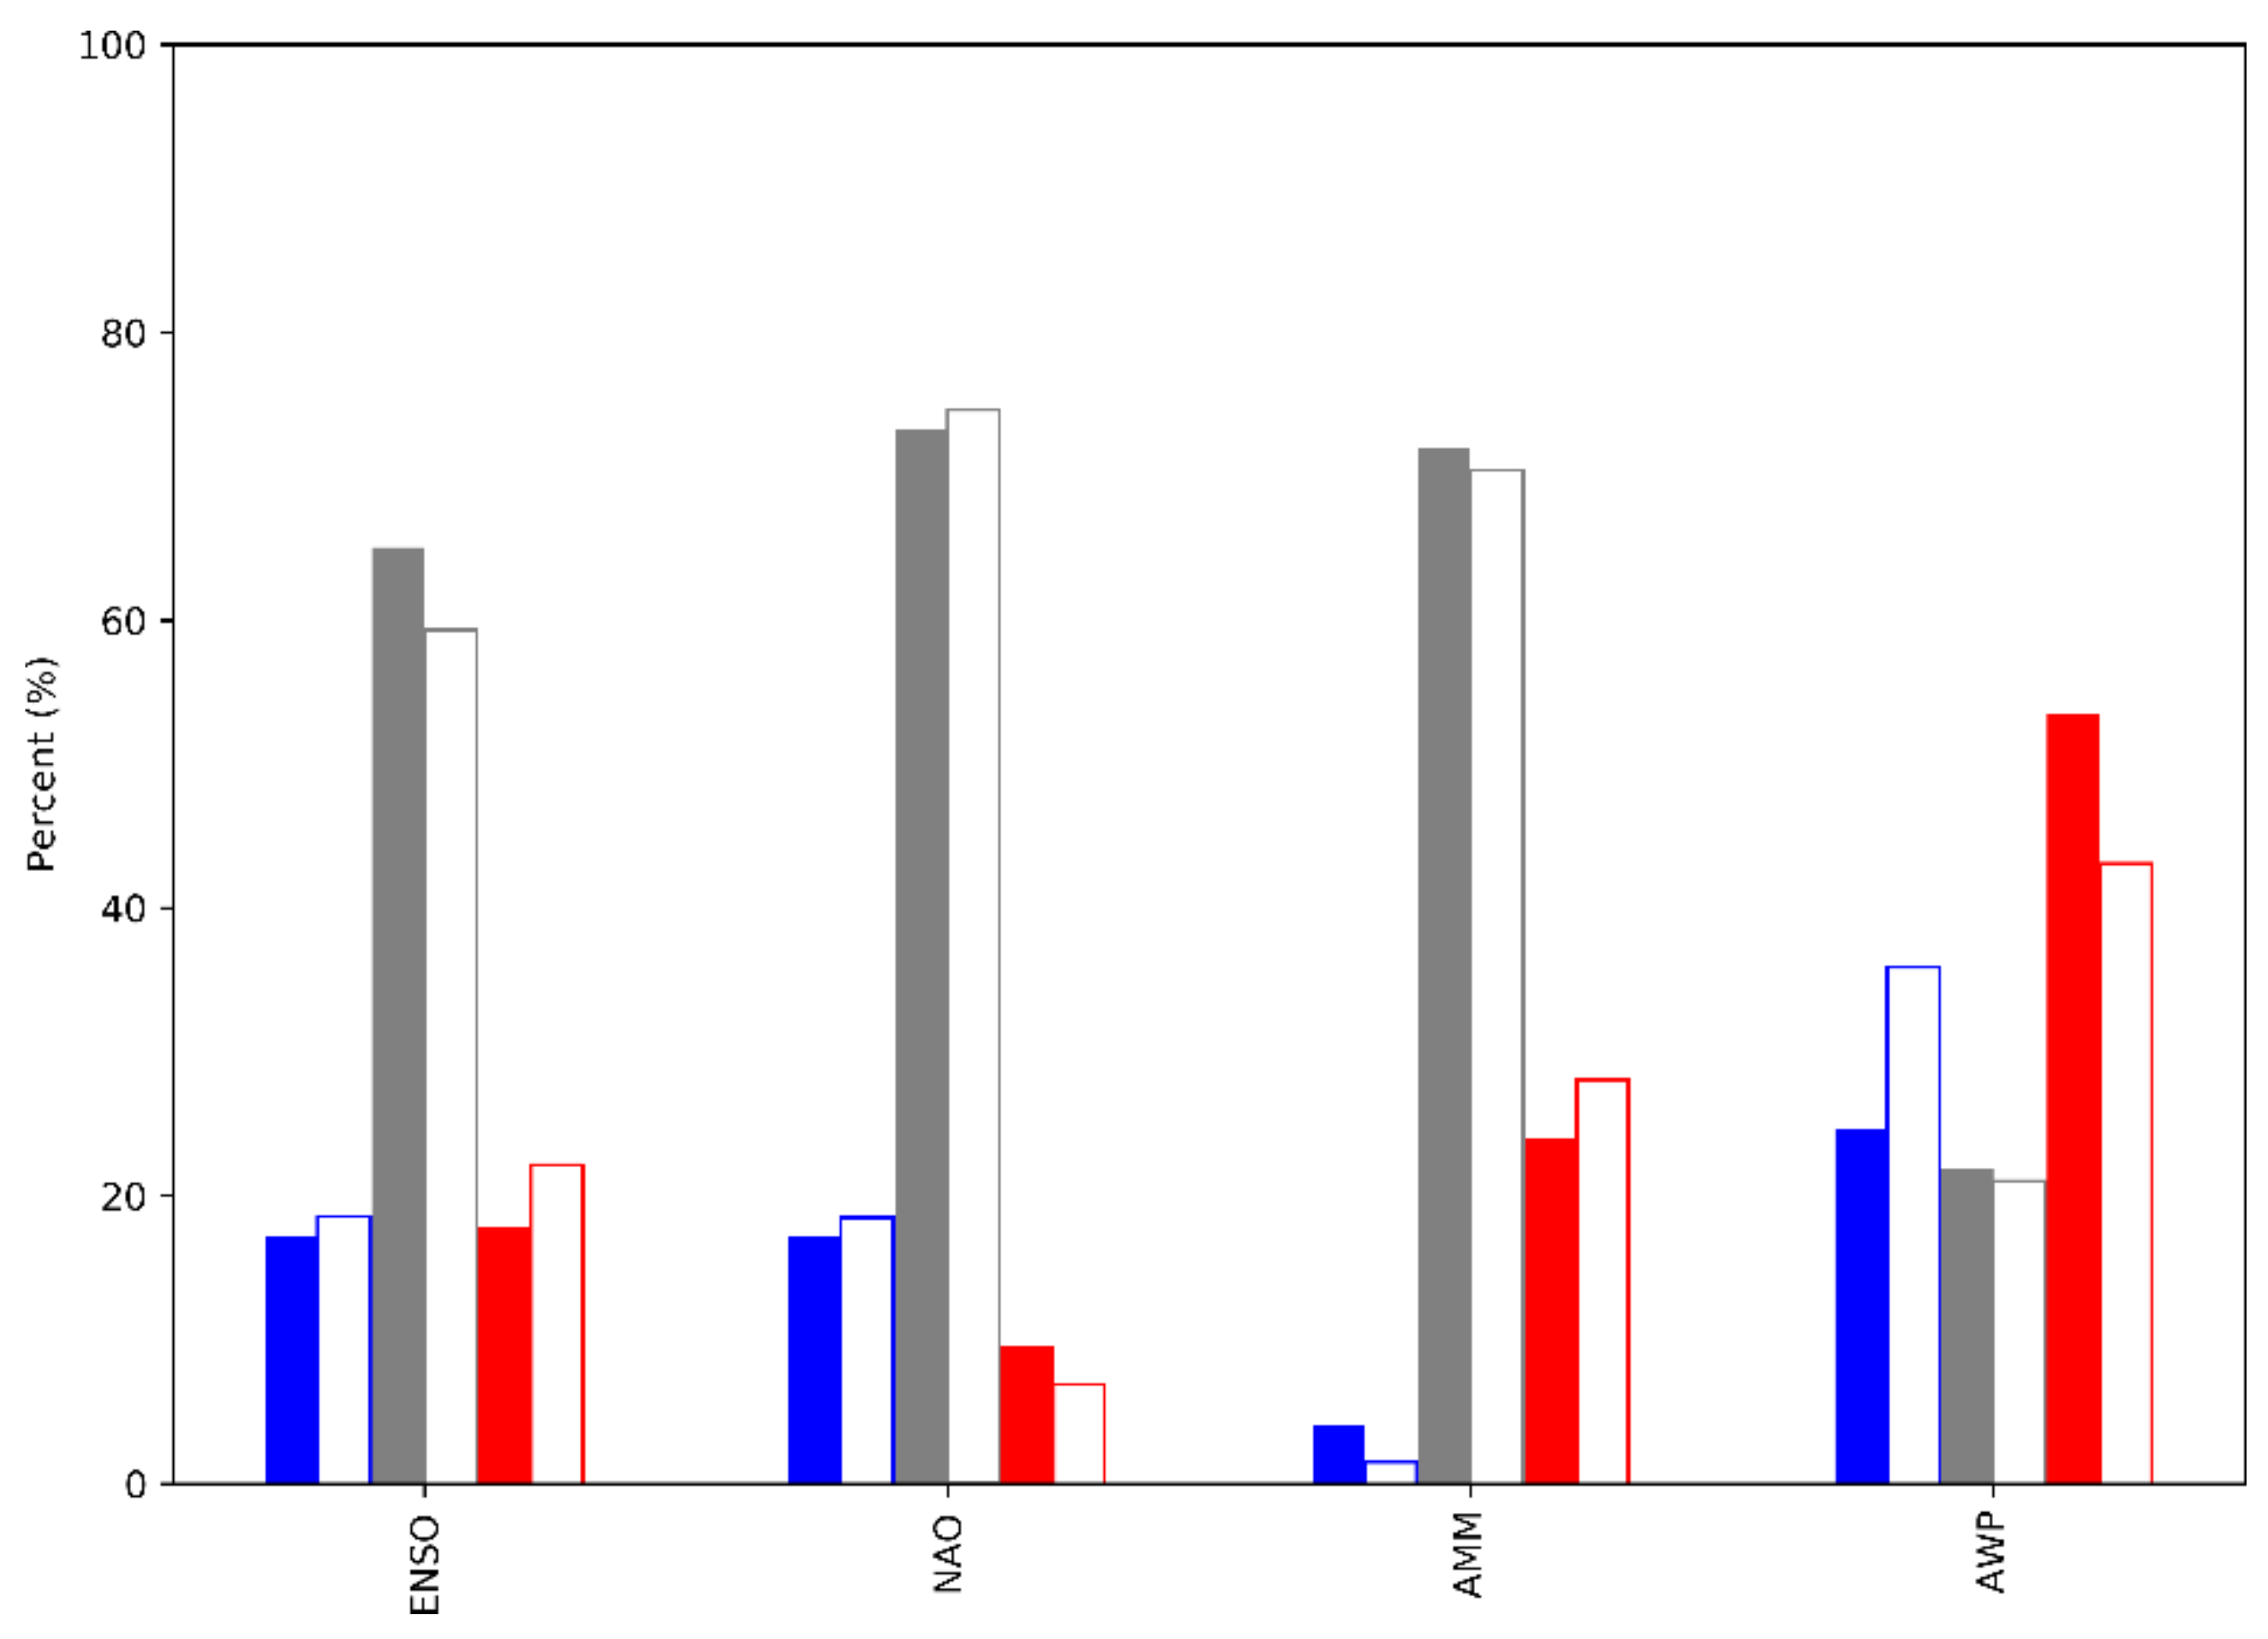
3.1.1. Relationship between TC activity and ENSO, NAO, AMM and AWP
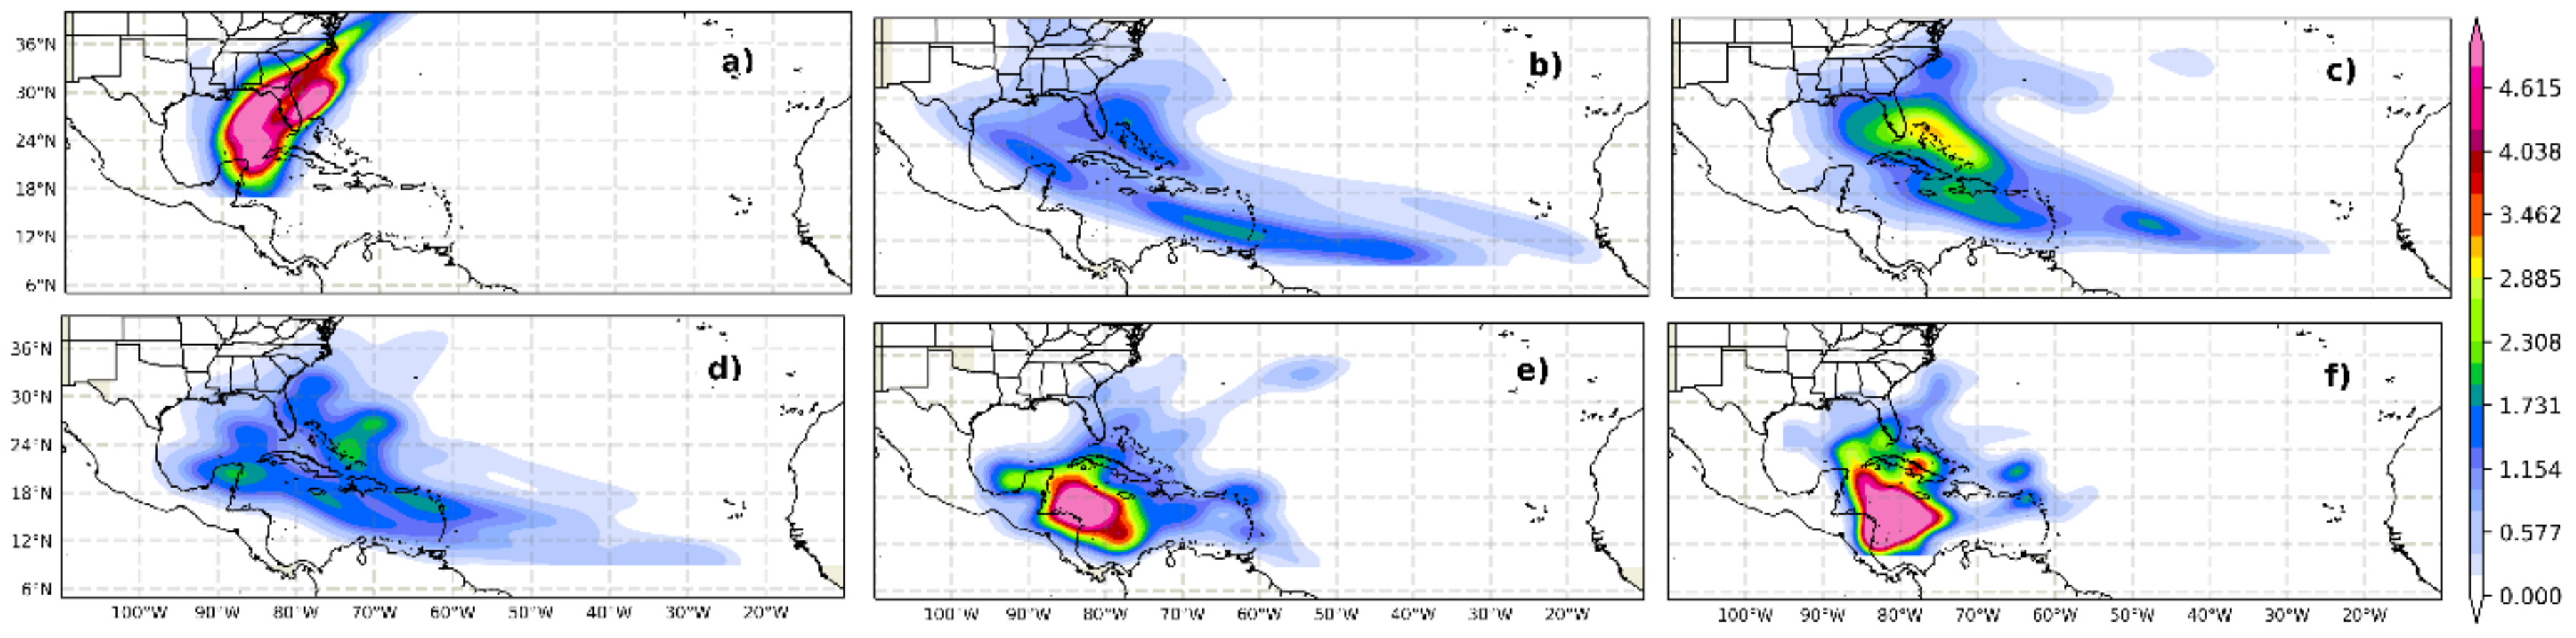
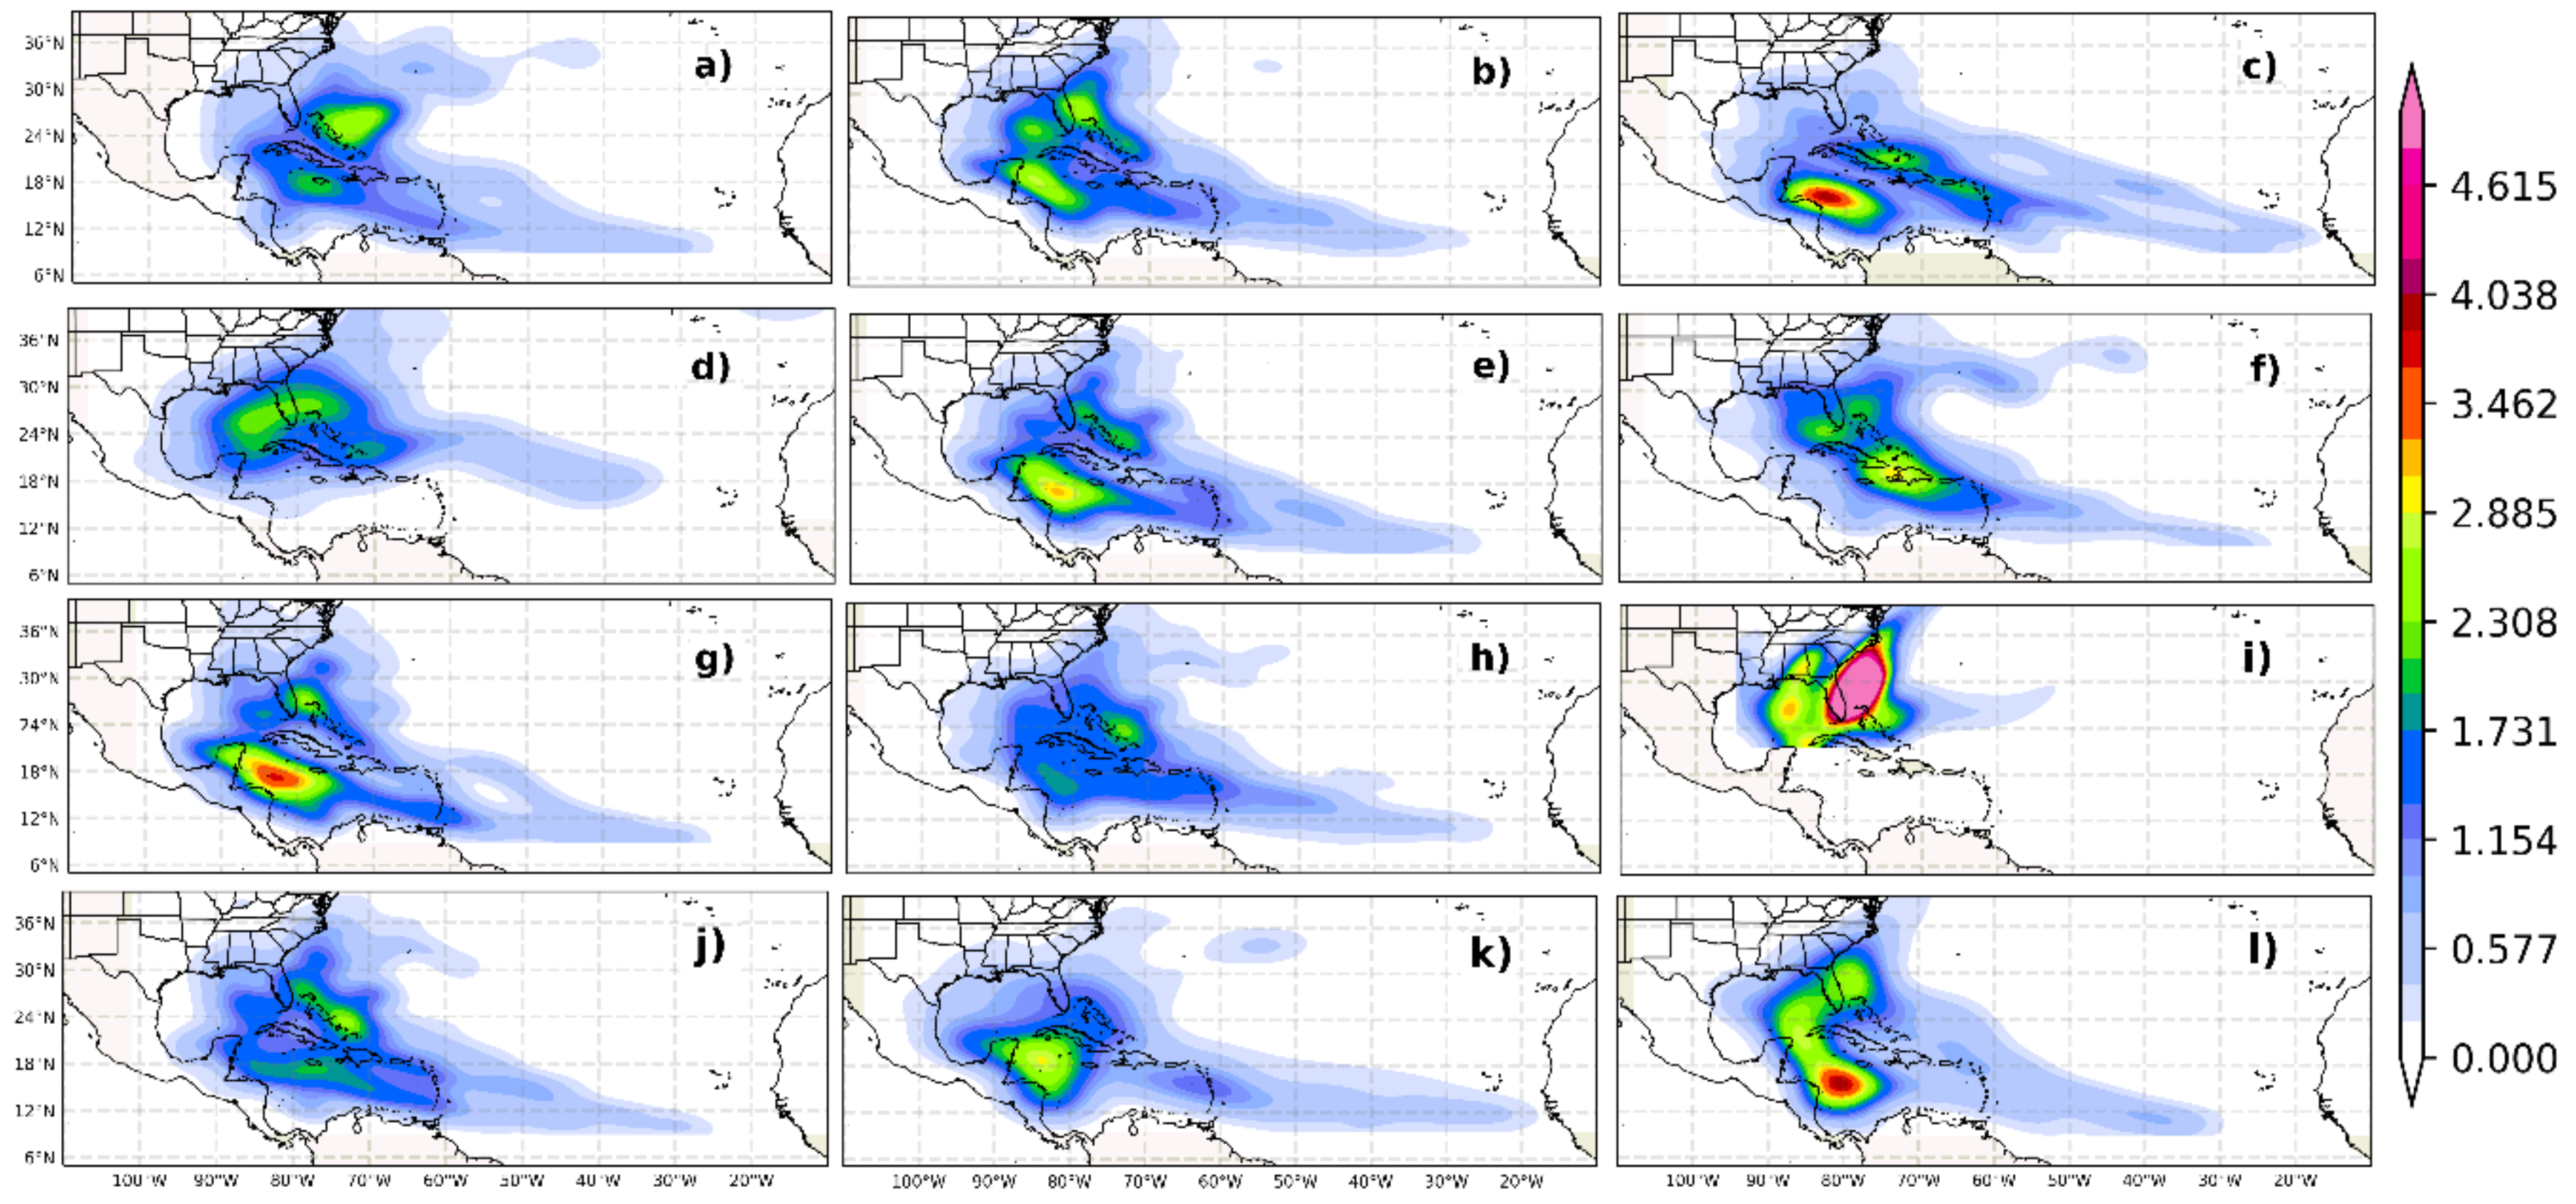
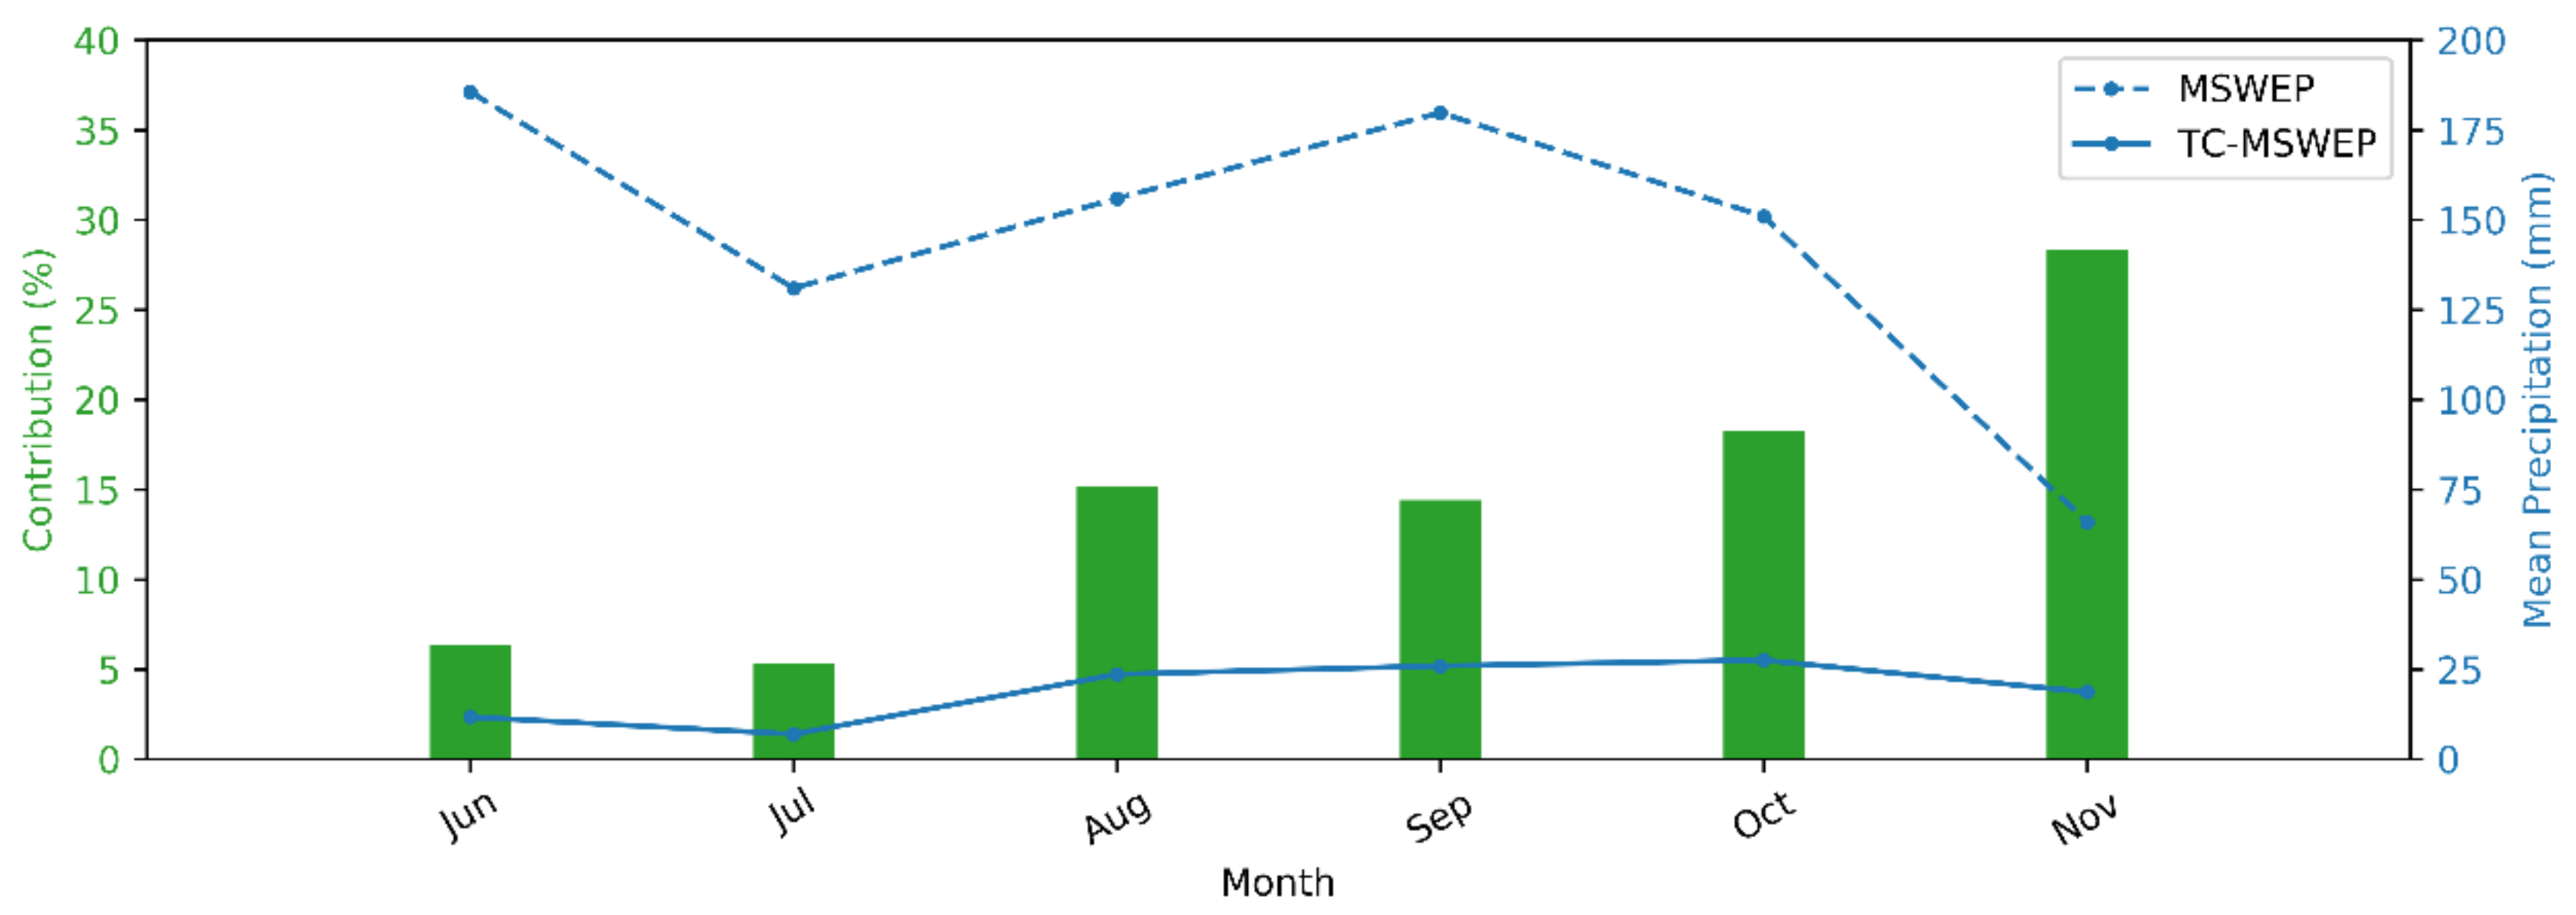
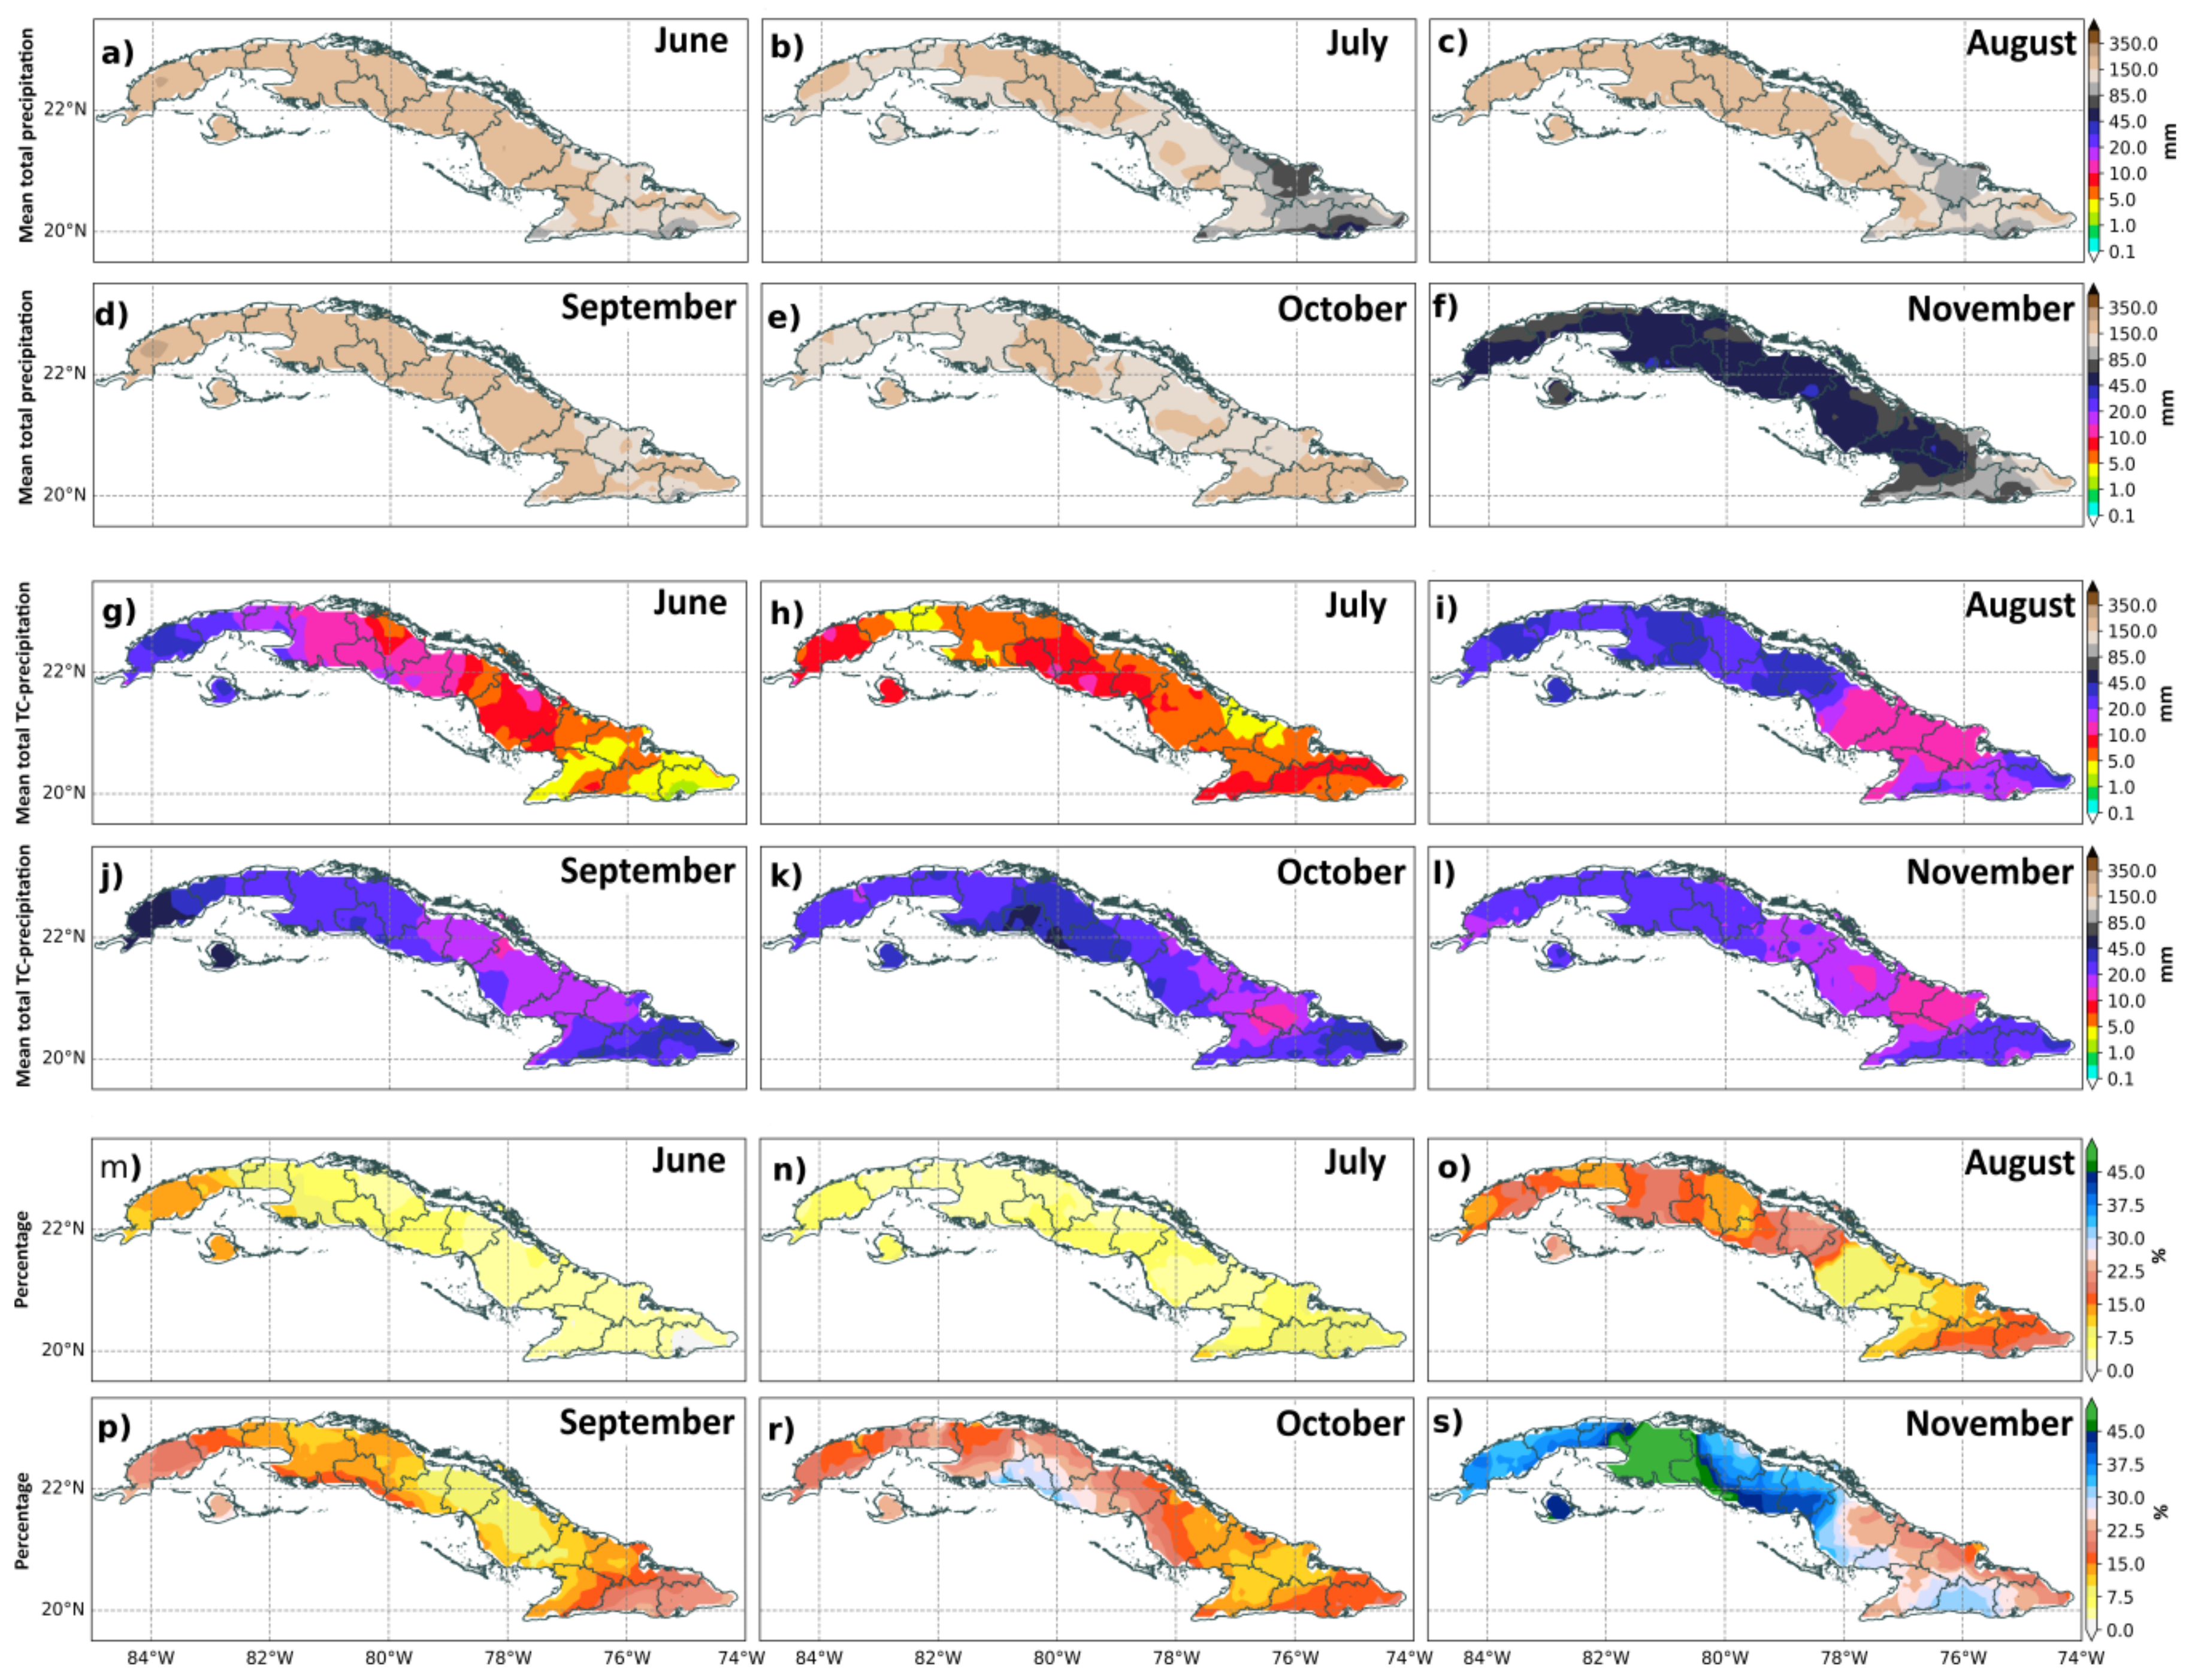
3.2. Monthly Mean TC Rainfall and Its Contribution
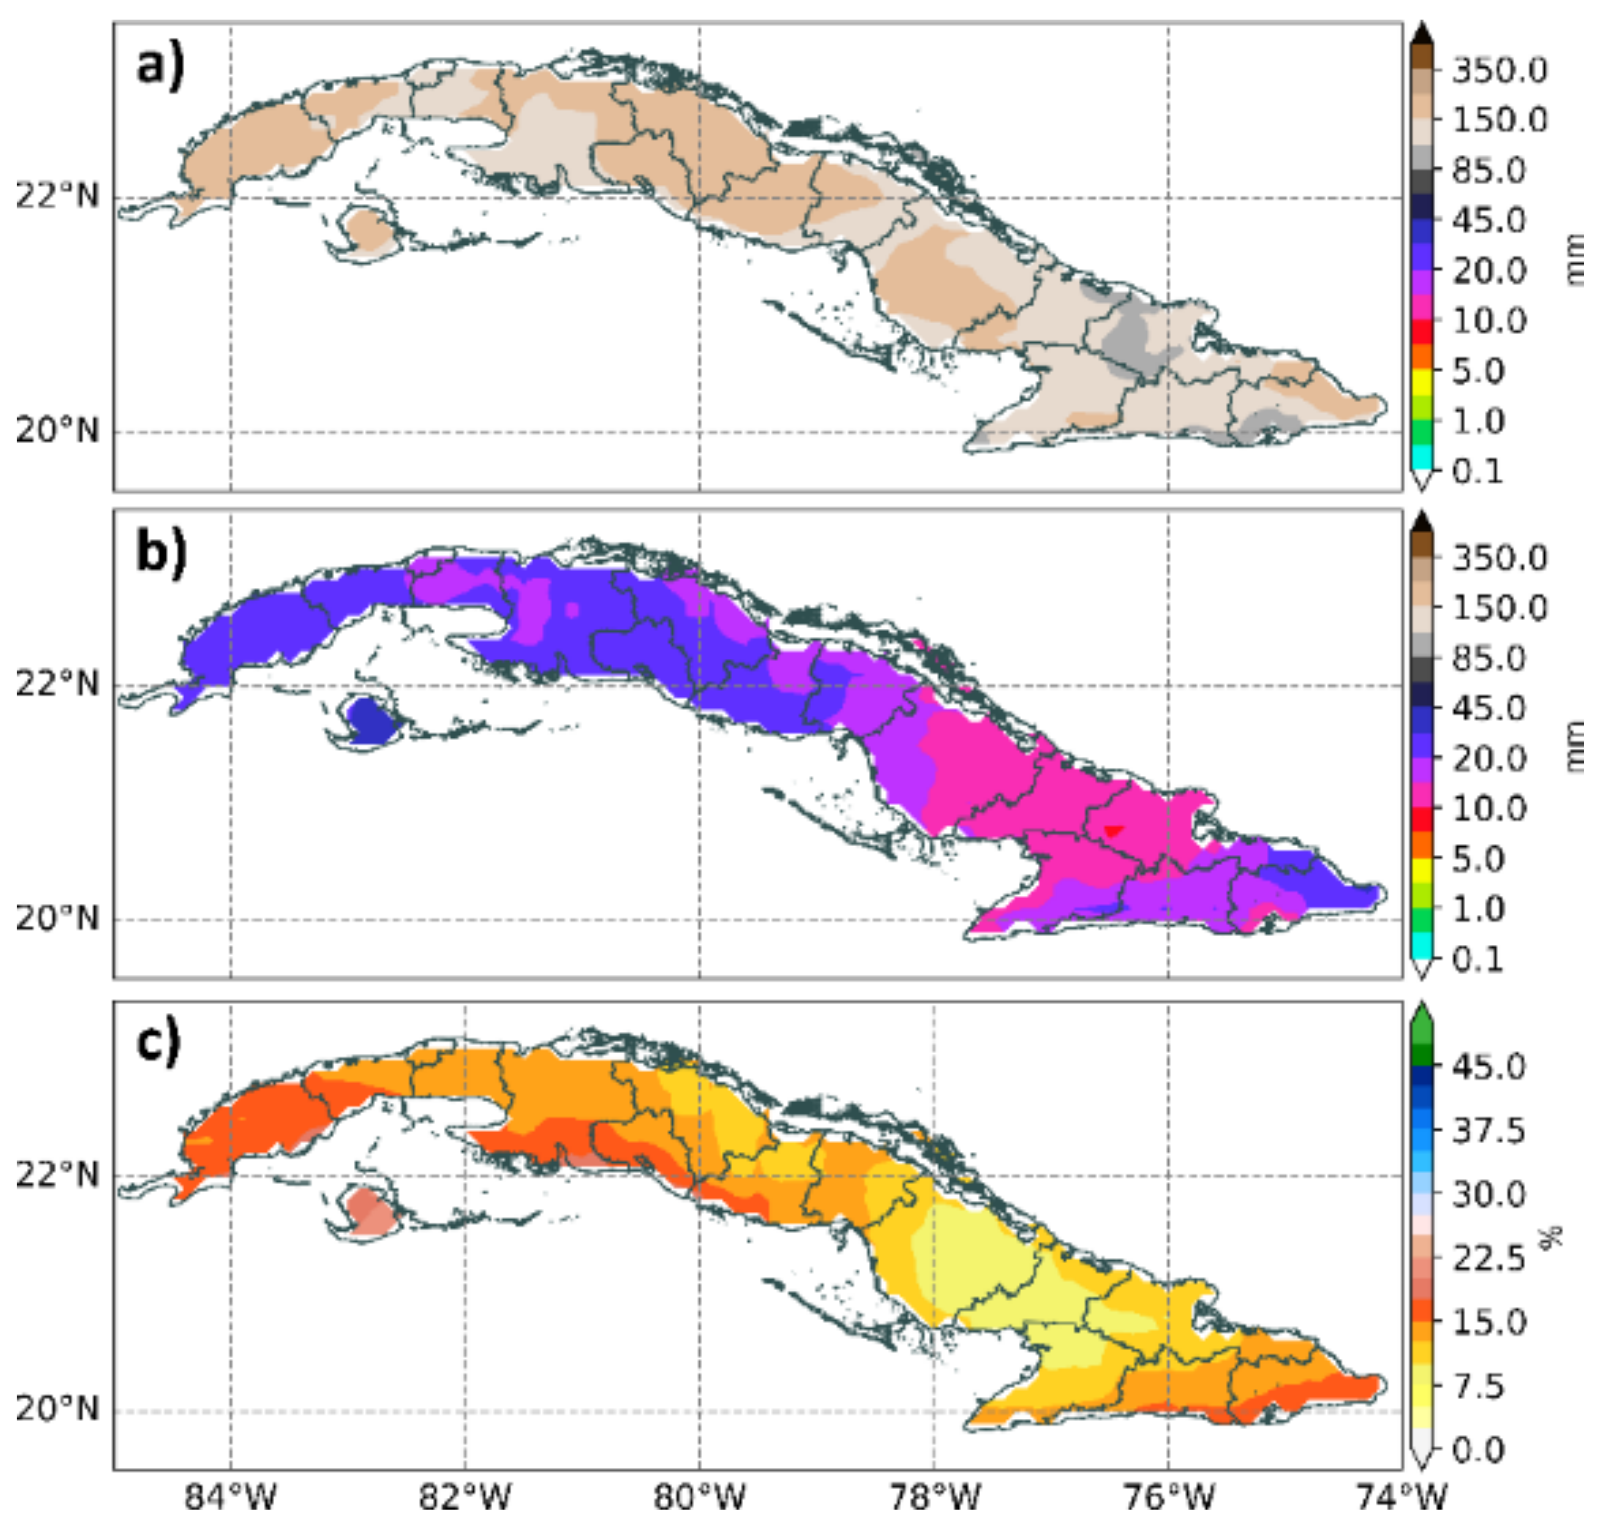
3.3. Seasonal Mean TC–Related Rainfall and Its Contribution to the Total
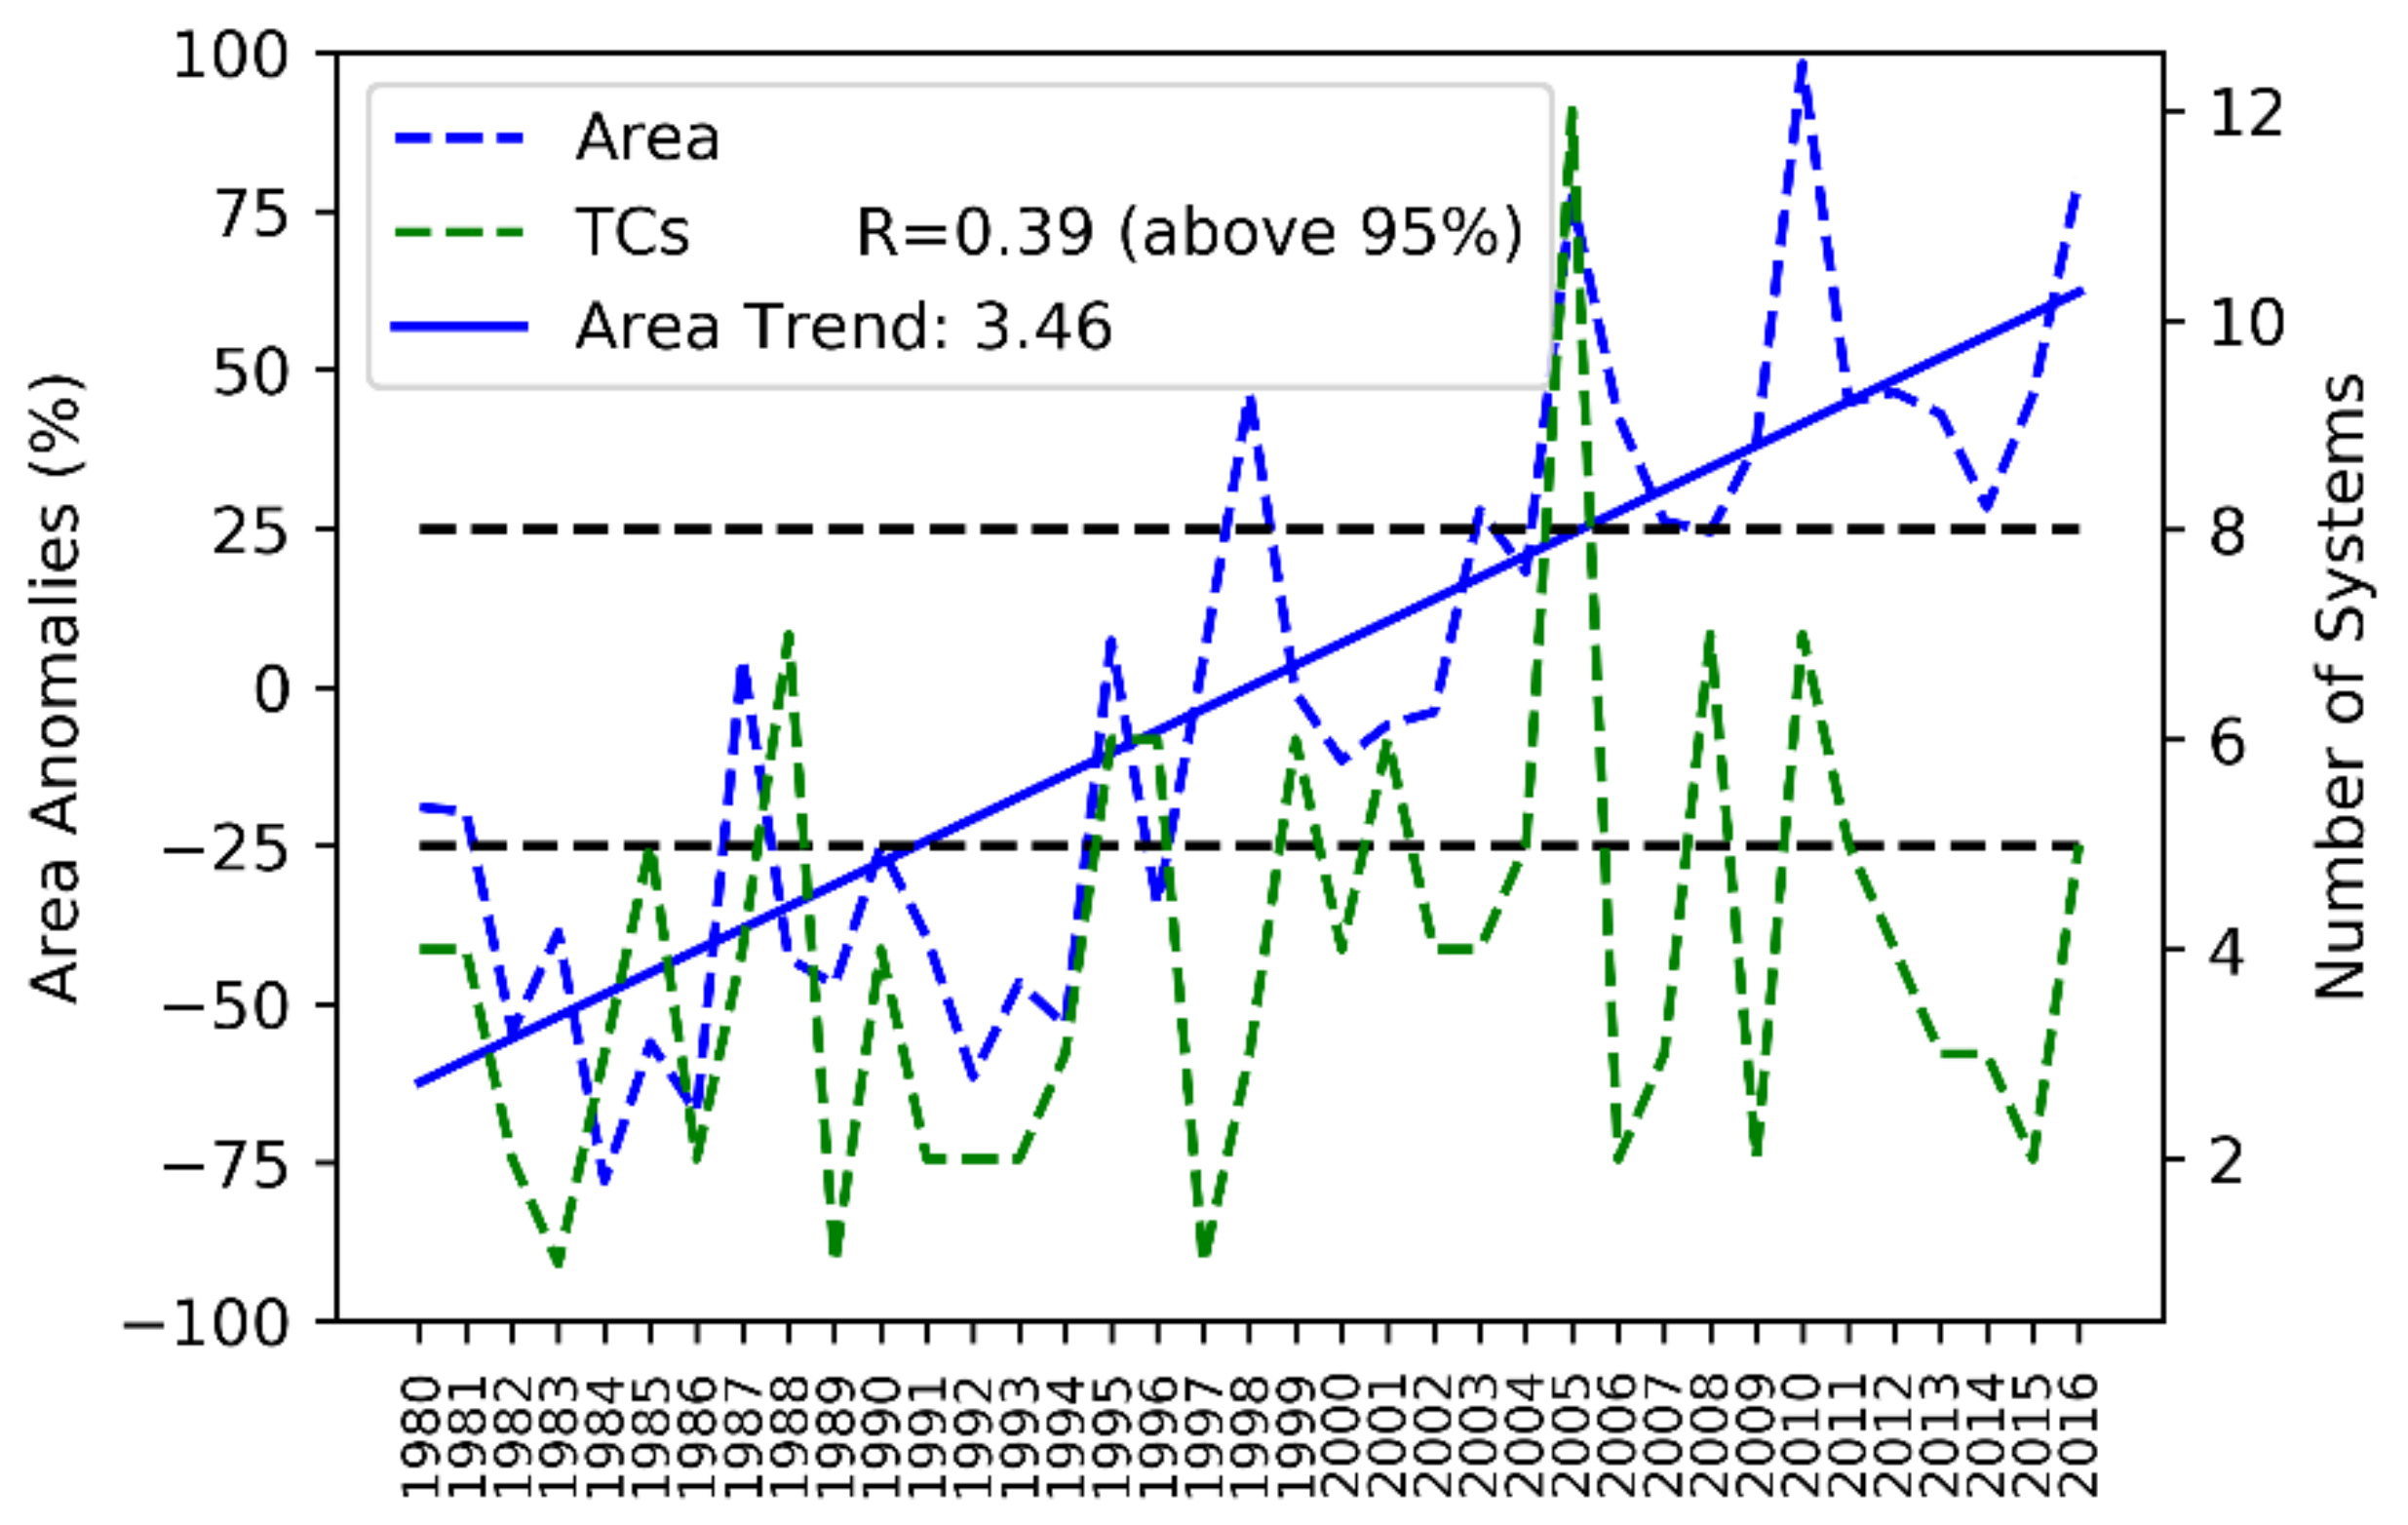
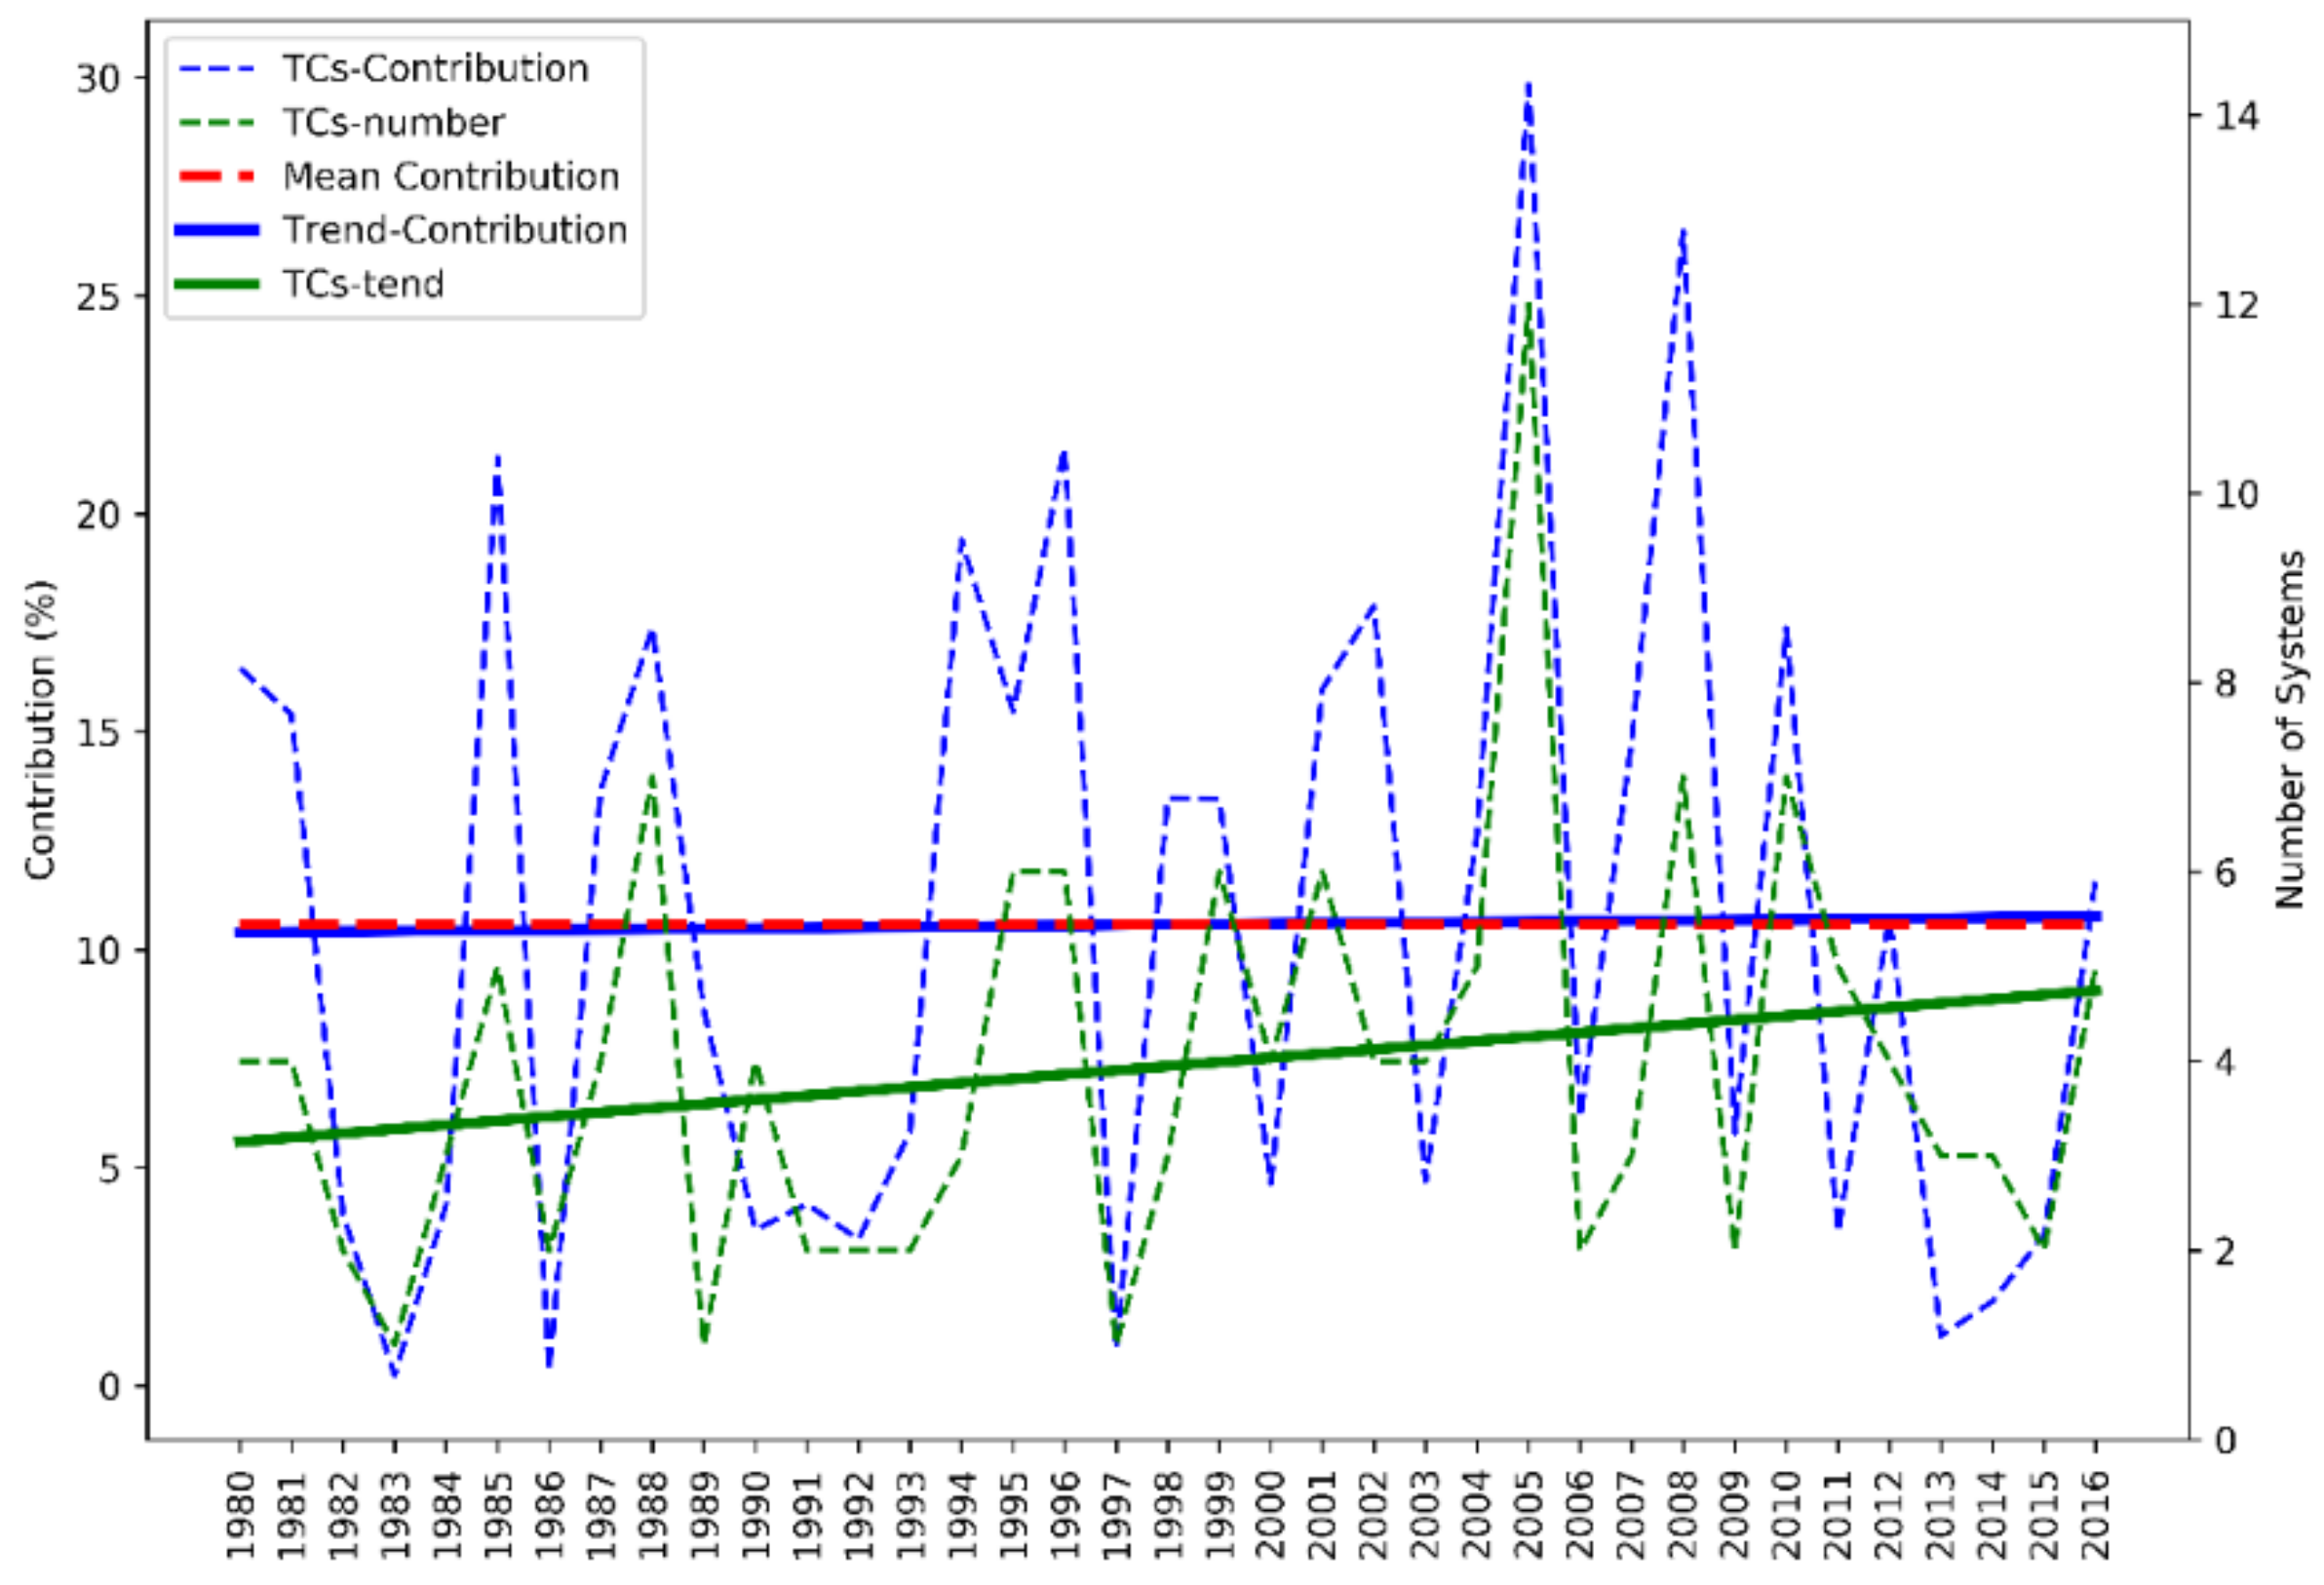
3.4. Interannual Variability of TC Effects, and their Contribution to Total Precipitation
4. Conclusions
Supplementary Materials
Author Contributions
Funding
Acknowledgments
Conflicts of Interest
References
- Smith, K.; Petley, N.D. Environmental Hazards: Assessing Risk and Reducing Disaster, 5th ed.; Routlegde: New York, NY, USA, 2009. [Google Scholar]
- Dominguez, C.; Magaña, V. The Role of Tropical Cyclones in Precipitation Over the Tropical and Subtropical North America. Front. Earth Sci. 2018, 19. [Google Scholar] [CrossRef] [Green Version]
- Aguilar, B.I. Los Servicios del Agua en el Norte de México en Gestión, Manejo Financiero y Aspectos Ambientales, 1st ed.; El Colegio de la Frontera Norte: Tijuana, Mexico, 2011. [Google Scholar]
- Trenberth, K.E.; Fasullo, J. Water and energy budgets of hurricanes and implications for climate change. J. Geophys. Res. 2007, 112, D23107. [Google Scholar] [CrossRef]
- Cerveny, R.S.; Newman, L.E. Climatological relationship between tropical cyclones and rainfall. Mon. Weather Rev. 2000, 128, 3329–3336. [Google Scholar] [CrossRef]
- Rogers, E.B.; Adler, R.F.; Pierce, H.F. Contribution to the North Pacific climatological rainfall as observed from satellites. J. Appl. Meteorol. 2000, 39, 1648–1678. [Google Scholar] [CrossRef]
- Jiang, H.; Zipser, E.J. Contribution to the global precipitation from eight seasons of TRMM data: Regional, seasonal and interannual variations. J. Clim. 2010, 23, 1526–1543. [Google Scholar] [CrossRef]
- Knight, D.B.; Davis, R.E. Climatology of tropical cyclone rainfall in the southeastern United States. Phys. Geogr. 2007, 28, 126–147. [Google Scholar] [CrossRef]
- Knight, D.B.; Davis, R.E. Contribution of tropical cyclones to extreme rainfall events in the southeastern United States. J. Geophys. Res. Atmos. 2009, 114, 1–17. [Google Scholar] [CrossRef] [Green Version]
- Kunkel, K.E.; Easterling, D.R.; Kristovich, D.A.R.; Gleason, B.; Stoecker, L.; Smith, R. Recent increases in U.S. heavy precipitation associated with tropical cyclones. Geophys. Res. Lett. 2010, 37, 2–5. [Google Scholar] [CrossRef]
- Villarini, G.; Smith, J.A. Flood peak distributions for the eastern United States. Water Resour. Res. 2010, 46. [Google Scholar] [CrossRef] [Green Version]
- Hernández, A.J.J.; Matyas, C.J. Spatial distribution of tropical cyclone rainfall and its contribution to the climatology of Puerto Rico. Phys. Geogr. 2017, 39, 1–20. [Google Scholar] [CrossRef]
- Lavender, S.L.; Abbs, D.J. Trends in Australian rainfall: Contribution of tropical cyclones and closed lows. Clim. Dyn. 2013, 40, 317–326. [Google Scholar] [CrossRef]
- Villarini, G.; Denniston, R.F. Contribution of tropical cyclones to extreme rainfall in Australia. Int. J. Clim. 2016, 36, 1019–1025. [Google Scholar] [CrossRef] [Green Version]
- Wu, Y.; Wu, S.; Zhai, P. The impact of tropical cyclones on Hainan Island’s extreme and total precipitation. Int. J. Clim. 2007, 27, 1059–1064. [Google Scholar] [CrossRef]
- Larson, J.; Zhou, Y.; Higgins, R.W. Characteristics of landfalling tropical cyclones in the United States and Mexico: Climatology and interannual variability. J. Clim. 2005, 18, 1247–1262. [Google Scholar] [CrossRef]
- Prat, O.P.; Nelson, B.R. Precipitation Contribution of Tropical Cyclones in the Southeastern United States from 1998 to 2009 Using TRMM Satellite Data. J. Clim. 2013, 26, 1047–1062. [Google Scholar] [CrossRef]
- Prat, O.P.; Nelson, B.R. On the link between tropical cyclones and daily rainfall extremes derived from global satellite observations. J. Clim. 2016, 29, 6127–6135. [Google Scholar] [CrossRef]
- Bagtasa, G. Contribution of tropical cyclones to rainfall in the Philippines. J. Clim. 2017, 30, 3621–3633. [Google Scholar] [CrossRef]
- Xu, G.; Osborn, T.J.; Matthews, A.J. Moisture transport by Atlantic tropical cyclones onto the North American continent. Clim. Dyn. 2017, 48, 3161–3182. [Google Scholar] [CrossRef] [Green Version]
- Shephard, J.M.; Grundstein, A.; Mote, T.L. Quantifying the contribution of tropical cyclones to extreme rainfall along the coastal southeastern United States. Geophys. Res. Lett. 2007, 34, L23810. [Google Scholar] [CrossRef]
- Englehart, P.J.; Douglas, A.V. The role of eastern North Pacific tropical storms in the rainfall climatology of western Mexico. Int. J. Clim. 2001, 21, 1357–1370. [Google Scholar] [CrossRef]
- Breña–Naranjo, J.A.; Pedrozo–Acuña, A.; Pozos–Estrada, O.; Jiménez–López, S.A.; López–López, M.R. The contribution of tropical cyclones to rainfall in Mexico. J. Phys. Chem. Earth 2015, 83, 111–122. [Google Scholar] [CrossRef]
- Knaff, J.A. Implications of summertime sea level pressure anomalies in the tropical Atlantic region. J. Clim. 1997, 10, 789–804. [Google Scholar] [CrossRef] [Green Version]
- Chiang, J.C.H.; Vimont, D.J. Analogous meridional modes of atmosphere–ocean variability in the tropical Pacific and tropical Atlantic. J. Clim. 2004, 17, 4143–4158. [Google Scholar] [CrossRef]
- Colbert, A.J.; Soden, B.J. Climatological variations in North Atlantic tropical cyclone tracks. J. Clim. 2012, 25, 657–673. [Google Scholar] [CrossRef]
- Elsner, J.B. Tracking hurricanes. Bull. Am. Meteorol. Soc. 2003, 84, 353–356. [Google Scholar] [CrossRef] [Green Version]
- Kossin, J.P.; Camargo, S.J.; Sitkowski, M. Climate modulation of North Atlantic hurricane tracks. J. Clim. 2010, 23, 3057–3076. [Google Scholar] [CrossRef]
- Wallace, J.M.; Gutzler, D.S. Teleconnections in the geopotential height field during the Northern Hemisphere winter. Mon. Weather Rev. 1981, 109, 784–812. [Google Scholar] [CrossRef]
- Barnston, A.G.; Livezey, R.E. Classification, seasonality and persistence of low–frequency atmospheric circulation pattern. Mon. Weather Rev. 1987, 115, 1083–1126. [Google Scholar] [CrossRef]
- Wang, C.; Lee, S.K. Atlantic warm pool, Caribbean low–level jet, and their potential impact on Atlantic hurricanes. Geophys. Res. Lett. 2007, 34, L02703. [Google Scholar] [CrossRef] [Green Version]
- Deser, C.; Alexander, M.A.; Xie, S.P.; Phillips, A.S. Sea surface temperature variability: Patterns and mecha–nisms. Annu. Rev. Mar. Sci. 2010, 2, 115–143. [Google Scholar] [CrossRef] [Green Version]
- Lim, Y.K.; Schubert, S.D.; Reale, O.; Molod, A.M.; Suarez, M.J.; Auer, B.M. Large–Scale Controls on Atlantic Tropical Cyclone Activity on Seasonal Time Scales. J. Clim. 2016, 29, 6727–67494. [Google Scholar] [CrossRef]
- Córdova, O.L.G.; Sorí, R.G.; Galardy, R.Z. Chronolgy, seasonality and Magnitude and cyclons that have affected the province of Ciego de Ávila, period 1981–2012. Univ. Cienc. 2013, 2, 17–34. [Google Scholar]
- Hidalgo–Mayo, A.; Calzadilla–Meriño, D.; Pérez–Rivas, G. Climatology of tropical cyclones in Holguín province. Cienc. Holguín 2013, 3, 1–12. [Google Scholar]
- Sacasas, C.L. Hazard of hurricanes in Cuba with the use of a GIS. Ing. Hidráulica Ambient. 2013, 3, 95–104. [Google Scholar]
- González–Ramírez, C.M.; Ramos–Guadalupe, L.E. Chronology of tropical storms and hurricanes to be affected Havana. Rev. Cuba. Meteorol. 2019, 25, 3, 469–480. [Google Scholar]
- Marcelo, G.C.G.; Rodríguez, A.A. Characterization of North Atlantic hurricanes that have affected the provinces of Artemisa, Havana and Mayabeque between 1791 and 2018. Rev. Cuba. Meteorol. 2020, 26, 3, 1–7. [Google Scholar]
- Villasol, A.; Beltrán, J. Caribbean Islands, GIWA Regional Assessement 4; Fortnam, M., Blime, P., Eds.; United Nations Environment Programme, University of Kalmar: Kalmar, Sweden, 2004. [Google Scholar]
- EcuRed Contributors, “República de Cuba,” EcuRed. Available online: https://www.ecured.cu/Rep%C3%BAblica_de_Cuba (accessed on 25 July 2020).
- Lehner, B.; Reidy, C.L.; Revenga, C.; Vörösmarty, C.; Fekete, B.; Crouzet, P.; Döll, P.; Endejan, M.; Frenken, K.; Magome, J.; et al. High–resolution mapping of the world’s reservoirs and dams for sustainable river–flow management. Front. Ecol. Environ. 2011, 9, 494–502. [Google Scholar] [CrossRef] [Green Version]
- Lecha, L.B.; Paz, L.; Lapinel, B. The Climate of Cuba; Editorial Academia: La Habana, Cuba, 1994; 186p, ISBN 9590200060. [Google Scholar]
- Durán, I.L. Comportamiento de la Precipitación en Estaciones Meteorológicas Seleccionadas de Cuba. Bachelor’s Thesis, Facultad de Geografía, Universidad de la Habana, La Habana, Cuba, 2012. Available online: https://www.researchgate.net/publication/322235859_Comportamiento_de_las_precipitaciones_en_Cuba_Periodo_1972–2010 (accessed on 11 August 2018).
- Martinez, C.; Goddard, L.; Kushnir, Y.; Ting, M. Seasonal climatology and dynamical mechanisms of rainfall in the Caribbean. Clim. Dyn. 2019, 53, 825–846. [Google Scholar] [CrossRef] [Green Version]
- Gamble, D.W.; Parnellb, D.B.; Curtis, S. Spatial variability of the Caribbean mid–summer drought and relation to north Atlantic high circulation. Int. J. Clim. 2008, 28, 343–350. [Google Scholar] [CrossRef]
- Álvarez, A.; Herrera, R.S.; Noda, A.C.; Díaz, L. Comportamiento de las precipitaciones en el Instituto de Ciencia Animal en Cuba durante el período 1970–2009, como base para el manejo estratégico de los pastos. Rev. Cuba. Cienc. Agrícola 2012, 46, 3, 301–307. [Google Scholar]
- Cabrera, J.A.; Zuaznábar, R. The impact of sugarcane monoculture with pre–harvest burning and nitrogen fertilization on the environment. I. Carbon balance. Cultiv. Trop. 2010, 31, 5–13. [Google Scholar]
- Landsea, C.W.; Franklin, J.L. Atlantic Hurricane Database Uncertainty and Presentation of a New Database Format. Mon. Weather Rev. 2013, 141, 3576–3592. [Google Scholar] [CrossRef]
- Atlantic Hurricane Database (HURDAT2) 1851–2019. Available online: https://www.nhc.noaa.gov/data/#hurdat (accessed on 10 May 2020).
- Beck, H.E.; Wood, E.F.; Pan, M.; Fisher, C.K.; Miralles, D.G.; van Dijk, A.I.J.M.; McVicar, T.R.; Adler, R.F. MSWEP V2 Global 3–Hourly 0.1° Precipitation: Methodology and Quantitative Assessment. Bull. Am. Meteorol. Soc. 2019, 100, 473–500. [Google Scholar] [CrossRef] [Green Version]
- Beck, H.E.; van Dijk, A.I.J.M.; Levizzani, V.; Schellekens, J.; Miralles, D.G.; Martens, B.; de Roo, A. MSWEP: 3–hourly 0.25° global gridded precipitation (1979–2015) by merging gauge, satellite, and reanalysis data. Hydrol. Earth Syst. Sci. 2017, 21, 589–615. [Google Scholar] [CrossRef] [Green Version]
- Gloh2o: Toward Locally Relevant Global Hydrological Simulations. Available online: http://www.gloh2o.org/ (accessed on 20 July 2020).
- Xie, L.; Yan, T.; Pietrafesa, L.J.; Morrison, J.M.; Karl, T. Climatology and Interannual Variability of North Atlantic Hurricane Tracks. J. Clim. 2005, 18, 5370–5381. [Google Scholar] [CrossRef]
- Wang, C.; Enfield, D.B.; Lee, S.K.; Landsea, C.W. Influences of the Atlantic Warm Pool on Western Hemisphere Summer Rainfall and Atlantic Hurricanes. J. Clim. 2006, 19, 2011–3028. [Google Scholar] [CrossRef]
- Smith, C.A.; Sardeshmukh, P. The Effect of ENSO on the Intraseasonal Variance of Surface Temperature in Winter. Int. J. Clim. 2000, 20, 1543–1557. [Google Scholar] [CrossRef]
- Bivariate ENSO Timeseries or the “BEST” ENSO Index. Available online: https://psl.noaa.gov/people/cathy.smith/best/ (accessed on 22 July 2020).
- North Atlantic Oscilation. Available online: https://www.cpc.ncep.noaa.gov/products/precip/CWlink/pna/nao.shtml (accessed on 22 July 2020).
- Monthly Climate Timeseries: Atlantic Meridional Mode (AMM) SST Index. Available online: https://psl.noaa.gov/data/timeseries/monthly/AMM/ (accessed on 22 July 2020).
- Patricola, C.M.; Saravanan, R.; Chang, P. The impact of the El Niño–Southern Oscillation and Atlantic meridional mode on seasonal Atlantic tropical cyclone activity. J. Clim. 2014, 27, 5311–5328. [Google Scholar] [CrossRef]
- Muñoz, D.D.; Rodrigo, F.S. Effects of the North Atlantic Oscillation on the probability for climatic categories of local monthly rainfall in southern Spain. Int. J. Clim. 2003, 23, 381–397. [Google Scholar] [CrossRef]
- Wang, C.; Enfield, D.B. The tropical hemisphere warm pool. Geophys. Res. Lett 2001, 28, 1635–1638. [Google Scholar] [CrossRef]
- Wang, C.; Enfield, D.B. A further study of the tropical Western Hemisphere Warm Pool. J. Clim. 2003, 16, 1476–1493. [Google Scholar] [CrossRef] [Green Version]
- Folland, C.K.; Parker, D.E. Correction of instrumental biases in historical sea surface temperature data. Q. J. R. Meteorol. Soc. 1995, 121, 319–367. [Google Scholar] [CrossRef]
- Ishii, M.; Shouji, A.; Sugimoto, S.; Matsumoto, T. Objective Analyses of Sea–Surface Temperature and Marine Meteorological Variables for the 20th Century using ICOADS and the Kobe Collection. Int. J. Clim. 2005, 25, 865–879. [Google Scholar] [CrossRef]
- Characteristics of Global Sea Surface Temperature Analysis Data (COBE–SST) for Climate Use; Monthly Report on Climate System; Japan Meteorological Agency: Tokyo, Japan, 2006; Volume 12, 116p.
- Physical Sciences Laboratory of the National Oceanic and Atmospheric Administration (NOAA). Available online: https://psl.noaa.gov/data/gridded/data.cobe2.html (accessed on 30 July 2020).
- Zhang, W.; Vecchi, G.A.; Murakami, H.; Villarini, G.; Delworth, T.L.; Yang, X.; Jia, L. Dominant role of atlantic multidecadal oscillation in the recent decadal changes in Western North Pacific tropical cyclone activity. Geophys. Res. Lett. 2018, 45, 354–362. [Google Scholar] [CrossRef]
- The Saffir–Simpson Hurricane Wind Scale National Hurricane Center. Available online: https://www.nhc.noaa.gov/aboutsshws.php (accessed on 25 July 2020).
- Turlach, B.A. Bandwidth Selection in Kernel Density Estimation: A Review; CORE and Institut Statistique, Université Catholique de Louvain: Louvain–la–Ncuve, Belgium, 1993; pp. 1–33. [Google Scholar]
- Beven, J.L., II; Kimberlain, T.B. National Hurricane Center Tropical Cyclone Report—Hurricane Gustav (AL072008) 25 August–4 September 2008; National Hurricane Center: Miami, FL, USA, 2009. [Google Scholar]
- Berg, R. Tropical Cyclone Report—Hurricane Ike (AL092008) 1–14 September 2008; National Hurricane Center: Miami, FL, USA, 2009. [Google Scholar]
- Brennan, M.J. Tropical Cyclone Report—Hurricane Paloma 5–9 November 2008 (AL172008); National Hurricane Center: Miami, FL, USA, 2009. [Google Scholar]
- Durán, I.L. Amount of rainy days and its distribution by intervals in normal conditions and severe drought in the western part of Cuba. Rev. Cuba. Meteorol. 2016, 22, 1, 49–65. [Google Scholar]
- Lonfat, M.; Marks, F.D.; Chen, S.S. Precipitation distribution in tropical cyclones using the Tropical Rainfall Measuring Mission (TRMM) Microwave Imager: A global perspective. Mon. Weather Rev. 2004, 132, 1645–1660. [Google Scholar] [CrossRef]
- Shapiro, L.J. The asymmetric boundary layer flow under a translating hurricane. J. Atmos. Sci. 1983, 40, 1984–1998. [Google Scholar] [CrossRef] [Green Version]
- Krishnamurthy, L.; Vecchi, G.A.; Msadek, R.; Murakami, H.; Wittenberg, A.; Zeng, F. Impact of Strong ENSO on Regional Tropical Cyclone Activity in a High–Resolution Climate Model in the North Pacific and North Atlantic Oceans. J. Clim. 2016, 29, 2375–2394. [Google Scholar] [CrossRef]


| June | July | August | September | October | November | |
|---|---|---|---|---|---|---|
| No. of TCs | 15 | 19 | 39 | 32 | 28 | 13 |
| Range of total rainfall (mm) | 85–350 | 45–250 | 85–250 | 85–350 | 110–350 | 20–250 |
| Range of precipitation of TCs (mm) | 0.5–45 | 3–20 | 10–45 | 10–85 | 10–65 | 10–45 |
| Range of the contribution of TCs to total precipitation (%) | 0–15 | 55–10 | 5–25 | 5–25 | 10–33 | 10–50 |
Publisher’s Note: MDPI stays neutral with regard to jurisdictional claims in published maps and institutional affiliations. |
© 2020 by the authors. Licensee MDPI, Basel, Switzerland. This article is an open access article distributed under the terms and conditions of the Creative Commons Attribution (CC BY) license (http://creativecommons.org/licenses/by/4.0/).
Share and Cite
Fernández–Alvarez, J.C.; Sorí, R.; Pérez–Alarcón, A.; Nieto, R.; Gimeno, L. The Role of Tropical Cyclones on the Total Precipitation in Cuba during the Hurricane Season from 1980 to 2016. Atmosphere 2020, 11, 1156. https://doi.org/10.3390/atmos11111156
Fernández–Alvarez JC, Sorí R, Pérez–Alarcón A, Nieto R, Gimeno L. The Role of Tropical Cyclones on the Total Precipitation in Cuba during the Hurricane Season from 1980 to 2016. Atmosphere. 2020; 11(11):1156. https://doi.org/10.3390/atmos11111156
Chicago/Turabian StyleFernández–Alvarez, José C., Rogert Sorí, Albenis Pérez–Alarcón, Raquel Nieto, and Luis Gimeno. 2020. "The Role of Tropical Cyclones on the Total Precipitation in Cuba during the Hurricane Season from 1980 to 2016" Atmosphere 11, no. 11: 1156. https://doi.org/10.3390/atmos11111156
APA StyleFernández–Alvarez, J. C., Sorí, R., Pérez–Alarcón, A., Nieto, R., & Gimeno, L. (2020). The Role of Tropical Cyclones on the Total Precipitation in Cuba during the Hurricane Season from 1980 to 2016. Atmosphere, 11(11), 1156. https://doi.org/10.3390/atmos11111156