Precipitation Nowcasting with Weather Radar Images and Deep Learning in São Paulo, Brasil


Abstract
:1. Introduction
2. Materials and Methods
2.1. Dataset
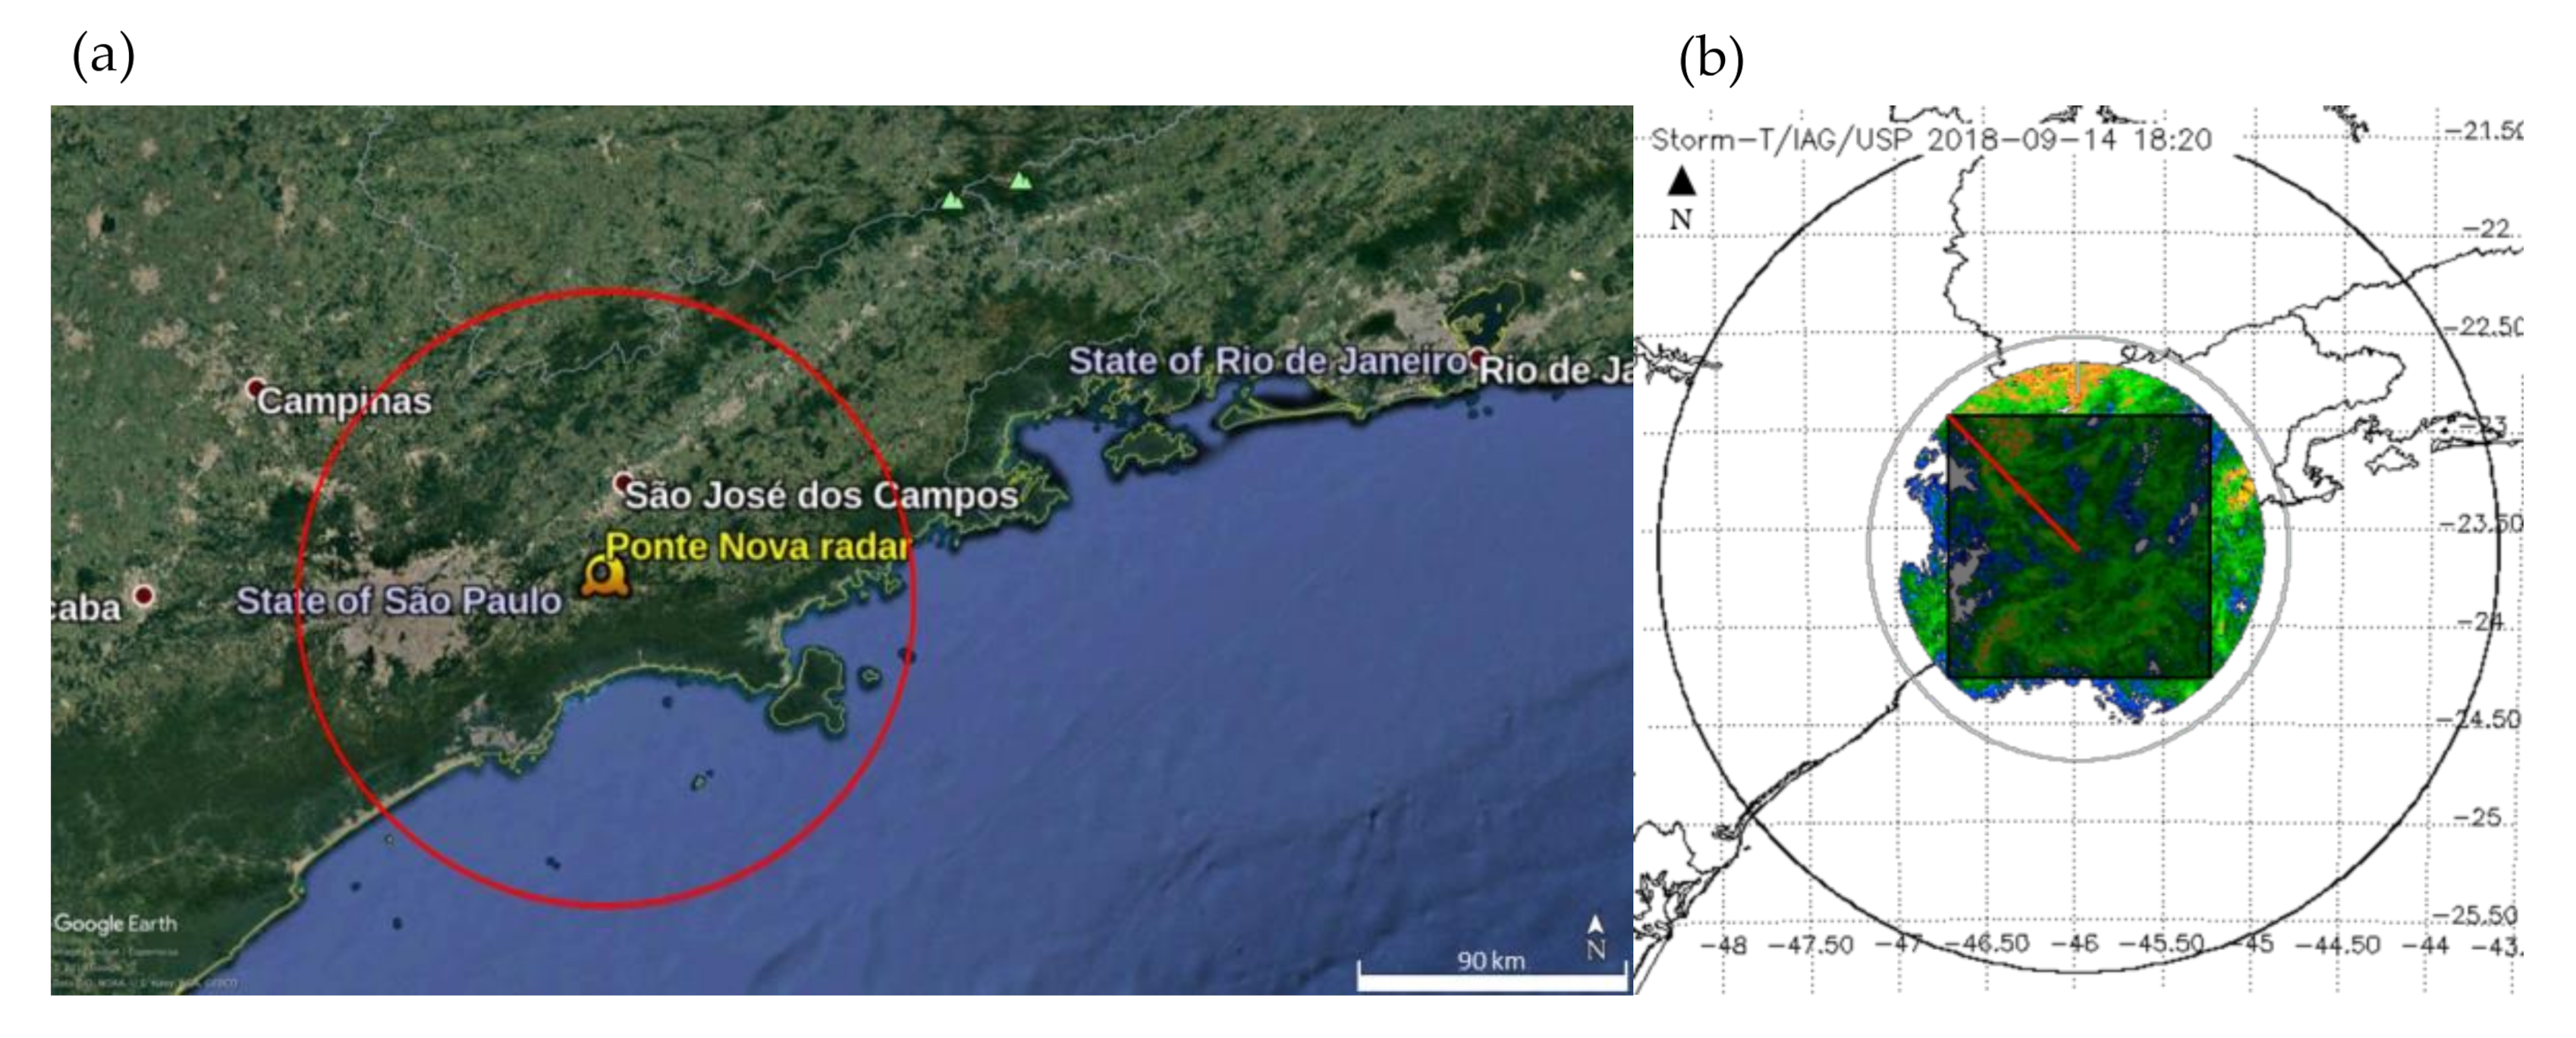
- Transformation from polar to Cartesian coordinates: with the objective of obtaining images on a regular grid, with a horizontal grid resolution of 4 km per pixel (the matrix had 40 × 40 pixels). Thus, each new image represents a matrix of Cartesian coordinates with 4 × 4 km2 resolution;
- Defining the boundaries: To utilize a regular square grid and eliminate the area without data as measured by radar, the images were cut into a square inscribed in a circle of 100 km (Figure 1);
- Normalization of the reflectivity values: Reflectivity values range typically from 0 to 60 dBZ. To obtain values of reflectivity in the interval (0,1), the data were divided by 60.
- Organization of datasets with a time interval of 15 min: train (2016, 2017 and 2019), validation (from March 2015 to December 2015) and test (2018).
2.2. Models
2.2.1. ENCAST
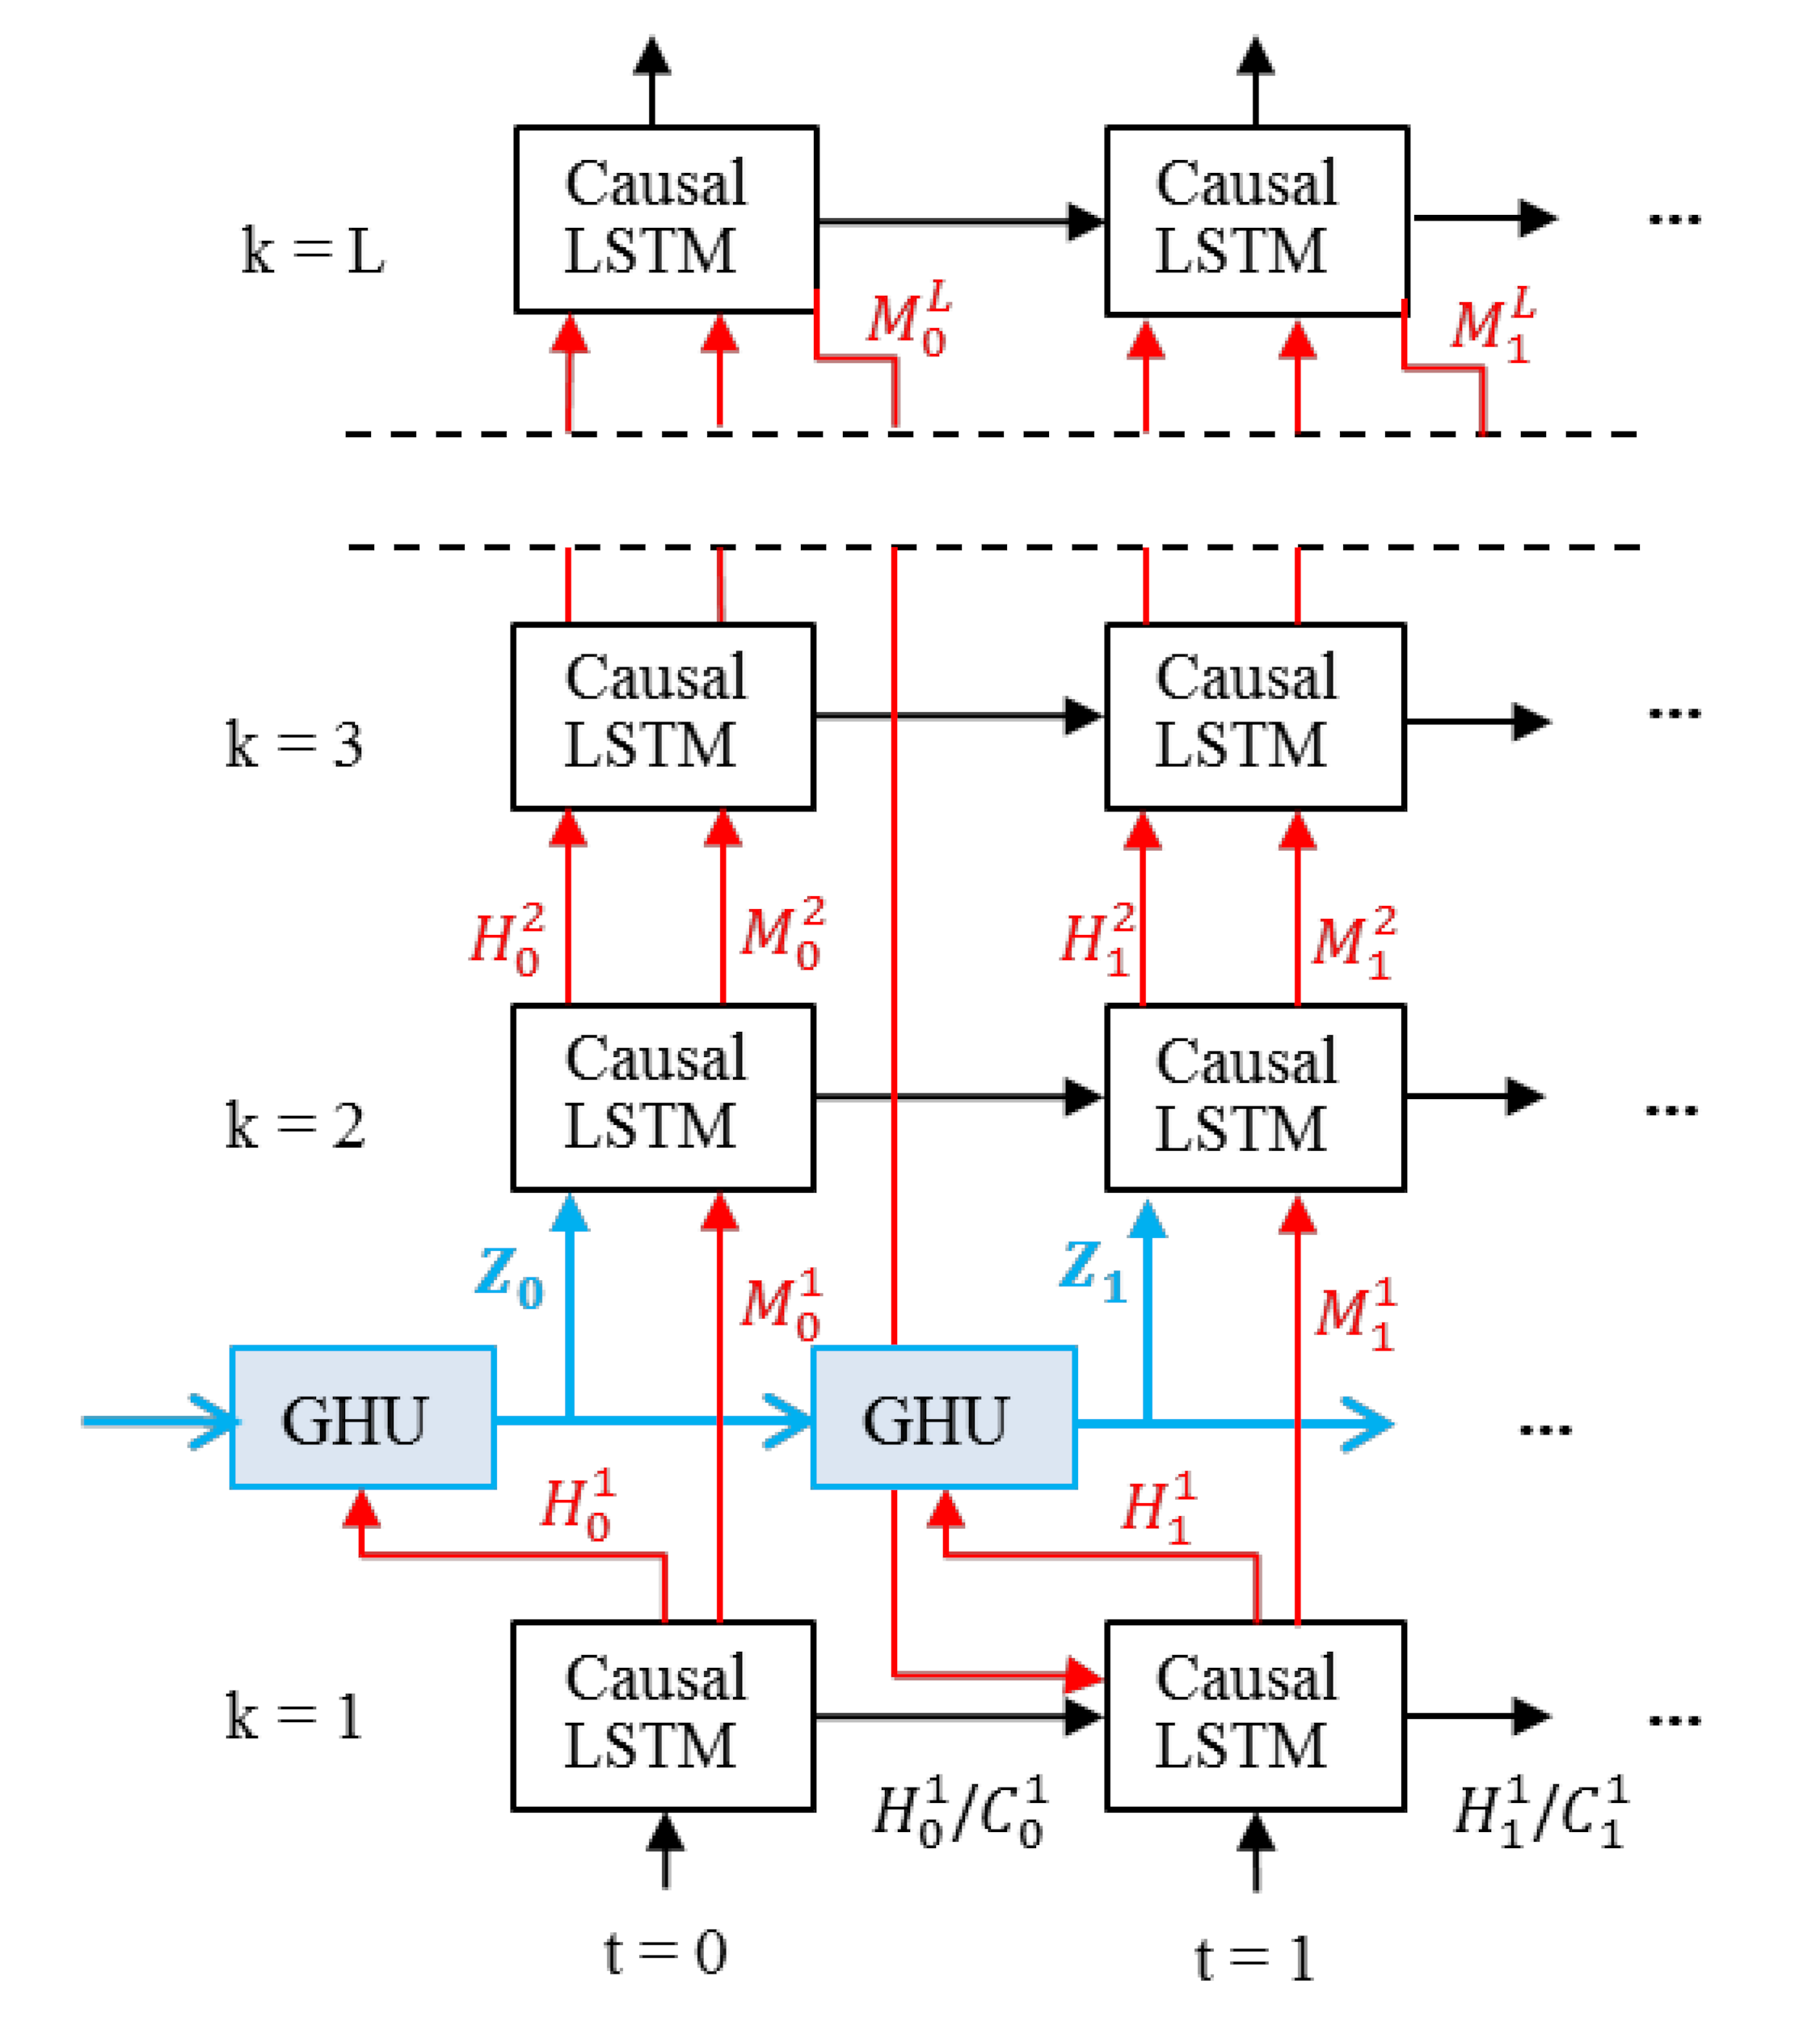
2.2.2. PredRNN++
3. Experimental Setup
- 1 dBZ for reflectivity predicted and observed;
- 10 dBZ for reflectivity predicted and 20 dBZ for reflectivity observed (the choice of the predicted threshold is explained in the results section). These values are compared with the ENCAST forecast;
- 1 mm/h for precipitation predicted from ENCAST, and 20 dBZ for reflectivity observed.

| Observed | |||
| YES | NO | ||
| Predicted | YES | TP | FP |
| NO | FN | TN | |
- TP: corresponds to the number of observed positive events (yes) that were correctly predicted;
- FP: corresponds to the number of observed negative events (no) that were predicted incorrectly;
- FN: corresponds to the number of observed positive events that were not predicted;
- TN: corresponds to the number of observed negative events that were correctly predicted as negative.
- 1.
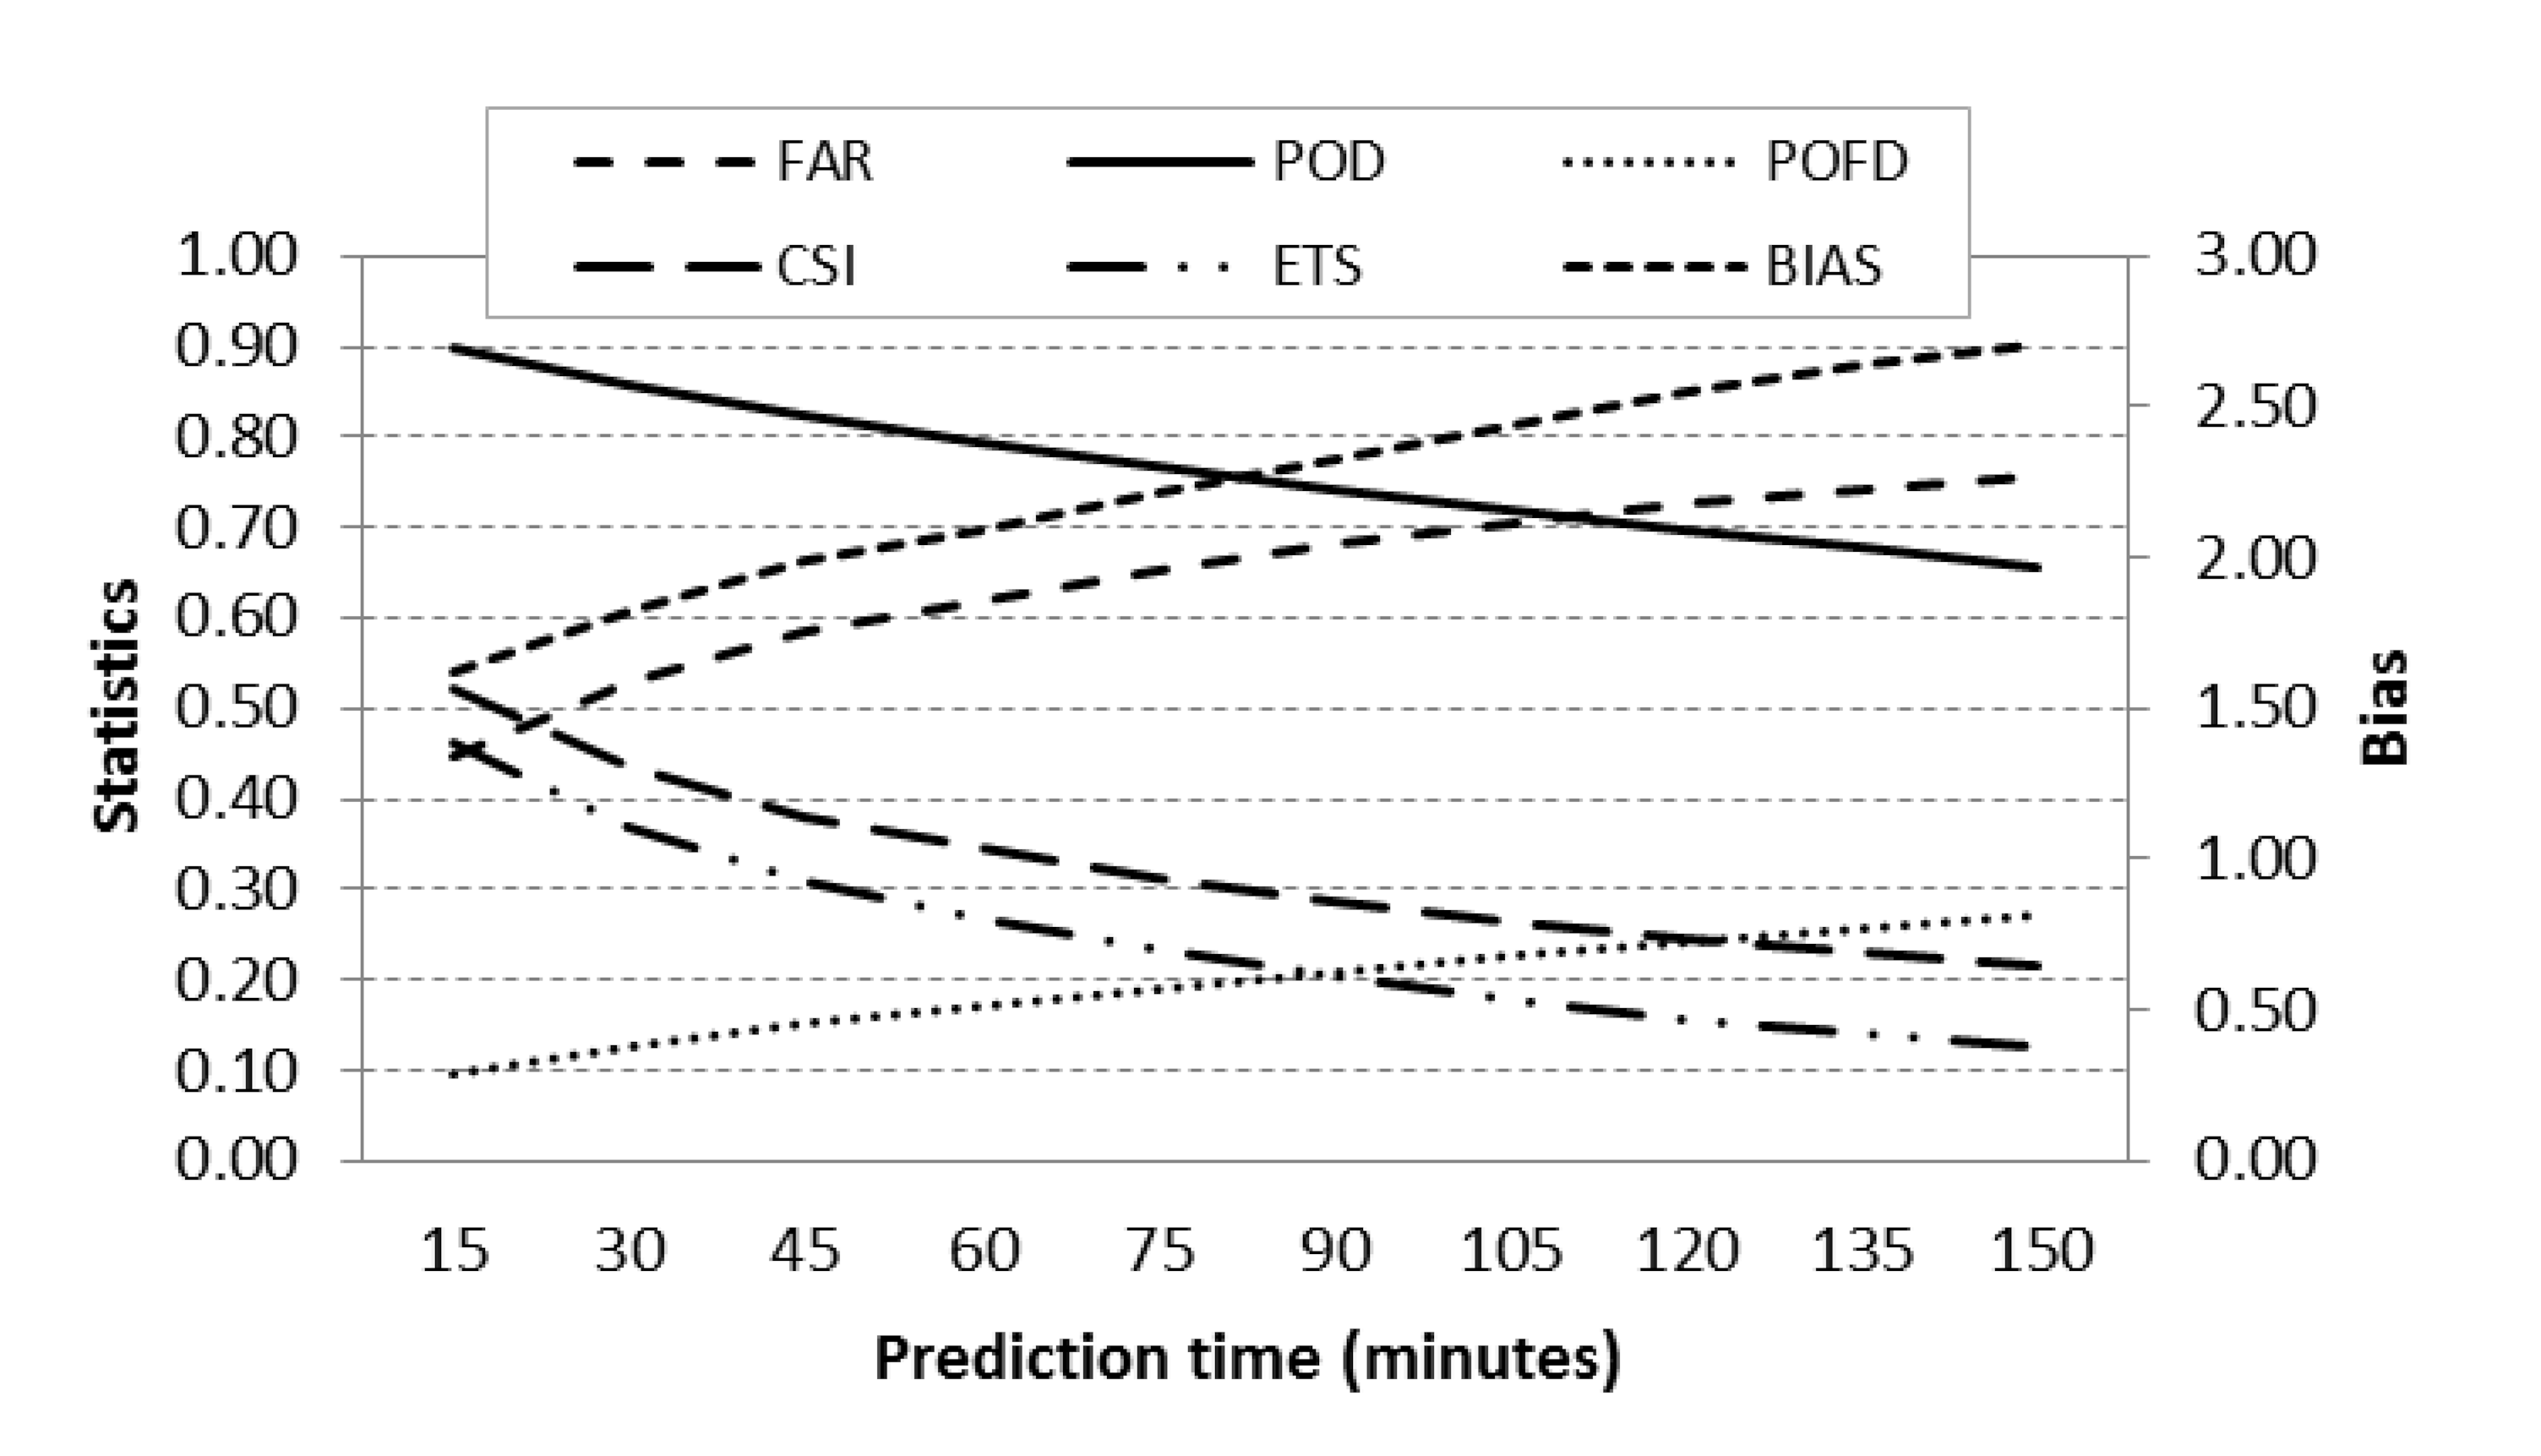
- The Probability Of Detection (POD) or Recall: the fraction of observed positive events that were correctly predicted. The range of possible values is 0 to 1, where the best possible POD is 1 and the worst is 0.
- 2.
- The False Alarm Rate (FAR): the fraction of predicted positive events that did not occur. The range of possible values is 0 to 1, where the best possible FAR is 0 and the worst is 1.
- 3.
- The Probability Of False Detection (POFD) or the probability of false alarm: the fraction of observed negative events that were incorrectly predicted as positive. The range of possible values is 0 to 1, where the best possible POFD is 0 and the worst is 1.
- 4.
- The Bias score: the ratio between the number of predicted positive events and the number of observed positive events. This indicates how many times the number of predicted positive events exceeds the number of observed positive events [44]. BIAS = 1 indicates unbiased forecast, BIAS > 1 overforecast and BIAS < 1 underforecast.
- 5.
- The Critical Success Index (CSI), also known as the Threat Score: the ratio of correctly predicted observed positive events by the total number of positive events, predicted or needed. The CSI is an alternative to the POD when the positive event occurs substantially less than the negative event [44]. The CSI depends on the number of TNs compared to the total number of cases [45]. The range of possible values is 0 to 1, where the best possible CSI is 1 and the worst is 0.where:
- 6.
4. Results and Discussion
4.1. Evaluation of the Models
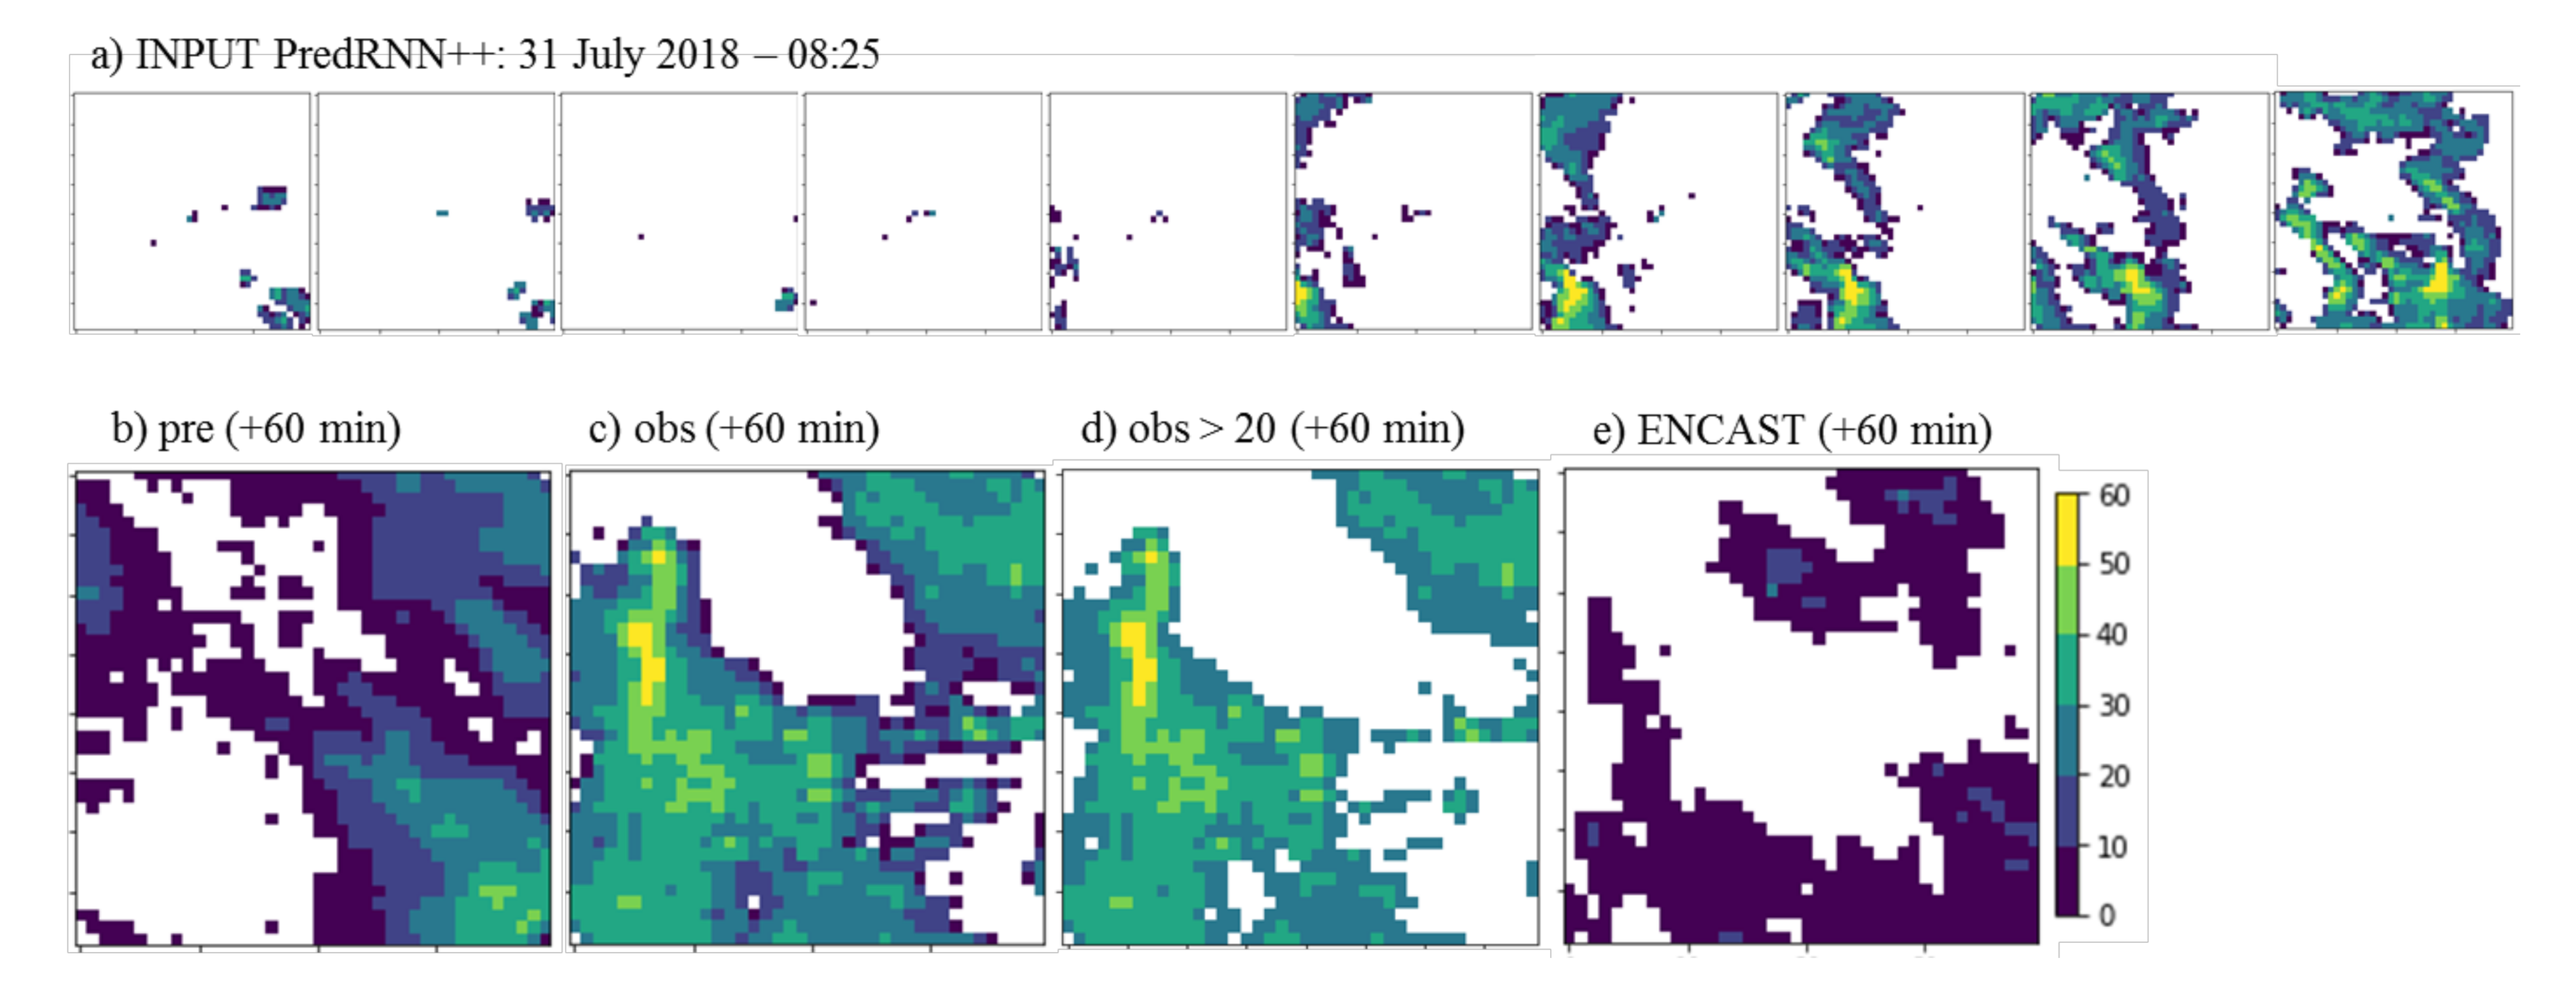
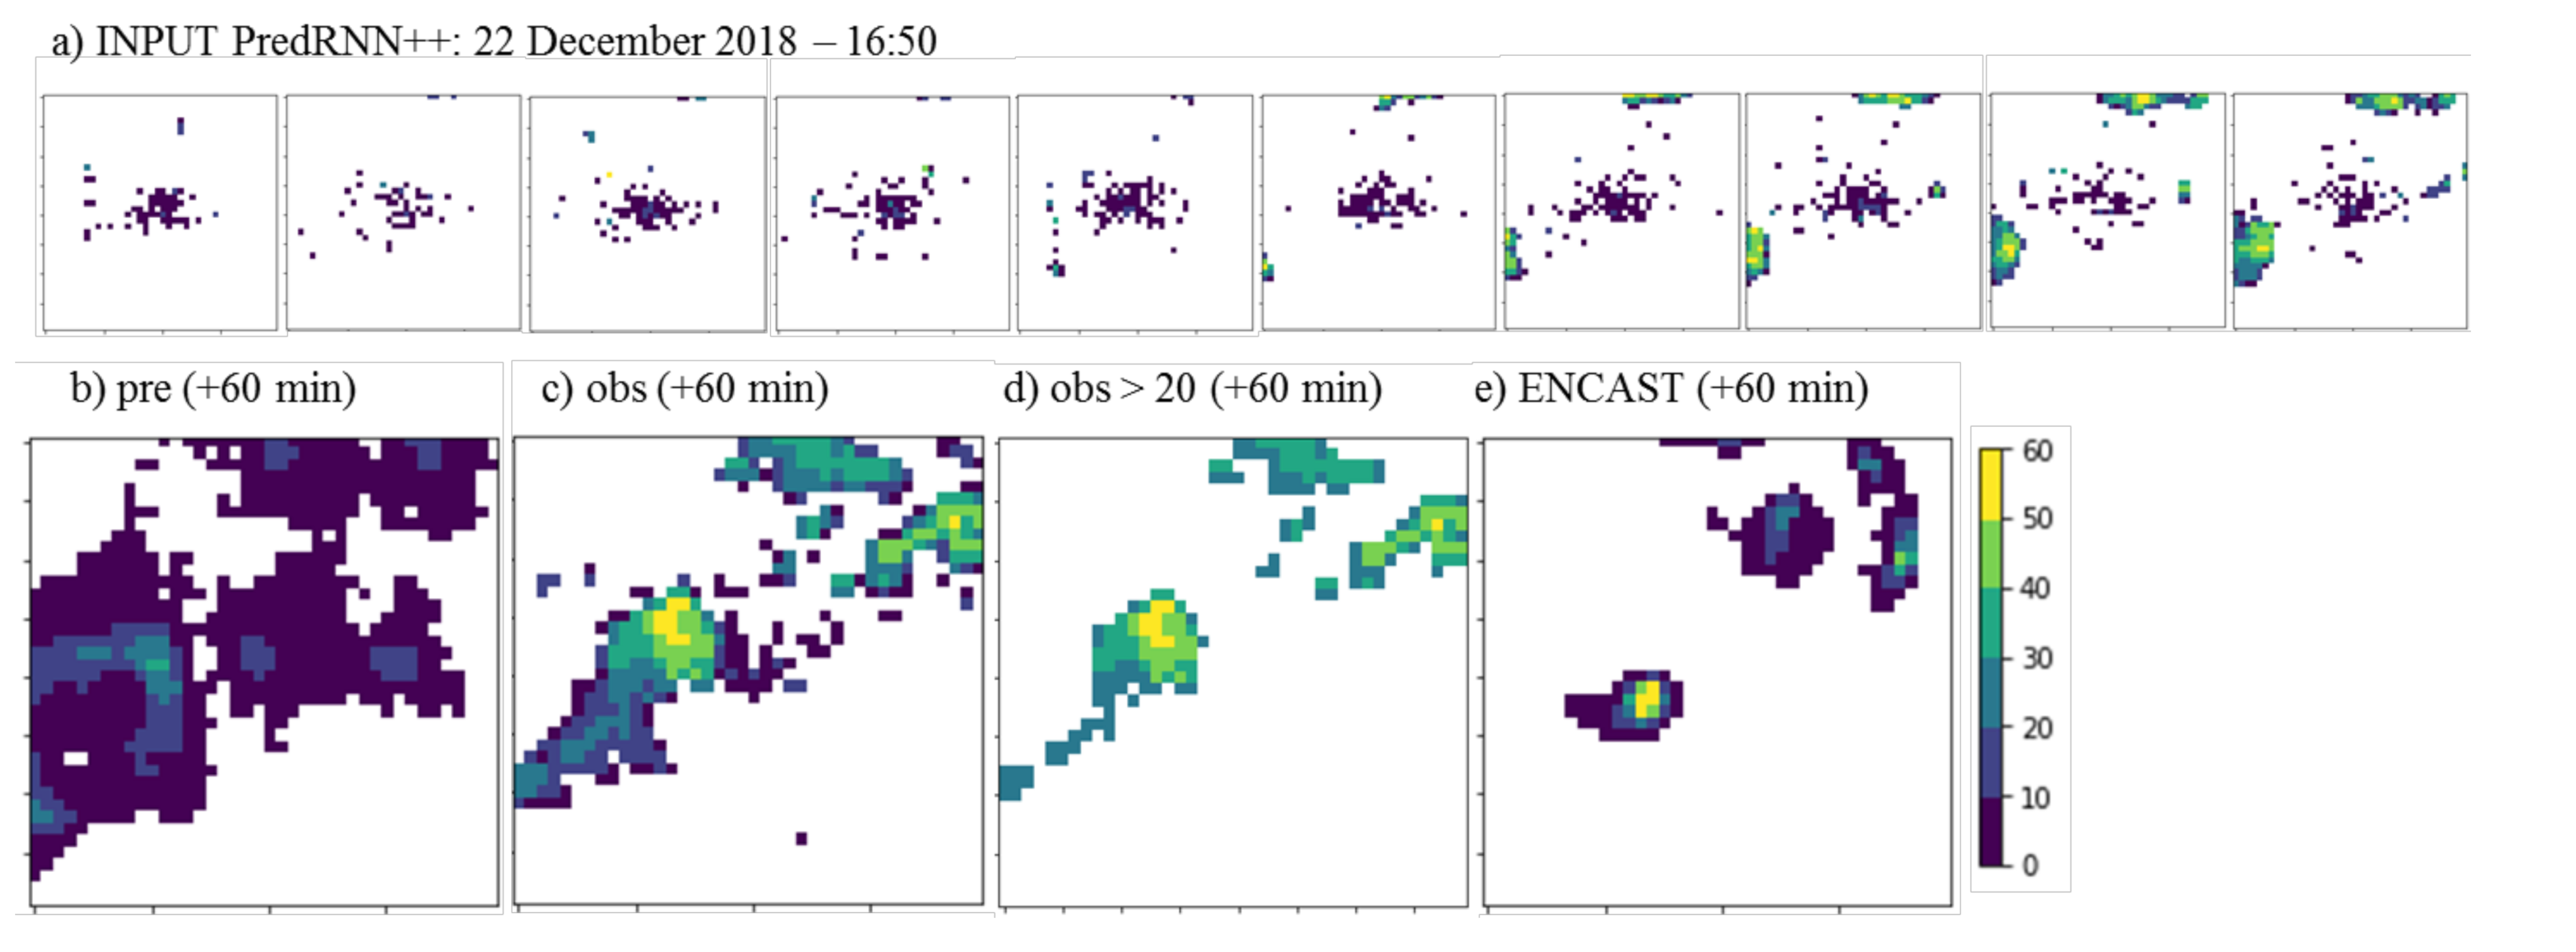
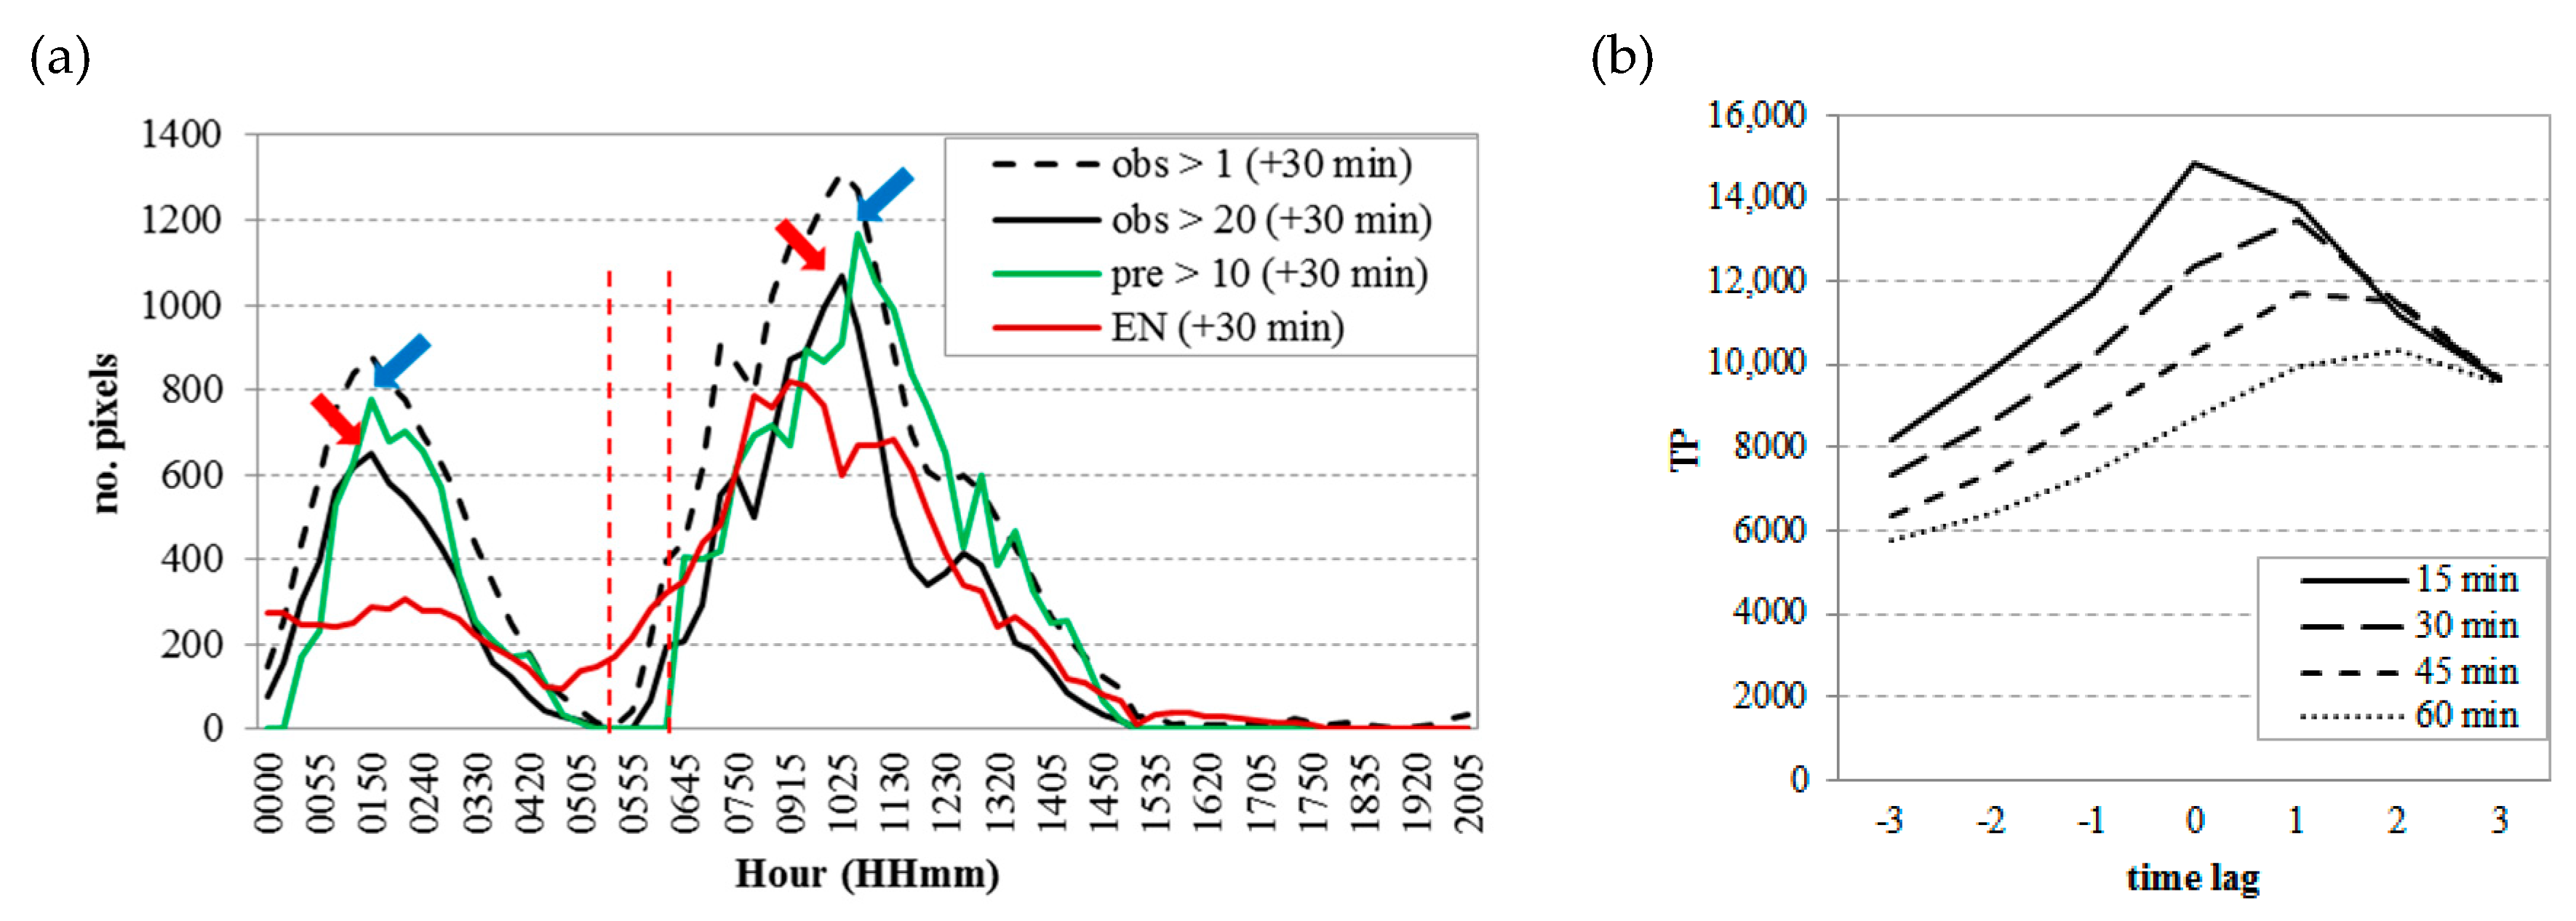
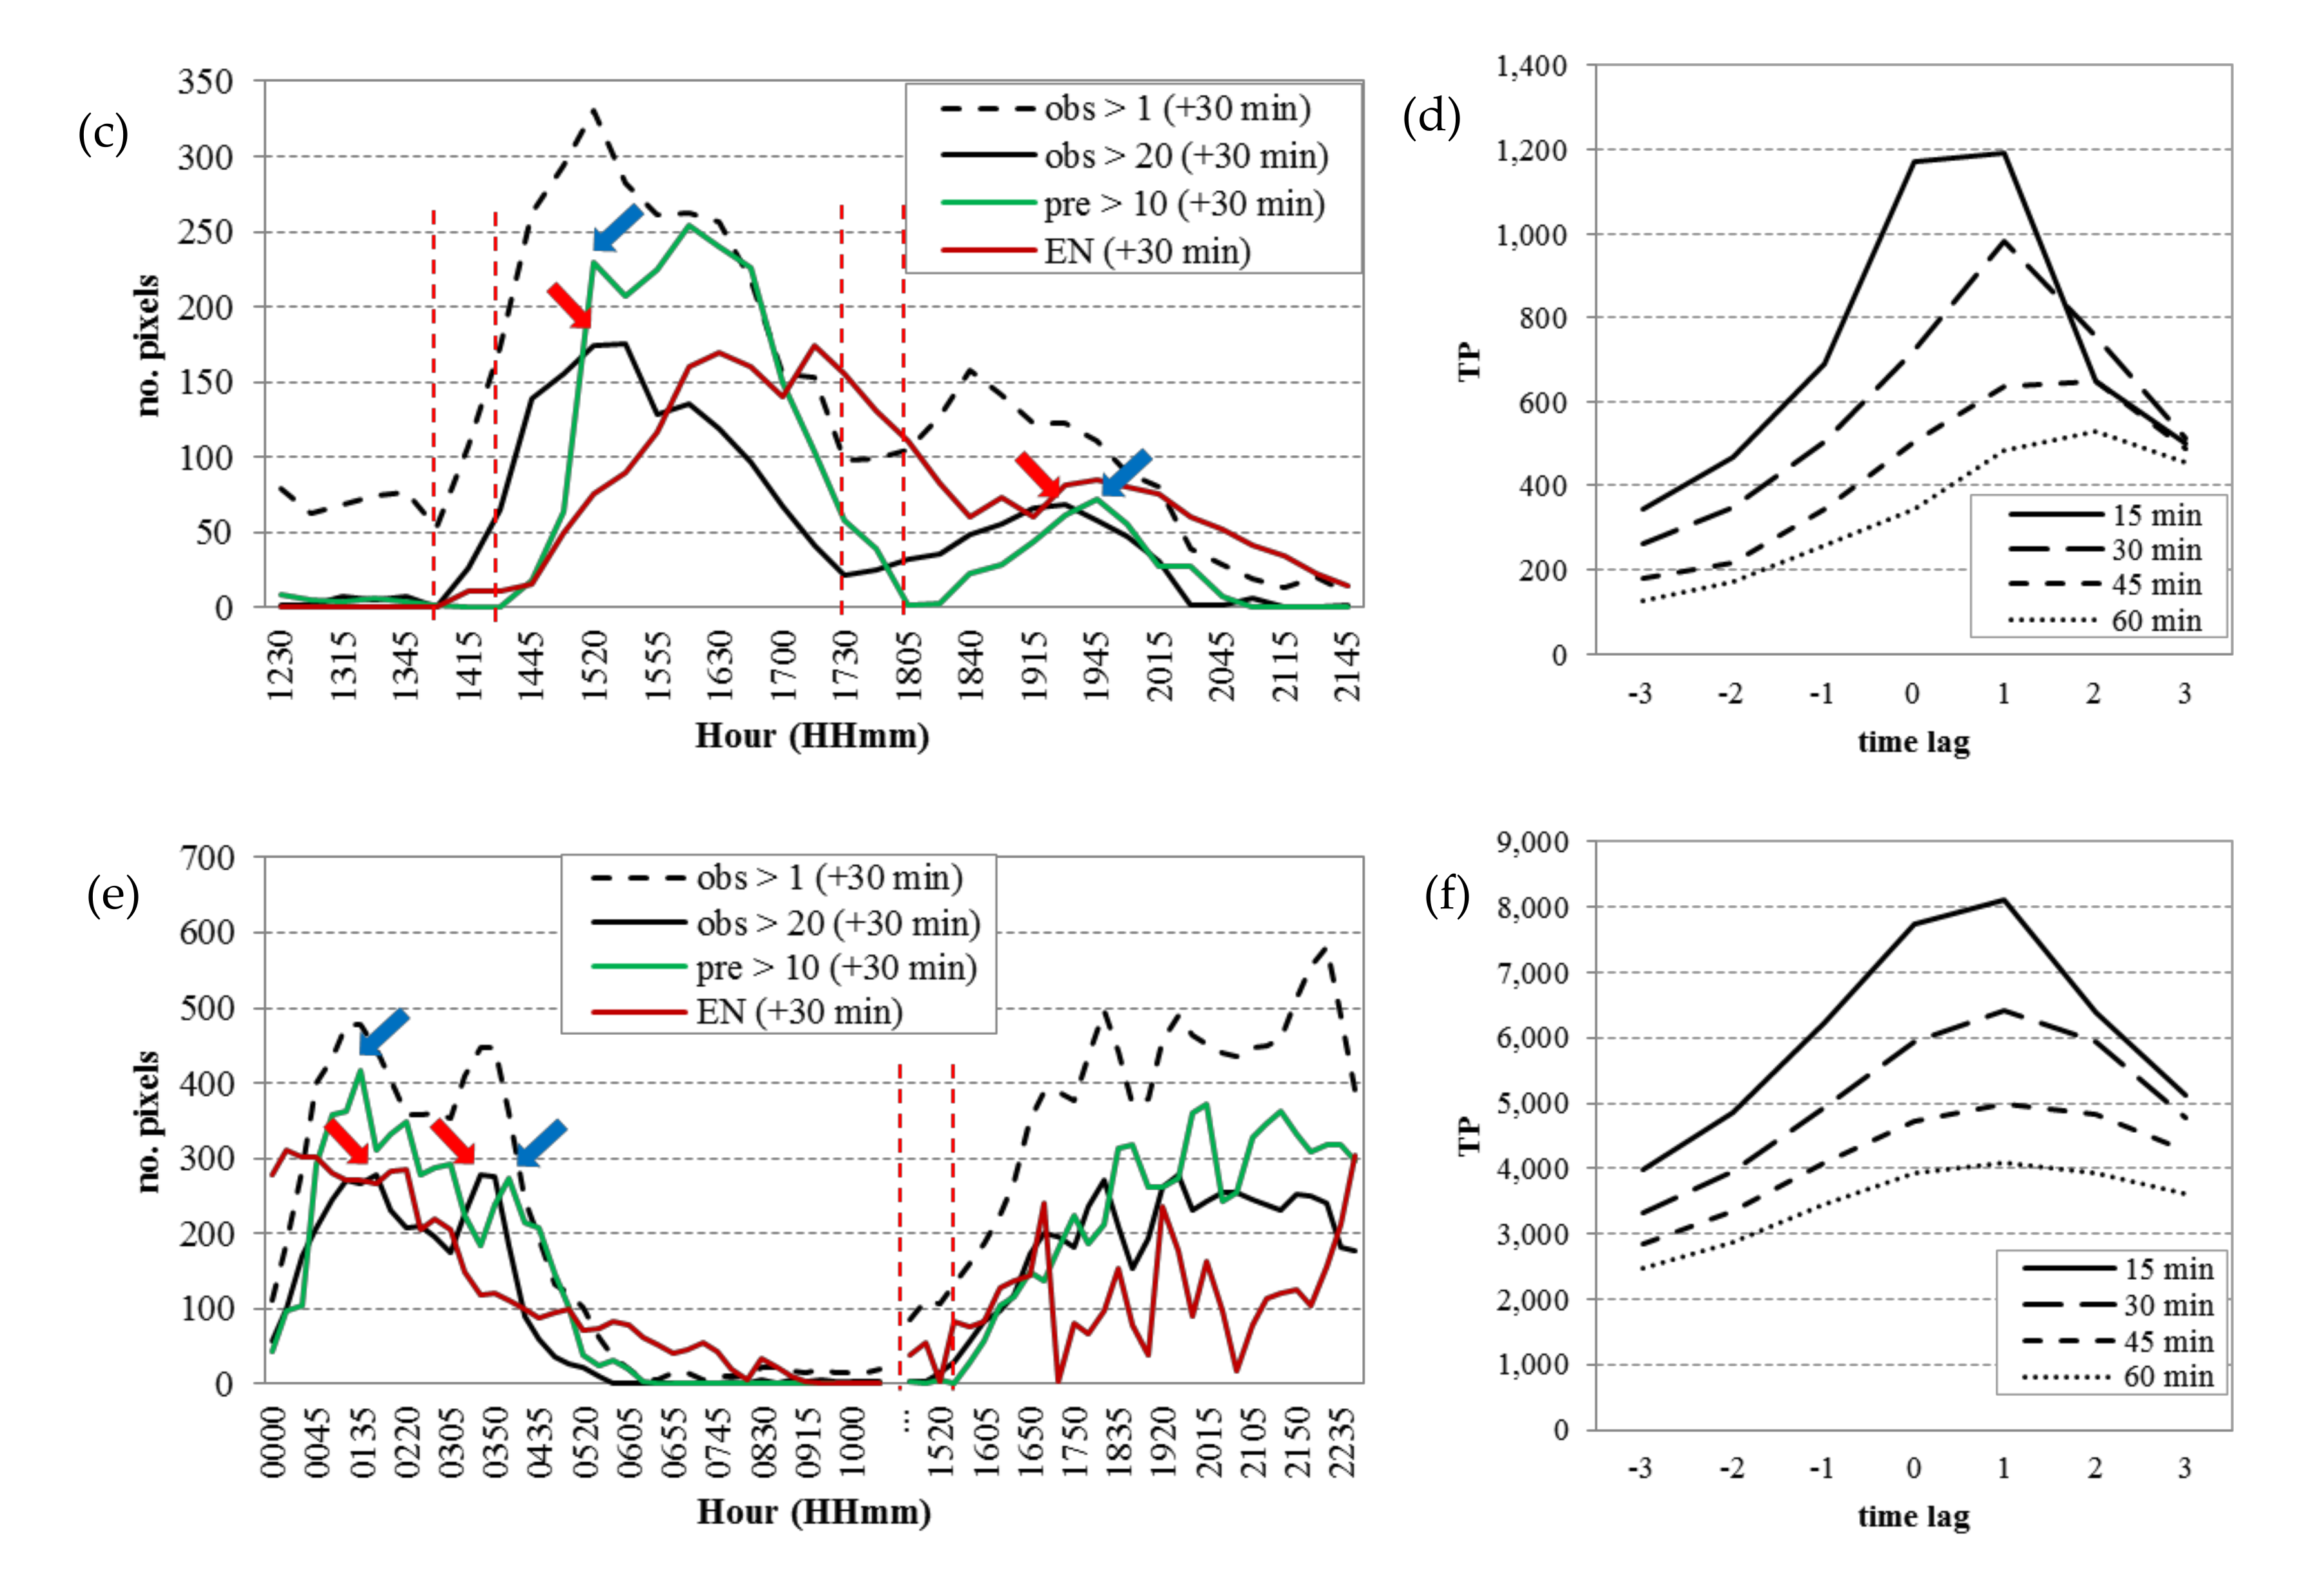
4.2. Case Studies
5. Conclusions
Author Contributions
Funding
Acknowledgments
Conflicts of Interest
Data Source
References
- Golnaraghi, M.; Etienne, C.; Guha-Sapir, D.; Below, R. Atlas of Mortality and Economic Losses from Weather, Climate, and Water Extremes (1970–2012); World Meteorological Organization (WMO): Geneva, Switzerland, 2014. [Google Scholar]
- UN, ISDR. Hyogo framework for action 2005–2015: Building the resilience of nations and communities to disasters. In Proceedings of the Extract from the final report of the World Conference on Disaster Reduction (A/CONF. 206/6); Kobe, Hyogo, Japan, 18–22 January 2005, The United Nations International Strategy for Disaster Reduction: Geneva, Switzerland, 2007. [Google Scholar]
- CEPED, UFSC. Atlas Brasileiro de Desastres Naturais: 1991 a 2012; Centro Universitário de Estudos e Pesquisas sobre Desastres, Federal University of Santa Catarina: Florianópolis, Brazil, 2013. [Google Scholar]
- Asadieh, B.; Krakauer, N.Y. Global trends in extreme precipitation: Climate models vs. observations. Hydrol. Earth Syst. Sci. Discuss. 2014, 11, 11369–11393. [Google Scholar] [CrossRef] [Green Version]
- Zilli, M.T.; Carvalho, L.M.; Liebmann, B.; Silva Dias, M.A. A comprehensive analysis of trends in extreme precipitation over southeastern coast of Brazil. Int. J. Climatol. 2017, 37, 2269–2279. [Google Scholar] [CrossRef]
- WMO. Available online: http://www.wmo.int/pages/prog/amp/pwsp/Nowcasting.htm (accessed on 8 November 2017).
- Atlas, D. Radar in Meteorology; American Meteorological Society: Boston, MA, USA, 1990. [Google Scholar]
- Büyükbas, E.; Sireci, O.; Hazer, A.; Temir, I.; Macit, A.; Gecer, C. Training Materials on Weather Radar Systems. Instruments and Observing Methods; Technical Report no.88; World Meteorological Organization (WMO): Geneva, Switzerland, 2006; p. 354. [Google Scholar]
- Calheiros, A.J.P.; Enoré, D.P.; Mattos, E.V.; da Costa, I.C.; Machado, L.A.T. Sistema De Previsão Imediata: Descrição dos Produtos; Instituto Nacional de Pesquisas Espaciais (INPE): São José dos Campos, SP, Brazil, 2016. [Google Scholar]
- Reyniers, M. Quantitative Precipitation Forecasts Based on Radar Observations: Principles, Algorithms and Operational Systems; Institut Royal Météorologique de Belgique: Brussel, Belgium, 2008. [Google Scholar]
- Wilson, J.W.; Crook, N.A.; Mueller, C.K.; Sun, J.; Dixon, M. Nowcasting thunderstorms: A status report. Bull. Am. Meteorol. Soc. 1998, 79, 2079–2100. [Google Scholar] [CrossRef]
- Wilson, J.; Feng, Y.; Chen, M.; Roberts, R. Nowcasting Challenges during the Beijing Olympics: Successes, Failures, and Implications for Future Nowcasting Systems. Weather Forecast. 2010, 25, 1691–1714. [Google Scholar] [CrossRef]
- Met Office. Nowcasting. Available online: https://www.metoffice.gov.uk/weather/learn-about/how-forecasts-are-made/hours-ahead/nowcasting (accessed on 8 November 2017).
- Held, G.; Gomes, J.L.; Nascimento, E. Forecasting a severe weather occurrence in the State of São Paulo, Brazil, on 24 May 2005: The Indaiatuba Tornado. In Proceedings of the 8th International Conference on Southern Hemisphere Meteorology and Oceanography, Foz do Iguaçu, Brazil, 24–28 April 2006; pp. 1799–1807. [Google Scholar]
- Pierce, C.; Seed, A.; Ballard, S.; Simonin, D.; Li, Z. Nowcasting. In Doppler Radar Observations-Weather Radar, Wind Profiler, Ionospheric Radar, and Other Advanced Applications; InTech Open Access Publisher: London, UK, 2012. [Google Scholar]
- Instruction Manual Rainbow® 5; Selex Systems Integration GmbH: Backnang, Germany, 2017.
- Dixon, M.; Wiener, G. TITAN: Thunderstorm identification, tracking, analysis, and nowcasting—A radar-based methodology. J. Atmos. Ocean. Technol. 1993, 10, 785–797. [Google Scholar] [CrossRef]
- World Meteorological Organization. Guidelines for Nowcasting Techniques; (WMO-No. 1198) Series; WMO: Geneva, Switzerland, 2017. [Google Scholar]
- Luk, K.C.; Ball, J.E.; Sharma, A. An application of artificial neural networks for rainfall forecasting. Math. Comput. Modeling 2001, 33, 683–693. [Google Scholar] [CrossRef]
- Bushara, N.O.; Abraham, A. Computational intelligence in weather forecasting: A review. J. Netw. Innov. Comput. 2013, 1, 320–331. [Google Scholar]
- McGovern, A.; Elmore, K.L.; Gagne, D.J.; Haupt, S.E.; Karstens, C.D.; Lagerquist, R.; Smith, T.; Williams, J.K. Using artificial intelligence to improve real-time decision-making for high-impact weather. Bull. Am. Meteorol. Soc. 2017, 98, 2073–2090. [Google Scholar] [CrossRef]
- Germann, U.; Zawadzki, I.; Turner, B. Predictability of precipitation from continental radar images. Part IV: Limits to prediction. J. Atmos. Sci. 2006, 63, 2092–2108. [Google Scholar] [CrossRef]
- Mueller, C.; Saxen, T.; Roberts, R.; Wilson, J.; Betancourt, T.; Dettling, S.; Oien, N.; Yee, J. NCAR auto-nowcast system. Weather Forecast. 2003, 18, 545–561. [Google Scholar] [CrossRef]
- AMS Glossary. Available online: http://glossary.ametsoc.org/wiki/Predictability (accessed on 27 February 2020).
- Franch, G.; Nerini, D.; Pendesini, M.; Coviello, L.; Jurman, G.; Furlanello, C. Precipitation nowcasting with orographic enhanced stacked generalization: Improving deep learning predictions on extreme events. Atmosphere 2020, 11, 267. [Google Scholar] [CrossRef] [Green Version]
- Reichstein, M.; Camps-Valls, G.; Stevens, B.; Jung, M.; Denzler, J.; Carvalhais, N. Deep learning and process understanding for data-driven Earth system science. Nature 2019, 566, 195–204. [Google Scholar] [CrossRef]
- Shi, X.; Chen, Z.; Wang, H.; Yeung, D.Y.; Wong, W.K.; Woo, W.C. Convolutional LSTM network: A machine learning approach for precipitation nowcasting. In Proceedings of the Advances in Neural Information Processing Systems 28 (NIPS 2015), Montreal, QC, Canada, 7–12 December 2015; pp. 802–810. [Google Scholar]
- Wang, Y.; Long, M.; Wang, J.; Gao, Z.; Yu, P.S. PredRNN: Recurrent Neural Networks for Predictive Learning using Spatiotemporal LSTMs. In Proceedings of the Neural Information Processing Systems 30 (NIPS 2017), Long Beach, CA, USA, 4–9 December 2017; pp. 879–888. [Google Scholar]
- Rew, J.; Park, S.; Cho, Y.; Jung, S.; Hwang, E. Animal Movement Prediction Based on Predictive Recurrent Neural Network. Sensors 2019, 19, 4411. [Google Scholar] [CrossRef] [PubMed] [Green Version]
- Shi, X.; Gao, Z.; Lausen, L.; Wang, H.; Yeung, D.Y.; Wong, W.K.; Woo, W.C. Deep learning for precipitation nowcasting: A benchmark and a new model. In Proceedings of the Neural Information Processing Systems 30 (NIPS 2017), Long Beach, CA, USA, 4–9 December 2017; pp. 5617–5627. [Google Scholar]
- Tran, Q.K.; Song, S.K. Computer Vision in Precipitation Nowcasting: Applying Image Quality Assessment Metrics for Training Deep Neural Networks. Atmosphere 2019, 10, 244. [Google Scholar] [CrossRef] [Green Version]
- Klein, B.; Wolf, L.; Afek, Y. A dynamic convolutional layer for short range weather prediction. In Proceedings of the IEEE Conference on Computer Vision and Pattern Recognition, Boston, MA, USA, 7–12 June 2015; IEEE Computer Society: Los Alamitos, CA, USA, 2015; pp. 4840–4848. [Google Scholar]
- Mathieu, M.; Couprie, C.; LeCun, Y. Deep multi-scale video prediction beyond mean square error. In Proceedings of the International Conference on Learning Representations (ICLR), San Juan, Puerto Rico, 2–4 May 2016. [Google Scholar]
- Srivastava, N.; Mansimov, E.; Salakhudinov, R. Unsupervised learning of video representations using lstms. In Proceedings of the 32nd International Conference on International Conference on Machine learning (37), Lille, France, 7–9 July 2015; pp. 843–852. [Google Scholar]
- Wang, Y.; Long, M.; Wang, J.; Gao, Z.; Yu, P.S. PredRNN++: Towards a resolution of the deep-in-time dilemma in spatiotemporal predictive learning. PLMR 2018, 80, 5123–5132. [Google Scholar]
- Saisp Homepage. Available online: https://www.saisp.br/estaticos/sitenovo/produtos.xmlt (accessed on 26 December 2018).
- Rinehart, R.E. Radar for Meteorologists: Or You, too, can be a Radar Meteorologist, Part. III, 5th ed.; Rinehart Publications: Nevada, MO, USA, 2010. [Google Scholar]
- Straka, J.M.; Zrnić, D.S.; Ryzhkov, A.V. Bulk Hydrometeor Classification and Quantification Using Polarimetric Radar Data: Synthesis of Relations. J. Appl. Meteorol. 2000, 39, 1341–1372. [Google Scholar] [CrossRef]
- PredRNN++ Code. Available online: https://github.com/Yunbo426/predrnn-pp (accessed on 7 May 2019).
- Xu, Z.; Wang, Y.; Long, M.; Wang, J.; KLiss, M.O.E. PredCNN: Predictive Learning with Cascade Convolutions. In Proceedings of the 27th International Joint Conference on Artificial Intelligence (IJCAI-18), Stockholm, Sweden, 13–19 July 2018; pp. 2940–2947. [Google Scholar]
- Oord, A.V.D.; Dieleman, S.; Zen, H.; Simonyan, K.; Vinyals, O.; Graves, A.; Kalchbrenner, N.; Senior, A.; Kavukcuoglu, K. Wavenet: A generative model for raw audio. arXiv 2016, arXiv:1609.03499. [Google Scholar]
- LeCun, Y.; Bottou, L.; Bengio, Y.; Haffner, P. Gradient-based learning applied to document recognition. Proc. IEEE 1998, 86, 2278–2324. [Google Scholar] [CrossRef] [Green Version]
- Srivastava, R.K.; Greff, K.; Schmidhuber, J. Training very deep networks. In Proceedings of the 28th International Conference on Neural Information Processing Systems (NIPS 2015), Montreal, QC, Canada, 7–12 December 2015; Volume 2, pp. 2377–2385. [Google Scholar]
- Wilks, D.S. Statistical Methods in the Atmospheric Sciences, 2nd ed.; Academic Press: New York, NY, USA, 2006. [Google Scholar]
- Schaefer, J.T. The critical success index as an indicator of warning skill. Weather Forecast. 1990, 5, 570–575. [Google Scholar] [CrossRef] [Green Version]
- Hamill, T.M. Hypothesis tests for evaluating numerical precipitation forecasts. Weather Forecast. 1999, 14, 155–167. [Google Scholar] [CrossRef]
- Sharifi, E.; Steinacker, R.; Saghafian, B. Assessment of GPM-IMERG and other precipitation products against gauge data under different topographic and climatic conditions in Iran: Preliminary results. Remote Sens. 2016, 8, 135. [Google Scholar] [CrossRef] [Green Version]
- Wang, C.C. On the calculation and correction of equitable threat score for model quantitative precipitation forecasts for small verification areas: The example of Taiwan. Weather Forecast. 2014, 29, 788–798. [Google Scholar] [CrossRef]
- CPTEC/INPE bulletin of “casos significativos do mês”. Available online: https://www.cptec.inpe.br/noticias/quadro/143 (accessed on 7 January 2019).
- Ebert, E. Fuzzy verification of high resolution gridded forecasts: A review and proposed framework. Meteorol. Appl. A J. Forecast. Pract. Appl. Train. Tech. Modeling 2008, 15, 51–64. [Google Scholar] [CrossRef]


| Period | Lead Time (min) | FAR ↓ | POD ↑ | POFD ↓ | BIAS (~1) | CSI ↑ | ETS ↑ |
|---|---|---|---|---|---|---|---|
| All | 15 | 0.45 | 0.90 | 0.10 | 1.62 | 0.52 | 0.46 |
| 30 | 0.53 | 0.86 | 0.13 | 1.82 | 0.44 | 0.37 | |
| 45 | 0.59 | 0.83 | 0.15 | 1.99 | 0.38 | 0.31 | |
| 60 | 0.62 | 0.79 | 0.17 | 2.09 | 0.35 | 0.27 | |
| Summer | 15 | 0.43 | 0.91 | 0.12 | 1.61 | 0.54 | 0.46 |
| 30 | 0.51 | 0.87 | 0.16 | 1.80 | 0.45 | 0.36 | |
| 45 | 0.56 | 0.84 | 0.19 | 1.93 | 0.40 | 0.31 | |
| 60 | 0.59 | 0.81 | 0.21 | 1.99 | 0.37 | 0.27 |
| Data | 31 July 2018 | 5 December 2018 | 22 December 2018 | |
|---|---|---|---|---|
| Block 1 | pre > 1 vsobs > 1 |  |  |  |
| Block 2 | pre > 10 vsobs > 20 |  |  |  |
| Block 3 | ENCAST vsobs > 20 |  |  |  |
Publisher’s Note: MDPI stays neutral with regard to jurisdictional claims in published maps and institutional affiliations. |
© 2020 by the authors. Licensee MDPI, Basel, Switzerland. This article is an open access article distributed under the terms and conditions of the Creative Commons Attribution (CC BY) license (http://creativecommons.org/licenses/by/4.0/).
Share and Cite
Bonnet, S.M.; Evsukoff, A.; Morales Rodriguez, C.A. Precipitation Nowcasting with Weather Radar Images and Deep Learning in São Paulo, Brasil. Atmosphere 2020, 11, 1157. https://doi.org/10.3390/atmos11111157
Bonnet SM, Evsukoff A, Morales Rodriguez CA. Precipitation Nowcasting with Weather Radar Images and Deep Learning in São Paulo, Brasil. Atmosphere. 2020; 11(11):1157. https://doi.org/10.3390/atmos11111157
Chicago/Turabian StyleBonnet, Suzanna Maria, Alexandre Evsukoff, and Carlos Augusto Morales Rodriguez. 2020. "Precipitation Nowcasting with Weather Radar Images and Deep Learning in São Paulo, Brasil" Atmosphere 11, no. 11: 1157. https://doi.org/10.3390/atmos11111157
APA StyleBonnet, S. M., Evsukoff, A., & Morales Rodriguez, C. A. (2020). Precipitation Nowcasting with Weather Radar Images and Deep Learning in São Paulo, Brasil. Atmosphere, 11(11), 1157. https://doi.org/10.3390/atmos11111157