1. Introduction
Flash drought, a type of drought with rapid onset, has gained increasing interests in literature in the last decade [
1,
2,
3,
4,
5]. Flash drought was termed by U.S. Drought Monitor (USDM) [
6] authors in the early 2000s when they noticed that some droughts developed and intensified much faster than conventional droughts. The 2012 Central Great Plains flash drought [
7,
8,
9] caused devastating impacts and tremendous economic losses in the American heartland [
10], and triggered new research to improve our understanding of flash drought [
1,
2,
3,
4,
5]. In light of the need of drought prediction at a shorter time range, the NOAA Climate Prediction Center (CPC) inaugurated the Monthly Drought Outlook (MDO) in June 2013. The MDO is issued once a month at the last day of each month with forecasts valid for the upcoming month. It provides drought tendency forecasts of four categories: drought persists, drought remains but improves, drought removal likely, and drought development likely. The drought tendency categories of the upcoming month are determined through expert synthesis of various forecast information, including monthly precipitation (P) and temperature (T) outlooks, soil moisture (SM) and hydrological conditions, standardized precipitation index (SPI) forecasts, etc. In May 2017, another flash drought occurred in the Northern High Plains and resulted in major agricultural and crop damages [
11,
12]. The lack of capability to forecast this event motivated CPC to develop new subseasonal drought prediction tools, with the goal of improving the skill of MDOs.
In order to meet the operational requirements at CPC, Chen et al. (2019) [
13] defined a flash drought event as a drought event with greater than or equal to two categories degradation in a four-week period based on the USDM, and analyzed flash drought characteristics using 2000–2017 USDM data. They identified evapotranspiration (ET) as a primary natural precursor for flash drought prediction. Closely monitoring rapid changes in ET, along with P and SM conditions, can provide early warnings of flash drought development. These results are consistent with the findings by others [
2,
5,
14]. In this study, we intend to use the knowledge gained from these studies and develop a real-time tool to predict areas susceptible to flash drought development over the contiguous United States (CONUS). The aim is to highlight areas with potential drought development to inform forecasters of possible drought tendency categories. In simple words, we want to predict the yellow areas (i.e., the category of drought development likely) on MDO maps. This approach is different from traditional drought forecasts that predict the quantity of standardized drought indices to indicate anomalously dry or wet conditions [
15,
16,
17,
18].
The performance of the tool is evaluated using both retrospective and real-time predictions. For the retrospective runs, we use the 2017 Northern High Plains flash drought as a study case and compare the forecast maps to the MDOs issued for May to September 2017. Due to its superior performance in predicting the onset and evolution of the 2017 drought, the experimental tool started running on 1 April 2018 and has been generating real-time predictions since (available at
https://www.cpc.ncep.noaa.gov/products/Drought/Flash_Drought/potential_development.php). In order to capture the fast-developing drought signals on subseasonal timescales, the prediction is updated daily. The objectives of this paper are to (1) document the methodology of the flash drought prediction tool, (2) evaluate its performance on the 2017 drought, (3) provide an assessment of its real-time prediction skill for the 2018 and 2019 warm seasons, and (4) identify the strengths and limitations of the tool and areas of improvement.
In the following,
Section 2 describes the North American Land Data Assimilation System (NLDAS) data used to develop the tool, as well as the USDM and MDO maps used for verification;
Section 3 explains the methodology of the real-time flash drought prediction tool;
Section 4 presents the retrospective prediction of the 2017 Northern High Plains flash drought using the tool and its performance assessment;
Section 5 and
Section 6 display the real-time predictions and validations of the 2018 and 2019 warm seasons, respectively; and lastly,
Section 7 summarizes the major findings and conclusions from the study.
3. Methodology
Otkin et al. (2013) [
2] examined the evolution of several flash droughts using satellite-derived drought indices, and found that large negative change anomalies commonly appeared before rapid drought onset. In subsequent research, they further developed the rapid change index (RCI) to highlight areas undergoing quick changes in moisture stress [
14,
25]. The RCI for a given variable (e.g., ET) is computed using standardized anomalies in the difference between two time periods:
where
V is the variable being differenced,
w1 and
w2 are the weeks/7-day periods used in the difference calculation,
y is the year,
n is the total number of years, and the denominator is the standard deviation.
For a given 7-day period, the RCI is computed as
where
RCIprev is the
RCI value from the previous 7-day period. The initial
RCI value is zero, and the
RCI will reset to zero if the sign of the
ΔV is opposite that of the previous 7-day period, but it will remain unchanged if the Δ
V has the same sign as the previous 7-day period but is less than the threshold value.
RCI is the accumulated magnitude of moisture stress changes (standardized differences) occurring over multiple weeks. Drought is likely to develop when RCI is negative. Chen et al. (2019) [
13] examined flash drought characteristics using 2000–2017 USDM data and identified ET as a primary natural precursor for flash drought prediction. In this study, we used 7-day mean ET anomalies (climatology base period is 1981–2010) from NLDAS-2 to calculate the RCI of 7-day differences, because shorter differencing intervals usually respond more quickly to rapidly changing conditions and can provide earlier warnings of impending drought intensification [
14,
25]. Since RCI represents the derivative of the time series of a drought variable, it is a measure of drought tendency.
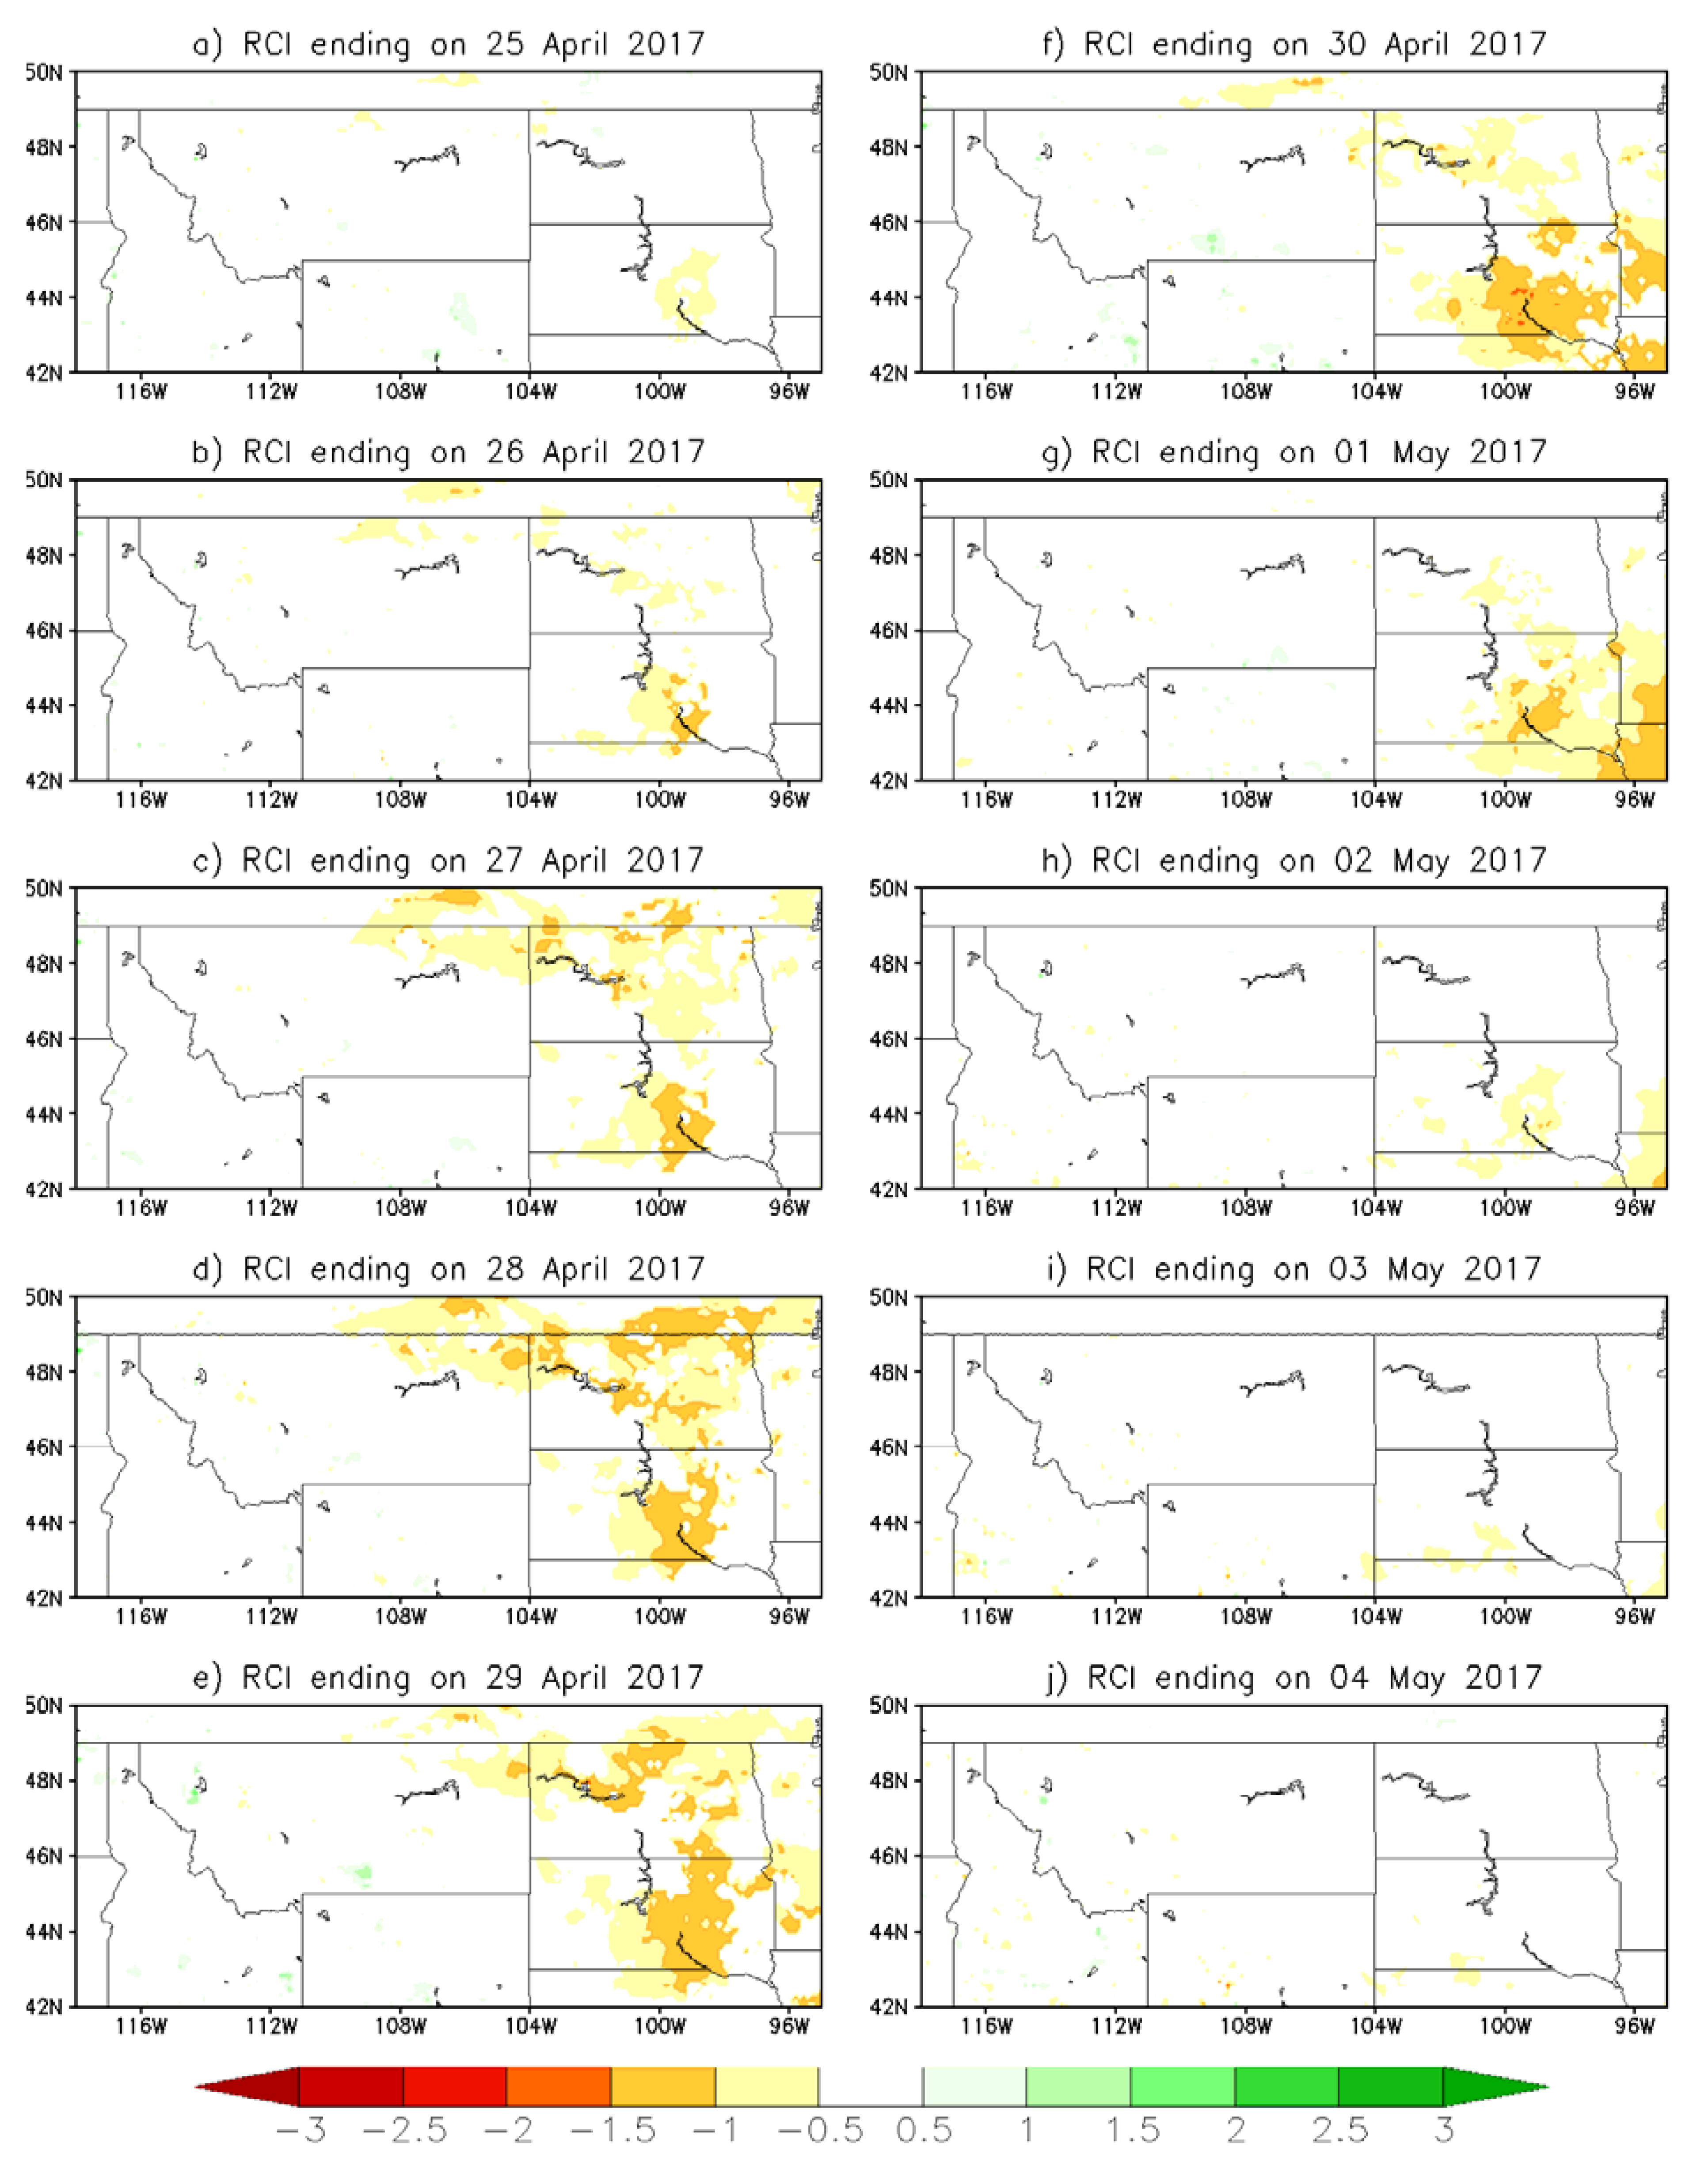
Figure 1 shows an example of daily RCI maps calculated using 7-day mean ET anomalies from 25 April to 4 May 2017, right before the onset of the Northern High Plains flash drought on 23 May 2017. On 25 April, a small area of negative RCI appeared over the Central South Dakota. The RCI in this area continued to decrease/intensify and expanded into North Dakota from 26 to 29 April. The RCI then started to increase and gradually disappeared in the region from 30 April to 4 May. This type of drought development signals is also observed in other ET-based drought indices, such as the evaporative demand drought index (EDDI) [
26,
27]. The signals usually emerge weeks (or sometime months) before drought onset. By the time forecasters gather information to issue outlooks, they may have already disappeared on the latest maps. Therefore, it is difficult for forecasters to capture drought development signals by using the latest monitoring map, which is the common practice of forecast procedure.
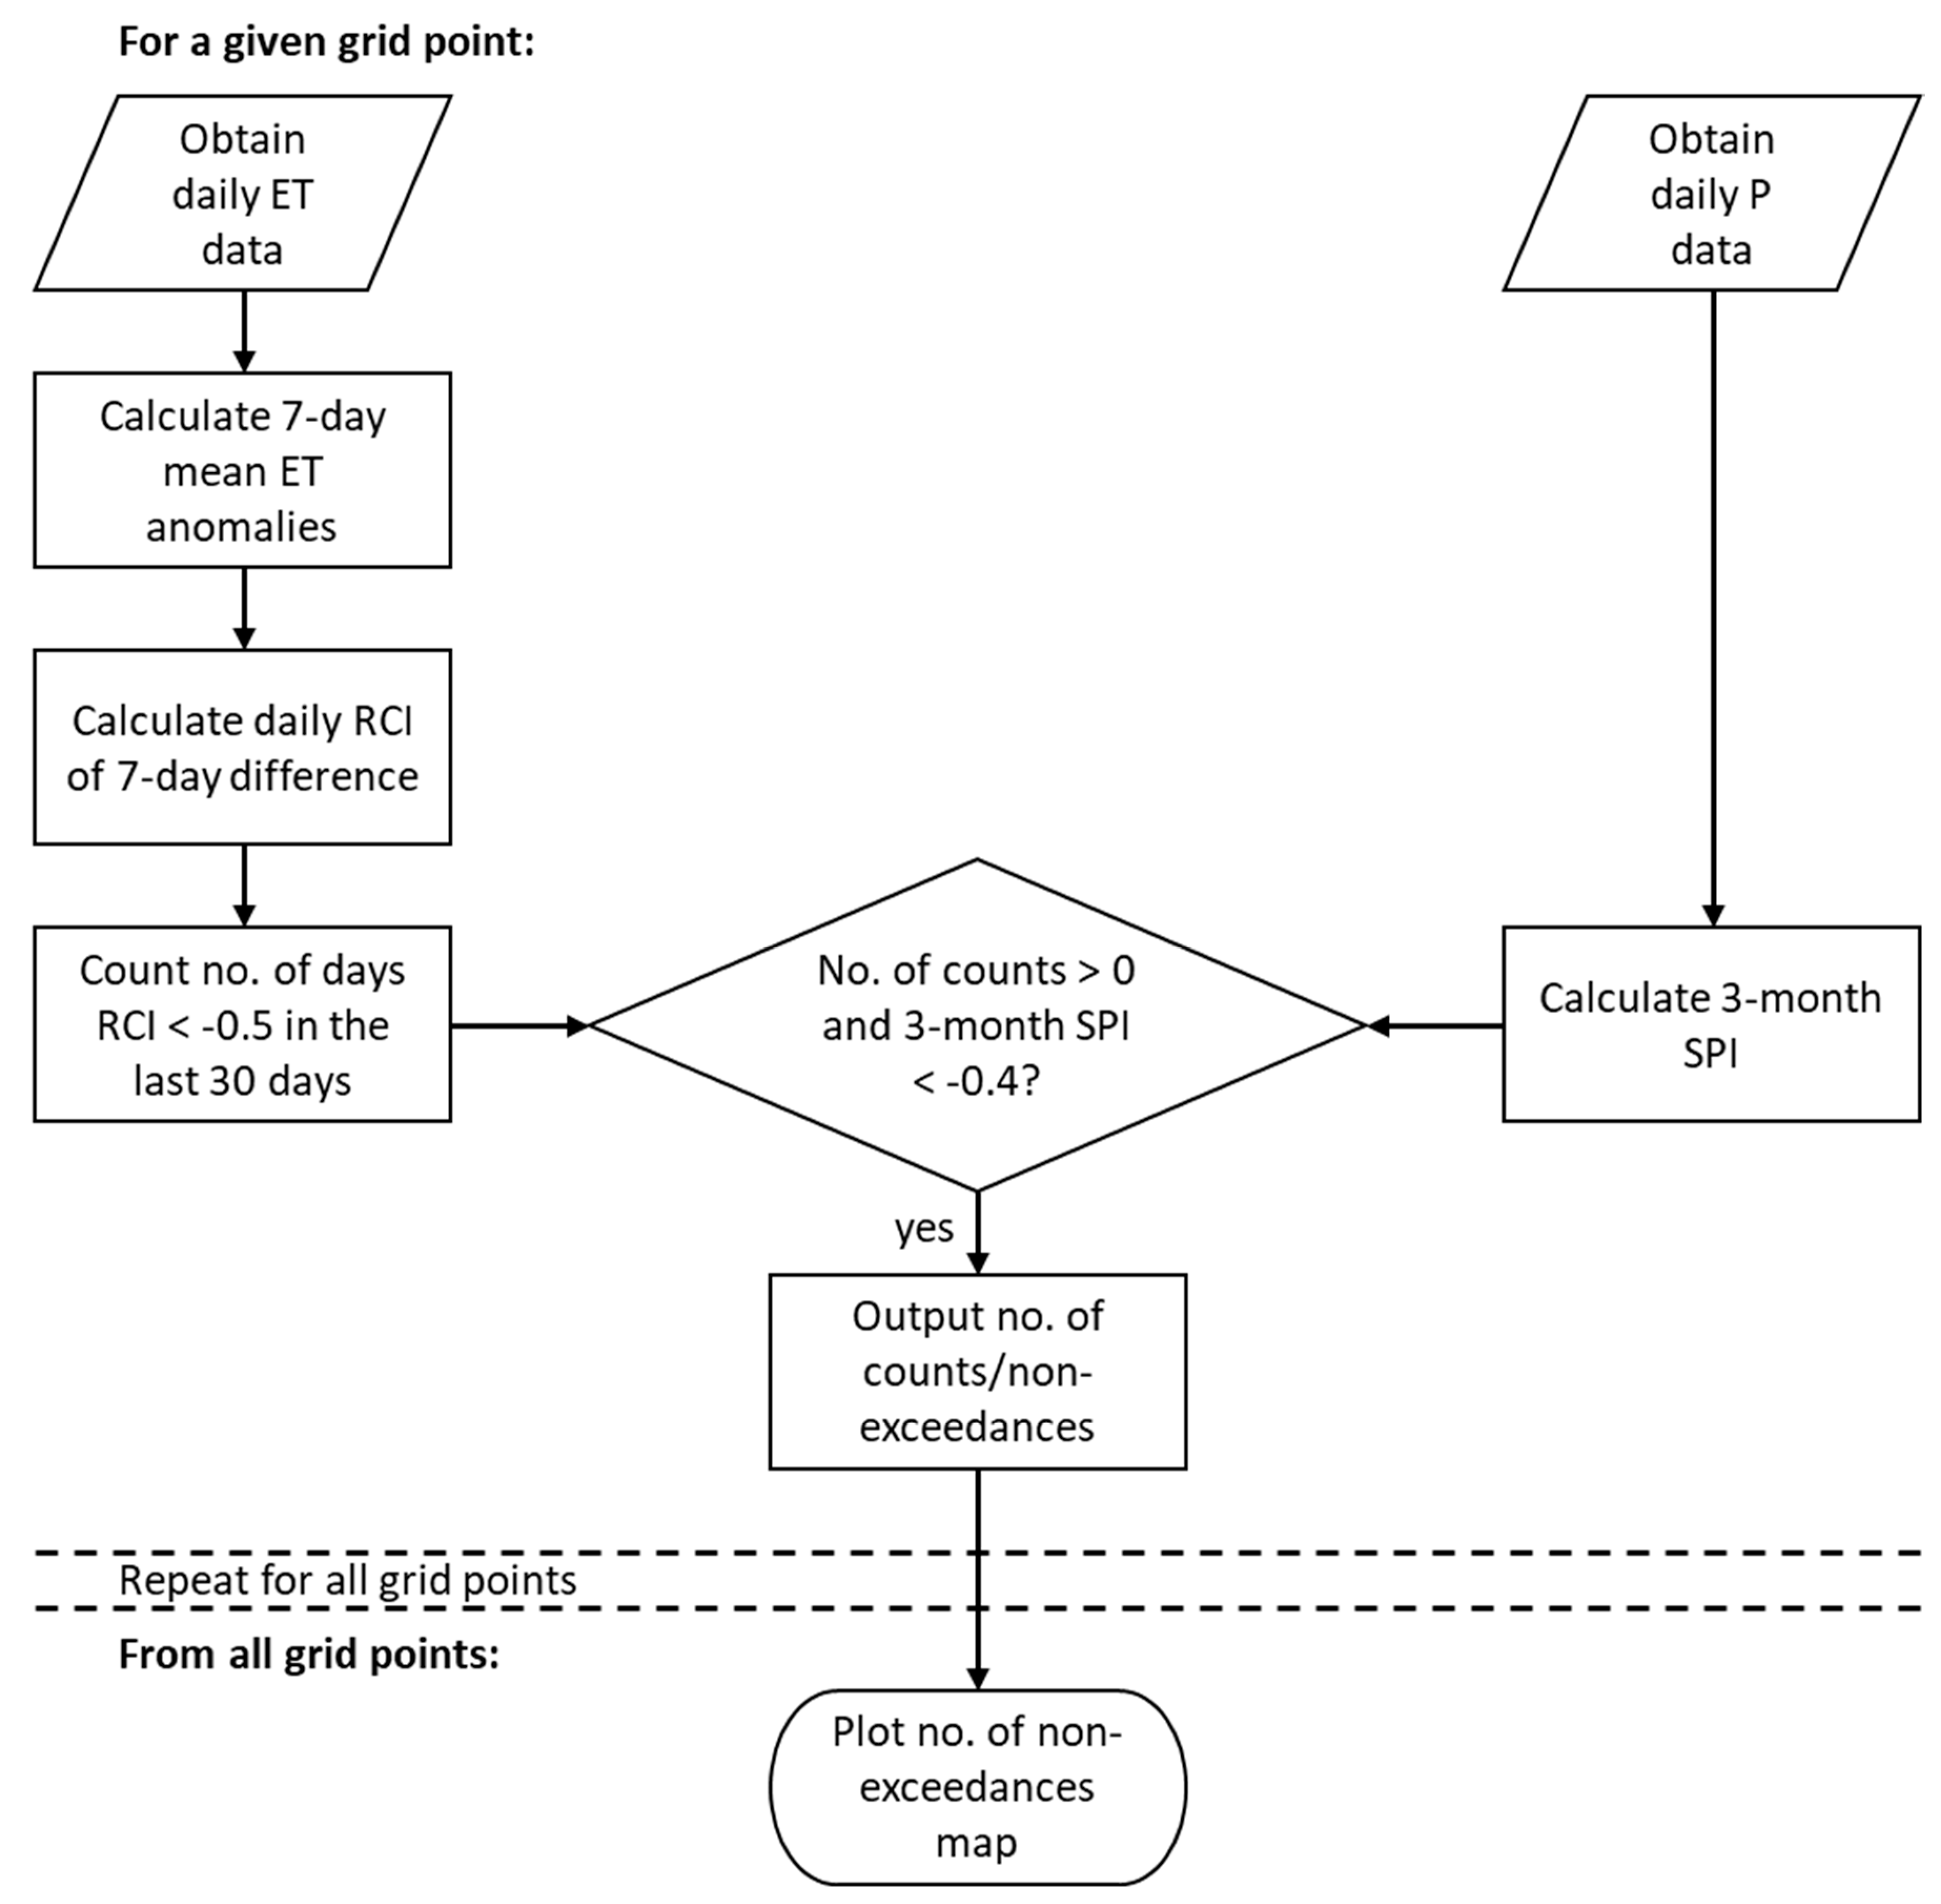
To help retain the signals and to create an intuitive drought prediction map that directly depicts drought tendency as the MDO, we used a threshold method and counted the number of occurrences that RCI was less than −0.5 over the last 30 days. For a given grid point, if RCI remains less than −0.5 for multiple days, it indicates that 7-day mean ET anomalies persistently decrease throughout those days, and thus the higher the count the more likely drought is to develop. However, persistent decreases of 7-day mean ET anomalies can occur after a heavy rainfall event or during temperature decline and do not guarantee drought to develop. Chen et al. (2019) [
13] analyzed antecedent conditions of flash drought events that occurred between 2000 and 2017 and found that flash droughts usually initiate under dry conditions, although P deficits do not need to be large. To reduce false alarms, we plotted the count maps with selected thresholds specifying meteorological/hydrological conditions. After testing several thresholds, we selected a threshold of 3-month SPI less than −0.4 to balance the tradeoff between false alarms and actual drought development signals.
Figure 2 presents a schematic diagram of the steps for creating the potential flash drought development map. To assess the performance of the new tool, we used the 2017 Northern High Plains flash drought as a study case (see
Section 4 for details). Due to its superior performance, the tool was implemented in real time on 1 April 2018 (updated daily) and has been providing experimental predictions to support MDO’s production since.
4. Retrospective Prediction of 2017 Northern High Plains Flash Drought
In May 2017, a flash drought suddenly appeared in the Northern High Plains, during the region’s rainy and growing seasons, which caused significant agricultural losses [
11,
12].
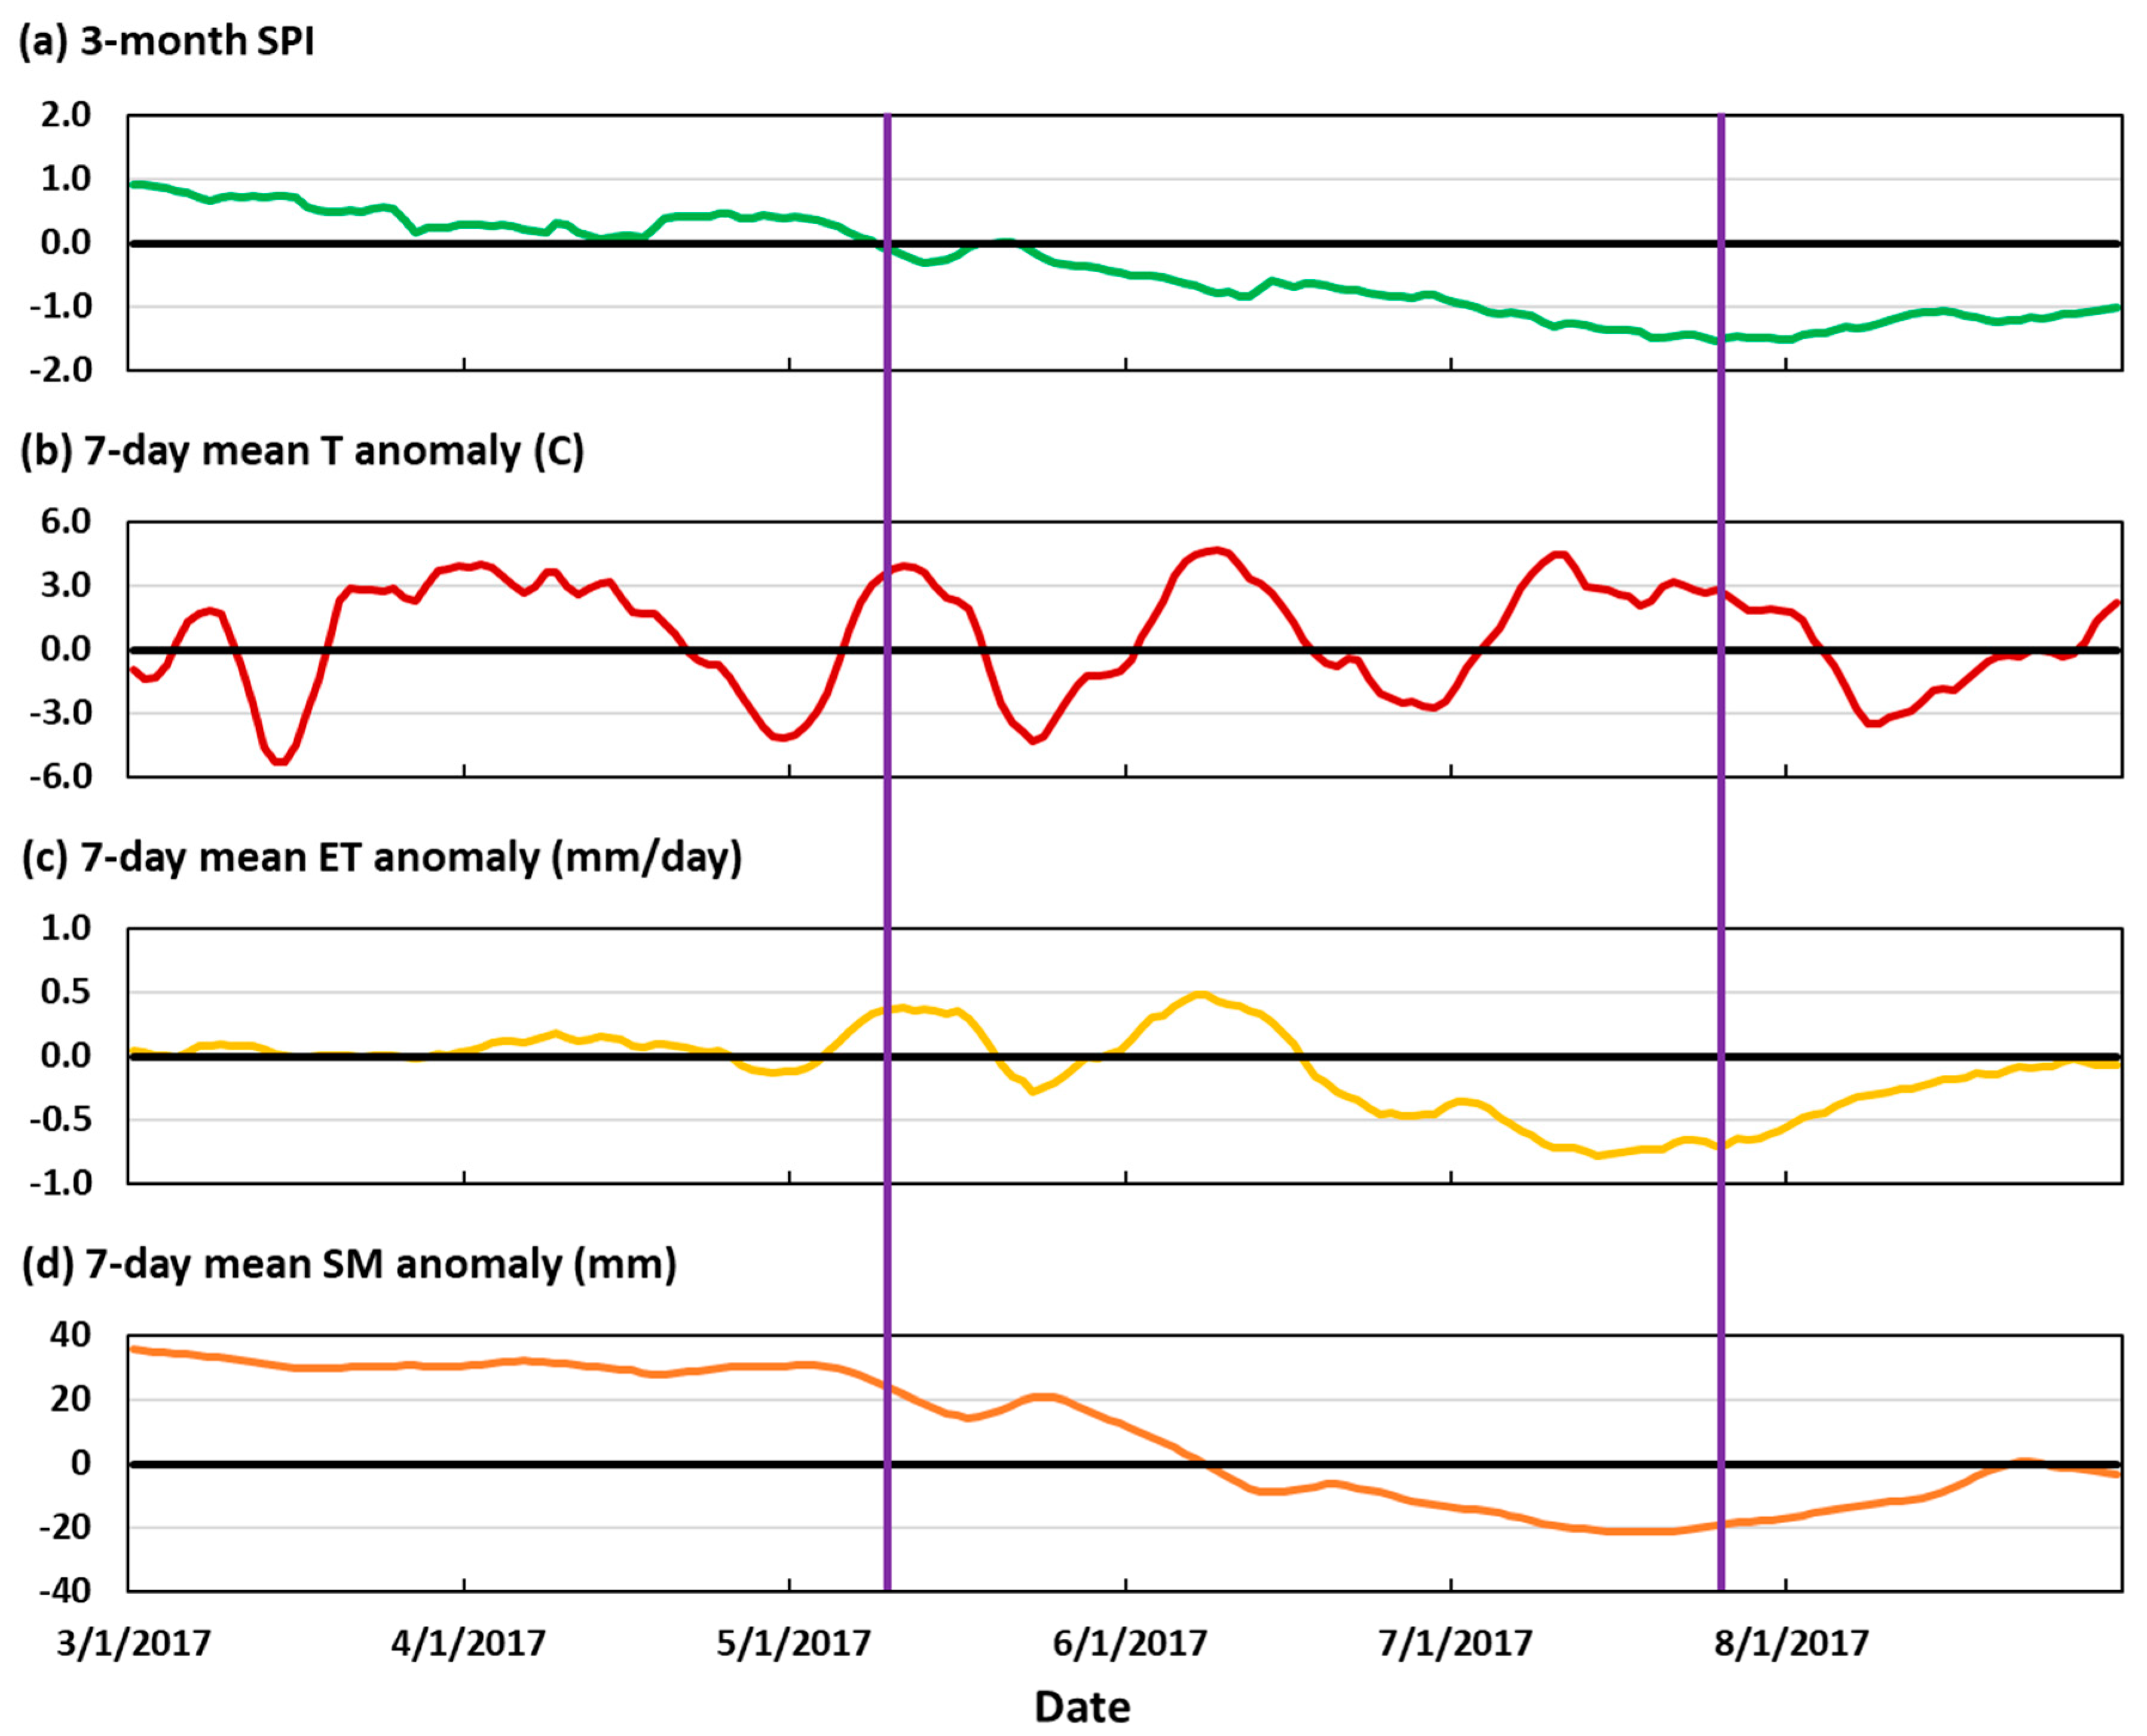
Figure 3 displays the time series of 3-month SPI and 7-day mean T, ET, and SM anomalies averaged over the domain shown in
Figure 1 from 1 March to 31 August 2017. In springtime, temperatures in this region were much above normal for an extended period, melting a large portion of snow on the ground and recharging soil moisture. During spring 7-day mean ET anomalies were about average due to cool temperatures, while 3-month SPI decreased from around positive one to near normal. Prior to the drought onset on 23 May, a heatwave struck the region and activated strong ET processes. Simultaneously, 3-month SPI dropped below zero, resulting in a sharp decline in 7-day mean SM anomalies and contributing to the flash drought. In June, another heatwave hit the region and caused anomalously high ET rates. Accompanied by a continued lack of rainfall, 7-day mean SM anomalies fell steeply, becoming more negative. In July, although the region suffered from a third heatwave, 7-day mean ET anomalies remained negative because of the large deficits in both 7-day mean SM anomalies and 3-month SPI (i.e., there was insufficient SM to support anomalously positive ET activities). At that time, the exceptional drought (D4) was well established.
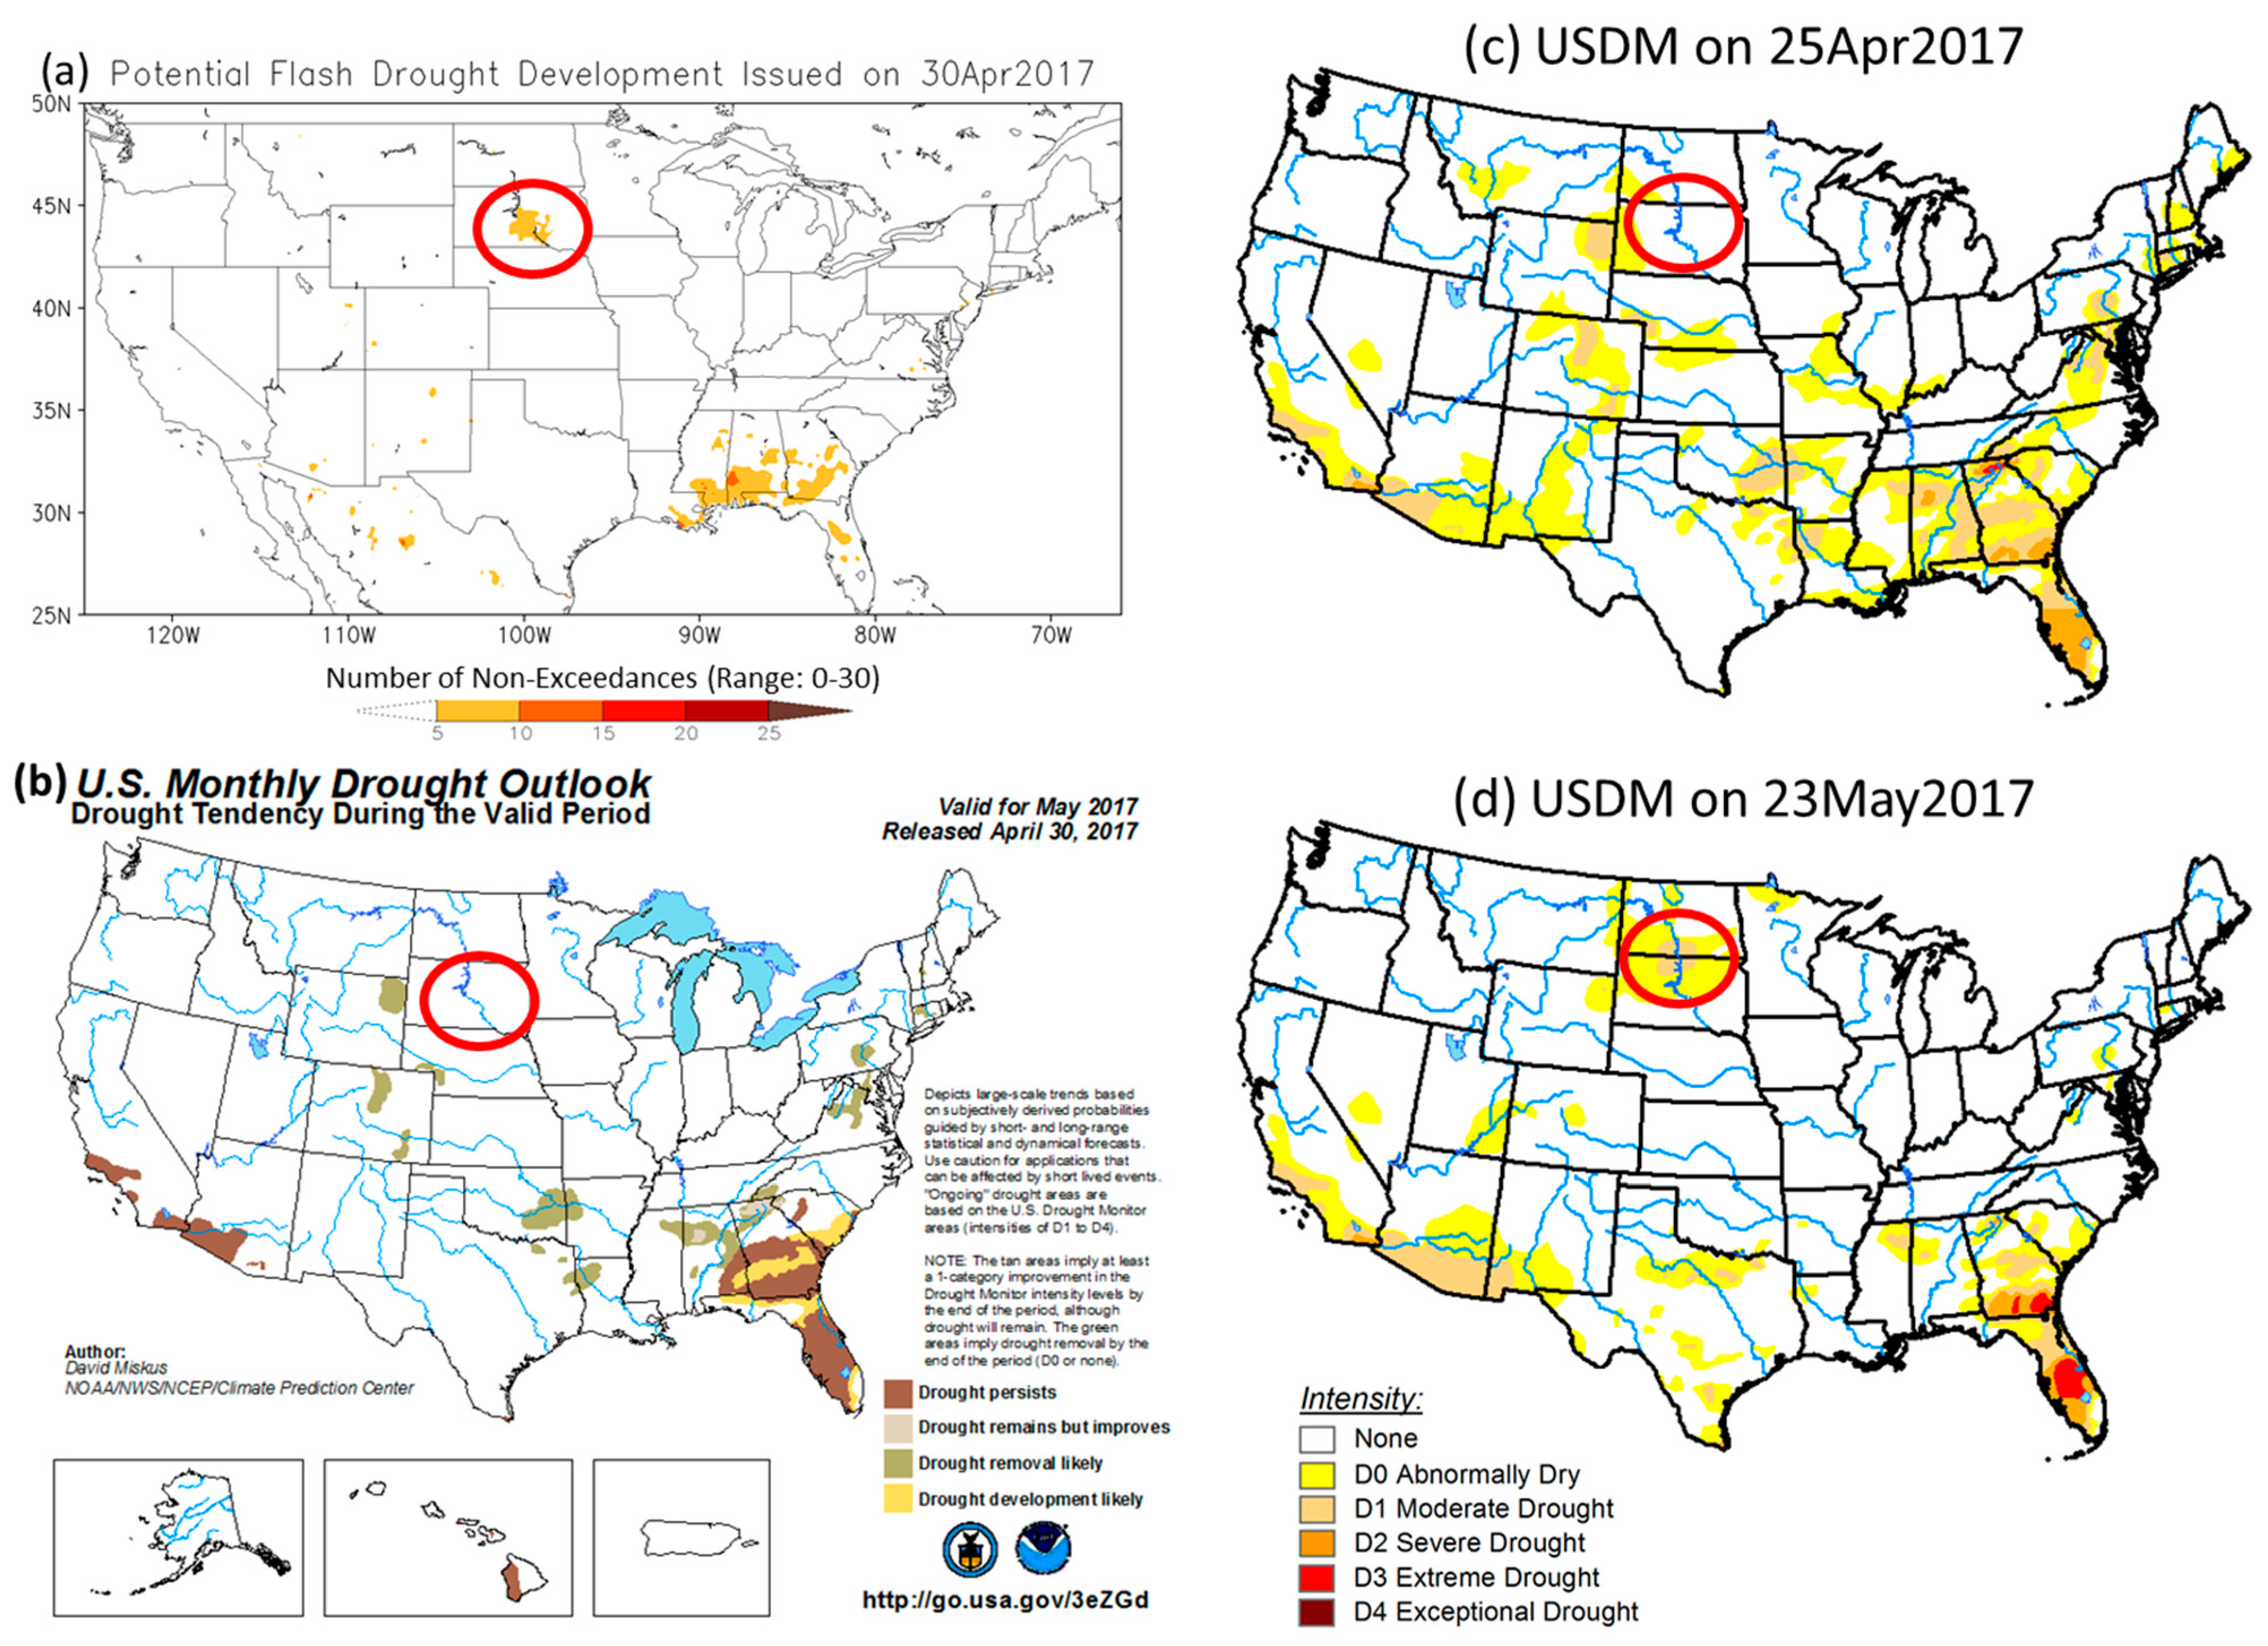
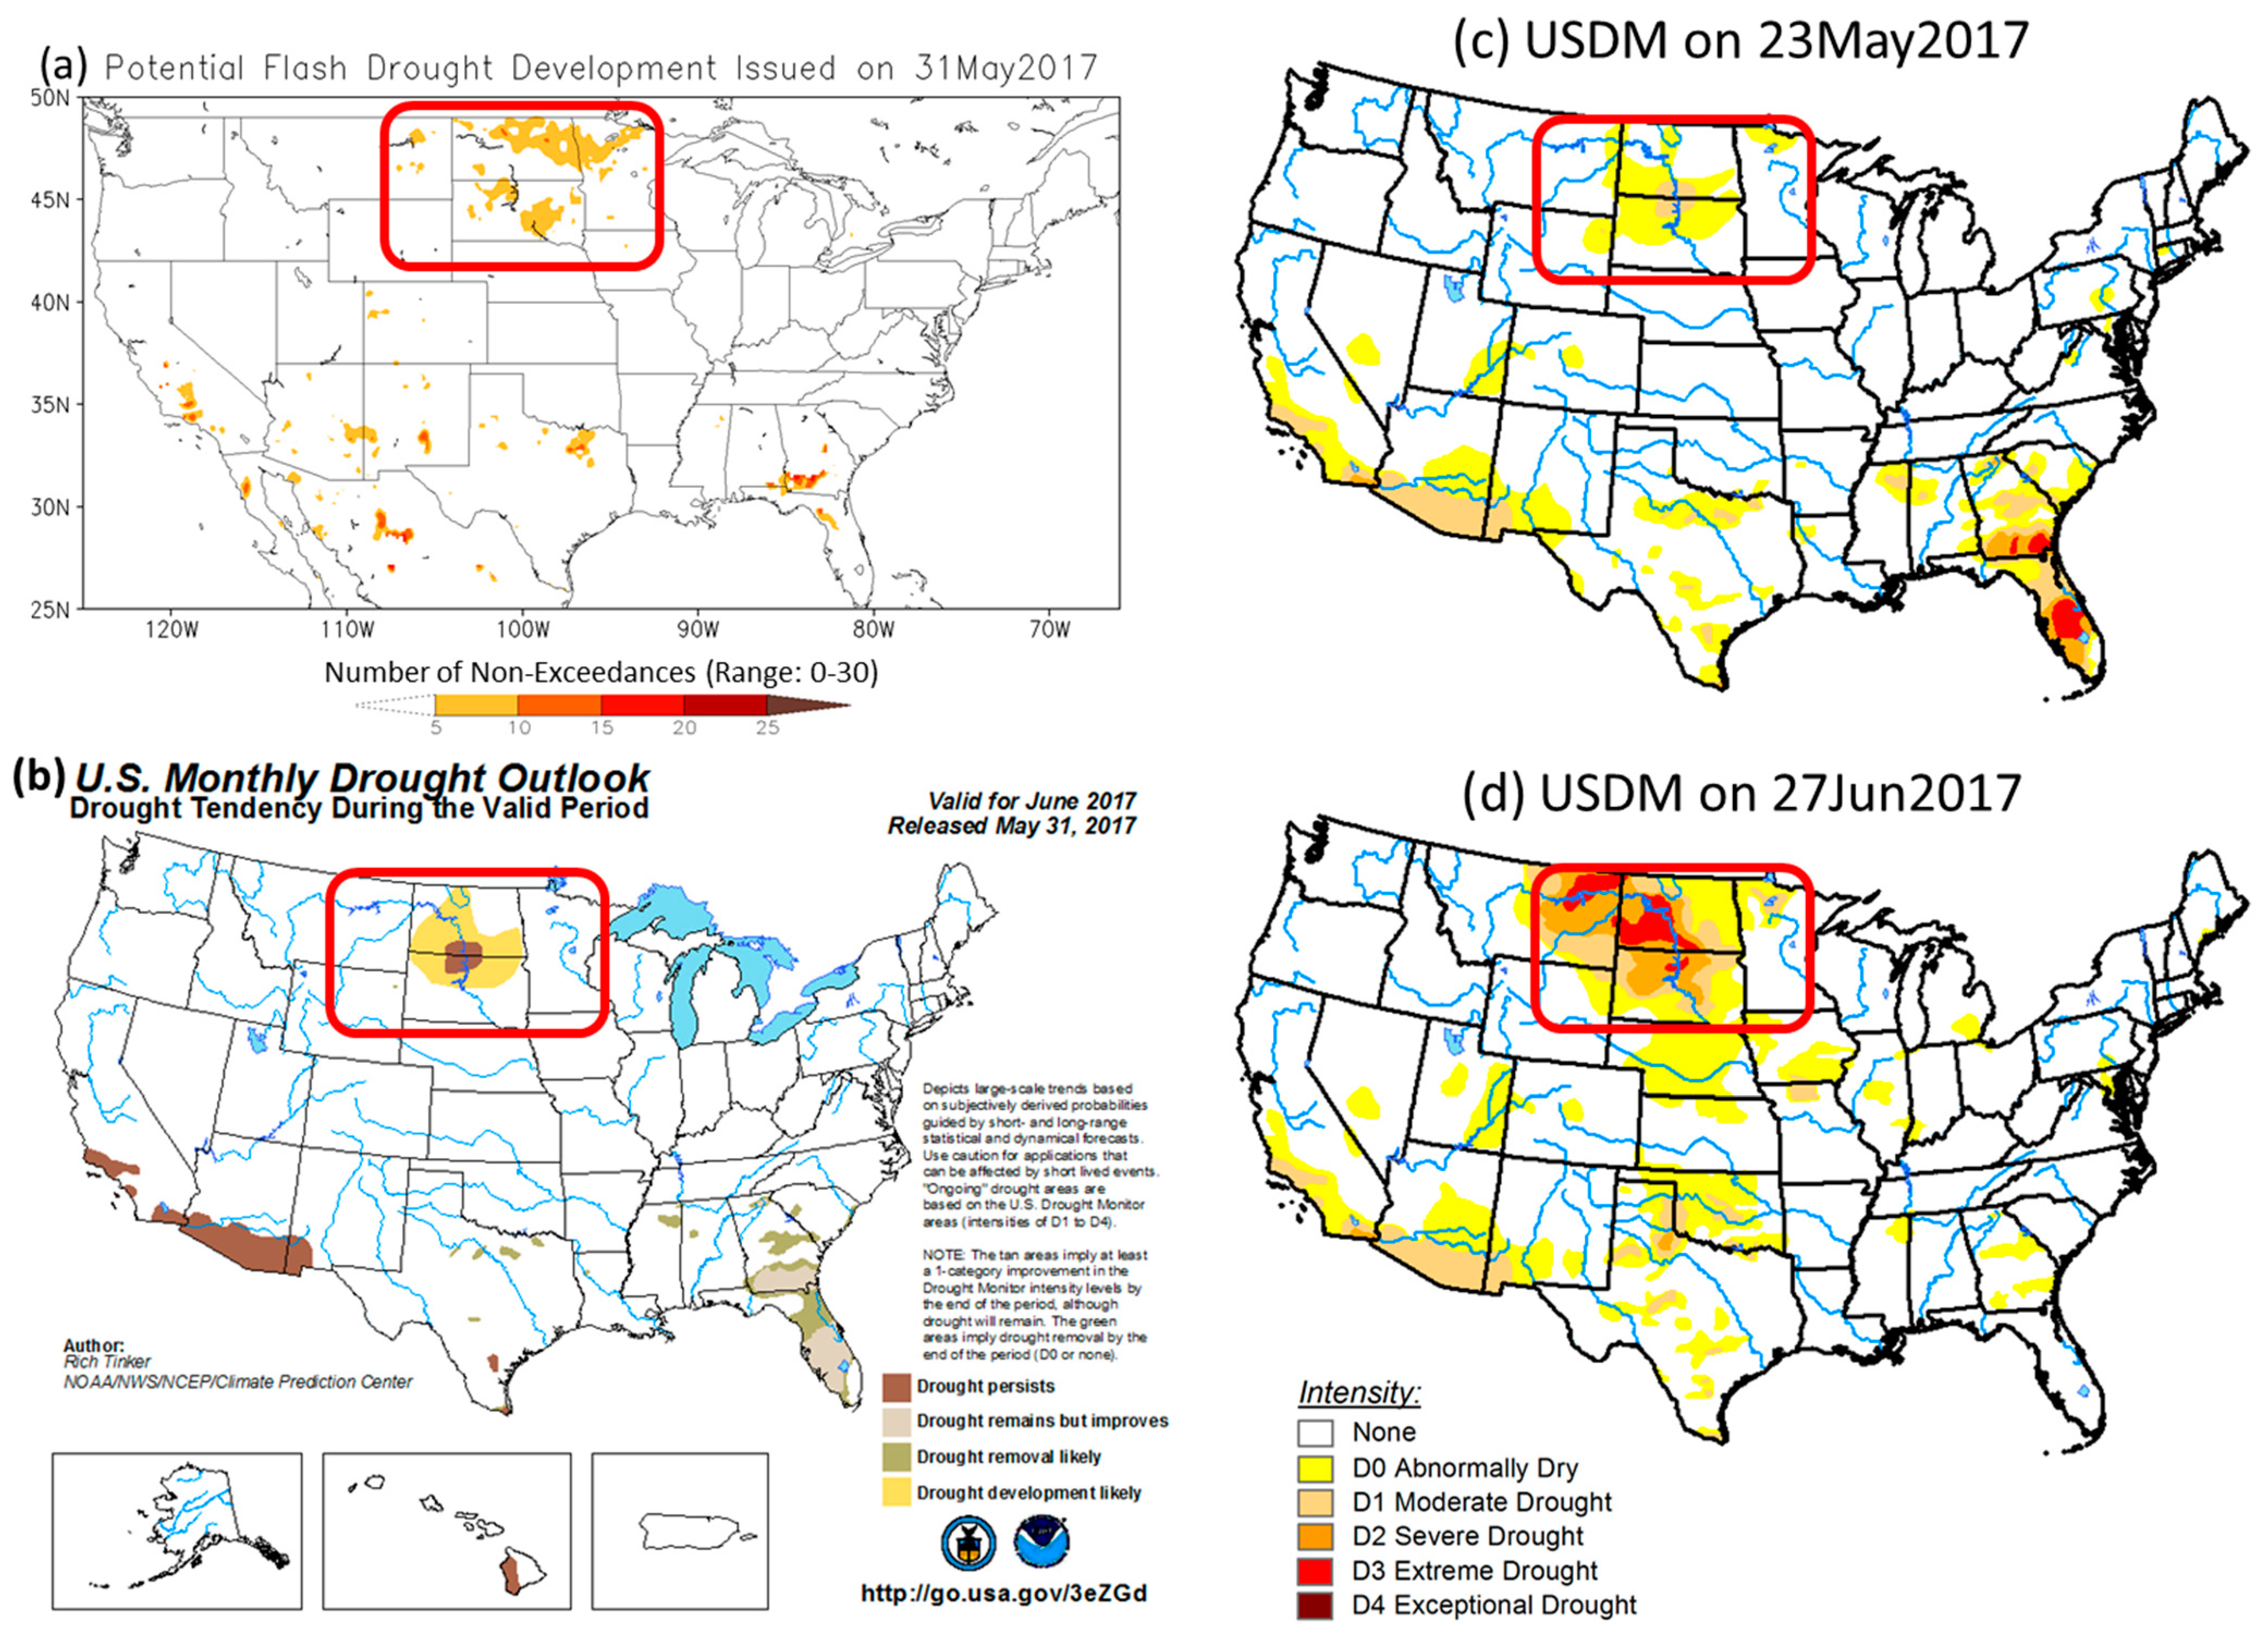
This flash drought was not forecasted in the MDO for May 2017 (
Figure 4b), and the inability to predict this event was the motivation to create the flash drought development tool at CPC. To see if the tool can predict this event, we applied the tool to reforecast the 2017 Northern High Plains flash drought.
Figure 4a shows the potential flash drought development issued on 30 April 2017. In the map, yellow-to-red colors indicate areas with potential drought development or intensification. The higher the number of non-exceedances, the more likely for drought to develop or intensify. It captured the drought onset signals over the Dakotas and the development signals over the Southeast. This prediction was verified by the changes from the USDM on 25 April compared to 23 May 2017 (
Figure 4c,d), as drought emerged in the Dakotas and intensified over Georgia and Florida during this period.
In the following month on 31 May, the flash drought tool forecasted further drought development in the Dakotas, Northern Minnesota, and Eastern Montana (
Figure 5a). While the MDO released on the same day (
Figure 5b) also forecasted drought expansion, the predicted area was limited to the surrounding of the existing drought area. In contrast, this drought quickly intensified and expanded northward into Eastern Montana and parts of Northern Minnesota, as seen in the USDM on 27 June (
Figure 5d). Some areas experienced more than two categories of drought degradation in the month of June 2017. Although the flash drought tool did not precisely indicate the magnitude of the intensification of this drought, it performed better than the MDO in predicting the areas of drought expansion.
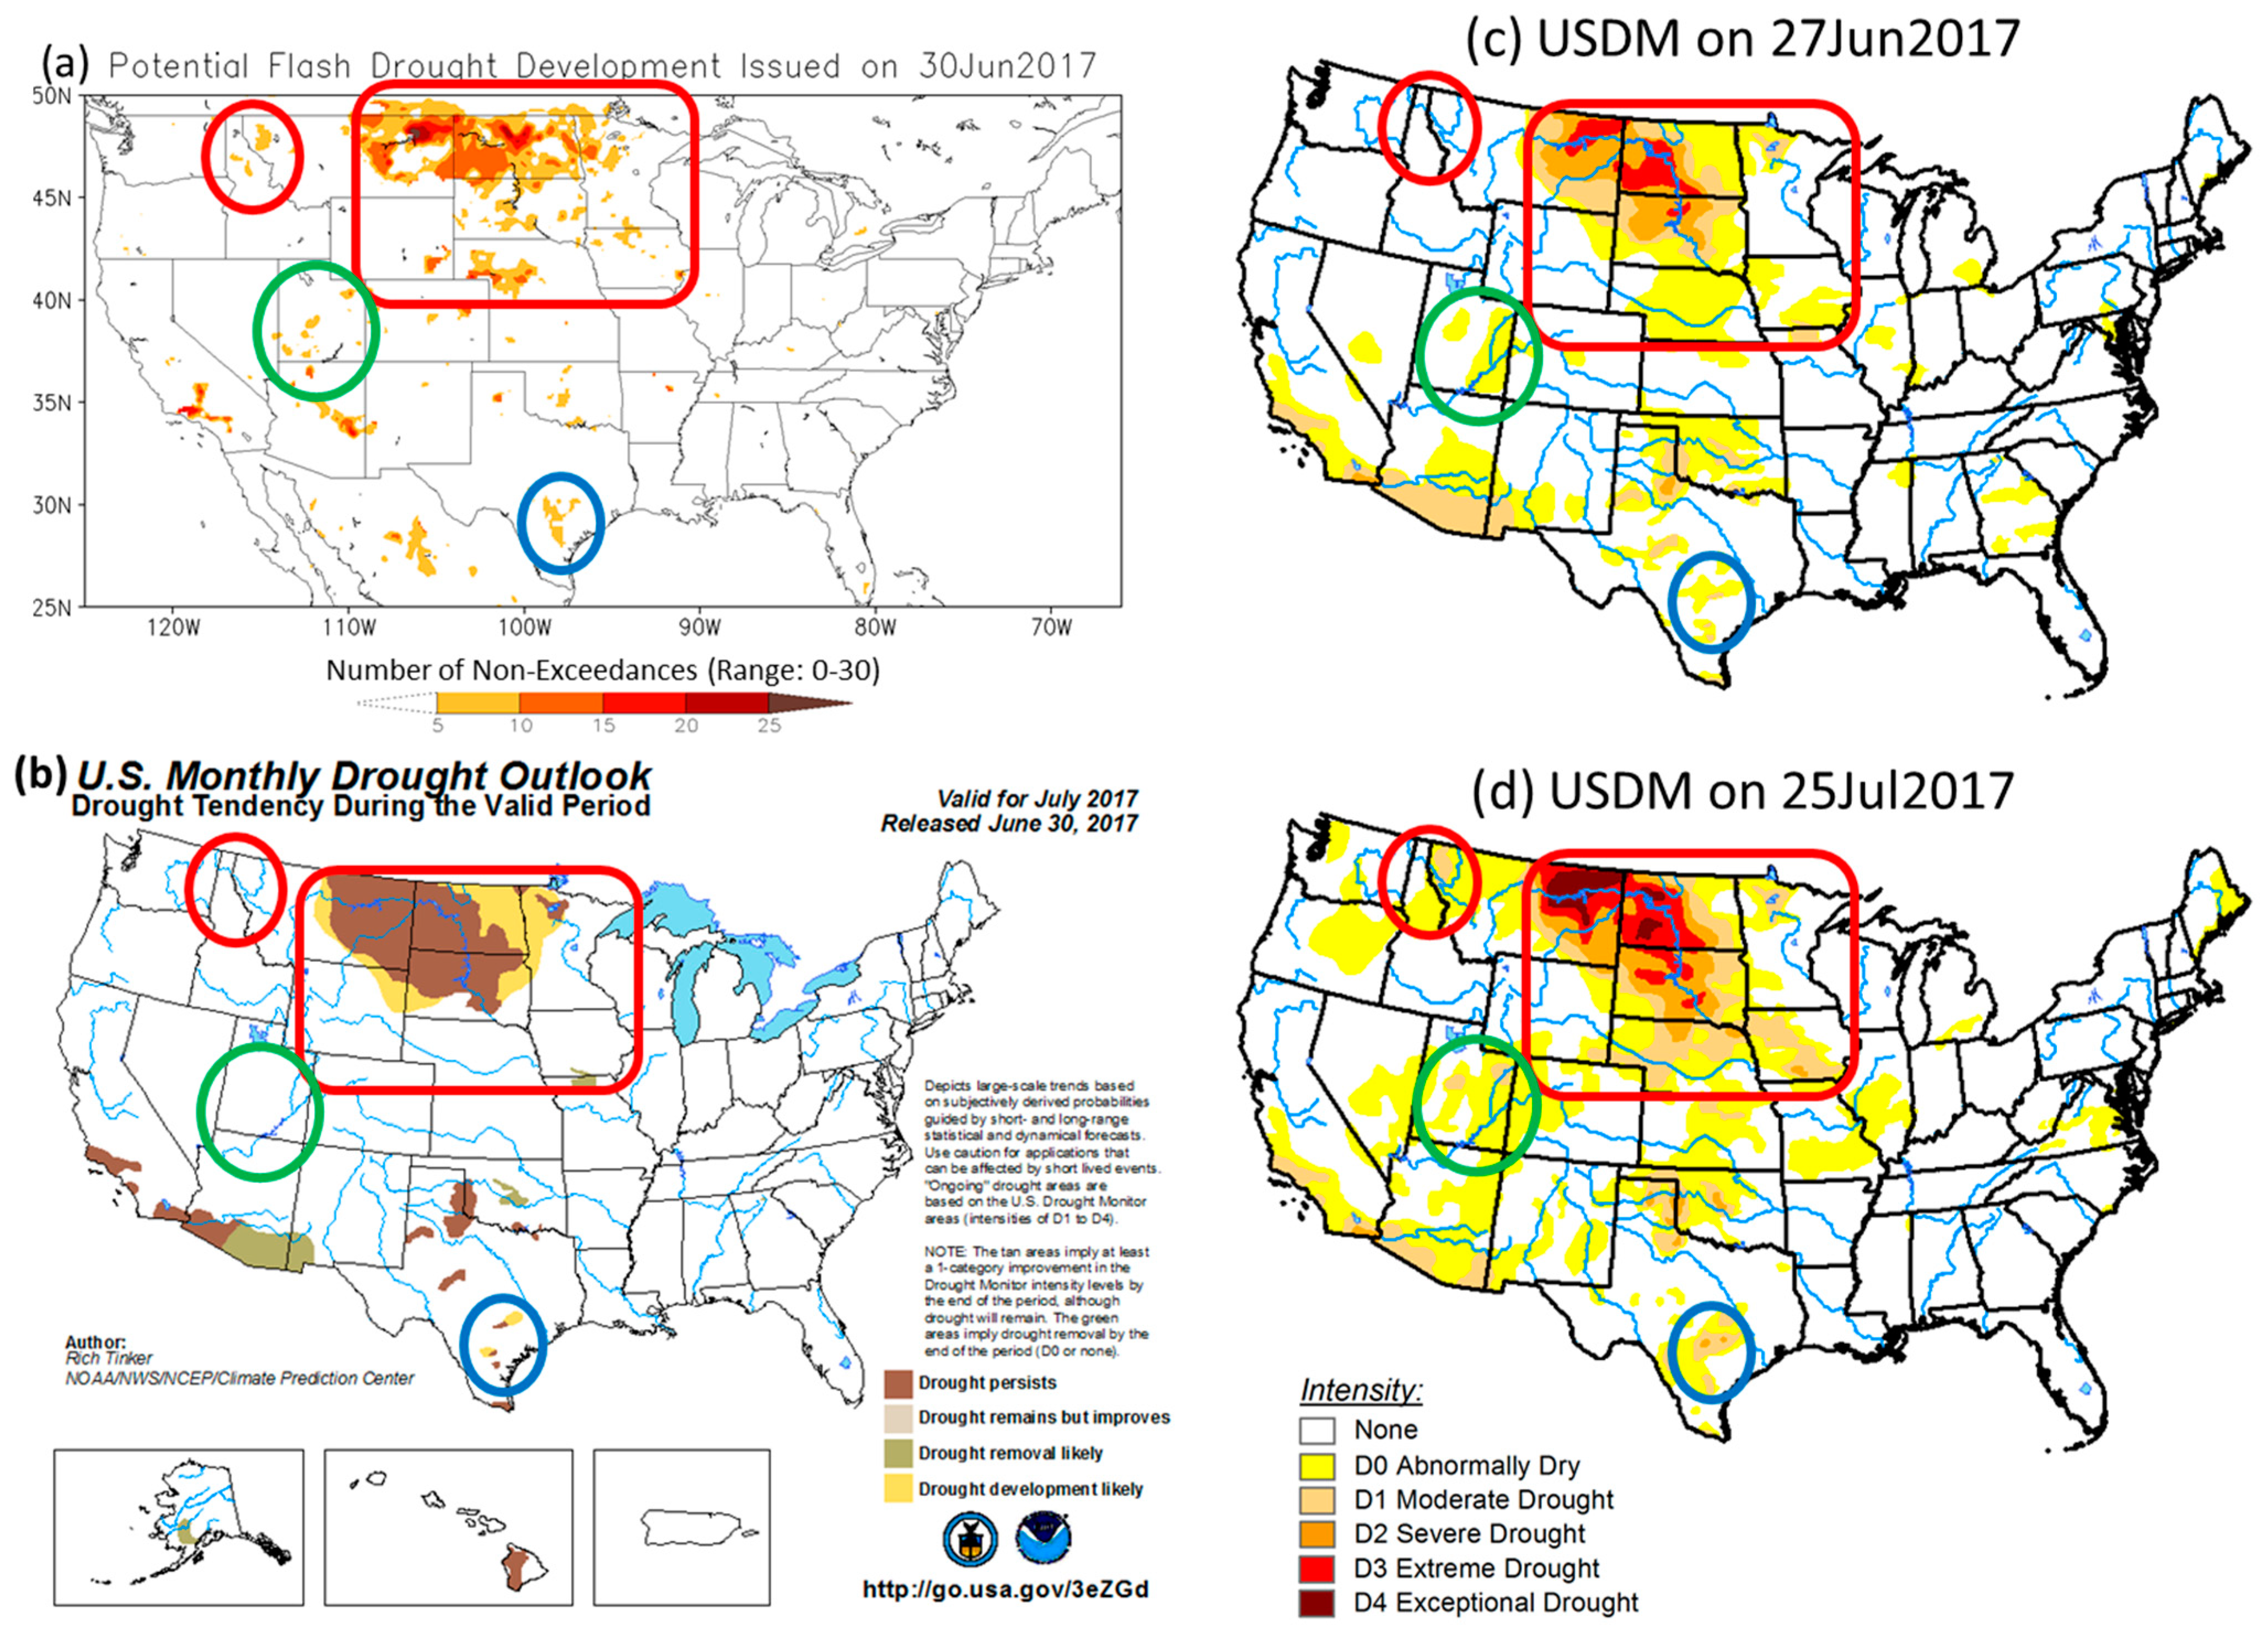
On 30 June, the flash drought tool (
Figure 6a) not only forecasted the intensification/expansion of the Northern High Plains drought, but also three small areas with drought development over Northern Idaho, Central Utah, and Southern Texas. The MDO for July 2017 (
Figure 6b) predicted slight drought expansion over Southern Texas, but it missed the areas of drought development in Northern Idaho and Central Utah, as well as the southward expansion of the Northern High Plains drought. These new areas of drought development and expansion were successfully verified with the USDM on 25 July (
Figure 6d).
In August and September, the flash drought tool continued forecasting the intensification/expansion of the Northern High Plains drought more effectively than the MDO (figures not shown). Overall, the potential flash drought development tool successfully predicted the onset and evolution of the Northern High Plains drought and demonstrated superior performance than the MDO for the 2017 warm season. Because of this success, the flash drought tool was implemented in real time on 1 April 2018 with a latency of four days (same as NLDAS-2 data).
5. Real-Time Prediction of the 2018 Warm Season
To evaluate how the flash drought tool functions in real time, we closely monitor its performance on a regular basis.
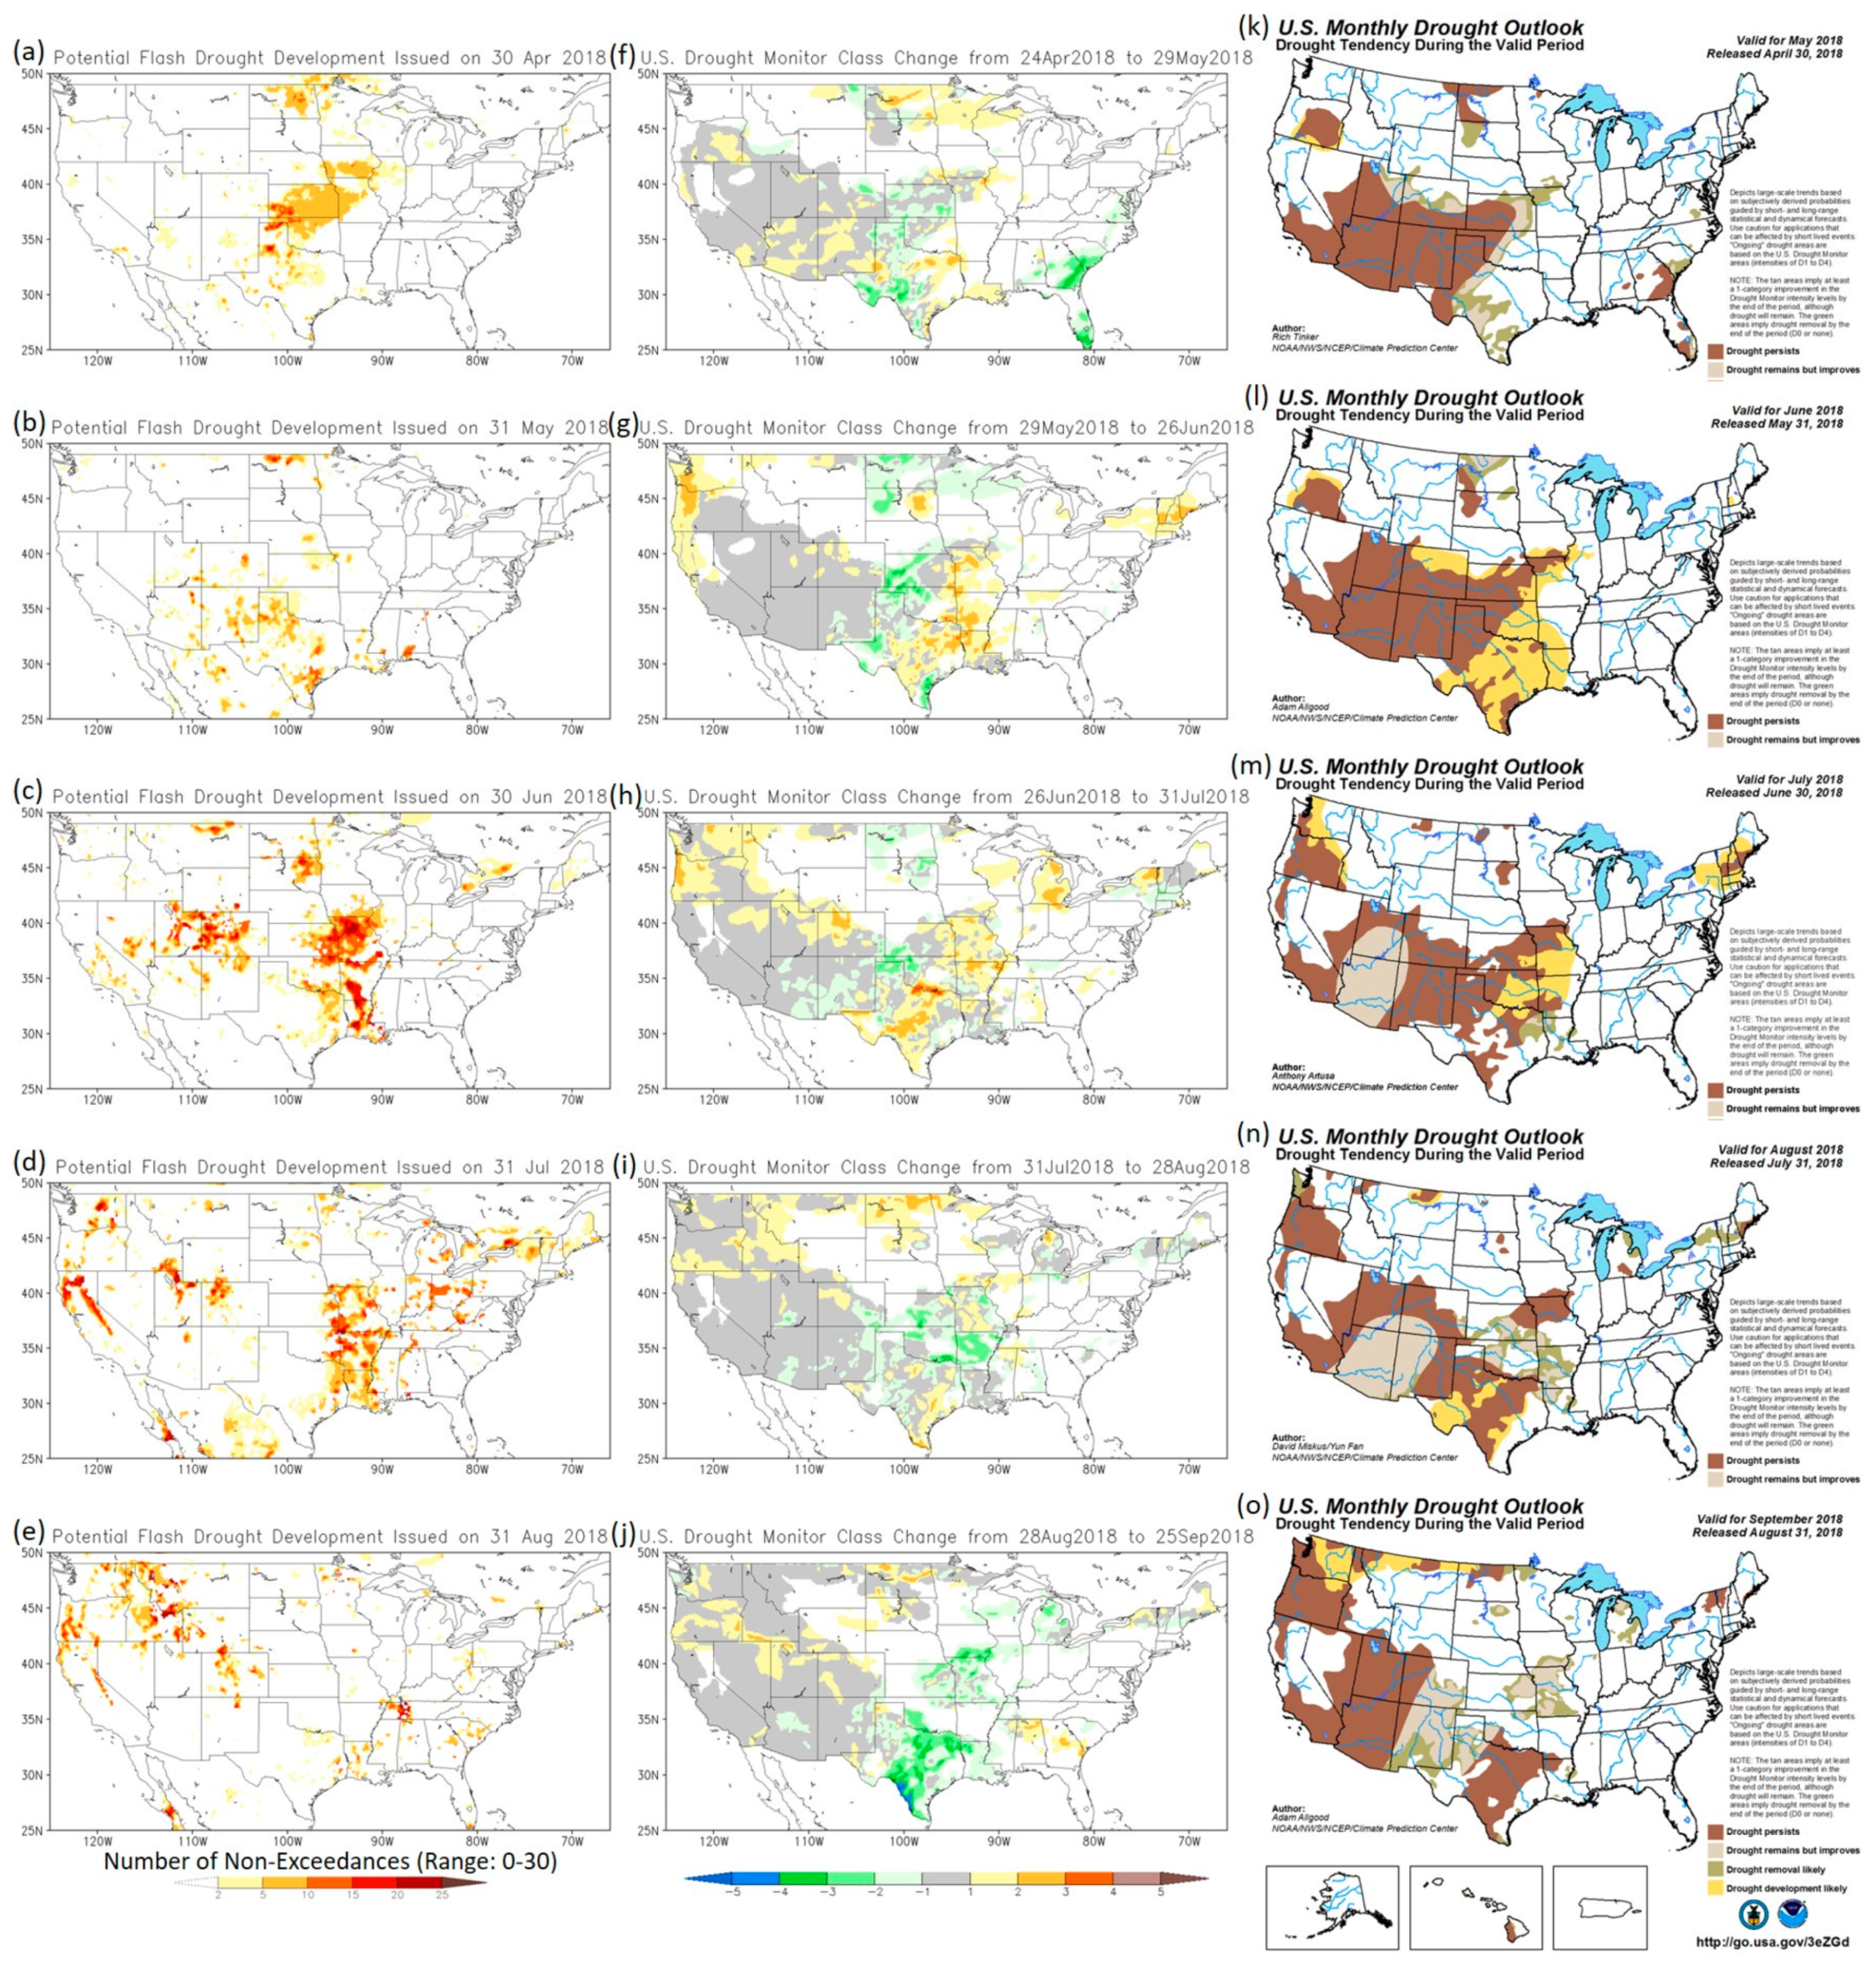
Figure 7 presents the qualitative assessment of the flash drought tool for the 2018 warm season. The new tool’s predictions valid for May to September 2018 are shown in the left column of
Figure 7, and the MDO released on the same dates are shown in the right column of
Figure 7 for comparison. The middle column of
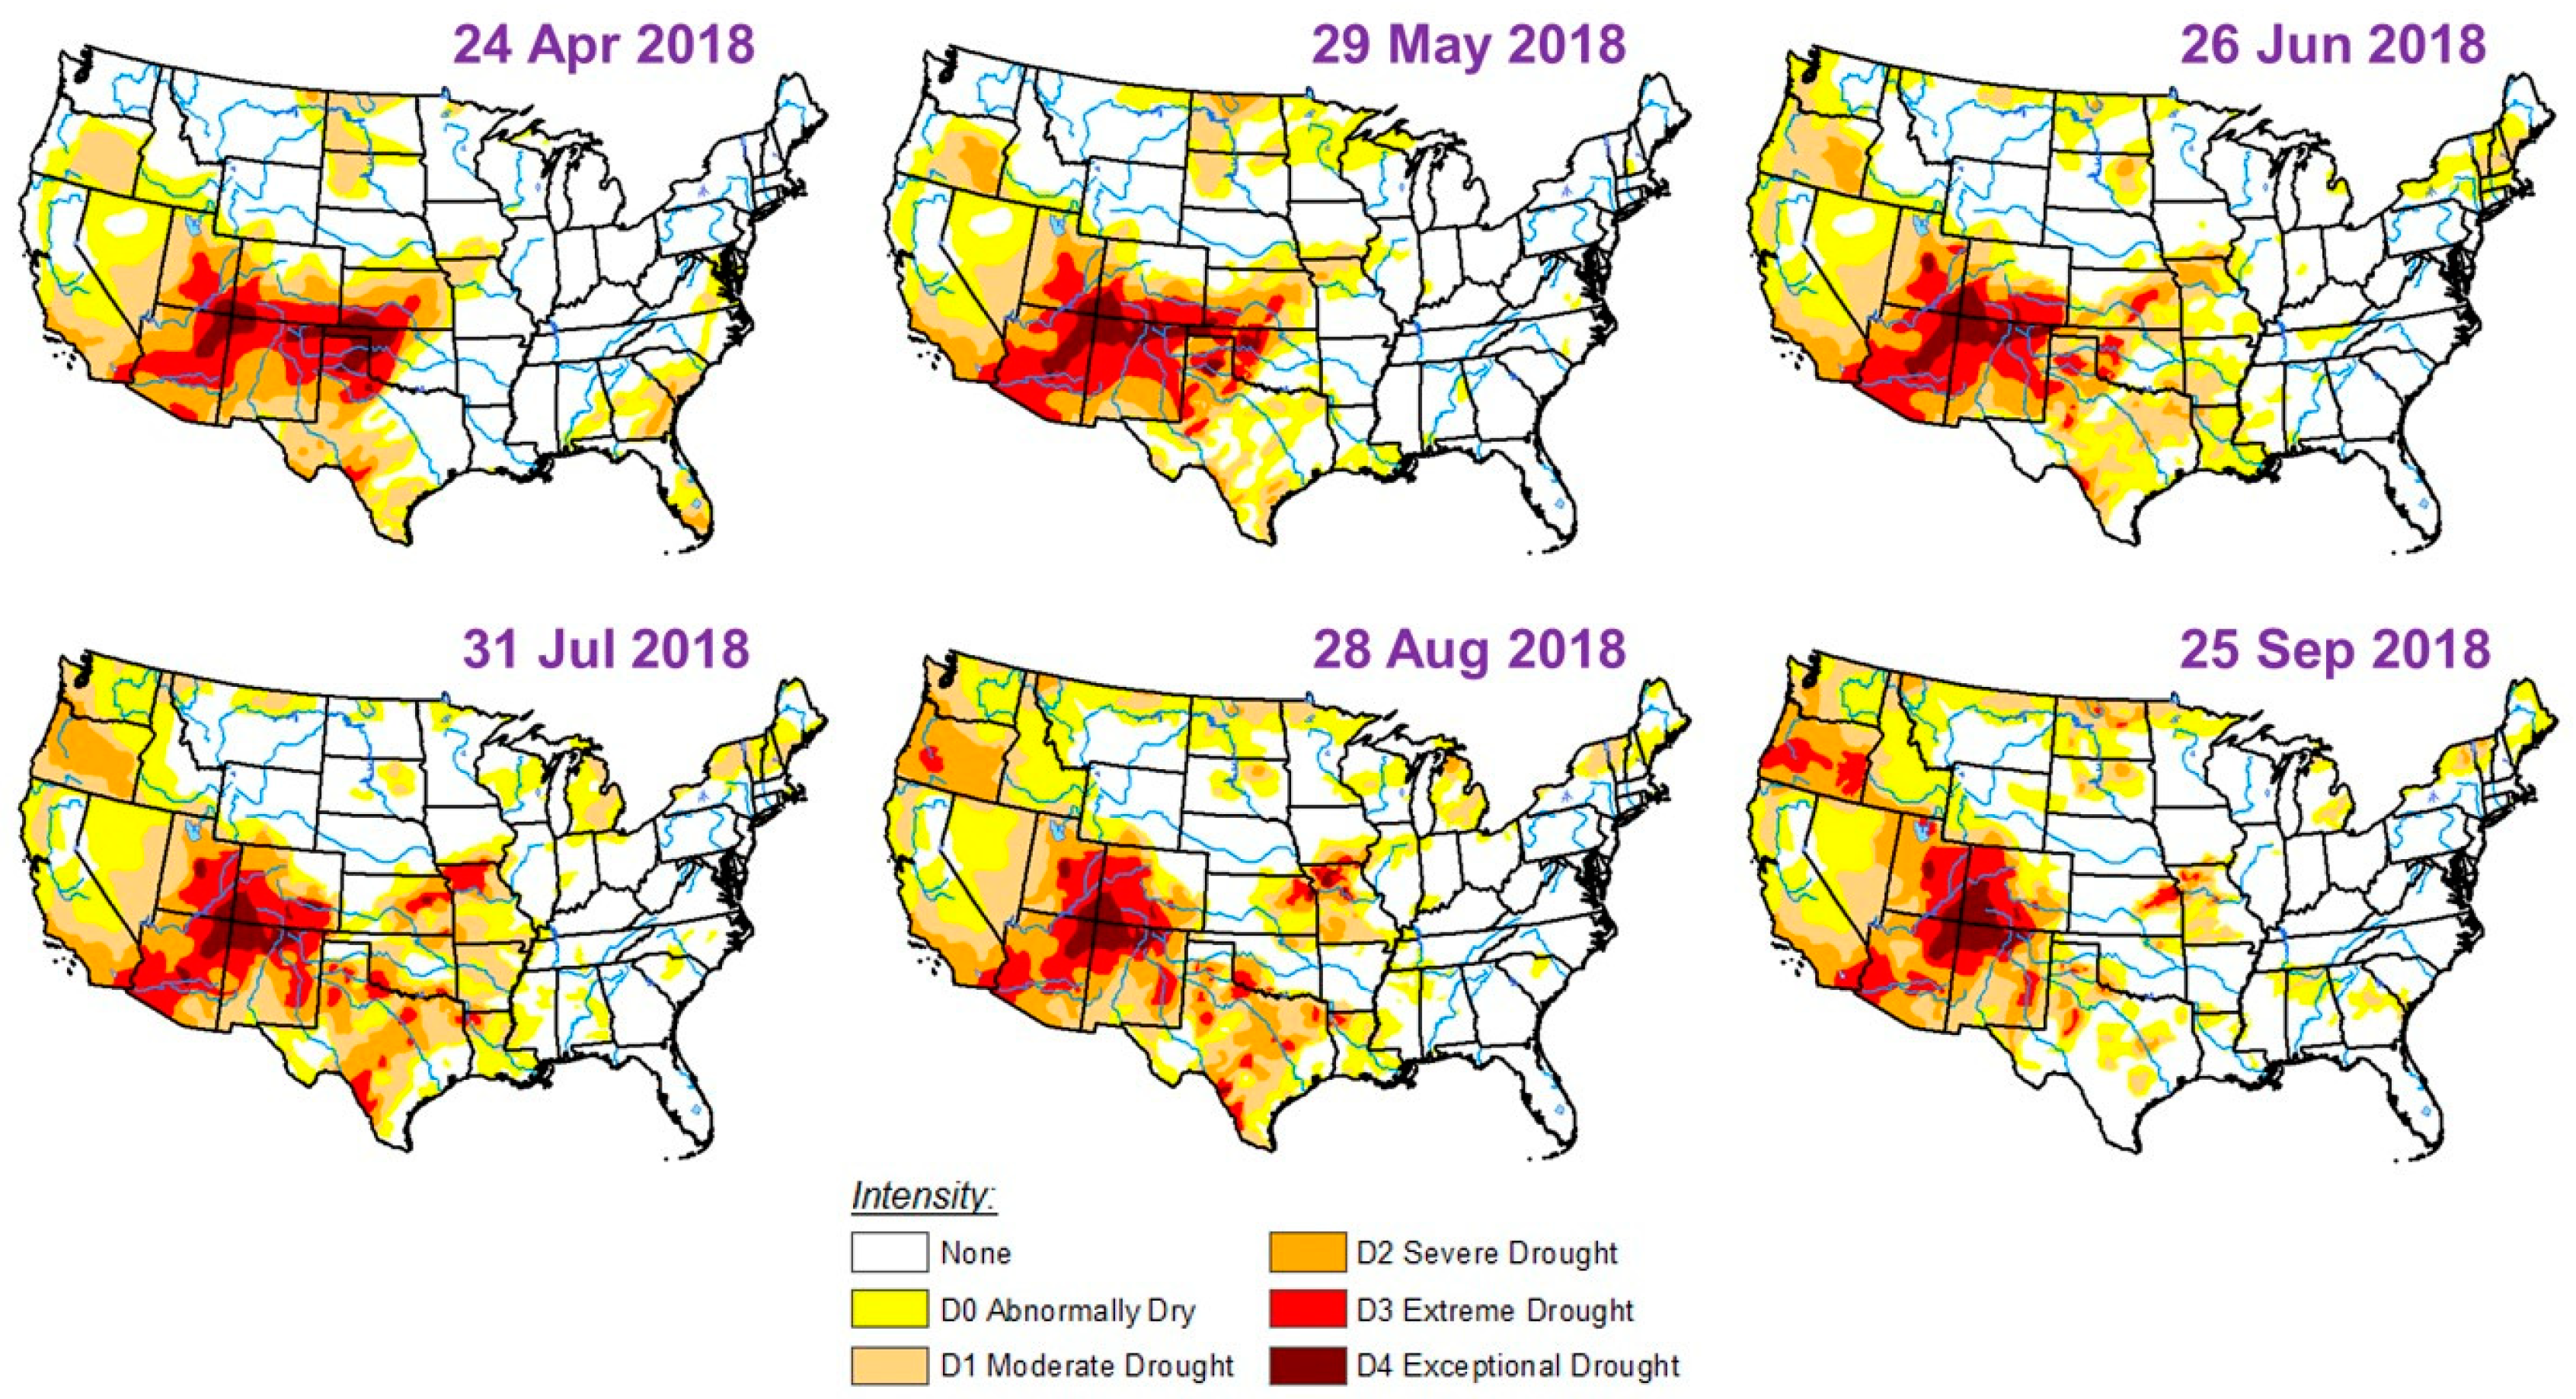
Figure 7 displays the USDM class change maps for the same months using the USDM maps at the end of each month seen in
Figure 8. In the class change maps, positive one indicates one category degradation of drought during the period between the specified dates, positive two indicates two categories degradation of drought during the specified period, and so on. Oppositely, negative numbers indicate the number of drought categories improvement during the specified period. Areas without changes in drought category/class are shown in grey. Areas not in any drought category are shown in white. Please note that USDM class change maps include D0 as a drought category in the calculation, albeit areas in D0 are not officially in drought. This explains the differences in the colored areas between the USDM class change map and the MDO valid for the same month, as the MDO only shows areas of existing and predicted drought (i.e., class of D1 and above) in color based on the USDM map at the end of the previous month. The USDM class change maps are used to directly identify areas with abnormal dryness or drought development/intensification (i.e., areas in yellow to brown colors) for verification of potential flash drought development predictions in the operational context.
The 2018 warm season was an active drought season with long-term drought mostly apparent in the Western United States (
Figure 8). Our evaluation focused on the Central United States where flash drought is more likely to occur [
13]. At the end of April 2018, the flash drought tool indicated that areas over Eastern North Dakota, Northwestern Minnesota, Southern Iowa, and Northern Missouri were vulnerable to flash drought development (
Figure 7a), and they verified well with the USDM class change map from 24 April to 29 May 2018 (
Figure 7f). The MDO valid for May 2018 (
Figure 7k) did not predict drought development in these areas. The flash drought tool also suggested that drought may intensify over Kansas, parts of Oklahoma, and Northern Texas. However, rainfall in May over this region (as forecasted) brought relief and improved drought conditions. Drought over Missouri/Kansas did not reach peak intensity until June and July, when this region experienced heatwaves.
At the end of May 2018, the new tool forecasted that flash drought may develop over Texas and Louisiana (
Figure 7b), consistent with the MDO (
Figure 7l), and this prediction was verified by the USDM class change map from 29 May to 26 June 2018 (
Figure 7g). The tool did not capture the drought development in New England and Pacific Northwest, as these two regions are less prone to flash drought [
13]. At the end of June 2018, the flash drought tool again suggested widespread drought development over Missouri, Arkansas, and Eastern Kansas, as well as Colorado and Utah (
Figure 7c). Aided by the heatwaves experienced by those regions, this prediction was successfully verified by the USDM class change map from 26 June to 31 July 2018 (
Figure 7h). Yet, drought over Northeastern South Dakota, in opposition to the forecast of development/intensification, was improved by rainfalls that occurred in July. On 31 July, the flash drought tool continued indicating potential drought development over Missouri, Arkansas, Louisiana, and parts of New England, as well as drought onset over the Ohio Valley (
Figure 7d). However, wet conditions were forecasted over the Arkansas/Kansas region and New England, as seen in the MDO (
Figure 7n). As a result, droughts were improved or removed over those two regions (
Figure 7i). In September, a series of rainstorms gradually erased the summer flash drought over the Missouri/Kansas region (
Figure 7j).
The 2018 warm season was different from 2017, in which below normal precipitation exacerbated dryness in the Northern High Plains from May to July 2017, with a few minor rainstorms. In the spring and early summer 2018, however, rainfall varied, and high temperatures/heatwaves alternately occurred throughout the season over the Central United States. The interplay between precipitation and high temperatures appears to be a challenge for flash drought prediction. The first stage of the flash drought tool is solely based on NLDAS-2 monitoring data, and the prediction is made under the assumption of persistence. Therefore, it highlights areas susceptible to flash drought development if antecedent conditions persist into the next month. Predictions that meet the assumption (e.g., areas over Colorado and Utah in July prediction) usually verified well. Conversely, drought development over areas with changing conditions (e.g., a more variable pattern in precipitation and temperature) is generally delayed or erased and not verified.
From these false alarm cases, we noted the values of forecast information. In cases with good forecasts (e.g., Arkansas/Kansas region in August prediction), such information can be used to restrain areas of drought development and foresee potential drought improvement, and thus improve prediction skill. Recent advances in subseasonal forecast systems have made skillful temperature and precipitation forecasts available three weeks ahead of time [
28]. DeAngelis et al. (2020) [
29] investigated the prediction skill of the 2012 Central Great Plains flash drought using subseasonal forecasts and attributed the skillful forecasts to accurate soil moisture initialization. In the next stage, we will take advantage of these newly available models and incorporate subseasonal forecast information into the flash drought tool.
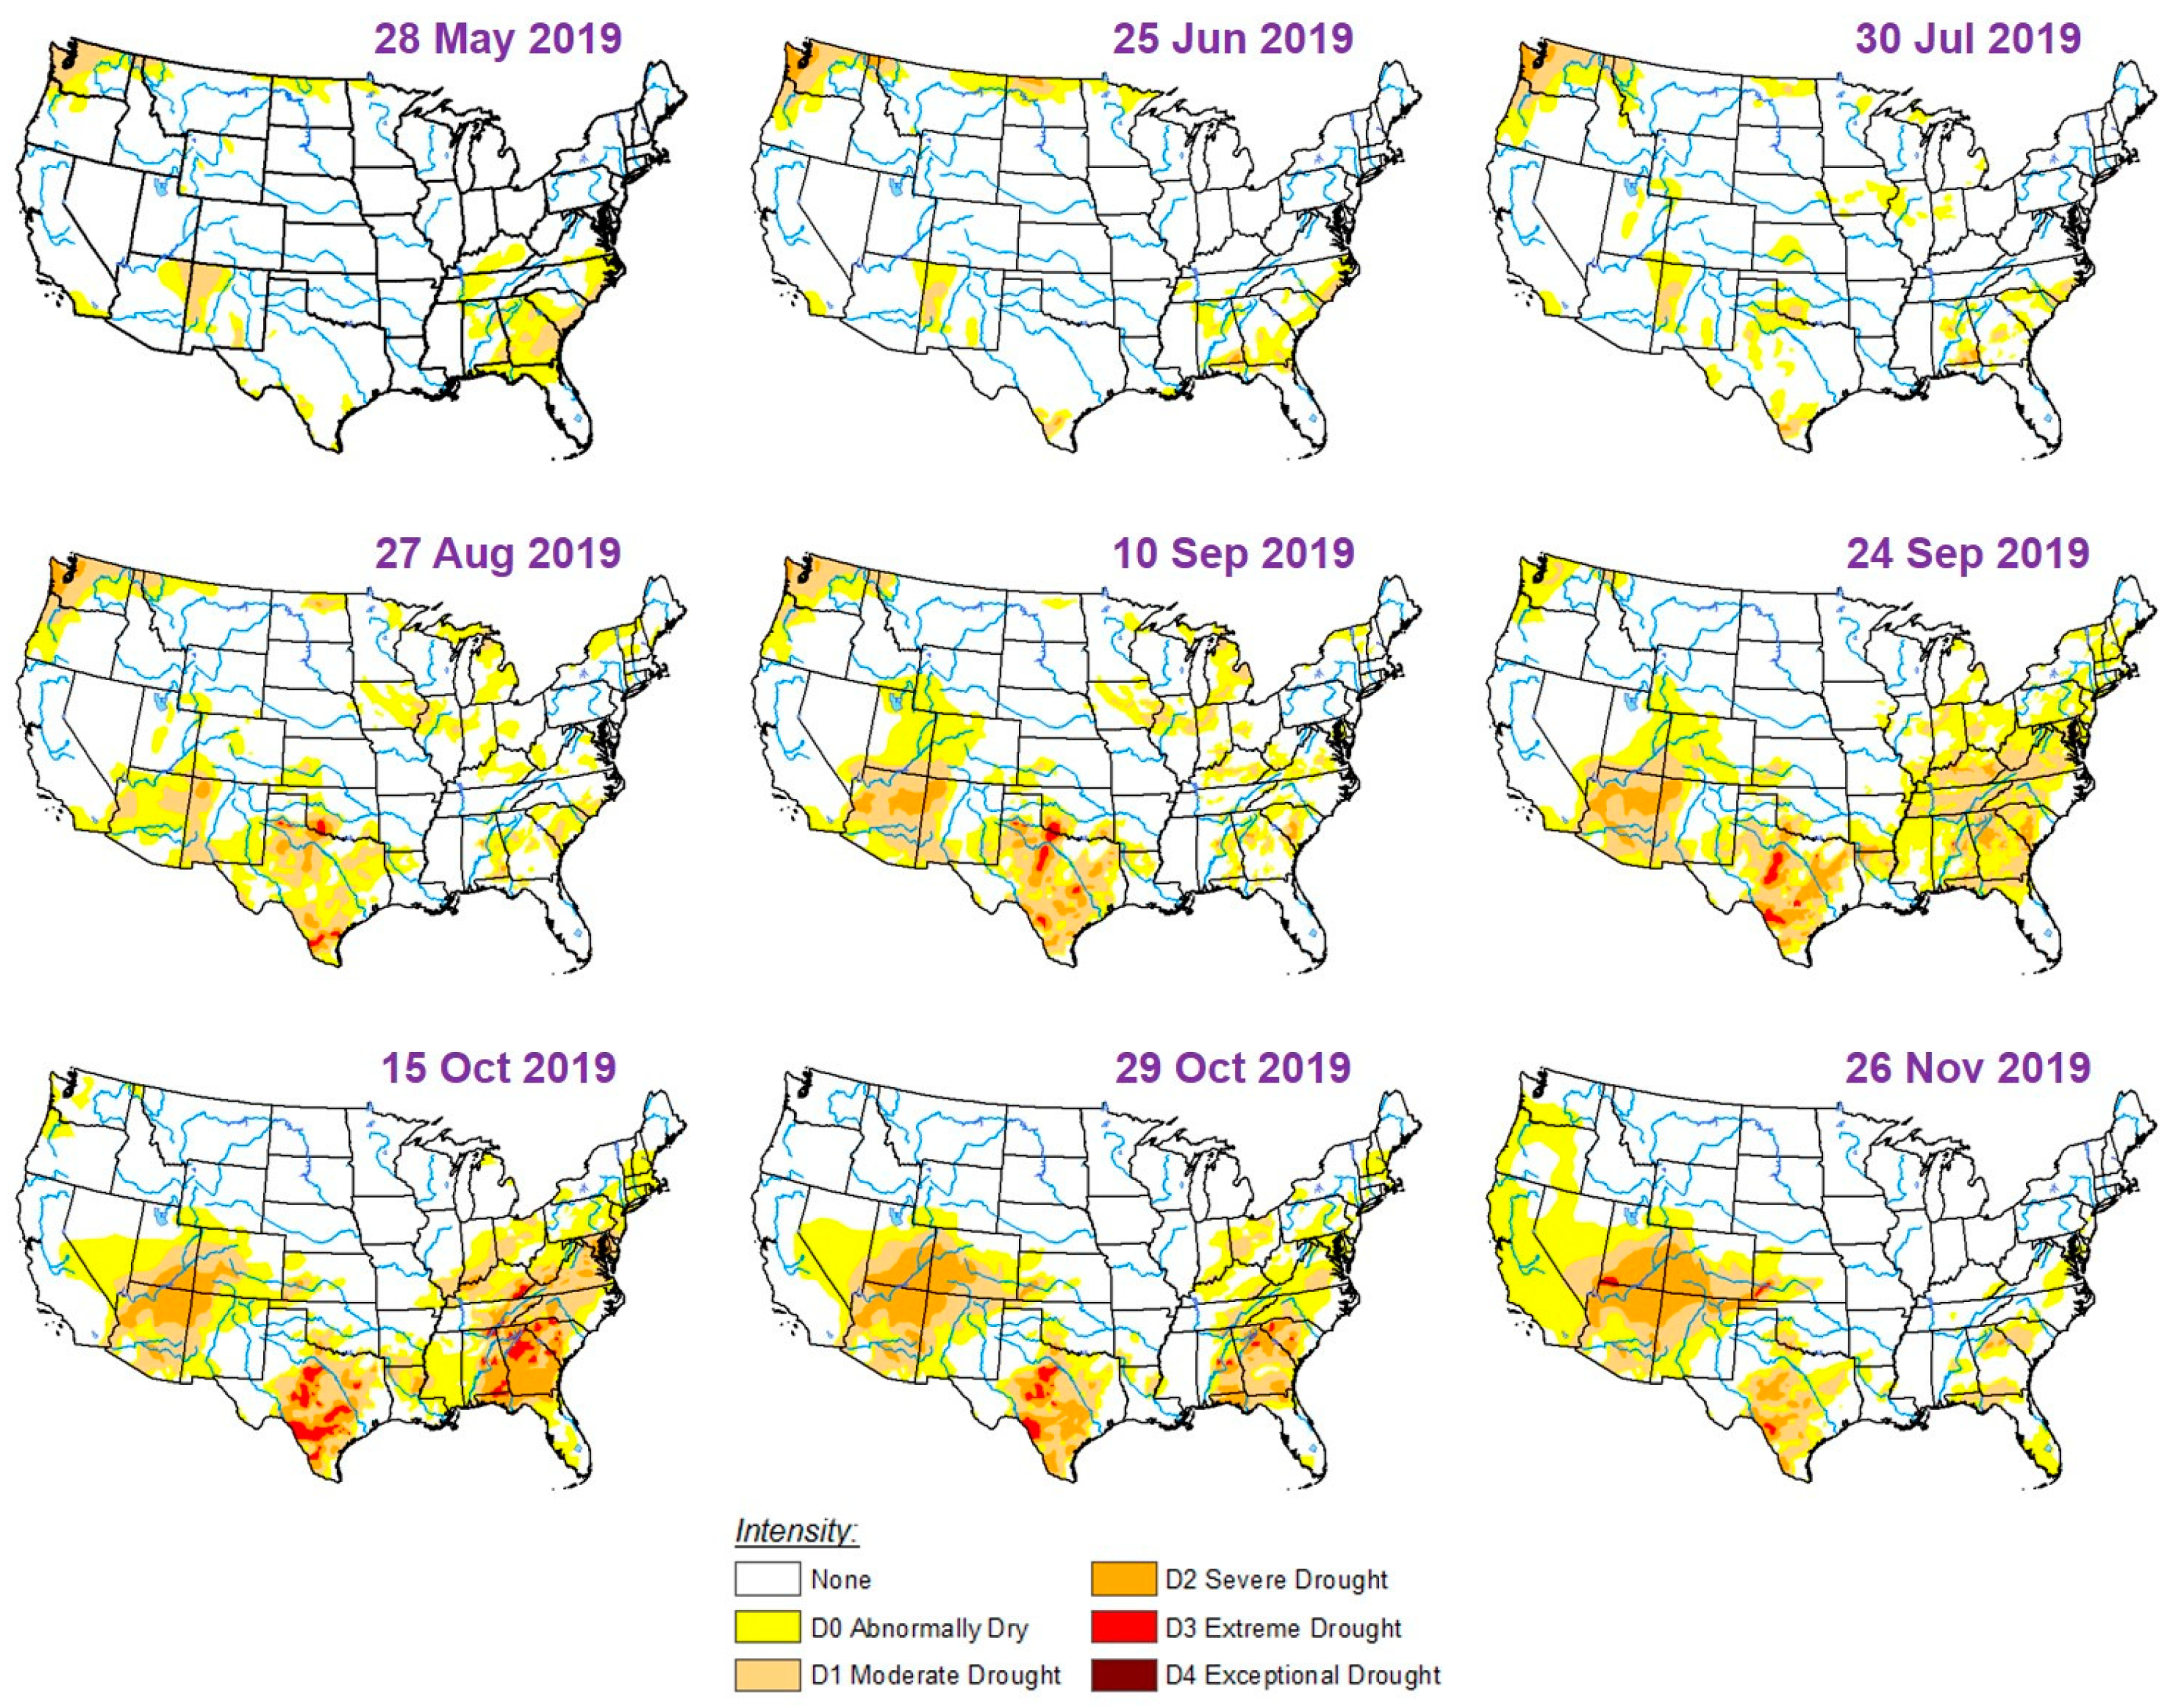
6. Real-Time Prediction of the 2019 Warm Season
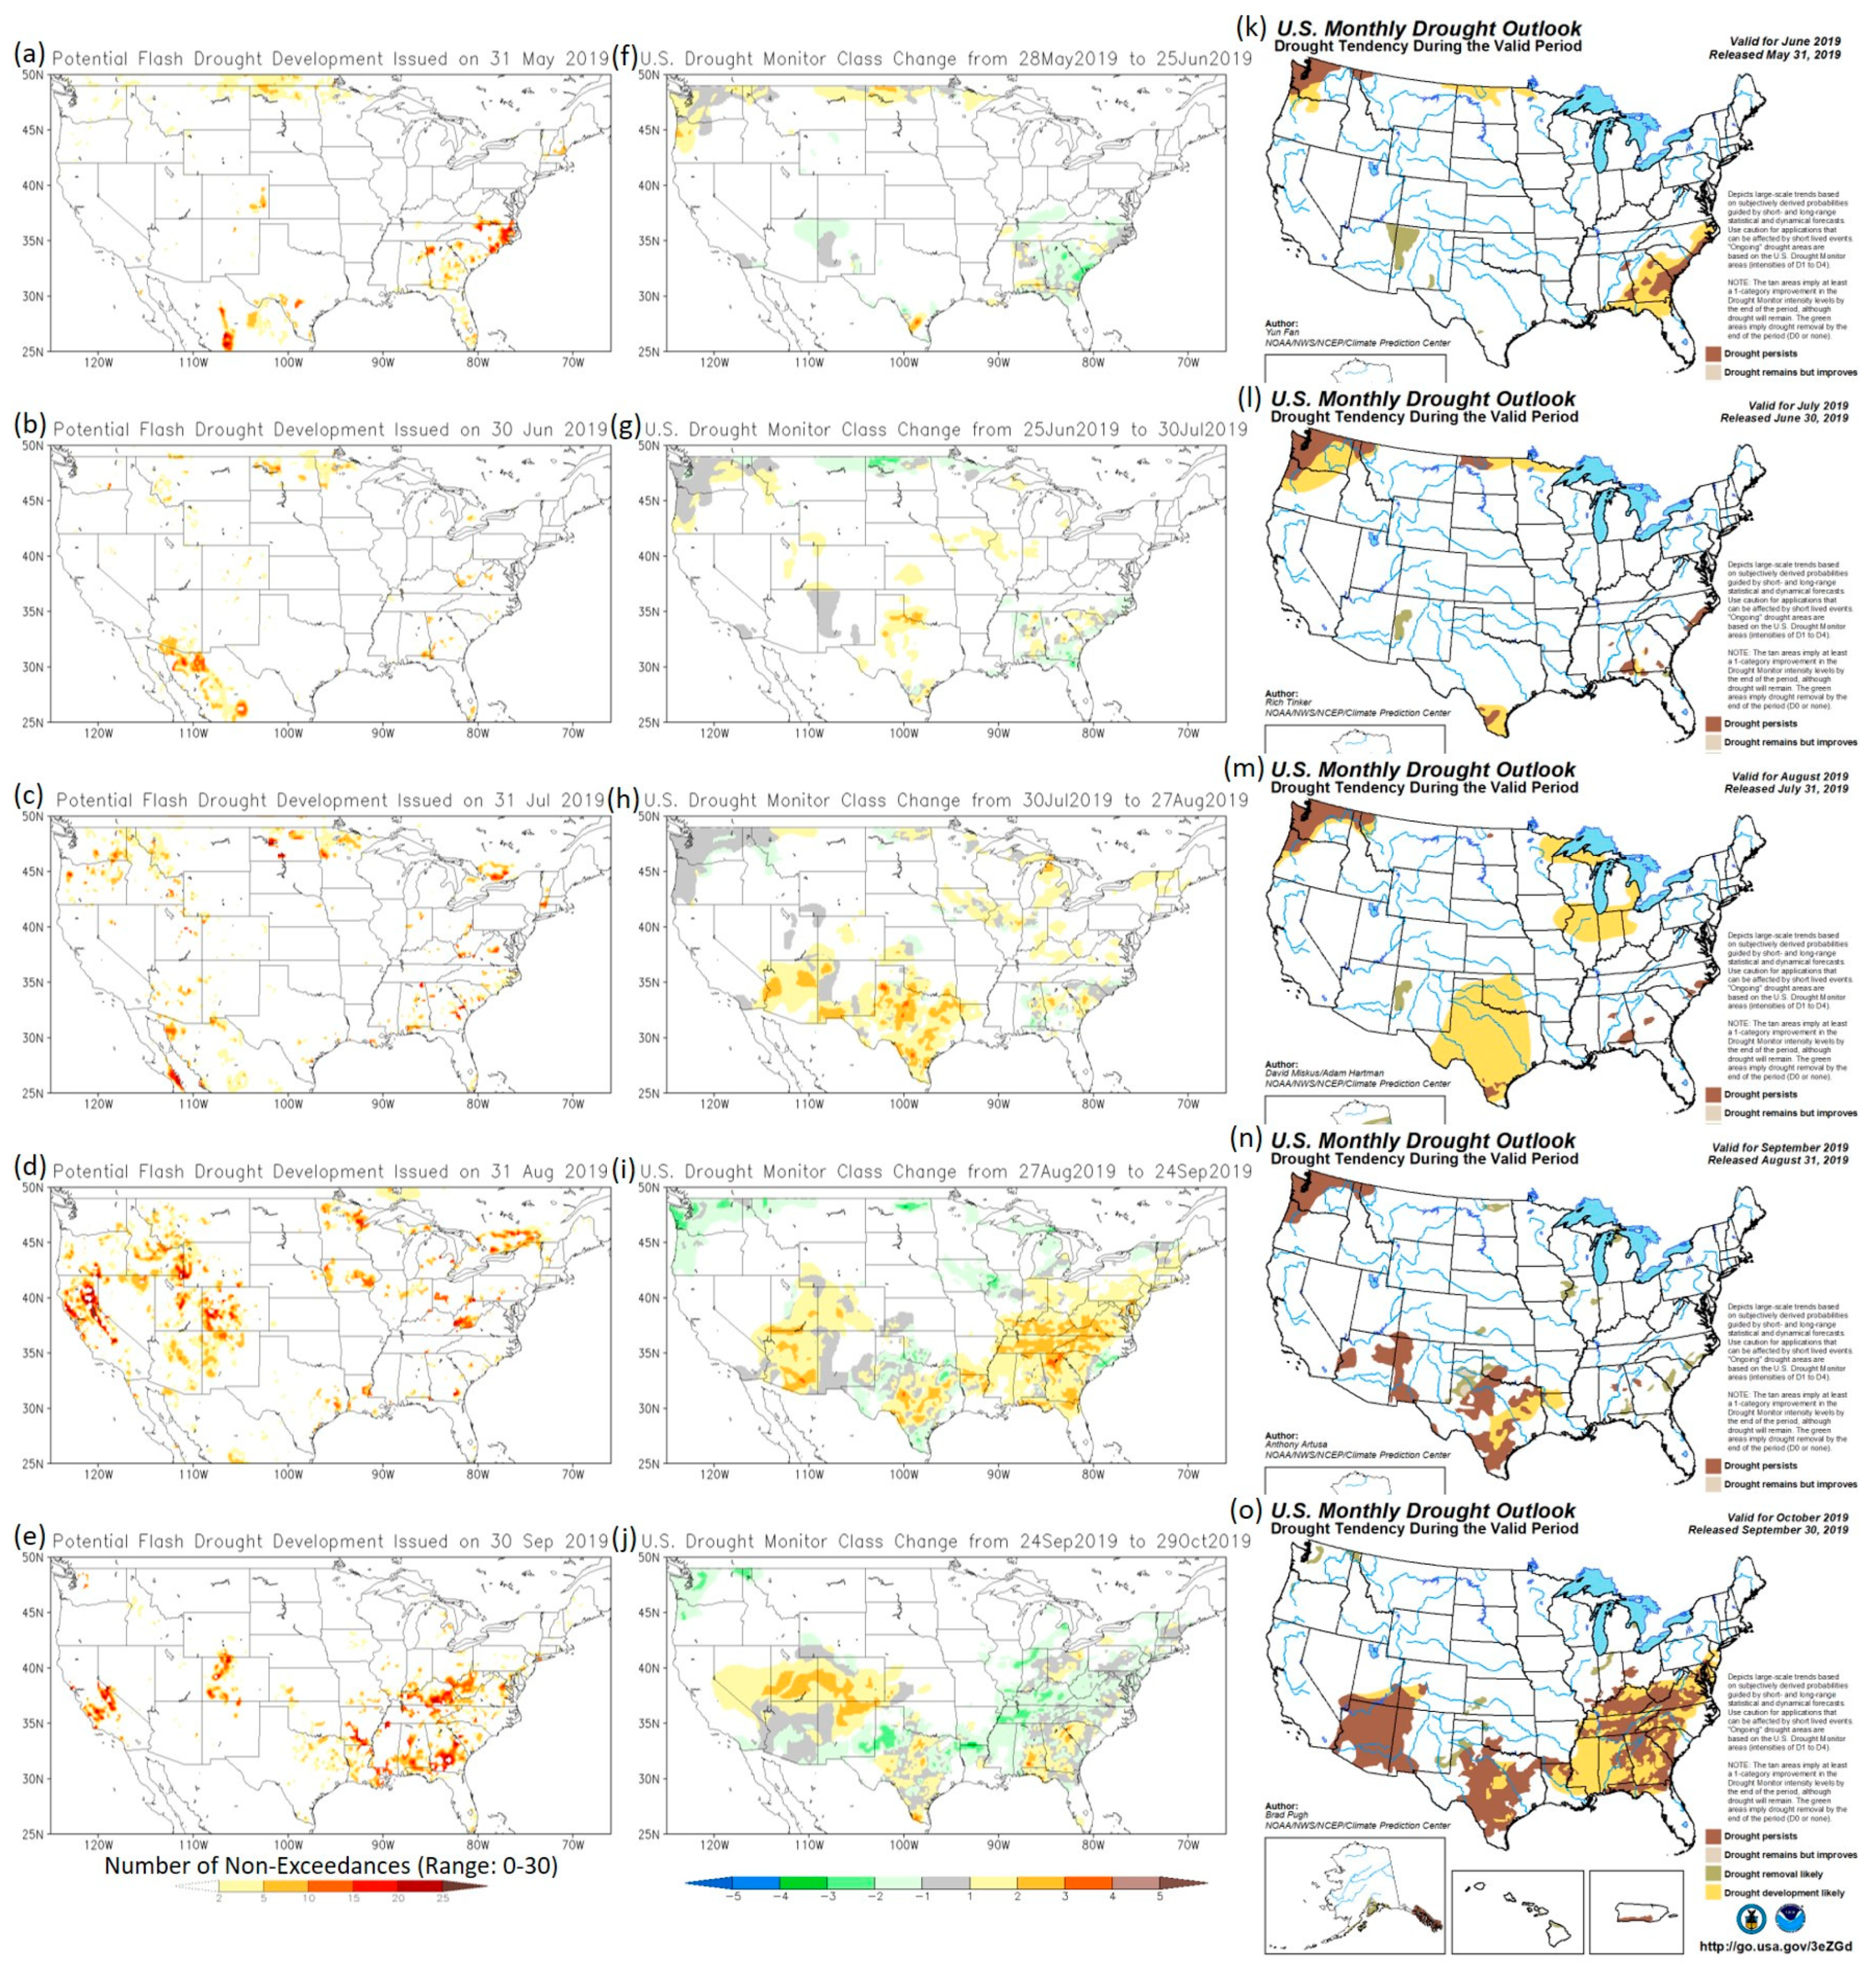
In contrast to the 2018 warm season, drought coverage was relatively low at the beginning of the 2019 warm season from May to July (see
Figure 9). Only two areas of potential drought development were observed in the flash drought prediction for June 2019 (
Figure 10a): one in the northern parts of North Dakota and Minnesota and the other in the Southeast. The small area of drought development over Northern North Dakota was forecasted in the MDO too (
Figure 10k), and successfully verified by the USDM class change map from 28 May to 25 June (
Figure 10f). Conversely, the predicted intensification/expansion of drought over the Southeast was erased by rainfalls that occurred in the region. The MDO failed to predict the drought improvement/removal over the Southeast, as precipitation forecast skill generally is low in May. Therefore, skillful precipitation forecasts are a critical element of reliable flash drought prediction.
On 31 July, as temperatures reached their annual peaks in summertime, a major heatwave was forecasted for the Texas/Oklahoma region. Local impact reports indicated fast drying in the topsoil and unusual wilting in the vegetation. Considering this ancillary information, the MDO valid for August 2019 aggressively issued a flash drought outlook for the region (
Figure 10m), and this prediction was successfully verified by the USDM class change map from 30 July to 27 August (
Figure 10h). One advantage of using experts to synthesize information in MDO production is the flexibility of taking new and different sources of information into account. Expert knowledge and analysis are the keys contributing to this timely and accurate MDO forecast. On the other hand, the current flash drought tool is solely based on NLDAS-2 monitoring data, and it does not consider forecast information and vegetation conditions. As a result, it has limited skill in predicting rapid drought onset driven by vegetation response to upcoming heatwaves, of which forecasts are skillful up to three weeks of lead time. Vegetation response plays an important role in flash drought development. NLDAS-2 uses a fixed set of parameters to characterize various vegetation and soil types across the CONUS, and hence it cannot accommodate changes in vegetation and soil conditions, such as vegetation growth/decay or burned soil after a wildfire. Future advances in assimilating vegetation dynamics and changes in soil properties into NLDAS will enhance the predictive capability of such events.
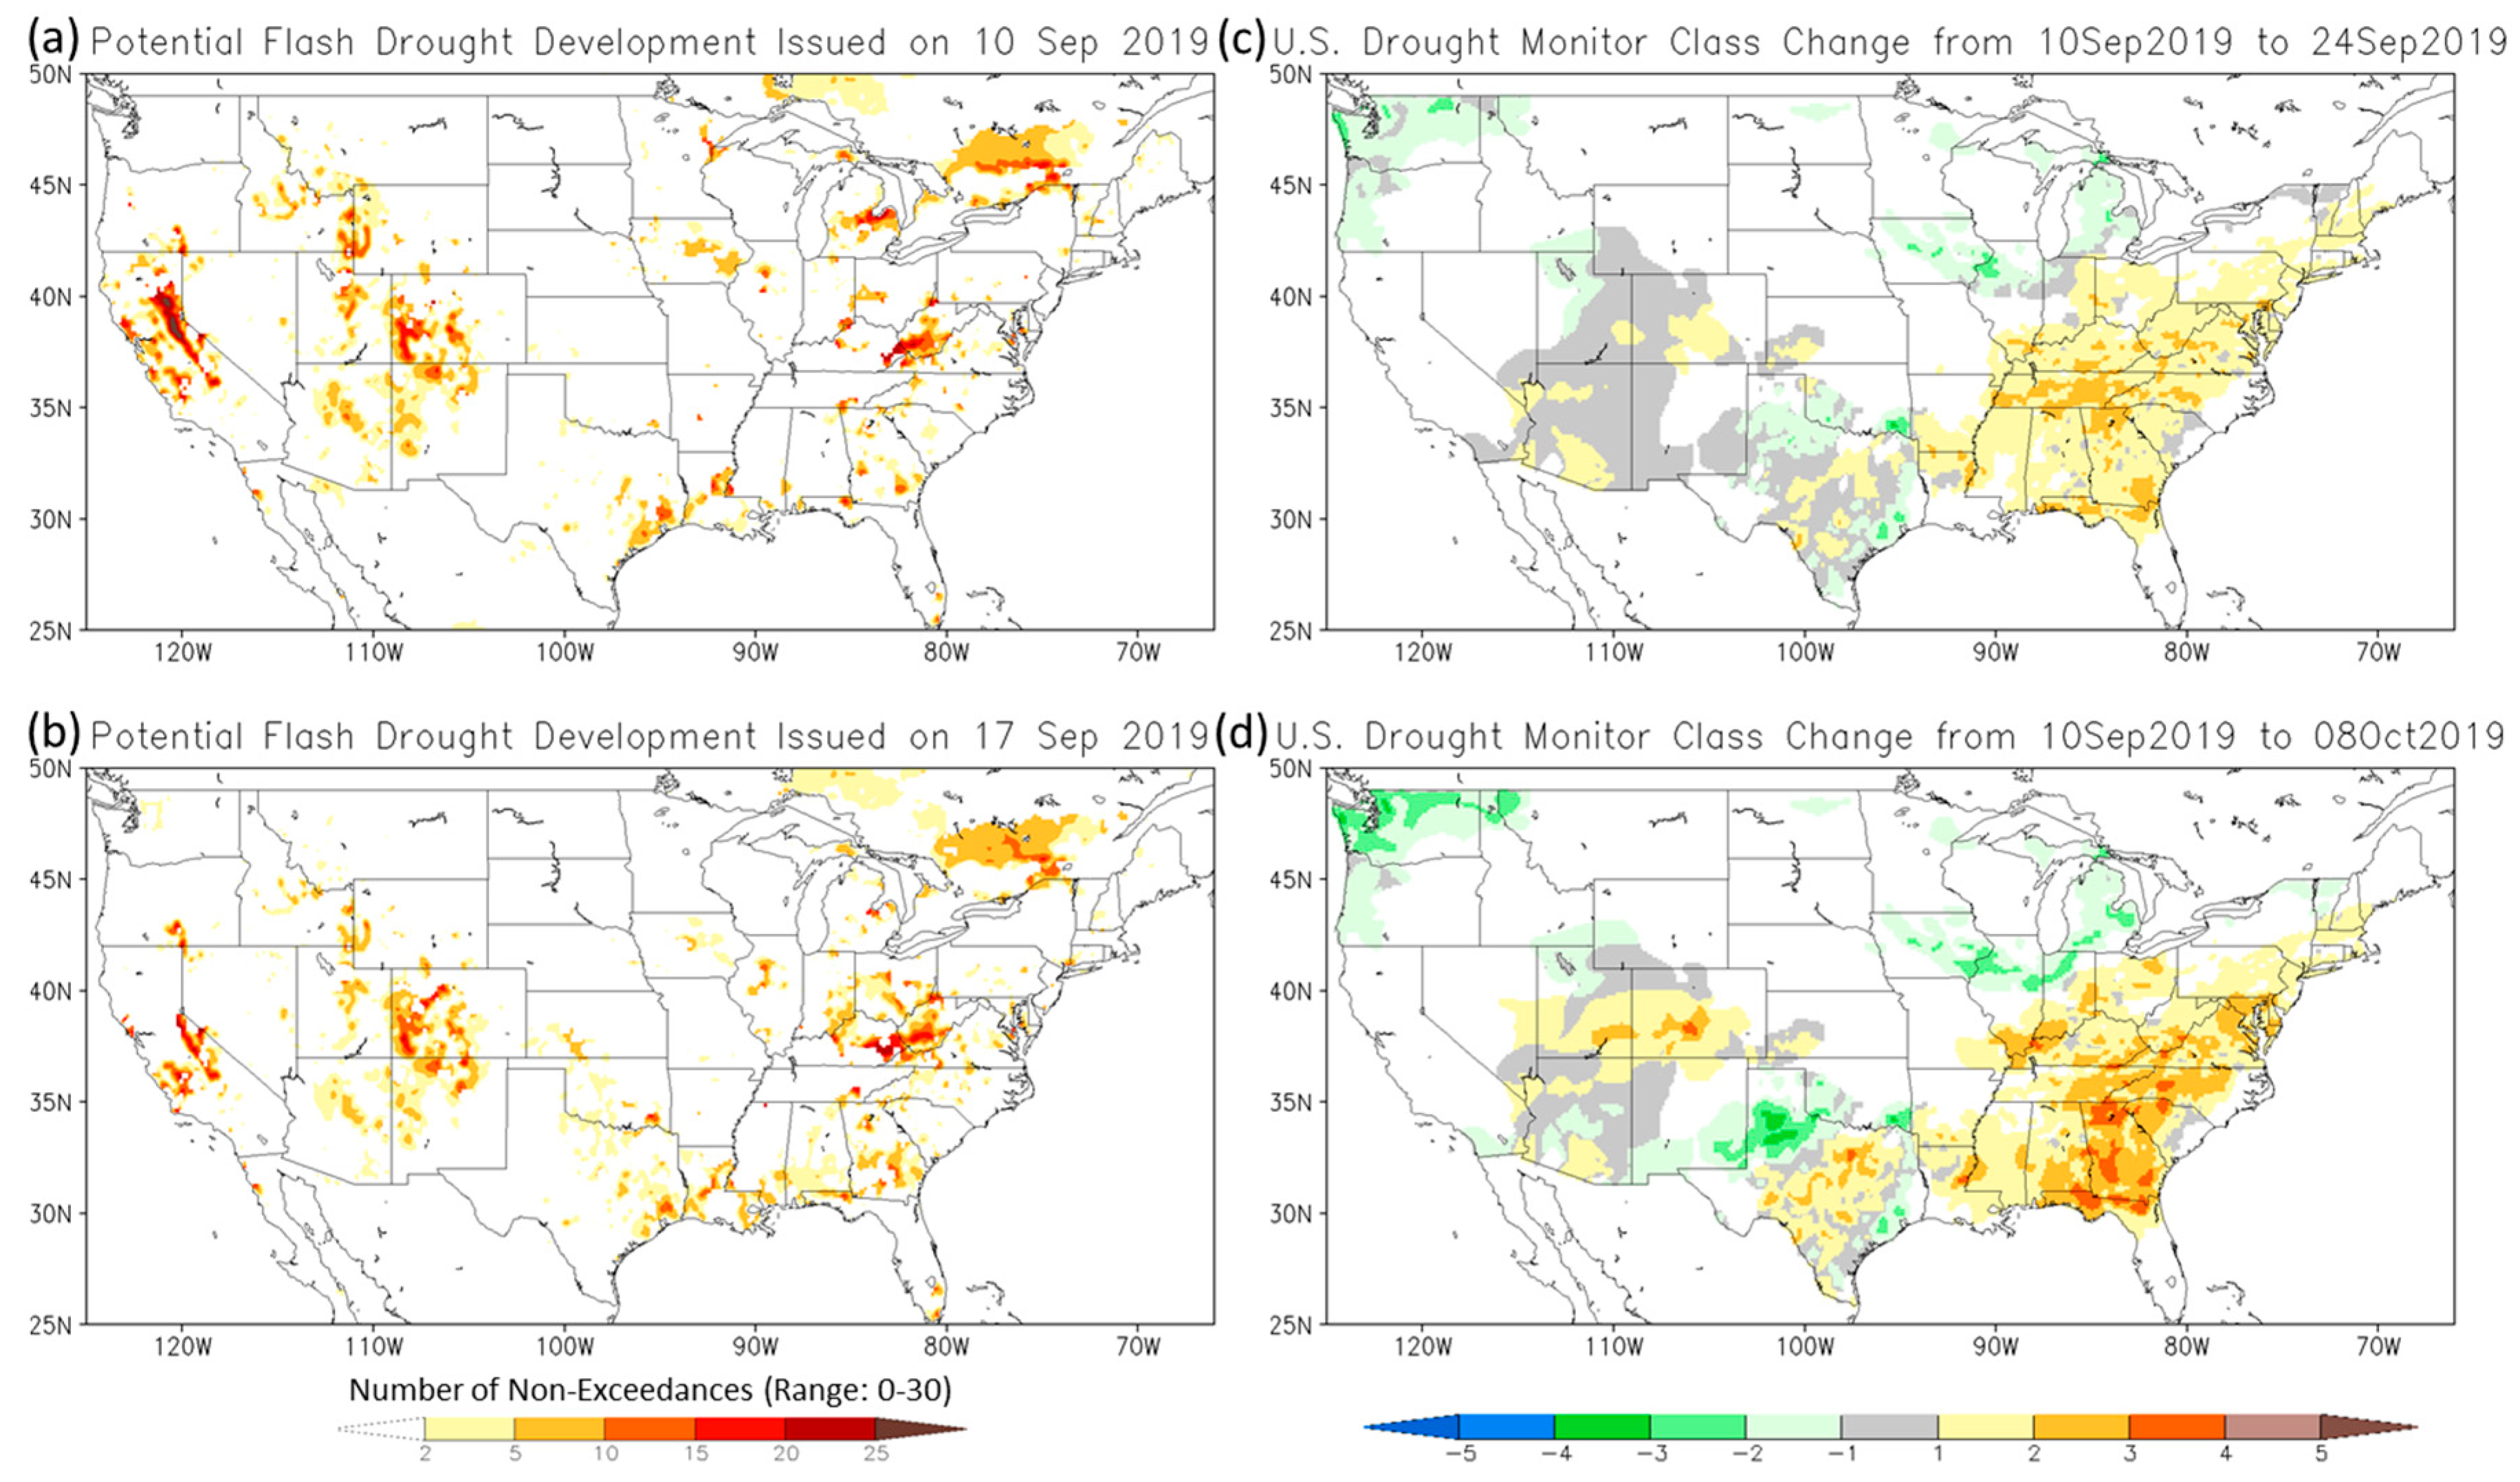
Toward the end of the 2019 warm season, another flash drought, caused by a combination of record high temperatures and record low precipitation, suddenly exploded in the Southeast in September (
Figure 9). Some areas in the Southeast experienced three categories of drought degradation in a month (
Figure 11d), with most rapid development occurring on 10–24 September (
Figure 11c). Both the MDO and the flash drought tool did not forecast the swift onset of this drought on 31 August (
Figure 10n,d). However, with daily updates, the flash drought tool was able to capture the fast-developing signals around 10 September (
Figure 11a), about 1–2 weeks before drought conditions appeared largely in the Southeast on 24 September.
The original motivation to inaugurate the MDO in 2013 was to provide drought tendency forecasts at a shorter timescale in order to better predict fast-developing droughts [
13], such as the 2012 Central Great Plains flash drought. For flash droughts like the 2019 Southeast drought with a very short warning time, outlook products issued once a month cannot always provide timely alerts to the public, as some flash droughts can develop within 2–3 weeks. The fixed release time of the MDO (on the last day of the month) also does not offer the flexibility during other times of the month for flash drought prediction. To better deliver timely warnings of possible flash drought onset, CPC plans to include flash drought forecasts into its 8–14 Days U.S. Hazards Outlook, an operational product targeting the Week-2 forecast period for potentially hazardous conditions. The release time of the U.S. Hazards Outlook every weekday would allow prompt dissemination of flash drought warnings to the public. Since much of the skill in predicting temperature and precipitation extends to two weeks, the Week-2 prediction of flash drought is expected to be skillful, and the objective predictions from the flash drought tool are anticipated to be one of the primary guidance for the flash drought hazard outlook. Advanced knowledge of a possible flash drought event could aid farmers and ranchers with an early warning system to prepare for supplemental water sources for crops and livestock, along with wildfire managers for assessing potential wildfire risks.
7. Summary and Conclusions
In this study, we created an experimental flash drought prediction tool based on the rapid change index [
14,
25] calculated from weekly changes of 7-day mean ET anomaly. To directly highlight areas susceptible to flash drought development, as in the Monthly Drought Outlook, we used a threshold method to identify grid points with large decreases of 7-day mean ET anomaly (i.e., RCI less than −0.5) in the last 30 days and under the condition that 3-month SPI is less than −0.4. The prediction is made under the assumption that antecedent conditions persist into the next month. The new tool was implemented in real time and started running on 1 April 2018, with daily updates. The performance of the tool was evaluated using both retrospective and real-time predictions of the 2017–2019 warm seasons. The results show promising capabilities in predicting flash drought development and success in cases that meet the persistence requirement. The interplay between precipitation and high temperatures appears to be a challenge for flash drought prediction, as changes in conditions often delay or erase drought development. The results also show some limitations on predicting a certain type of flash drought driven by the vegetation response from hot temperatures.
The initial stage of the flash drought tool is solely based on NLDAS-2 monitoring data and does not take into account forecast information. Our assessment has pointed out the added values of forecast information in flash drought prediction. In particular, advanced subseasonal models can provide skillful temperature and precipitation forecasts three weeks ahead of time and, in turn, foresee possible changes in conditions in the upcoming weeks. In the next stage, we will incorporate subseasonal P, ET, and SM forecasts into the tool to improve its prediction skill. Specifically, ET forecasts can be appended to the monitoring data to form an extension of the time series for calculating RCI, similar to the methodology used for SPI forecasts [
17,
30]. P and SM forecasts can be used to prescribe drought conditions at the end of the coming month to reduce false alarms.
The current outputs of the potential flash drought development tool are deterministic. The advantage of using a threshold method with binary outcomes is that it can further be used to generate probabilistic forecasts with logistic regression [
18,
25]. Probabilistic information is important for risk management and requested by stakeholders to assist in decision making and developing drought mitigation plans. After incorporating forecast information into the tool, we plan to create a probabilistic version of the flash drought tool and output exceedance/non-exceedance probabilities. This information can further facilitate the inclusion of flash drought forecasts into CPC’s 8–14 Days U.S. Hazards Outlook, which is mainly represented in the probabilistic format. Quantitative evaluation of the prediction skill of the tool using historical data will also be carried out.


