Article

Concentrations of Four Major Air Pollutants among Ecological Functional Zones in Shenyang, Northeast China

Institute of Atmospheric Environment, China Meteorological Administration, Shenyang 110166, China
*
Authors to whom correspondence should be addressed.
Atmosphere 2020, 11(10), 1070; https://doi.org/10.3390/atmos11101070
Submission received: 14 September 2020 / Revised: 30 September 2020 / Accepted: 4 October 2020 / Published: 8 October 2020
(This article belongs to the Special Issue Urban Design Guidelines for Climate Change)

Abstract

:
Air pollution is a critical urban environmental issue in China; however, the relationships between air pollutants and ecological functional zones in urban areas are poorly understood. Therefore, we analyzed the spatiotemporal characteristics of four major air pollutants (particulate matter less than or equal to 2.5 µm (PM2.5) and 10 µm (PM10) in diameter, SO2, and NO2) concentrations over five ecological functional zones in Shenyang, Liaoning Province, at hourly, seasonal, and annual scales using data collected from 11 monitoring stations over 2 years. We further assessed the relationships between these pollutants and meteorological conditions and land-use types at the local scale. Peaks in PM, SO2, and NO2 concentrations occurred at 08:00–09:00 and 23:00 in all five zones. Daytime PM concentrations were highest in the industrial zone, and those of SO2 and NO2 were highest in residential areas. All four air pollutants reached their highest concentrations in winter and lowest in summer. The highest mean seasonal PM concentrations were found in the industrial zone, and the highest SO2 and NO2 concentrations were found in residential areas. The mean annual PM and SO2 concentrations decreased in 2017 in all zones, while that of NO2 increased in all zones excluding the cultural zone. The natural reserve zone had the lowest concentrations of all pollutants at all temporal scales. Pollutant concentrations of PM2.5, PM10, SO2, and NO2 were correlated with visibility, and their correlation coefficients are 0.675, 0.579, 0.475, and 0.477. Land coverage with buildings and natural vegetation negatively and positively influence air pollutant concentrations, respectively.

1. Introduction

Air pollution has detrimental effects on human health [1,2,3], atmospheric visibility [4,5], air quality [6,7], and regional and global climate change [8,9]. Seven of the 10 most-polluted cities in the world are in China [10], and air quality in China has been extremely poor in recent decades. To combat this problem, environmental monitoring stations have been established in most Chinese cities to monitor pollution and inform control measures. These data have been used extensively to describe the spatiotemporal characteristics of air pollutants [11,12,13,14,15]. Data collected from 2006 to 2014 at 24 stations indicated that particulate matter (PM) concentrations were highest in Xi’an, Zhengzhou, and Gucheng, followed by cities in Northeast and South China [16]. Zhao et al. [14] found that, within China, cities located in the North China Plain were the most severely polluted, and SO2 concentrations were highest in the northern part of the country. As for NO2, however, there was no significant difference between northern and southern Chinese cities [12]. Generally, air pollution is higher in winter and lower in summer [17,18,19,20]. However, pollution characteristics vary among cities. For instance, particulate matter with a diameter < 2.5 µm (PM2.5) concentrations in northern Chinese cities exhibited bimodal annual trends [14], whereas no pattern was observed in southern Chinese cities [14].
Although the emissions are the main cause of high concentrations, the influence of meteorological conditions and human activities cannot be ignored because both are important for the dispersion and transformation of air pollutants. Generally, strong wind speed favors the dispersion of air pollutants [21]. Additionally, temperature [22], relative humidity [23], wind direction [24], temperature inversion [25], and so on are related to dispersion and transformation of air pollutants. On the other hand, the intricate feedback loop between urban heat island, temperature-driven chemistry and urban pollution, urbanization also plays an important role for the air quality [26]. Land cover [27], high population density [28], and heavy traffic [29] all can affect pollutants’ concentrations. Rendón et al. [30] simulated the impact of increasing urban land cover from 0% (rural) to 100% (urbanscape) on urban pollutants, and it indicated that the 40% urban cover was the most penalized in terms of air quality due to the combined effect of high urban emissions and temperature inversion persistence [31].
Shenyang, the capital of Liaoning Province, Northeast China, is undergoing rapid economic expansion and urban population growth. Air pollution is a major concern, with frequent air pollution events that can be severe. Famously, in November 2015, the maximum hourly PM2.5 concentration exceeded 1000 µg·m−3 (http://news.sina.com.cn/c/nd/2015-11-08/doc-ifxknutf1607479) in Shenyang. Studies designed to inform the development of control methods, including pollution monitoring [32,33], transport paths [34], and compounding factors [29], have been carried out in Shenyang. Although numerous studies have investigated air pollution in the city, there are few analyses of pollutant characteristics across ecological functional zones [35,36].
To address this limitation, we classified the ecological functional zones at 11 established monitoring stations in Shenyang and compared the variations in four major air pollutants (PM2.5, PM10, SO2, and NO2) among these zones over three time scales (hourly, seasonal, and annual). The aims of this research were to (1) analyze temporal variations in PM, SO2, and NO2 concentrations in five ecological functional zones in Shenyang; (2) understand differences in PM, SO2, and NO2 concentrations among these zones; (3) determine local relationships of air pollutants with meteorological elements and land-use types, with the goal of providing the local government with information and suggestions for future pollution control measures.

2. Methods

2.1. Study Area

Shenyang, the capital city of Liaoning Province in the northeastern China, is an industrial city with a population of more than 8 million [37,38]. The topography is generally flat, and the city sits at < 50 m above sea level. The Hunhe River flows across the southern urbanized area. The climate is subhumid continental with a hot, rainy season from June to August [39].

2.2. Air Pollution, Meteorological, Urbanization, and Imaging Data

Hourly measurements of PM2.5, PM10, SO2, and NO2 concentrations at all stations collected over a 2-year period (1 January 2016 to 31 December 2017) were obtained from Shenyang Environment Monitoring Center for use in this study. Corresponding hourly meteorological data from the Shenyang weather station (Figure 1) were obtained from the Liaoning Provincial Meteorological Information Center, including relative humidity, wind speed, and visibility. Urbanization data, such as population and number of motor vehicles, were obtained from various internet sources (https://tieba.baidu.com/p/4936711038?red_tag=2949498218).
We classified all land-use types surrounding the monitoring stations based on Landsat Thematic Mapper images from 2015 with a resolution of 30 m. Images were obtained from the United States Geological Survey (http://glovis.usgs.gov). We used a preprocessing method for the Landsat images as described in Li et al. [37]. The ERDAS Imagine software and the ArcGIS software were also used in this study. Data used for classification included remotely sensed image, road maps, and field surveys. At last, land use was categorized into six types: buildings, roads, grassland, cropland, water, and bare land, with a combination of visual interpretation and supervised classification methods.

2.3. Ecological Function Zones

There were 11 pre-existing air quality monitoring sites in Shenyang (Figure 1, Table 1). An ecological function zone was assigned to each station based on characteristics of the surrounding environment and geographical position when it was first established. The ecological function zone in this paper refers to the ecological function of the area where the monitoring site is located. The specific process how to determine ecological functional zone is as follows: (1) we made a 3 km circular buffer around each site, and then we counted the areas of main land use types and typical ecological function within each buffer (Table 1). (2) The 11 monitoring sites were divided into five ecological function zones. Firstly, the natural reserve and non-natural reserve were determined based the percentages of main land use areas within 3 km buffer of each station. The Senlinlu (SLR) station is located in the natural reserve and its green land area accounted for 99% within the buffer, so we determined it as the natural reserve zone (Z5). Secondly, the other stations were divided into residential–commercial zone (Z1), residential zone (Z2), cultural zone (Z3), and industrial zone (Z4) according to whether there was a flourishing business street, a concentrated residential block, a local famous university, industrial park in the corresponding zone, respectively. The classification results are shown in Table 1.

3. Results and Discussion

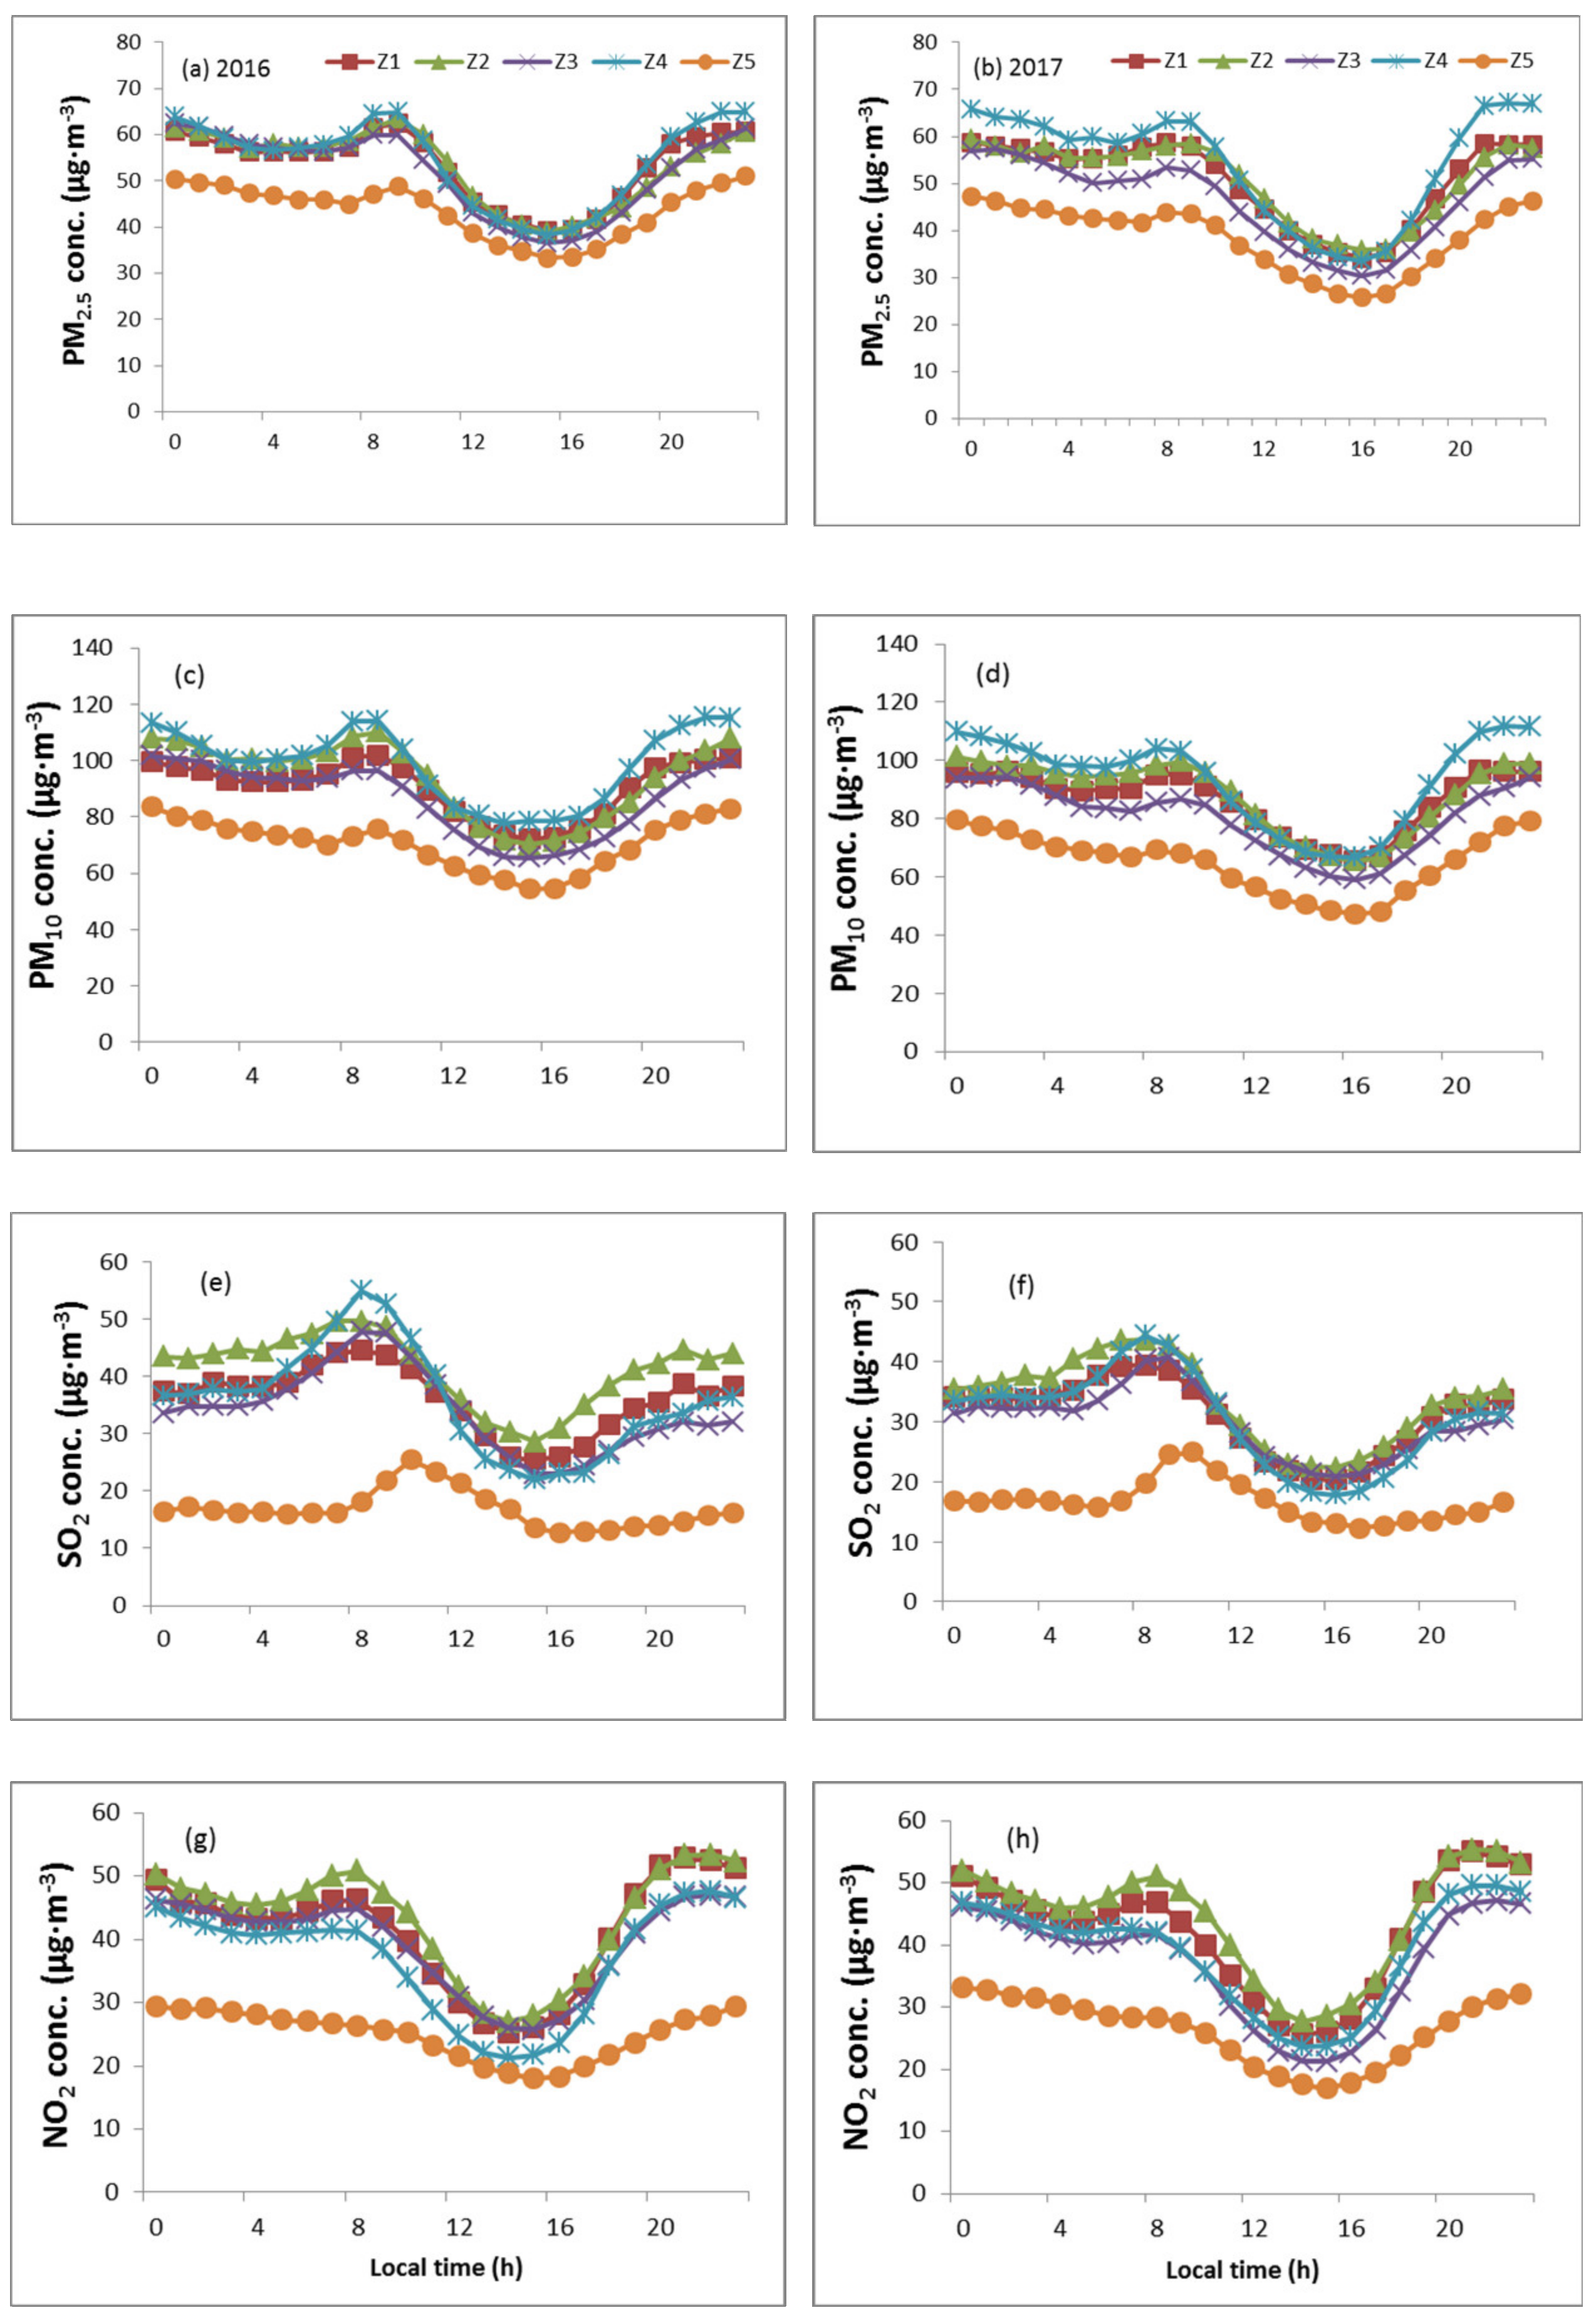
3.1. Diurnal Variations in Four Major Air Pollutants among Ecological Functional Zones

The hourly air pollutant concentrations in all five ecological functional zones are shown in Figure 2. Hourly PM2.5 concentrations were lowest in the natural reserve zone (Z5), and were 4.96–19.47 µg·m−3 lower than the concentrations found in other zones (Figure 2a,b). PM2.5 concentrations were consistently higher in the industrial zone (Z4) relative to the other zones. Feizizadeh et al. [28] also indicated that the highest PM concentration occurred in the petrochemical industrial site of Tabriz of Iranian. Among the four anthropogenic zones, the cultural zone (Z3) had the lowest levels of all pollutants. The variations in pollutant concentrations among the zones indicated that pollution was more problematic and variable in zones that contained a source of anthropogenic emissions (i.e., Zones 1–4) than in the zone without an anthropogenic emissions source (Z5).
Average hourly PM2.5 concentration exhibited a bimodal distribution in all five zones in both 2016 and 2017 (Figure 2a,b). This is consistent with observations in other cities in Northeast China such as Siping and Anshan, but not with cities in the south such as Changde and Panyu [16]. Peaks in PM2.5 concentrations were less obvious in Z5 relative to the other zones, but peak values in all zones occurred between 08:00 and 09:00. Lows (valleys) in concentrations were generally observed at 15:00 in 2016 and at 16:00 in 2017 in all zones. These hours correspond to the variation in the diurnal boundary layer and to morning and evening rush hours [29]. The trends in hourly PM10 concentration across all zones in both years were consistent with those observed for PM2.5, excluding some small local fluctuations (Figure 2c,d).
Among all zones, average diurnal SO2 concentrations were highest in the residential zone (Z2), excluding a few hours in the morning when the average concentration was highest in Z4 (Figure 2e,f), which suggested that residential heating and industrial emission were the SO2 main pollution source. Again, Z5 had the lowest concentrations among all zones. The greatest fluctuations in SO2 concentrations were observed in Z4, where values ranged from 12.81 to 55.05 µg·m−3 in 2016 and 12.30 to 44.38 µg·m−3 in 2017. It means that the industrial emission affects significantly SO2 concentrations.
Pronounced diurnal variations in SO2 concentration were observed in all five zones. Zones with sources of anthropogenic emissions had similar trends, with two peaks and one valley. This is different from most cities and regions of China such as in Lanzhou [40], Guangzhou [41], and Sichuan Basin [42] where there is only one peak for variation of diurnal SO2 concentrations. However, in Z5, the only zone without a source of anthropogenic emissions, only one obvious peak was observed (Figure 2e,f). The above variation characteristics mean that SO2 pollution situation is complex in Shenyang that it is an old and famous base for heavy industry. In Zones 1–4, the first peak in SO2 concentrations occurred at 08:00, whereas concentrations peaked at 10:00 in Z5. This suggests that SO2 emitted in urban areas (Zones 1–4) takes up to 2 h to spread to suburban areas (Z5).
The average hourly variations in NO2 showed a similar pattern to PM concentrations (Figure 2g,h), including the timing of peaks and valleys. However, the greatest NO2 concentrations were observed in Z2 due to high vehicle traffic with increasing private cars, as opposed to Z4 for PM concentrations. There was no observed spike in NO2 concentrations during the day in Z5, likely because Z5 has very low vehicle traffic.

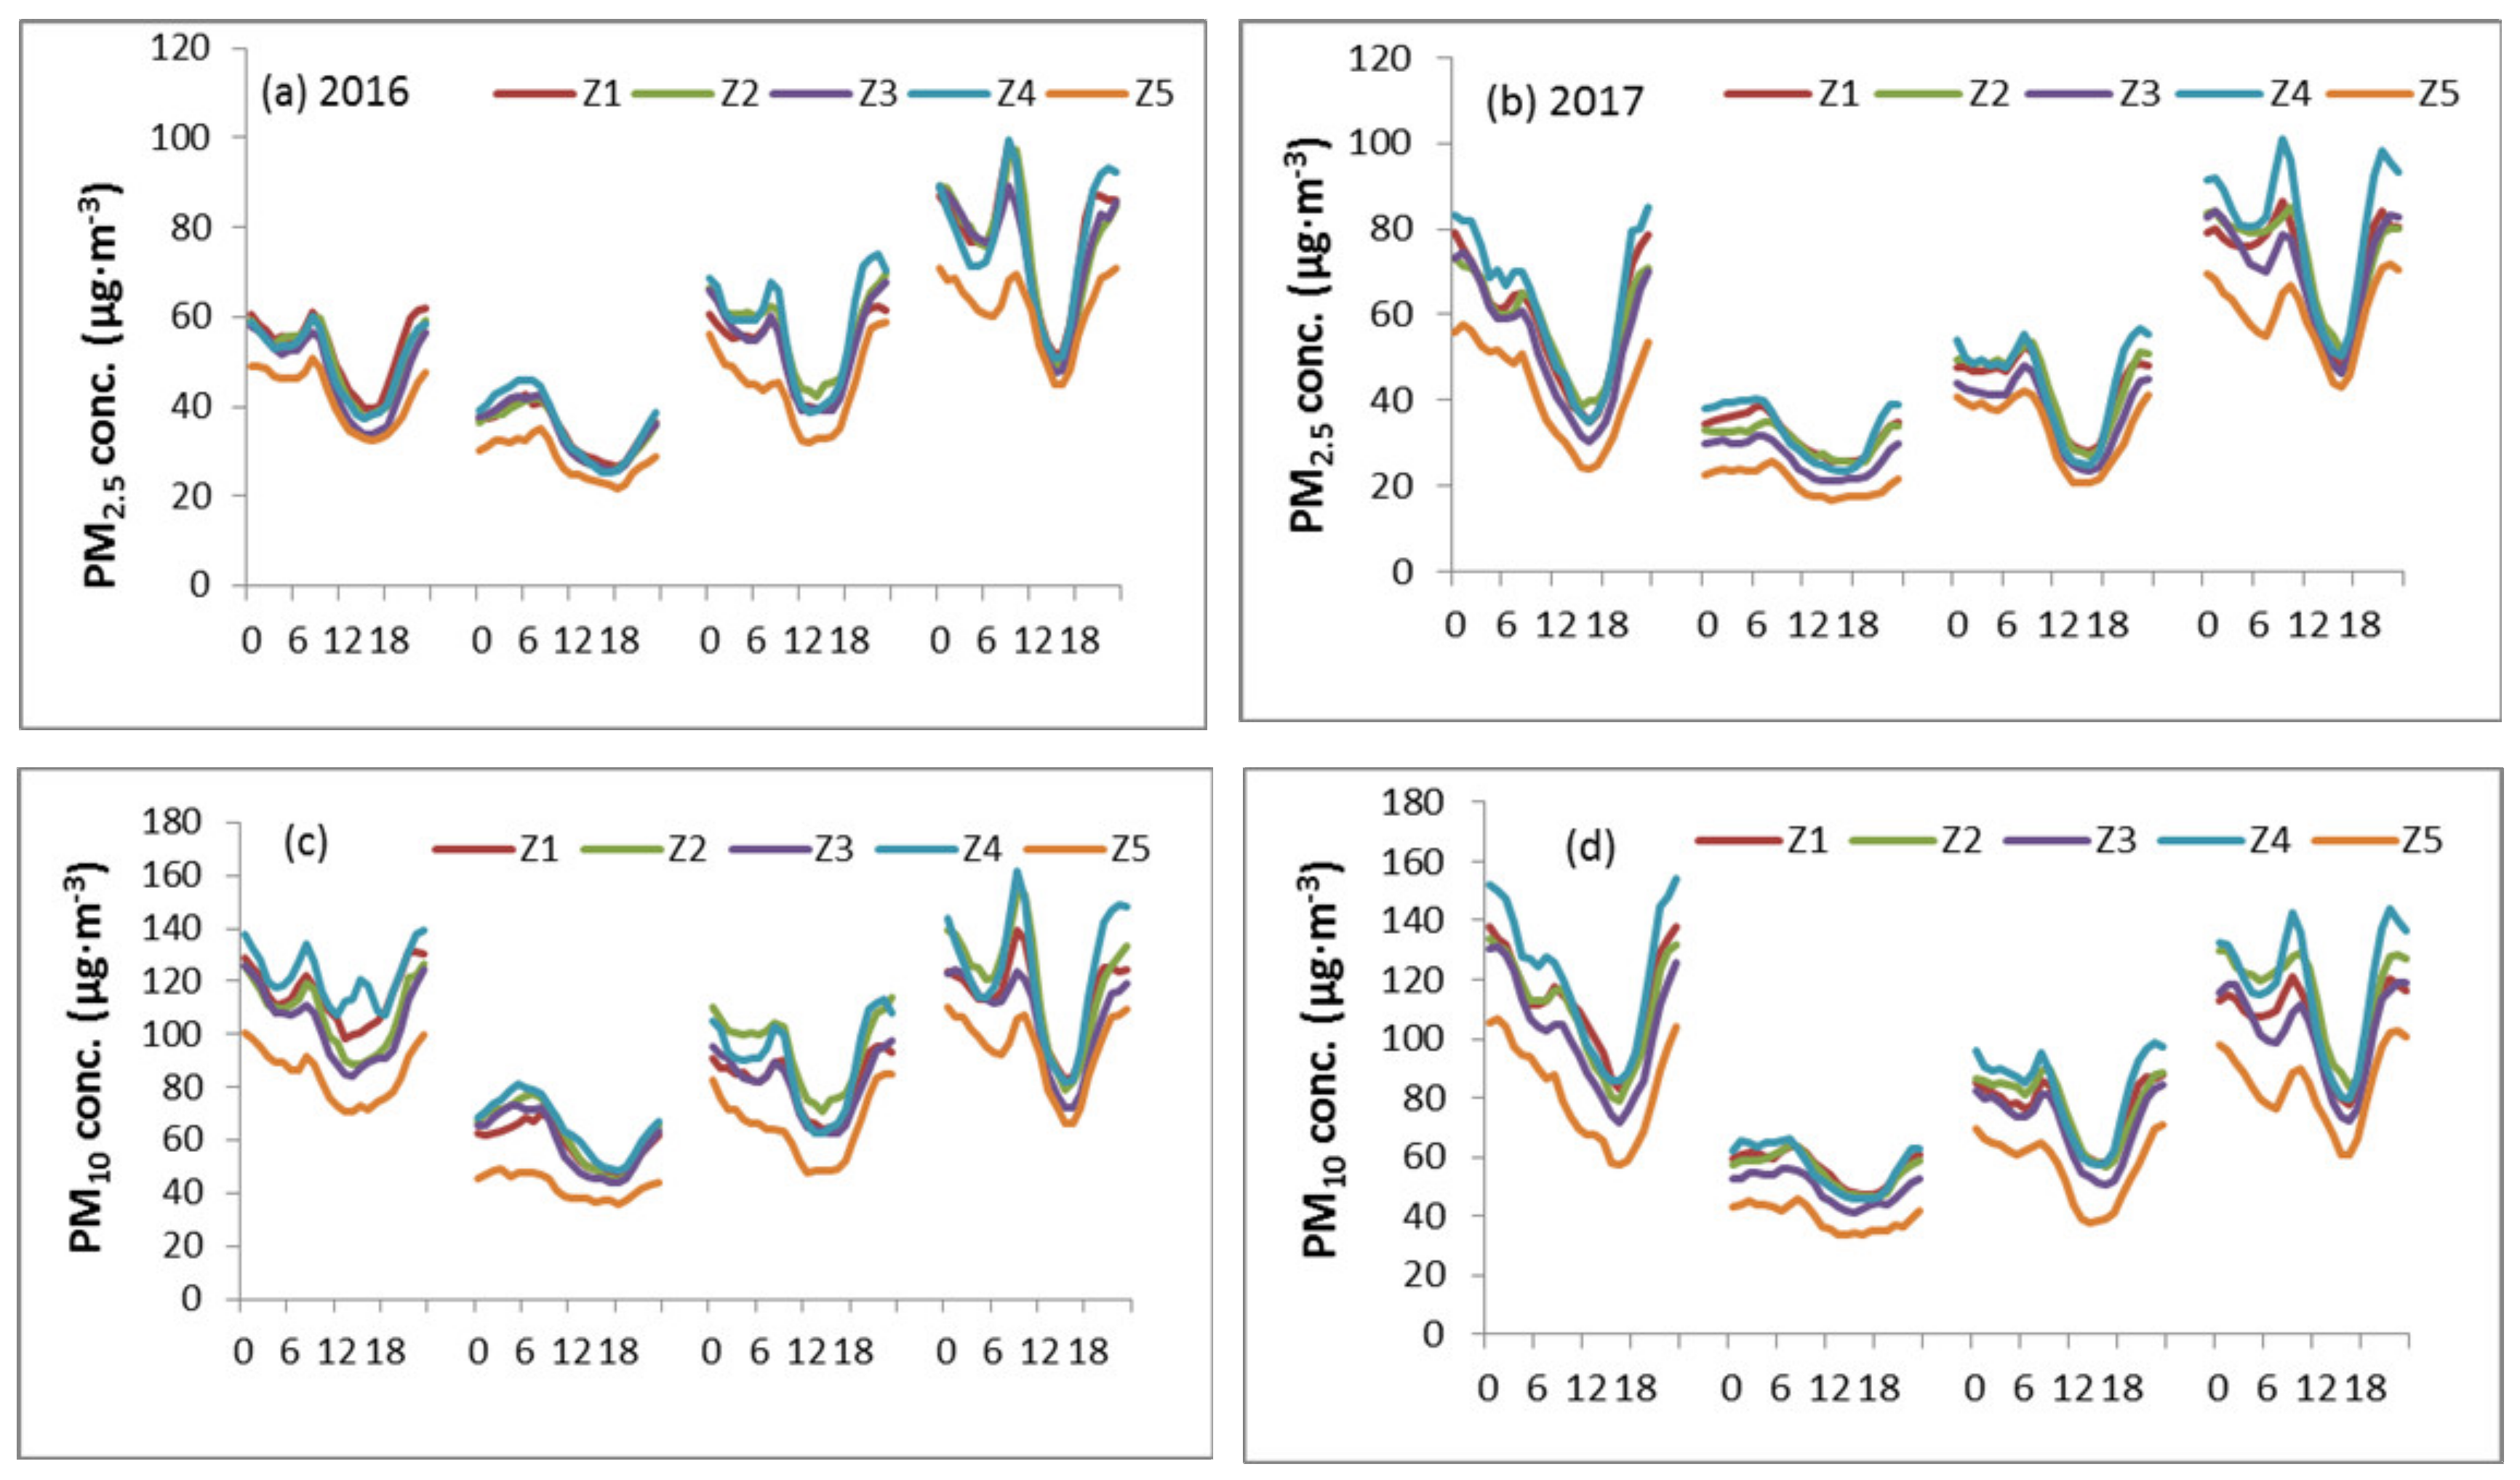
3.2. Seasonal Variations in Four Major Air Pollutants among Ecological Functional Zones

Average seasonal PM2.5 concentrations were highest in Z4 (Figure 3a), suggesting that industrial emissions were the main source of PM2.5 in Shenyang. Z3 had the lowest concentrations among zones with sources of anthropogenic emissions. In 2016, concentrations were highest in Z4 in summer and autumn, and in the residential–commercial zone (Z1) in spring and winter. Concentrations were substantially lower in Z5 than in all other zones over both years. We observed differences between zones with sources of anthropogenic emissions; the within-season variations were relatively small in 2016 (differences < 5.7 µg·m−3) and greater in 2017 (differences < 10.3 µg·m−3).
Mean seasonal PM2.5 concentrations were highest in winter (mean ± SE, 71.86 ± 12.47 µg·m−3 in 2016 and 70.61 ± 11.58 µg·m−3 in 2017) and lowest in summer (33.27 ± 5.68 µg·m−3 in 2016 and 28.28 ± 4.24 µg·m−3 in 2017), which is related to the boundary layer height. The higher boundary layer height in summer is favorable to pollutants dispersion, while the opposite is true in winter [43]. The difference in mean concentration between winter and summer was 23.39 µg·m−3 in 2016 and 16.48 µg·m−3 in 2017, indicating a large range in PM2.5 concentrations among seasons. PM2.5 concentrations decreased between years for all seasons excluding spring, where it increased by an average of 5.65 µg·m−3 in 2017. The seasonal variations and patterns in PM10 concentrations across all seasons, years, and zones were similar to those observed for PM2.5 (Figure 3b).
Average seasonal SO2 concentrations were highest in Z2, excluding the spring and summer of 2016, and consistently lowest in Z5 across both years (Figure 3c). Concentrations were highest in winter (2016: 73.70 ± 15.32 µg·m−3; 2017: 58.48 ± 9.70 µg·m−3) and more than double the average concentrations observed in spring and autumn (Figure 3c). SO2 concentrations were lowest in the summer of both years (2016: 14.08 ± 4.22 µg·m−3; 2017: 14.13 ± 4.63 µg·m−3). Higher SO2 concentrations in winter are a result of coal combustion during the heating season, which is consistent with most cities of north China [14]. The local government stipulates that each household must have an indoor temperature of at least 18 °C from November 1 to March 31 in Shenyang.
The variations in mean seasonal NO2 concentrations were similar to those observed for PM and SO2, i.e., highest in winter and lowest in summer (Figure 3d). In both years, the highest NO2 concentrations were found in Z2 during winter. Concentrations were often high in Z2; this is potentially related to an increase in the number of family cars owned by residents of Shenyang in recent years (https://tieba.baidu.com/p/4936711038?red_tag=2949498218).
Figure 4 presents the hourly variation coupled with seasonal variation for all five zones and four air pollution components over both study years. Z5 had the lowest concentrations of all air pollutants. Z1 and Z2 showed similar concentrations across all time scales. Trends in the diurnal variation of PM2.5 were similar among zones (Figure 4a,b). Peaks in PM2.5 mostly occurred between 07:00 and 09:00 and between 23:00 and 00:00, excluding the winter and spring of 2017. Valleys occurred late at night and in the afternoon at approximately 14:00. Overall, hourly concentrations were smoother in the summer relative to the other seasons, which had sharp increases and decreases. Excluding spring, variations in PM10 (Figure 4c,d) concentrations were consistent with those of PM2.5.
Z2 had the highest hourly SO2 concentrations, especially during winter, when the maximum concentration reached 137.78 µg·m−3 (Figure 4e,f). Mean hourly SO2 concentrations followed a bimodal pattern in Zones 1–4 during both spring and winter, but no discernable trend was observed in autumn. The first peak in the bimodal trend occurred at 08:00 and the second at 00:00. During summer, SO2 concentrations differed most among the four zones with a source of anthropogenic emissions between 09:00 and 20:00.
Mean hourly NO2 concentrations were consistently highest in Z2 in winter (Figure 4g,h). Concentrations showed a bimodal distribution in all seasons (excluding Z5 in winter), with the highest values occurring in the first peak in spring, autumn, and winter, and relatively similar peak concentrations in summer.
Broadly, most hourly air pollutant concentrations showed a bimodal distribution, with peaks during morning rush hour (09:00) and between 23:00 and 00:00. The lowest values were observed in the afternoon around 16:00. Peaks and valleys in concentrations are related to human activities and the height of the atmospheric boundary layer [16]. The time elapsed between the morning peak to the afternoon valley was 7 h, as was the gap between the afternoon valley and the midnight peak. However, only 5 h elapsed between the midnight peak and the morning rush hour peak the following day. This suggests that the diffusion lengths of pollutants were approximately 7 and 5 h under increased and decreased anthropogenic activity, respectively. These diffusion lengths were likely related to meteorological conditions. Wang et al. [16] suggested that meteorological factors play a major role in the short-term variation of air pollutant concentrations. In this study, most hourly mean concentration curves followed a unimodal pattern in summer. These findings are consistent with those of Li et al. [29], which suggested that unimodal distributions are linked to high relative humidity and low wind speeds at night in the summer months.

3.3. Annual Variations in Four Major Air Pollutants among Ecological Functional Zones

The mean annual PM2.5 concentrations in Shenyang were 53.18 ± 7.76 µg·m−3 in 2016 and 48.18 ± 8.83 µg·m−3 in 2017. In 2016, among all five ecological functional zones, the highest PM2.5 concentration (54.55 ± 9.08 µg·m−3) was observed in Z4, followed closely by Z1 (53.37 ± 7.71 µg·m−3) and Z2 (53.31 ± 7.90 µg·m−3) (Table 2). This pattern was consistent in 2017. The range in PM2.5 concentrations was greater in 2017 than 2016 (2016: 33.24–64.93 µg·m−3; 2017: 25.71–66.87 µg·m−3).
Overall, PM2.5 concentrations decreased significantly from 2016 to 2017 in all five functional zones (Table 2), particularly in Z3 (a decrease of 5.54 µg·m−3) and Z5 (5.14 µg·m−3). Only a slight decrease was observed in Z4, the industrial zone (0.15 µg·m−3). This suggests that the local emission reduction policies such as Implementation plan of Shenyang Blue Sky Defense War work well, including controlling motor vehicle exhaust emissions and coal-fired boilers, prohibiting crop straw burning and so on.
The mean hourly SO2 concentrations in Shenyang were 32.18 ± 5.83 µg·m−3 in 2016 and 28.31 ± 5.67 µg·m−3 in 2017. Among the five zones, SO2 concentrations were highest in Z2 (2016: 41.35 ± 6.05 µg·m−3; 2017: 33.53 ± 6.88 µg·m−3), and were very similar among Z1, Z3, and Z4 (Table 2). SO2 concentrations decreased markedly from 2016 to 2017, particularly in Z2 (a decrease of 7.81 µg·m−3), although concentrations were relatively stable between years in Z5.
The mean annual NO2 concentrations were 37.11 ± 7.28 µg·m−3 in 2016 and 37.69 ± 8.04 µg·m−3 in 2017. Z2 had the highest observed concentrations in both years. Generally, NO2 pollution was severe in Z2 and only slight in Z5. The mean concentrations decreased in Z3 between 2016 and 2017, but increased in the remaining four zones (Table 2).
The observed decreases in major air pollutants in Shenyang, a typical industrial city, are a result of recent emission reduction policies such as the Plan of Resistance to Haze and the Blue Sky Protection Campaign. Wang et al. [44] suggested that PM concentrations are decreasing due to the progress in emissions control made in China. Although our results indicate that industrial emissions can be controlled in Shenyang, NO2 concentrations increased from 2016 to 2017, a product of the increased use of motor vehicles, which are a source of NO2. In the past 10 years, government policies have been developed to encourage the purchase of family cars. The number of motor vehicles in Shenyang doubled from 2010 to 2017, and exceeded 2 million by 2017 (https://tieba.baidu.com/p/4936711038?red_tag=2949498218).

3.4. Meteorological Factors and Major Air Pollutants

Meteorological factors play an important role in the diffusion of air pollutants [45,46,47,48]. The 11 monitoring stations used in this study were all in close proximity (< 20 km apart), excluding the Senlin Road station (SLR). At this scale, the local microclimate affects pollution concentrations recorded at different stations. Given that no corresponding microclimate data were available for each station, we selected the closest environmental monitoring station (Hunnandong road station), located in Z1, to examine the relationships among meteorological factors and air pollutant concentrations.
The relationships between visibility and mean daily PM10, PM2.5, and NO2 concentrations were best represented by negative exponential curves (Figure 5). However, the relationship between visibility and the mean daily SO2 concentration was linear, with a correlation coefficient of 0.512 (Figure 5c). Li et al. [29] indicated that fine particles can strongly constrain visibility via the atmospheric extinction effect, which is supported by these results (Figure 5d).
The relationships between pollutant concentrations and wind speed were similar to those with visibility, but the correlation coefficients (a measure of fit) of these relationships were weaker (Table 3). The relationships between pollutant concentrations and relative humidity were best represented by binomial curves, suggesting complex relationships. Wang et al. [49] reported that the contribution of relative humidity to visibility becomes increasingly important with increasing PM2.5 concentrations, suggestive of interactive effects.

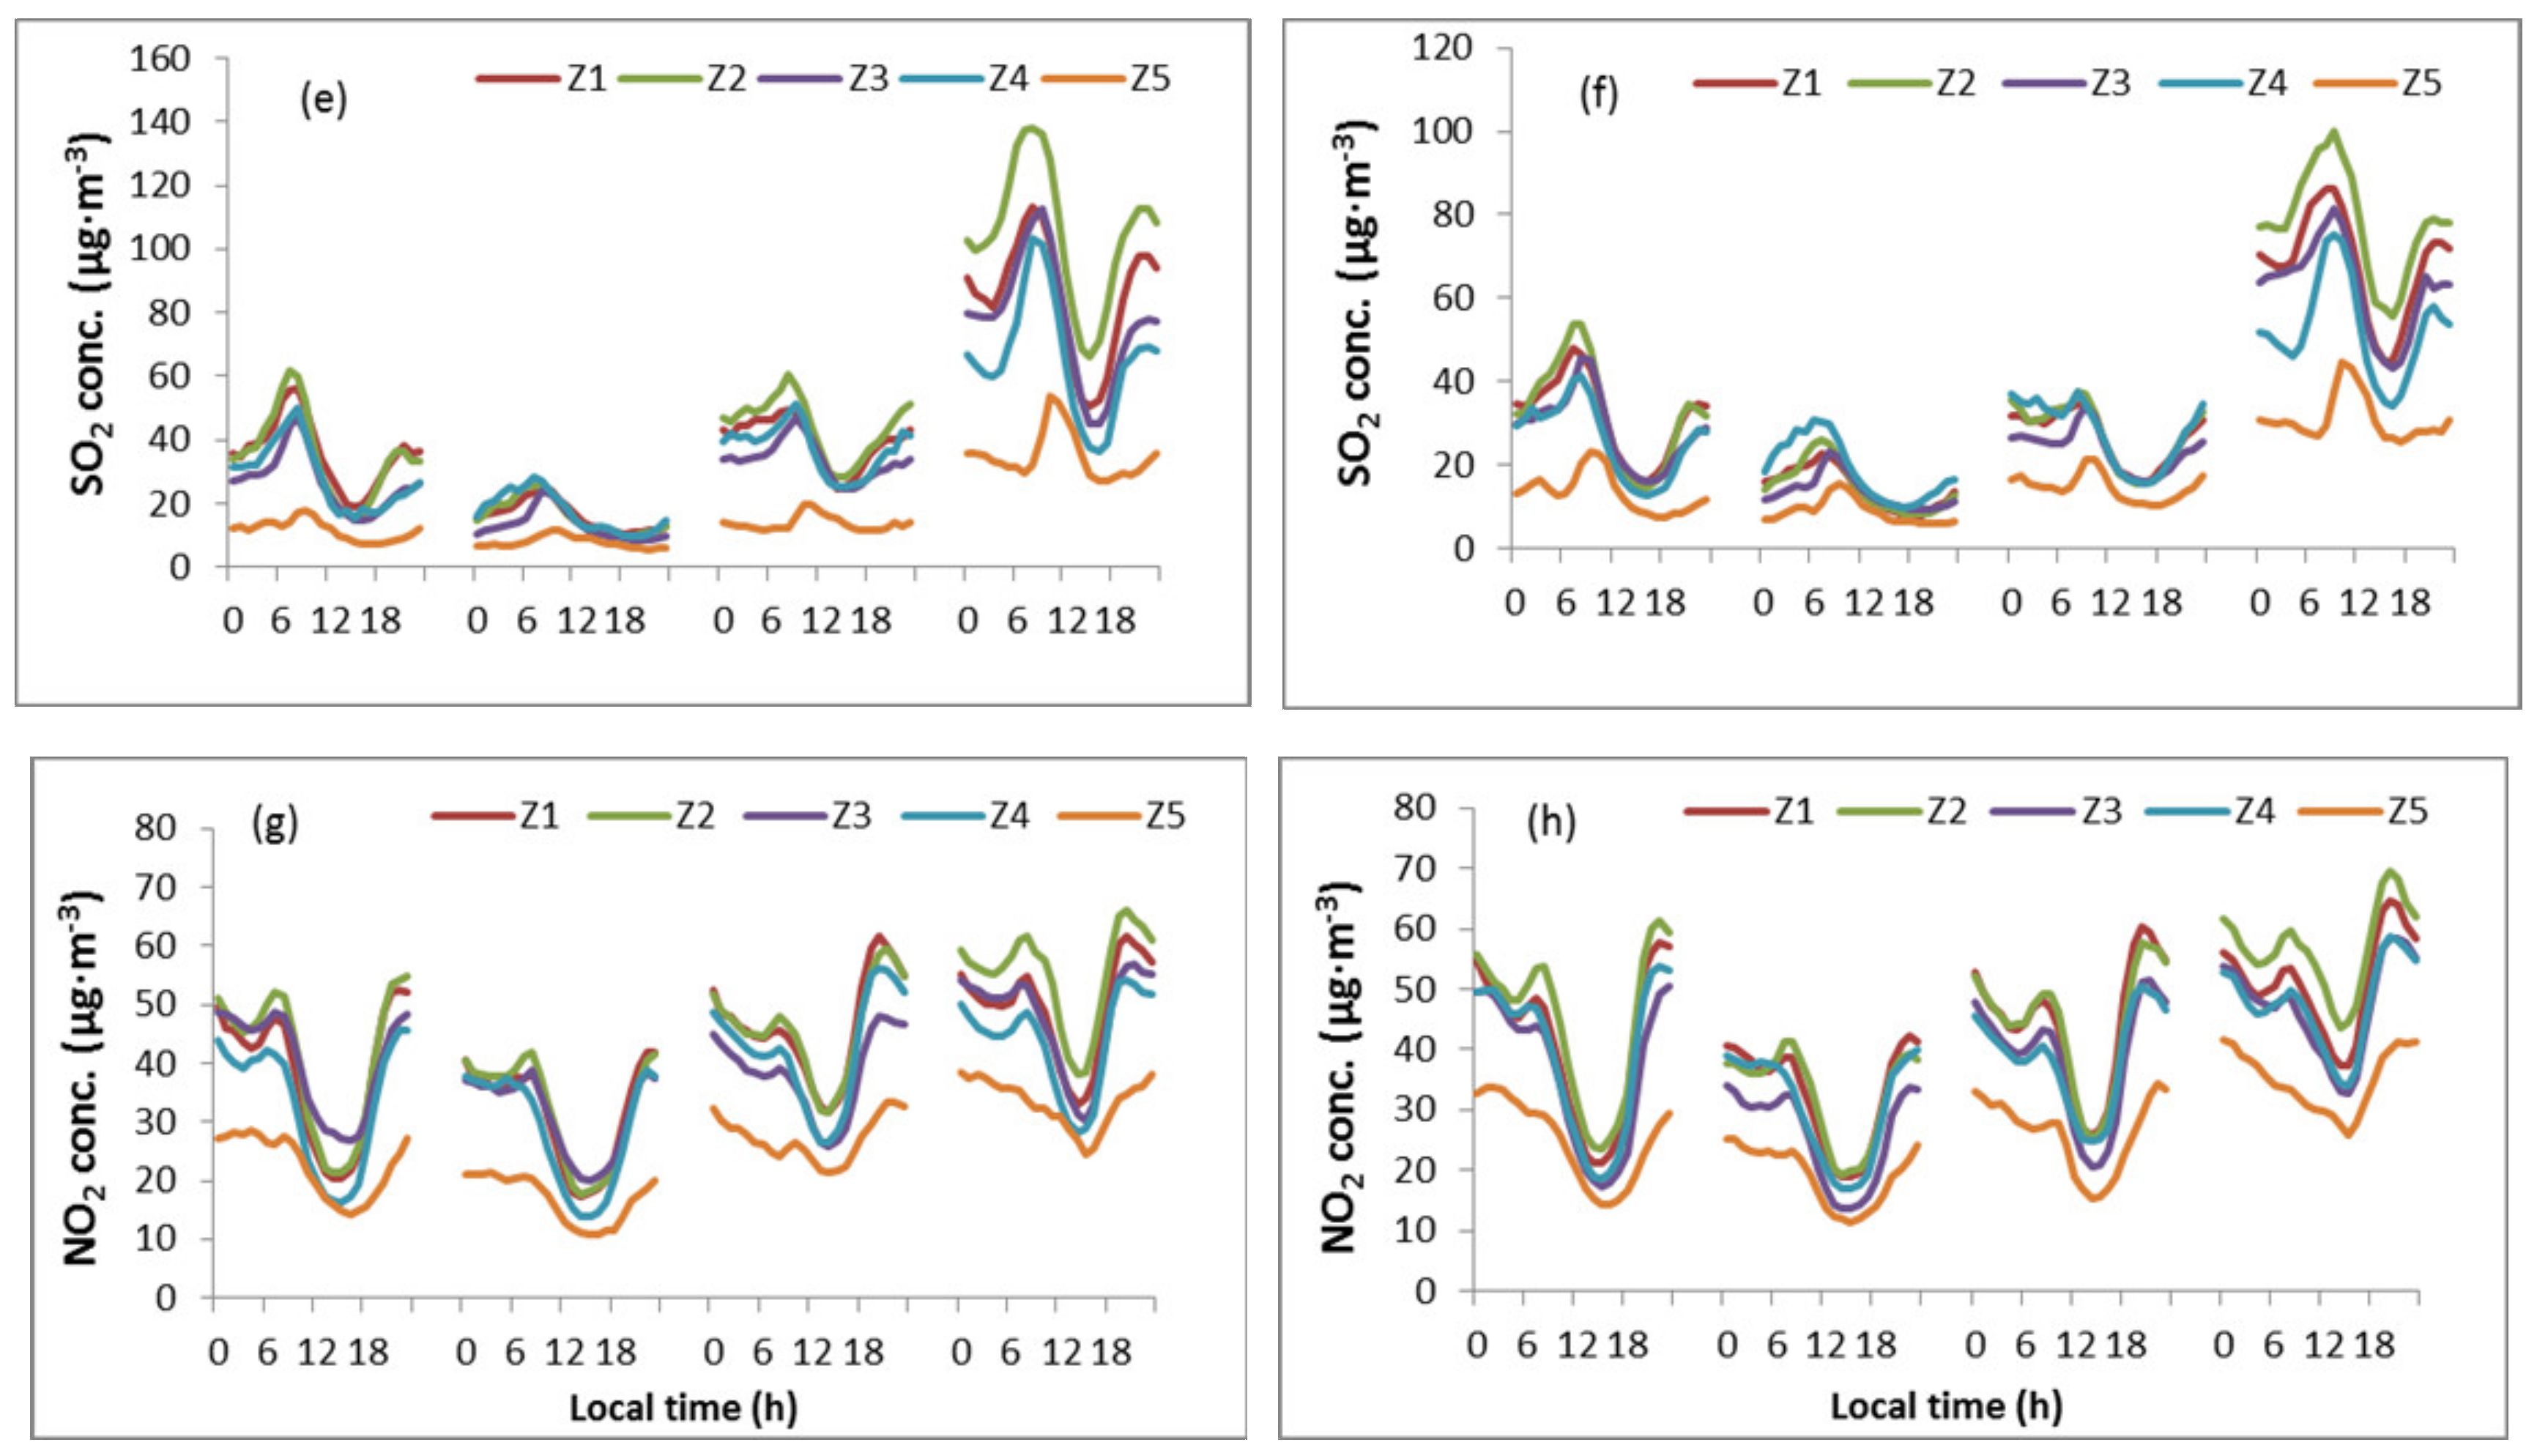
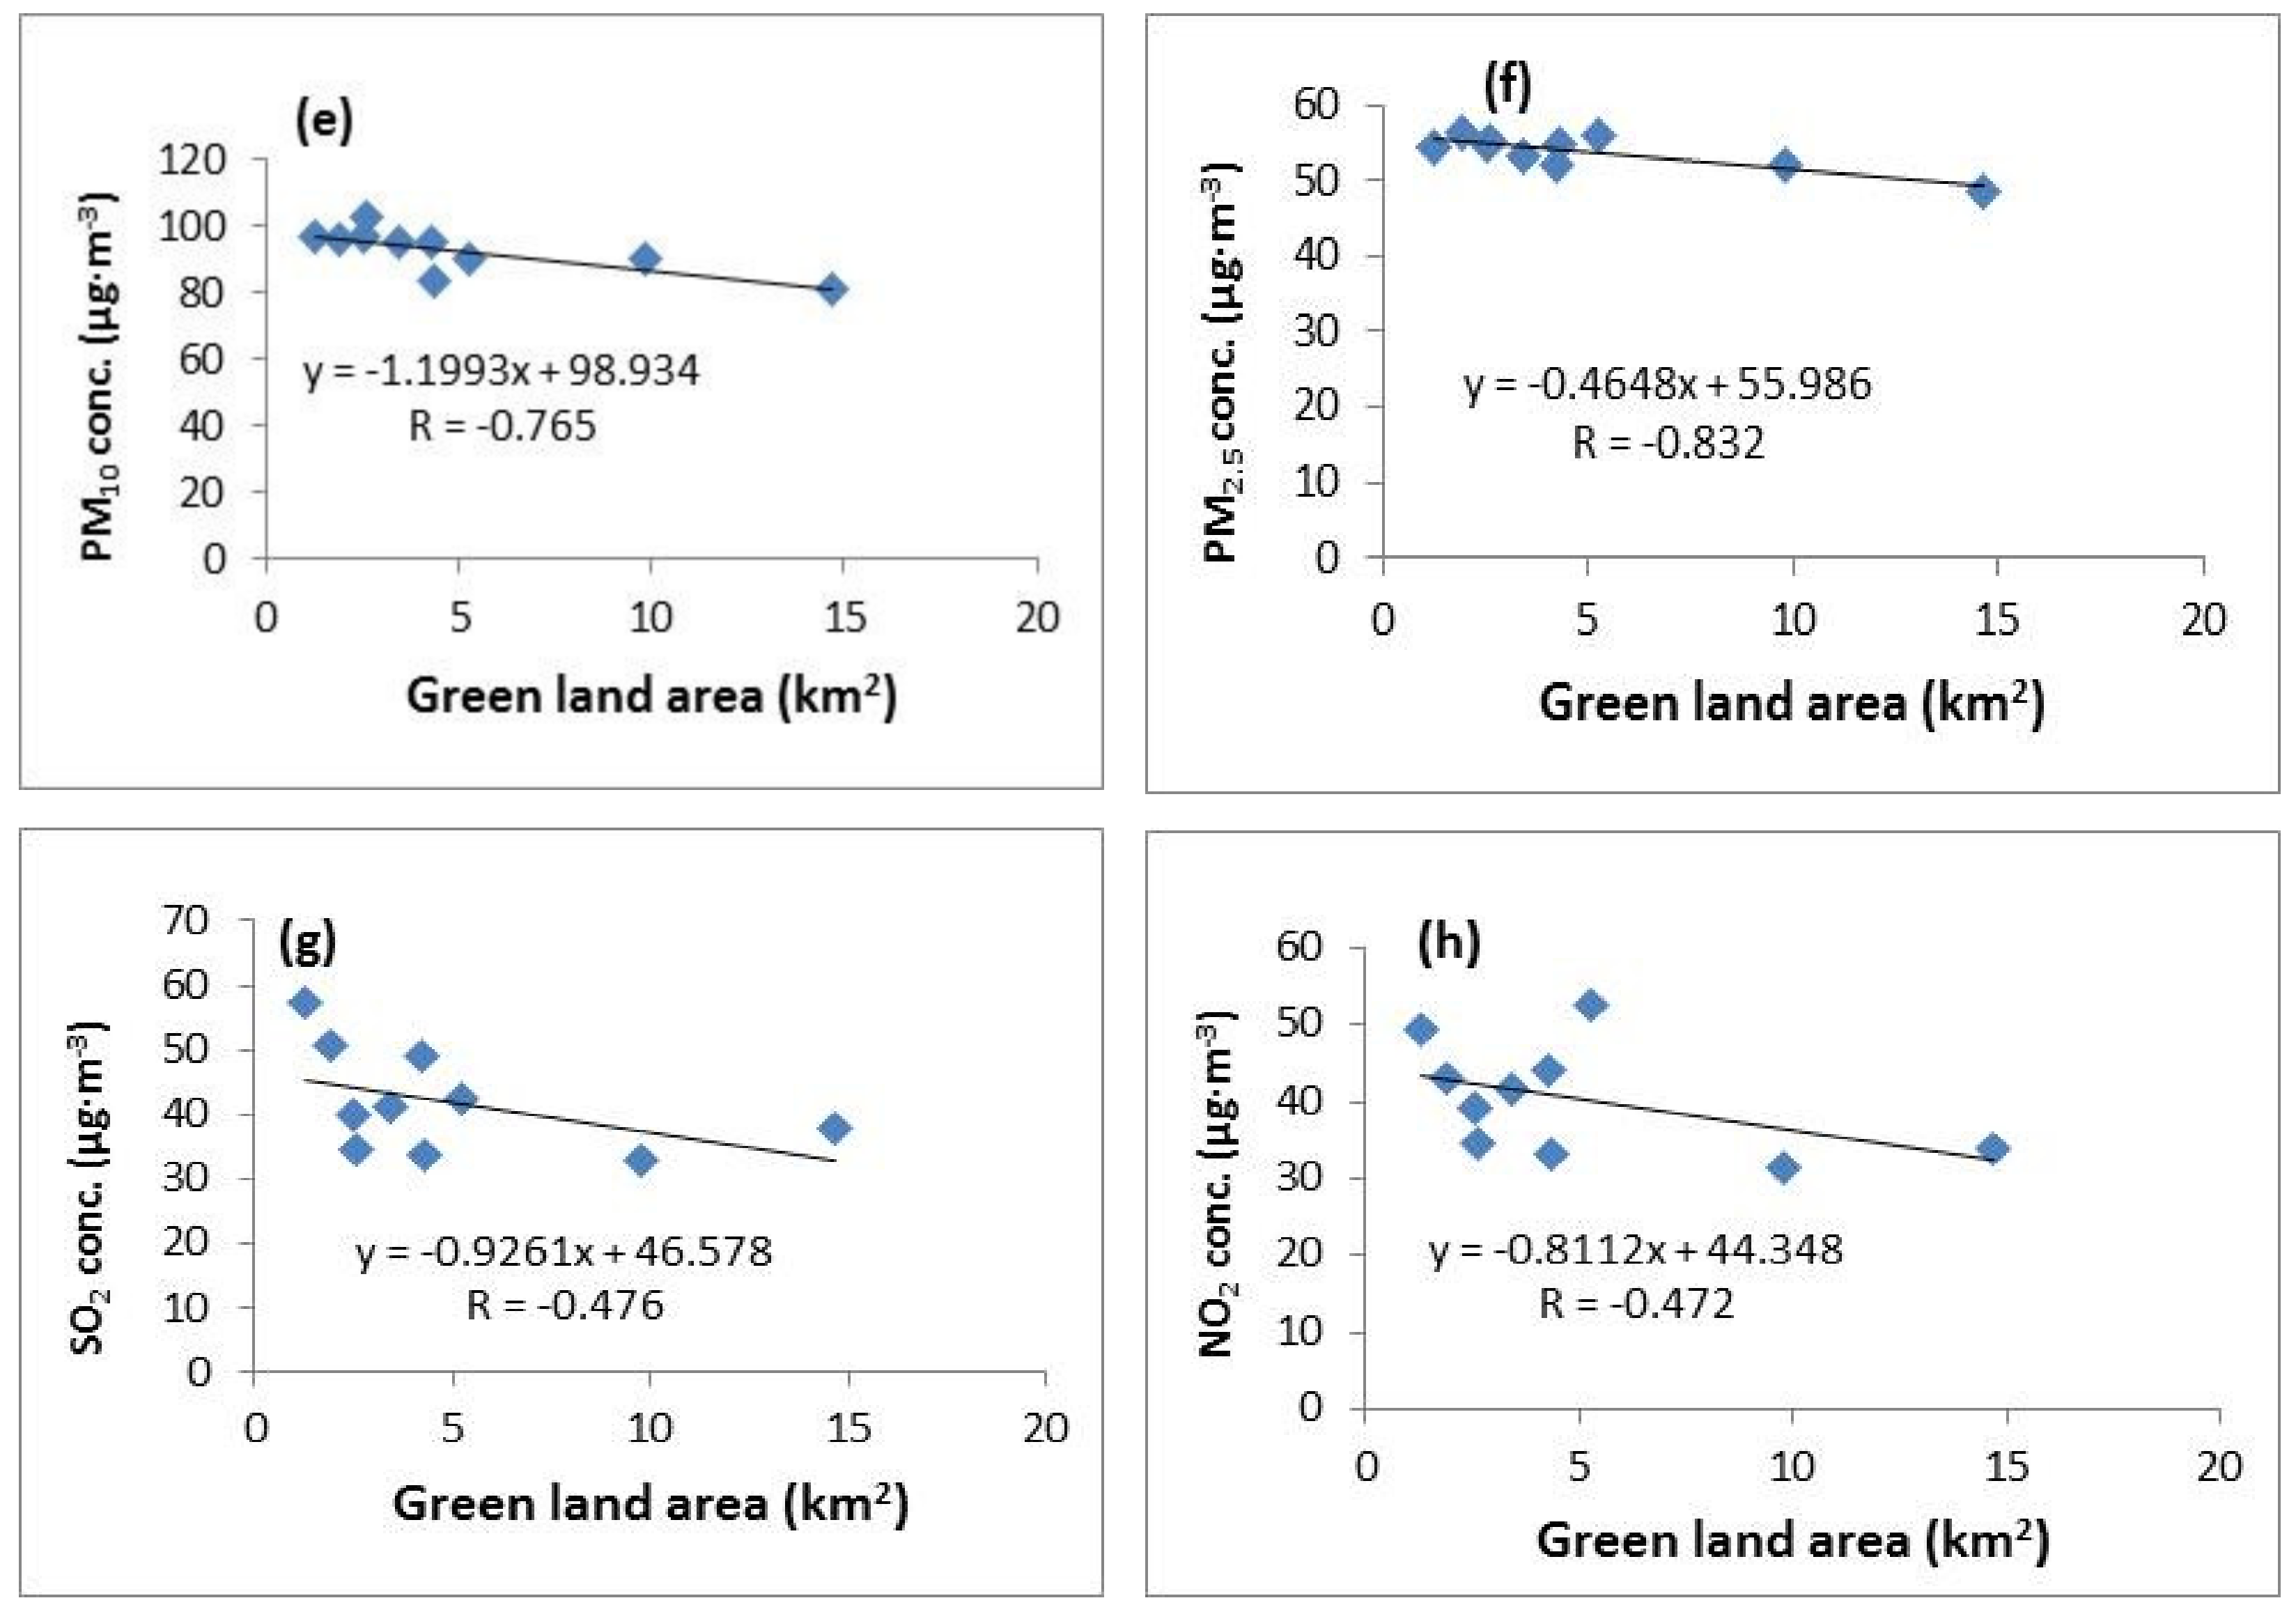
3.5. Land-Use Types and Major Air Pollutants

The land-use types of the area around each station were determined by creating circular buffers with a 3-km radius around each of the 11 monitoring stations. We classified the land-use types and calculated the area covered by each type within the buffer area (Figure 6). The station SLR was located in a natural reserve, and the only land-use type around this station was green land (i.e., grassland or cropland). Therefore, we excluded this station from analyses of the relationships between land-use type and air pollutant concentration.
At local scale, anthropogenic activities and their urban distribution play an important role for urban pollution [26]. Junk et al. [50] indicated that land use and its interaction with other factors can influence air quality. Thus, we analyzed the relationship between land-use types and air pollutants. For all stations used in this analysis, an increase in the area of buildings within the buffer area was correlated with higher air pollutant concentrations, regardless of the ecological functional zone. This is a result of a blocking effect, where higher buildings or a greater amount of buildings reduce air pollutant diffusion. There were significant positive correlations (p < 0.01) between built-up area and the mean annual concentrations of PM10, PM2.5, SO2, and NO2 in 2016, with correlation coefficients of 0.546, 0.758, 0.621, and 0.650, respectively (Figure 7).
In contrast, green land area was significantly negatively correlated with air pollutant concentrations (p < 0.01 for all four pollutants), meaning that green land can reduce air pollution to some extent. This is a product of the capacity of plants to absorb air pollutants. The concentrations of air pollutants measured at SLR, located in Z5, were the lowest among all 11 environmental monitoring stations, providing a clear example of this relationship.

4. Conclusions

We categorized 11 environmental monitoring stations into five ecological functional types (zones): mixed commercial–residential (Z1), residential (Z2), cultural (Z3), industrial (Z4), and natural reserve (Z5). Then, we compared hourly, seasonal, and annual concentrations of PM2.5, PM10, SO2, and NO2 from 1 January 2016 to 31 November 2017, for all five zones. We further determined the relationships between these four air pollutants with meteorological elements and land-use types.
Four of the five zones contained sources of anthropogenic emissions. Among these, the temporal variations in the four air pollutants were similar; however, Z5, which did not contain an emission source, displayed some contrary trends. PM10 and PM2.5 concentrations were highest in Z4, and SO2 and NO2 concentrations were highest in Z2. The lowest observed values for all pollutants were found in Z5. Morning rush hour was associated with peaks in all four pollutants, and lows were observed around 16:00. Pollutant concentrations were typically highest in winter and lowest in summer. Mean annual concentrations of PM2.5, PM10, and SO2 decreased from 2016 to 2017, while NO2 increased. We suggest that the atmospheric conditions in Shenyang are improving annually in both developed areas and within reserve zones.
Visibility was exponentially and negatively related with PM10, PM2.5, and NO2, as was wind speed, albeit to a weaker degree. Visibility and SO2 had a linear relationship. Binomial relationships were observed between relative humidity and air pollutants. Government policy has had a significant influence on preventing and controlling air pollution. On a small scale, land-use type also has an important role in the diffusion and transportation of pollutants.
Based on the daily fluctuations in air pollutant concentrations, we suggest that morning and evening exercise may lead to greater pollutant inhalation, which may be unfavorable to human health. Therefore, we propose that 16:00 is the best time to exercise in Shenyang. Future city planning may impact air quality at local scales by increasing the amount of green space within urban areas, and by reducing the height and density of large buildings in urban areas.

Author Contributions

Conceptualization, L.L. and Y.M.; methodology, L.L. and Z.Z.; software, L.L. and H.W.; validation, L.L. and X.L.; formal analysis, L.L., X.L. and Y.M.; investigation, L.L., X.L. and Y.W.; resources, L.L., N.L. and Y.W.; data curation, L.L. and H.W.; writing—original draft preparation, L.L.; writing—review and editing, L.L., Z.Z., H.W., X.L., Y.W., N.L. and Y.M.; project administration, L.L. and Y.M. All authors have read and agreed to the published version of the manuscript.

Funding

This research was funded by the Key Project of the National Natural Science Foundation of China (grant number: 41730647).

Acknowledgments

We express our gratitude to the Shenyang Environmental Monitoring Center for providing us with air quality monitoring data. The English in this document has been checked by two professional editors, both native speakers of English.

Conflicts of Interest

The authors declare no conflict of interest.

References

  1. Adachi, K.; Tainosho, Y. Characterization of heavy metal particles embedded in tire dust. Environ. Int. 2004, 30(8), 1009–1017. [Google Scholar] [CrossRef] [PubMed]
  2. Kampa, M.; Castanas, E. Human health effects of air pollution. Environ. Pollut. 2008, 151(2), 362–367. [Google Scholar] [CrossRef] [PubMed]
  3. Richardson, E.A.; Pearce, J.; Tunstall, H.; Mitchell, R.; Shortt, N.K. Particulate air pollution and health inequalities: A Europe-wide ecological analysis. Int. J. Health Geogr. 2013, 12, 1–10. [Google Scholar] [CrossRef] [PubMed] [Green Version]
  4. Chen, J.; Zhao, C.S.; Ma, N.; Liu, P.F.; Göbel, T.; Hallbauer, E.; Deng, Z.Z.; Ran, L.; Xu, W.Y.; Liu, H.J.; et al. A parameterization of low visibilities for hazy days in the North China Plain. Atmos. Chem. Phys. 2012, 12(11), 4935–4950. [Google Scholar] [CrossRef] [Green Version]
  5. Fan, G.F.; Ma, H.; Zhang, X.W.; Liu, Y. Impacts of relative humidity and PM2.5 concentration on atmospheric visibility: A comparative study of hourly observations of multiple stations. Acta Meteor. Sinica. 2016, 74(6), 959–973. [Google Scholar]
  6. Liu, Z.; Hu, B.; Wang, L.; Wu, F.; Gao, W.; Wang, Y. Seasonal and diurnal variation in particulate matter (PM10 and PM2.5) at an urban site of Beijing: Analyses from a 9-year study. Environ. Sci. Pollut. R. 2015, 22(1), 627–642. [Google Scholar] [CrossRef]
  7. Yu, M.F.; Zhu, Y.; Lin, C.J.; Wang, S.X.; Xing, J.; Jang, C.; Huang, J.Z.; Huang, J.Y.; Jin, J.B.; Yu, L. Effects of pollution control measures on air quality improvement in Guangzhou, China. J. Environ. Man. 2019, 244, 127–137. [Google Scholar] [CrossRef] [PubMed]
  8. He, B.-J. Potentials of meteorological characteristics and synoptic conditions to mitigate urban heat island effects. Urban Clim. 2018, 24, 26–33. [Google Scholar] [CrossRef]
  9. Huang, J.; Wang, T.; Wang, W.; Li, Z.Q.; Yan, H.R. Climate effects of dust aerosols over East Asian arid and semiarid regions. J. Geophys. Res. 2014, 119(19), 11398–11416. [Google Scholar] [CrossRef]
  10. Bapna, M. Toward an environmentally sustainable future: Country environmental analysis of the People’s Republic of China. The Asian Development Bank: Manila, Philippines, 2012. [Google Scholar]
  11. Zheng, S.; Wang, M.; Wang, S.; Tao, Y.; Shang, K. Short-term effects of gaseous pollutants and particulate matter on daily hospital admissions for cardio-cerebrovascular disease in Lanzhou: Evidence from a heavily polluted city in China. Inter. J. Environ. Res. Public Health 2013, 10(2), 462–477. [Google Scholar] [CrossRef]
  12. Chai, F.H.; Gao, J.; Chen, Z.X.; Wang, S.L. Spatial and temporal variation of particulate matter and gaseous pollutants in 26 cities in China. J. Environ. Sci. 2014, 26, 75–82. [Google Scholar] [CrossRef]
  13. Chen, Y.; Xie, S. Characteristics and formation mechanism of a heavy air pollution episode caused by biomass burning in Chengdu, southwest China. Sci. Total Environ. 2014, 473–474, 507–517. [Google Scholar] [CrossRef] [PubMed]
  14. Zhao, S.P.; Yu, Y.; Yin, D.Y.; He, J.J.; Qu, J.J.; Xiao, J.H. Annual and diurnal variations of gaseous and particulate pollutants in 31 provincial capital cities based on in situ air quality monitoring data from China National Environmental Monitoring Center. Environ. Int. 2016, 86, 92–106. [Google Scholar] [CrossRef] [PubMed]
  15. Lv, B.L.; Cai, J.; Xu, B.; Bai, Y. Understanding the rising phase of the PM2.5 concentration evolution in large China cities. Sci. Rep. 2017, 7, 46456. [Google Scholar] [CrossRef]
  16. Wang, Y.Q.; Zhang, X.Y.; Sun, J.Y.; Zhang, X.C.; Che, H.Z.; Li, Y. Spatial and temporal variations of the concentrations of PM10, PM2.5 and PM1.0 in China. Atmos. Chem. Phys. 2015, 15, 13585–13598. [Google Scholar] [CrossRef] [Green Version]
  17. Zhang, Y.L.; Cao, F. Fine particulate matter (PM2.5) in China at a city level. Sci. Rep. 2015, 5, 14884. [Google Scholar] [CrossRef] [Green Version]
  18. Zhang, H.; Wang, Y.; Hu, J.; Ying, Q.; Hu, X.M. Relationships between meteorological parameters and criteria air pollutants in three megacities in China. Environ. Res. 2015, 140, 242–254. [Google Scholar] [CrossRef]
  19. Kota, H.S.; Guo, H.; Myllyvirta, L.; Hu, J.; Sahu, S.K.; Garage, R.; Ying, Q.; Gao, A.; Dahiya, S.; Wang, Y.; et al. Year-long simulation of gaseous and air particulate in India. Atmos. Environ. 2018, 180, 244–255. [Google Scholar] [CrossRef]
  20. Meng, X.Y.; Wu, Y.P.; Pan, Z.H.; Wang, H.; Yin, G.; Zhao, H.G. Seasonal characteristics and particle-size distributions of particulate air pollutants in Urumqi. Int. J. Environ. Res. Pubic Health 2019, 16(3), 396. [Google Scholar] [CrossRef] [Green Version]
  21. Zhao, H.; Che, H.; Zhang, X.; Ma, Y.; Wang, Y.; Wang, H.; Wang, Y. Characteristics of visibility and particulate matter (PM) in an urban area of Northeast China. Atmos. Pollut. Res. 2013, 4(4), 427–434. [Google Scholar] [CrossRef] [Green Version]
  22. Bhaskar, B.V.; Mehta, V.M. Atmospheric particulate pollutants and their relationship with meteorology in Ahmedabad. Aerosol Air Qual. Res. 2010, 10(4), 301–315. [Google Scholar] [CrossRef] [Green Version]
  23. Cheng, Y.; He, K.B.; Du, Z.Y.; Zheng, M.; Duan, F.K.; Ma, Y.L. Humidity plays an important role in the PM2.5 pollution in Beijing. Environ. Pollut. 2015, 197, 68–75. [Google Scholar] [CrossRef] [PubMed]
  24. Fallmann, J.; Forkel, R.; Emeis, S. Secondary effects of urban heat island mitigation measures on air quality. Atmos. Environ. 2016, 125, 199–211. [Google Scholar] [CrossRef] [Green Version]
  25. Malek, E.; Davis, T.; Martin, R.S.; Silva, P.J. Meteorological and environmental aspects of one of the worst national air pollution episodes (January, 2004) in Logan, Cache Valley, Utah, USA. Atmos. Res. 2006, 79, 108–122. [Google Scholar] [CrossRef]
  26. Ulpiani, G. On the linkage between urban heat island and urban pollution island: Three-decade literature review towards a conceptual framework. Sci. Total Environ. 2020. [Google Scholar] [CrossRef]
  27. Romero, H.; Ihl, M.; Rivera, A.; Zalazar, P.; Azocar, P. Rapid urban growth, land-use changes and air pollution in Santiago, Chile. Atmos. Environ. 1999, 33, 4039–4047. [Google Scholar] [CrossRef]
  28. Feizizadeh, B.; Blaschke, T. Examining urban heat island relations to land use and air pollution: Multiple endmemeber spectral mixture analysis or thermal remote sensing. IEEE J. Sel. Top. Appl. Earth Obs. Remote Sens. 2013, 6(3), 1749–1756. [Google Scholar] [CrossRef]
  29. Li, X.L.; Ma, Y.J.; Wang, Y.F.; Liu, N.W.; Hong, Y. Temporal and spatial analyses of particulate matter (PM10 and PM2.5) and its relationship with meteorological parameters over an urban city in northeast China. Atmos. Res. 2017, 198, 185–193. [Google Scholar] [CrossRef]
  30. Rendón, A.M.; Salazar, J.F.; Palacio, C.A.; Wirth, V.; Brötz, B. Effects of urbanization on the temperature inversion breakup in a mountain valley with implications for air quality. J. Appl. Meteorol. Climatol. 2014, 53, 840–858. [Google Scholar]
  31. Rendón, A.M.; Salazar, J.F.; Palacio, C.A.; Wirth, V. Temperature inversion breakup with impacts on air quality in urban valleys influenced by topographic shading. J. Appl. Meteorol. Climatol. 2015, 54, 302–321. [Google Scholar]
  32. Ma, Y.J.; Wang, Y.F.; Liu, N.W.; Hong, Y. Analysis of inhalable particulate matter: PM10 and PM2.5 pollution levels in grouped cities of central Liaoning province. China Power Sci. Techn. 2010, 16, 9–13. [Google Scholar]
  33. Zhao, H.J.; Che, H.Z.; Ma, Y.J.; Xia, X.G.; Wang, Y.F.; Wang, P.; Wu, X.C. Temporal variability of the visibility, particulate matter mass concentration and aerosol optical properties over an urban site in Northeast China. Atmos. Res. 2015, 166, 204–212. [Google Scholar] [CrossRef]
  34. Li, L.G.; Zhou, D.P.; Wang, Y.F.; Hong, Y.; Cui, J.; Jiang, P. An observational study of atmospheric ice nuclei number concentration during three fog-haze weather periods in Shenyang, northeastern China. Atmos. Res. 2017, 188(5), 11–19. [Google Scholar] [CrossRef]
  35. Tao, Z.H.; Xie, S.Q.; He, W.N.; Yu, B.B.; Fang, C.; Ge, L.L.; Li, W.; Wang, Q.L.; Wang, X.Q. Pollution characteristics of PM2.5 in Taizhou, Zhejiang Province. J. Zhejiang Univ. 2017, 44(4), 464–471. [Google Scholar]
  36. Feng, W.F.; Zhou, J.L.; Zhang, J.S.; Shan, Y.X.; Li, Y.F.; Zhang, Y.H. PM10 and PM2.5 pollution characteristics in different ecological function zones in Xinyang. J. Northwest For. Univ. 2018, 33(2), 269–275. [Google Scholar]
  37. Li, L.G.; Wang, H.B.; Zhao, Z.Q.; Cai, F.; Zhao, X.L.; Xu, S.L. Characteristics of urban heat island (UHI) source and sink areas in urban region of Shenyang. In Proceedings of the 3rd International Workshop on Earth Observation and Remote Sensing Applications, EORSA, Changsha, China, 11–14 June 2014; pp. 62–66. [Google Scholar]
  38. Zhao, Z.; Shen, L.; Li, L.; Wang, H.; He, B.J. Local climate zone classification scheme can also indicate local-scale urban ventilation performance: An evidence-based study. Atmosphere 2020, 11(8), 776. [Google Scholar] [CrossRef]
  39. He, B.-J.; Zhao, Z.Q.; Shen, L.D.; Wang, H.B.; Li, L.G. An approach to examining performances of cool/hot sources in mitigating/enhancing land surface temperature under different temperature backgrounds based on landsat 8 image. Sustain. Cities Soc. 2019, 44, 416–427. [Google Scholar] [CrossRef]
  40. Xie, X.J.; Li, J.; Wang, Z.F. Numerical simulati on of diurnal variations of the air pollutant s in winter of Lanzhou city. Clim. Environ. Res. 2010, 15(5), 695–703. [Google Scholar]
  41. Zhang, X.M. Diurnal Variationand Correlation analysis of mass concentration of PM2.5 and gaseous pollutants in a district in Guangzhou. Guangzhou Environ. Sci. 2017, 32(1), 8–11. [Google Scholar]
  42. Shi, H.Q.; Zeng, S.L.; Li, H.N. Temporal and spatial distribution characteristics and influencing meteorological factors of air pollutants in Sichuan Basin. Acta Sci. Circumstantiae 2020, 40(3), 763–778. [Google Scholar]
  43. Jia, J.; Yang, P.Q.; Jiang, H.M. Daily maximum height of the atmospheric boundary layer and its response to air quality over Urumqi city. J. Meteorol. Environ. 2019, 35(2), 55–60. [Google Scholar]
  44. Wang, S.X.; Hao, J.X. Air quality management in China: Issues, challenges, and options. J. Environ. Sci. 2012, 24(1), 2–13. [Google Scholar] [CrossRef]
  45. Chen, Z.; Cai, J.; Gao, B.; Xu, B.; Dai, S.; He, B.; Xie, X. Detecting the causality influence of individual meteorological factors on local PM2.5 concentration in the Jing-Jin-Ji region. Sci. Rep. 2017, 7, 40735. [Google Scholar] [CrossRef] [PubMed] [Green Version]
  46. Luan, T.; Guo, X.L.; Guo, L.J.; Zhang, T.H. Quantifying the relationship between PM2.5 concentration, visibility and planetary boundary layer height for long-lasting haze and fog-haze mixed events in Beijing. Atmos. Chem. Phys. 2018, 18(1), 203–225. [Google Scholar] [CrossRef] [Green Version]
  47. Zhang, B.; Jiao, L.M.; Xu, G.; Zhao, S.L.; Tang, X.; Zhou, Y.; Gong, C. Influences of wind and precipitation on different-sized particulate matter concentrations (PM2.5, PM10, PM2.5–10). Meteorol. Atmos. Phys. 2018, 130(3), 383–392. [Google Scholar] [CrossRef]
  48. Zhang, G.; He, B.J.; Dewancker, B.J. The maintenance of prefabricated green roofs for preserving cooling performance: A field measurement in the subtropical city of Hangzhou, China. Sustain. Cities Soc. 2020, 61, 102314. [Google Scholar] [CrossRef]
  49. Wang, X.; Zhang, R.; Yu, W. The effects of PM2.5 concentrations and relative humidity on atmospheric visibility in Beijing. J. Geophys. Res. 2019, 124(4), 2235–2259. [Google Scholar] [CrossRef]
  50. Junk, J.; Helbig, A.; Luers, J. Urban climate and air quality in Trier Germany. Int. J. Biometeorol. 2003, 47, 230–238. [Google Scholar] [CrossRef]
Figure 1. Locations of the 11 environmental monitoring stations and one weather station in the study area.
Atmosphere 11 01070 g001
Figure 2. Average hourly concentrations of (a) PM2.5 in 2016, (b) PM2.5 in 2017, (c) PM10 in 2016, (d) PM10 in 2017, (e) SO2 in 2016, (f) SO2 in 2017, (g) NO2 in 2016, and (h) NO2 in 2017 in five ecological functional zones in Shenyang.
Atmosphere 11 01070 g002
Figure 3. Mean (± SE) seasonal concentrations of (a) PM2.5, (b) PM10, (c) SO2, and (d) NO2 in five ecological functional zones in Shenyang from January 2016 to December 2017.
Atmosphere 11 01070 g003
Figure 4. Hourly and season variation in concentrations of (a) PM2.5 in 2016, (b) PM2.5 in 2017, (c) PM10 in 2016, (d) PM10 in 2017, (e) SO2 in 2016, (f) SO2 in 2017, (g) NO2 in 2016, and (h) NO2 in 2017 across four seasons and five ecological functional zones in Shenyang from January 2016 to December 2017.
Atmosphere 11 01070 g004aAtmosphere 11 01070 g004b
Figure 5. Scatter plots of mean daily (a) PM10, (b) PM2.5, (c) SO2, (d) NO2, and (e) PM (PM10 and PM2.5) concentrations and visibility recorded at the Hunnandonglu meteorological station in Shenyang from 1 January 2016 to 31 December 2017.
Atmosphere 11 01070 g005
Figure 6. Land-use types surrounding 10 environmental monitoring stations in Shenyang. All buffer areas had a radius of 3 km.
Atmosphere 11 01070 g006
Figure 7. Scatter pots of mean annual concentrations of (a) PM10, (b) PM2.5, (c) SO2, and (d) NO2, and the amount of area covered by buildings in a 3-km-radius buffer, and (e) PM10, (f) PM2.5, (g) SO2, and (h) NO2, and the amount of area covered by green land (i.e., grassland or cropland), for 10 environmental monitoring stations in Shenyang.
Atmosphere 11 01070 g007aAtmosphere 11 01070 g007b
Table 1. Eleven air quality monitoring sites in Shenyang, Liaoning Province. Height refers to the height of the sampling port from the ground. The number in the brackets is the percentage of land use area within 3 km buffer.
NumberName (abb.)Height (m)Main Land use Types and Typical Feature Sites within 3 km BufferEcological Functional Zone (abb.)
Main Land Use TypesCommercial BlockIndustrial ParkLocal UniversitiesConcentrated Residential BlocksNatural Reserve
1Taiyuanjie (TYS)10Buildings (69%) Residential–commercial zone (Z1)
2Xiaoheyan (XHY)10Buildings (76%) Residential zone (Z2)
3Wenhualu (WHR)20Buildings (54%) Residential zone (Z2)
4Lingdongjie (LDS)10Buildings (66%), green land (19%) Cultural zone (Z3)
5Senlinlu (SLR)5Green land (99%) Natural reserve zone (Z5)
6Donglinglu (DLR)10Buildings (26%), green land (35%) Cultural zone (Z3)
7Xinxiujie (XXS)20Buildings (53%) Industrial zone (Z4)
8Jingshenjie (JSS)20Buildings (49%), green land (15%) Residential–commercial zone (Z1)
9Hunnandonglu (HNDR)20Buildings (45%), green land (12%) Residential–commercial zone (Z1)
10Shenliaoxilu (SLXR)20Buildings (66%) Industrial zone (Z4)
11Yunonglu (YNR)6Green land (52%) Cultural zone (Z3)
Table 2. Mean (±SE) annual concentrations of four major air pollutants among five ecological functional zones in Shenyang from January 2016 to December 2017. Concentrations are shown in µg·m−3.
PollutantYearZ1Z2Z3Z4Z5
PM2.5201653.37 ± 7.7153.31 ± 7.9051.97 ± 8.7754.55 ± 9.0843.71 ± 5.72
201750.64 ± 8.7650.86 ± 8.2846.43 ± 8.9654.40 ± 11.4738.57 ± 6.99
PM10201690.51 ± 9.8794.07 ± 13.3486.65 ± 12.5198.84 ± 13.0670.59 ± 8.83
201786.31 ± 10.5188.35 ± 12.1580.27 ± 11.5393.34 ± 15.1864.85 ± 10.23
SO2201636.11 ± 5.6241.35 ± 6.0534.00 ± 7.0035.90 ± 9.2016.83 ± 3.23
201730.98 ± 6.0333.53 ± 6.8829.85 ± 5.6130.57 ± 7.8316.64 ± 3.32
NO2201641.27 ± 8.6743.26 ± 8.4939.26 ± 7.2536.85 ± 8.7124.92 ± 3.75
201742.24 ± 9.2344.33 ± 8.7436.88 ± 8.8238.77 ± 8.5926.23 ± 5.29
Table 3. Correlation coefficients (R) of the relationships between four major air pollutants and three meteorological elements (n = 731).
Correlation Coefficient PM2.5PM10SO2NO2
Wind speed0.234 0.061 0.166 0.512
Visibility0.675 0.579 0.475 0.477
Relative humidity0.202 0.189 0.307 0.236

